UNIVERSITÀ DEGLI STUDI DELLA TUSCIA
Dipartimento di Scienze dell’Ambiente Forestale e delle sue Risorse
C
ORSO DID
OTTORATO DIR
ICERCAECOLOGIA FORESTALE XVIII CICLO
M
M
o
o
l
l
e
e
c
c
u
u
l
l
a
a
r
r
a
a
p
p
p
p
r
r
o
o
a
a
c
c
h
h
t
t
o
o
d
d
i
i
s
s
s
s
e
e
c
c
t
t
a
a
d
d
a
a
p
p
t
t
i
i
v
v
e
e
t
t
r
r
a
a
i
i
t
t
s
s
i
i
n
n
n
n
a
a
t
t
i
i
v
v
e
e
E
E
u
u
r
r
o
o
p
p
e
e
a
a
n
n
P
P
o
o
p
p
u
u
l
l
u
u
s
s
n
n
i
i
g
g
r
r
a
a
L
L
.
.
:
:
c
c
o
o
n
n
s
s
t
t
r
r
u
u
c
c
t
t
i
i
o
o
n
n
o
o
f
f
a
a
g
g
e
e
n
n
e
e
t
t
i
i
c
c
l
l
i
i
n
n
k
k
a
a
g
g
e
e
m
m
a
a
p
p
b
b
a
a
s
s
e
e
d
d
o
o
n
n
A
A
F
F
L
L
P
P
,
,
S
S
S
S
R
R
,
,
a
a
n
n
d
d
S
S
N
N
P
P
m
m
a
a
r
r
k
k
e
e
r
r
s
s
S.S.D.
AGR
05
COORDINATORE:
P
ROF.
P
AOLO DEA
NGELISTUTORI:
P
ROF.
G
IUSEPPES
CARASCIAM
UGNOZZAD
R.
M
AURIZIOS
ABATTID
R.
V
ÉRONIQUEJ
ORGEA
á
Jocelyne, Joël
á
Lucienne, Erwin
á
Martine, Marlène, Léa
Acknowledgments - Ringraziamenti - Remerciements
U At the end of this research work, which I have carried out at the Department of Forest Environment
and Resources (Di.S.A.F.Ri) in University of Tuscia, I would like to acknowledge Riccardo Valentini,
department director, and Giuseppe Scarascia Mugnozza, scientific responsible for Viterbo’s operative unit
within POPYOMICS program.
U I acknowledge all the research teams involved in E.U. program POPYOMICS.
U I thank Gerald A. Tuskan and Stephan P. DiFazio (Oak Ridge National Laboratory, U.S.A.), Michele
Morgante, and Giusi Zaina, (University of Udine) for exchanging data and information useful for
molecular analyses and discussion of results.
U Ringrazio Maurizio Sabatti per la sua disponibilità, la sua simpatia e per le pause tè e le discussioni alla
macchinetta del caffè.
U Ringrazio Paolo de Angelis per i consigli e l’aiuto nella risoluzione di tanti piccoli problemi informatici e
amministrativi.
U Ringrazio i colleghi del dipartimento DISAFRI per la loro piacevole compagnia, in particolare Isabella
Paolucci per la sua collaborazione e il suo aiuto.
U Ringrazio i colleghi del CNR IBAF di Porano: Daniela Taurchini, Marcello Cherubini, Claudia
Mattioni e Fiorella Villani per la loro accoglienza e simpatia che hanno reso il periodo di lavoro al
sequenziatore molto piacevole.
U Ringrazio Francesco Salani per le sue discussioni in francese e per i sui “software génials” e Luca
Ricciotti per la collaborazione scientifica e le avventurose missioni svolte insieme.
U Ringrazio Giulia Fara per il suo ottimo lavoro sugli SNPs e la sua amicizia.
U Ringrazio Moica Piazzai e Paola Pollegioni per la loro gentilezza e le piacevoli serate passate insieme.
U Ringrazio tutti i nuovi amici italiani per i gradevoli momenti passati insieme.
U Un très grand merci à Véronique Jorge (INRA Orléans, France) pour son aide précieuse lors de
l’élaboration des données et pour sa sympathie qui m’ont été d’un grand soutien tout au long de cette thèse.
Je remercie également Catherine Bastien (INRA Orléans, France) pour sa disponibilité et ses conseils.
U Merci à Nathalie Boizot pour sa tasse de thé toujours prête qui a été bien appréciable lors des mesures
des plantes au mois de Décembre. Et surtout je profite de cette occasion pour la remercier, avec son mari,
pour leur amitié.
U La fin de ce travail a été aussi l’occasion d’un bilan sur mon parcours et je voudrais remercier Christian
Breton, Christian Jay-Allemand, Philippe Label et Jean-Paul Charpentier pour leur initiation au travail de
recherche, leur formation aux techniques de biologie moléculaire et biochimie, et les entraînements aux
présentations orales, qui se sont avérés très utile pour la réalisation de cette thèse.
U Une pensée particulière pour Anne-Laure Ponsonaille, toujours présente quelques soit la distance.
U Ringrazio profondamente Bruna e Abbramo per tutto.
UMerci :
« Il a les yeux presque aussi clairs
Que les murs blancs du fond de l’Espagne
Un jour je bâtirai un empire
Avec tous nos instant de plaisirs
Pour que plus rien ne m’éloigne
Du garçon qui m’accompagne »
Table of content
Table of content... 1 List of Figures... 4 List of Tables... 6 List of abbreviations... 8 Introduction... 101 State of the art...13
1.1 The Black poplar...13
1.1.1 Taxonomy and distribution of black poplar... 13
1.1.1.1 Taxonomy... 13
1.1.1.2 Distribution... 14
1.1.2 Biology and ecology... 15
1.1.3 Importance and uses... 18
1.1.3.1 Economic importance of Populus nigra... 18
1.1.3.2 Environmental interest of Populus nigra...21
1.2 Genetic mapping...24
1.2.1 Introduction ... 24
1.2.2 Principle of genetic mapping... 26
1.2.2.1 Pedigrees used for genetic mapping in plants... 27
1.2.2.2 Markers used for genetic mapping... 29
1.2.2.3 Steps of mapping construction and software... 34
1.2.2.4 Genome length estimation... 36
1.2.3 Interest of genetic maps for genome comparison...38
1.2.3.1 Markers useful for comparative mapping ...38
1.2.3.2 Example of comparative genetic mapping... 39
1.2.4 Interest of genetic maps for biodiversity studies... 40
1.2.5 Interest of genetic maps for breeding programs... 41
1.2.6 Genetic mapping of forest trees... 41
1.2.7 Genetic mapping of poplar...45
2 Materials and Methods...51
2.1.2 Plant characteristics... 52
2.2 Molecular analyses...53
2.2.1 DNA extraction and quantification... 53
2.2.2 AFLP analysis and marker nomenclature...55
2.2.2 SSR analysis and nomenclature ... 59
2.2.4 SNP analysis... 61
2.3 Mapping methods...64
2.3.1 Software... 64
2.3.2 Map construction... 65
2.3.2.1 Test of the Mendelian segregation... 65
2.3.2.2 Linkage groups detection ... 65
2.3.2.3 Ordering markers in the linkage groups and distance estimation...65
2.3.3 Estimation of the genome length... 66
2.3.4 Marker distribution analysis...66
2.4 Alignment of maps...67
3 Results...69
3.1 Marker analyses...69
3.1.1 Analysis of AFLP markers... 69
3.1.2 Analysis of SSR and SNP markers... 70
3.1.3 Sex morphological trait... 73
3.2 Linkage map construction...74
3.2.1 Linkage analysis... 74
3.2.1.1 Linkage analysis of the female data... 75
3.2.1.2 Linkage analysis of the male data... 75
3.2.2 Estimated and observed genome length... 82
3.2.3 Segregation distortion... 83
3.2.4 Marker distribution... 85
3.3 Map comparisons...89
3.3.1 Comparison between the two parental maps... 89
3.3.2 Alignment with the Populus trichocarpa physical map...89
3.3.2.1 Comparison between Populus trichocarpa and Populus nigra maps ...89
3.3.2.2 Correlation between genetic and physical length ... 94
3.3.3 Comparison between Populus alba and Populus nigra maps... 95
4 Discussion...98
4.1 Mapping pedigree...98
4.1.1 Intra-specific cross... 98
4.1.2 Populus deltoides introgression... 98
4.2 Marker analysis...99 4.2.1 AFLP markers... 99 4.2.2 SSR markers... 99 4.2.3 SNP markers... 100 4.2.4 Gene mapping... 101 4.2.4.1 Phytochrome genes ... 101
4.2.4.2 AGAMOUS orthologous in poplar...101
4.2.4.3 IAA genes... 102
4.2.5 Sex morphological trait... 102
4.3 Linkage map characteristics...104
4.3.1 Linkage maps... 104
4.3.2 Genome length... 106
4.3.3 Marker distribution... 107
4.3.4 Segregation distortion... 108
4.4 Comparative mapping...110
4.4.1 Populus nigra parental maps and Populus trichocarpa physical map...111
4.4.2 Comparison among Populus nigra, Populus alba and Populus trichocarpa maps...113
5 Conclusions and Perspectives...115
5.1 Genetic mapping...115
5.2 Applications of comparative mapping...116
5.3 QTL mapping...116
5.4 An application of the Populus genome knowledge: marker-assisted selection...117
Bibliographic references... 120
Appendix 1... 132
A. Description of the available SSR... 132
B. SSR analyzed on the F1... 143
Appendix 2... 147
A. Common markers between Populus nigra and Populus alba maps... 147
List of Figures
Fig. 1: Distribution range of European P. nigra ... 14
Fig. 2: Illustration of the alluvial area structure.[online web]... 15
Fig. 3: Picture of Populus nigra L and Populus nigra var. italica at different seasons. [online: web]...15
Fig. 4: P. nigra bark at old age. [online: web]... 16
Fig. 5: Photo of P. nigra leaves [online: web]... 16
Fig. 6: Picture of P. nigra leaves, catkins, flowers, and seeds. [online: web]...17
Fig. 7: Crossability of Populus species from Zsuffa (1975)... 19
Fig. 8: The Italian breeding program for poplar... 20
Fig. 9: The Visible Genetic Map of Human Chromosome 11. [online: web]... 24
Fig. 10: Scheme of PCR reaction. [online: web]...25
Fig. 11: Photo of a sequencer. [online: web]... 26
Fig. 12: Scheme of gamete formation with and without crossing-over. [online: web]... 26
Fig. 13: Example of cross used for mapping population and genotype of gametes formed during F1 individual meiosis... 27
Fig. 14: Description of RFLP technique. [oneline web]... 30
Fig. 15: Description of RAPD technique. [online web]... 30
Fig. 16: Description of AFLP technique... 31
Fig. 17: Description of SSR technique... 32
Fig. 18: Description of SNP [online web]...33
Fig. 19: Definition of homology relationship among markers after speciation and duplication... 38
Fig. 20: Genotypic configuration observed in heterozygote crosses, modified from Lespinasse (1999) ... 43
Fig. 21:Example of segregation data codification for the pseudo-testcross strategy, modified from Lespinasse (1999)... 44
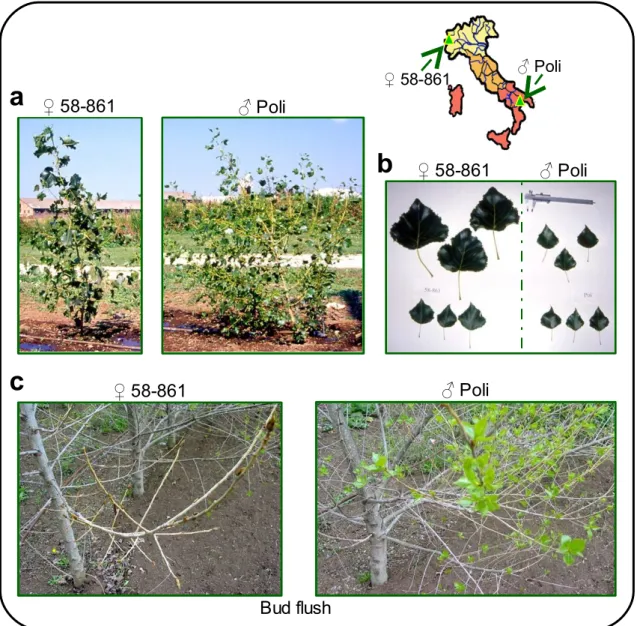
Fig. 22: Provenance of the 2 P. nigra parents used to obtain the intra-specific controlled cross for mapping activity... 51
Fig. 23: Characteristics of the parents of the P. nigra intra-specific cross... 52
Fig. 24: Direct estimation of DNA concentration on agarose gel... 54
Fig. 25: Description of the M13-tailed primer method...60
Fig. 26: Description of CAPS and dCAPS method... 62
Fig. 28:. SSR screening results on the 2 parents and 6 F1 progenies... 70
Fig. 29: Results of the screening with SSR markers... 71
Fig. 30: Amplification pattern of Win3 marker... 72
Fig. 31: Example of genotyping of 2 SNP markers... 73
Fig. 32: Linkage maps of the P. nigra pedigree... 77
Fig. 33: Distorted region on linkage groups... 84
Fig. 34: Alignment of the P. trichocarpa and P. nigra maps... 90
Fig. 35: Correlation and ratio between the genetic length and physical length... 94
Fig. 36: Example of the coalignment of 6 maps for 3 linkage groups...96
Fig. 37: The Populus genome duplications...112
Fig. 38: An integrated view of exploitation of genomic resources for plant improvement via different genetic and genomic strategies. From Varshney et al. (2005)... 119
List of Tables
Table 1: Classification of Populus species in sections (Eckenwalder, 1996)...13
Table 2: Physical and genetic genome length of 15 plants species from Chagné et al. (2002)... 37
Table 3: Overview of the Populus genetic linkage maps. Modified from Cervera et al. (2004)...46
Table 4: Main traits measured in two locations on the P. nigra parents used to obtain the mapping pedigree... 53
Table 5: PCR mix (A) and thermal program (B) for Win3... 54
Table 6: PCR mix (A) and thermal program (B) for the preselective AFLP amplification reactions. ... 55
Table 7: PCR mix for the selective AFLP amplification reaction. ... 56
Table 8: Thermal program for the selective AFLP amplification reaction with touchdown... 56
Table 9: sequence and nomenclature of the 40 primer combinations used for the AFLP analyses. ... 58
Table 10: PCR mix (A) and thermal program (B) for SSR analysis...59
Table 11: PCR mix(A) and thermal program (B) for SSR analysis with the M13-tailed primer method... 61
Table 12: PCR mix (A) and thermal program (B) for SNP analysis...63
Table 13: Sequences and annealing temperature of the SNP primers... 63
Table 14: SNP characteristics...64
Table 15: Number of SSR tested, segregating and mapped in the P. nigra pedigree... 70
Table 16: Results of alignment using BLASTX. ... 71
Table 17: Genotyping of the mapping pedigree parents with 4 SSR markers able to detect P. deltoides-specific alleles... 72
Table 18: Presentation of the results obtained for each type of marker...74
Table 19: Female linkage map data... 76
Table 20: Male linkage map data... 77
Table 21: Observed and estimated genome length of the 2 parental maps... 82
Table 22: Distribution of distorted markers in P. nigra maps... 83
Table 23: Marker density by linkage group for the female map... 85
Table 24: Marker density by linkage group for the male map... 86
Table 25: Clustered and dispersed regions on each linkage group in the female map... 87
Table 27: Common markers of the P. nigra parental maps by linkage groups... 89
Table 28: Common markers with the P. trichocarpa physical map for the 2 P. nigra parental maps ... 90
List of abbreviations
AB-QTL Advanced Backcross QTL
AFLP Amplified Fragment Length Polymorphism
AG AGAMOUS
AS-PCR Allele Specific-PCR
BAC Bacterial Artificial Chromosome
BC Backcross
BLAST Basic Local Alignment Search Tool
bp base pairs
CAPS Cleaved Amplified Polymorphic Sequence cDNA complementary DNA
cM centi Morgan
COS Conserved Orthologous Set
dCAPS derived Cleaved Amplified Polymorphic Sequence DNA Deoxyribonucleic Acid
dNTP deoxynucleoside Triphosphate DOE Department Of Energy
eQTL expression QTL
EST Expressed Sequence Tag IAA Indol Acetic Acid
ISSR Inter Simple Sequence Repeat LD Linkage Desequilibrium
LOD Log of the Odds ratio
MALDITOF Matrix-Assisted Laser Desorption/Ionization Time-Of-Flight MAS Marker-Assisted Selection
PhyA Phytochrome A PhyB Phytochrome B
PTAG Populus trichocarpa AGAMOUS QTL Quantitative Trait Loci
RAPD Random Amplified Polymorphic DNA RFLP Restriction Fragment Length Polymorphism RIL Recombinant Inbred Lines
SCAR Sequence-Characterized Amplified Region SNP Single Nucleotide Polymorphism
SSR Simple Sequence Repeat STS Sequence Tagged Site
TILLING Target Induced Local Lesions In Genome Tm melting Temperature
Introduction
Trees are used to produce a variety of wood-based products including timber, pulp, and paper. More recently, their use as source of renewable energy has also been highlighted, as has their value for carbon mitigation within the Kyoto Protocol. The domestication of trees has only just begun in comparison to food crops; the long generation time and complex nature of juvenile and mature phase are contributory factors. To accelerate the domestication process and to further understand some of the unique processes that occur in woody plants, such as dormancy and secondary wood formation, a “model” tree is needed (Taylor, 2002). The genus Populus was accepted as a model for trees because it has a relatively small genome, about 550 million base pairs, which is similar to rice, only 4× larger than Arabidopsis, and one fortieth the size of the Pinus genome. Other important attributes and resources include: worldwide distribution of multiple species; high growth rates; ease of clonal propagation; availability of genetic maps and structured pedigrees; publicly accessible molecular markers, gene sequences, bacterial artificial chromosome (BAC) libraries; high-throughput plant transformation and regeneration capabilities (Wullschleger et al., 2002). Moreover, earlier in 2002, the United States Department of Energy (DOE) announced plans to sequence the genome of a Populus trichocarpa genotype. The project initiated in February 2002 (Wullschleger et al., 2002; Taylor, 2002) and in September 2004 the sequence was available at the website http://genome.jgi-psf.org/Poptr1/Poptr1.home.html. Finally, Populus is unique in that it will not only act as a model for all woody species, but is in itself a forest tree of considerable commercial importance, especially for its fast growth (Taylor, 2002).
In this context the POPYOMICS project (contract QLRT-2001-00953) has been funded by the Fifth Framework Program of the European Union and has started on November 2002. The project is now reaching its end (May 2006). The main aim of the POPYOMICS project is to link physiology, molecular genetics and genomics to understand and improve yield of Populus for growth across Europe as a bioenergy and timber crop. To reach this purpose, the latest techniques in genetic mapping, genomics, and the physical sequence of poplar, as available, will be used to define genes which determine yield and disease resistance in Populus. The long-term ambition of POPYOMICS is to develop methods to select new genotypes of Populus with improved potential for above and below ground carbon sequestration optimizing wood production in short rotation forestry. The work of the project has been undertaken by nine partners, from
five European countries, within five workpackages. The range of techniques and experimental approaches is large, from field trials to candidate gene discovery and microarrays. The genetic resources consist of five pedigrees representing four Populus species: P. trichocarpa, P. deltoides, P. nigra, and P. alba. They have been selected in a variety of climatic conditions, ranging from Southern, Mediterranean to the extreme Northern Europe. The selected pedigrees were replicated and maintained in three European sites: United Kingdom, France, and Italy. The main objectives of the POPYOMICS project are listed below.
• Mapping the five available pedigrees with microsatellite (SSR) markers, which are
particularly important since they are transferable among Populus species. These SSR markers may be used to link the maps and form a consensus map of Populus.
• Identifying quantitative trait loci (QTLs) and testing their robustness in contrasting genetic backgrounds. QTLs for yield traits, for disease and pest resistance are being
identified for the three sites (United Kingdom, France, and Italy). Then, the robustness of QTLs will be tested by examining genotype x environment interactions in detail.
• Detecting candidate genes by a genomic approach and mapping them in Populus.
Transcript profiling approach as well as Populus microarray approach will be used to identify candidate genes which may co-locate to QTLs.
• Studying linkage disequilibrium. A collection of black poplar genotypes will be used to
confirm the location of QTLs/candidate genes in mapping progeny.
A detailed description of the POPYOMICS project is available on the website http://www.soton.ac.uk/~popyomic/index.htm. The experimental work of this thesis was funded by the POPYOMICS project and developed within the frame of this research program.
P. nigra is a tree of social and economic interest and also of ecological importance as indicator species of riparian woodlands. It has a wide geographical distribution ranging from Central and Southern Europe to Central Asia and Northern Africa. P. nigra plays a central role in poplar breeding programs and has contributed to many successful inter-specific hybrids. During the last centuries, large areas of the natural habitat of P. nigra have been lost because of changed management of riverbanks, involving drainage, more intensive grazing, and more frequent tree felling. As a consequence, P. nigra is threatened with extinction (Arens et al., 1998; Imbert and Lefèvre, 2003; Storme et al., 2003). Currently, efforts are being made to restore the natural borders of rivers and their associated ecosystems. In softwood flooded plain forests, P. nigra is a keystone species because of its adaptation to water dynamics and sediment movement. The remaining P. nigra stands as well as the germplasm collected in gene banks could provide the
genotypes for establishing new populations of P. nigra (Storme et al., 2003). Many studies on P. nigra are carried out with traditional methods combined with modern techniques. In fact, molecular genetics is a keystone to assess the remaining genetic diversity in order to preserve and to restore the P. nigra natural populations. For an effective protection and use of the remaining P. nigra genetic resources, a better knowledge of P. nigra genome is needed.
Mapping and sequencing of plant genomes would help to elucidate gene function, gene regulation and their expression (Mohan et al., 1997). Linkage maps have been utilized for identifying chromosomal regions that contain genes controlling simple traits (controlled by a single gene) and quantitative traits using QTL analysis. The process of constructing linkage maps and conducting QTL analysis (to identify genomic regions associated with traits) is known as QTL mapping. DNA markers which are tightly linked to agronomically important genes may be used as molecular tools for marker-assisted selection (MAS) in plant breeding (Mohan et al., 1997; Collard et al., 2005). In this context, the main objectives of this study are:
• the construction of a genetic map of P. nigra from Italian natural populations
including bridge markers useful for comparing the other Populus maps and generating a Populus consensus map;
• the construction of an accurate framework map, which is efficient for the dissection
of complex traits and for studying the genetic basis of QTLs;
• the comparison of the P. nigra map obtained in this study to the Populus maps from other studies to validate the accuracy of locus ordering and analyze the structure of
Populus genome.
A P. nigra genetic map rich in SSRs leads to many perspectives. SSRs markers are ideal bridges for map comparison and direct links to genomic sequence. Moreover, genetic maps will be a powerful tool for exploring the function of candidate genes (Yin et al., 2004b). Mapping genes and QTLs may open possibilities to develop strategies for MAS.
1 State of the art
1.1The Black poplar
1.1.1 Taxonomy and distribution of black poplar
1.1.1.1 Taxonomy
Black poplar, whose botanic name is Populus nigra L. (P. nigra), is an angiosperm of the genus Populus (2n = 38) in the Aigeiros section of the Salicaceae family. Compared to the willow (Salix spp.), which belongs also to the Salicaceae family, there are relatively few species (29) of poplars but they clearly fall into a number of groups which are morphologically and ecologically quite distinct. These groups are traditionally recognized as sections. With few exceptions, there is a large consensus in the literature on the characteristics and species composition of the sections. The major barriers to hybridization in the genus lie between sections. With the description of the section Abaso to accommodate P. mexicana, the number of sections has been brought to six (Table 1). Previously, P. mexicana, which only superficially resembles the Aigeiros cottonwoods, had been placed with them (Eckenwalder, 1996).
Table 1: Classification of Populus species in sections (Eckenwalder, 1996).
s.l. (sensu lato): indicates other species which are often recognized as distinct in the literature and which might be retained as subspecies. Some other species contain additional subspecies or varieties.
Section
Abaso Turanga Leucoides Aigeiros Tacamahaca Populus
S
p
ec
ie
s
P. mexicana P. euphratica P. lasiocarpa P. nigra, s.l. P. trichocarpa P. alba P. pruinosa P. glauca, s.l. P. deltoides P. laurifolia P. tremula, s.l. P. ilicifolia P. heterophylla P. fremontii P. ciliata P. tremuloides P. szechuanica P. adenopoda P. yunnanensis P. gamblei P. suaveolens, s.l. P. sieboldii P. simonii, s.l. P. simoroa P. balsamifera P. guzmanantlensis P. angustifolia P. monticola P. grandidentata
The status of P. nigra and the relationships between the sections Aigeiros (cottonwoods) and Tacamahaca (balsam poplars) are subjected to questions. These two sections are the only ones known to be freely intercrossable. Although vegetatively and ecologically readily distinguishable, there are no clear differences in flowers and inflorescences between cottonwoods and balsam
subsections anyway (as the aspens and white poplars are in the section Populus i.e. subsections Tremulae and Albidae). The present evidence, including phylogenetic analyses, seems to favor keeping them apart, but resolution of this issue affects the placement of P. nigra. Actually, P. nigra, the type species of the section Aigeiros, is not clearly more similar to the Northern American cottonwoods placed with it in section Aigeiros than some species of the balsam poplars in the section Tacamahaca. It also has peculiar crossability relationships, successful only in one direction, with both Northern American cottonwoods and balsam poplars (Eckenwalder, 1996). To solve these dilemmas for the classification of poplar at sections and species level new researches are needed and these could lead to some evolution of the Populus spp. taxonomy.
1.1.1.2 Distribution
Populus is tropical in origin and the greatest diversity of the genus still lies far South of the boreal region. P. nigra has a large distribution area throughout Europe and is also found in Northern Africa and Central and West Asia. The distribution area extends from the Mediterranean in the South to approximately 64° latitude in the North and from the British Isles in the West to Kazakhstan and China in the East. The distribution area also includes the Caucasus and large parts of the Middle East (Fig. 1) (Vanden Broeck, 2003).
Fig. 1: Distribution range of European P. nigra
In Italy P. nigra is present from the sea level up to 1000-1200 m in the Alps and up to 1500-1600 m in the Apennines. P. nigra is an azonal species not linked to particular climatic area but being a riparian species, it is linked to the soil moisture.
1.1.2 Biology and ecology
P. nigra is a typical tree species of the alluvial forests of many European and Siberian rivers. Being heliophilous, P. nigra usually forms local populations by colonizing open areas on alluvial soils through seeds, cuttings or root fragments (Fig. 2).
Fig. 2: Illustration of the alluvial area structure.[online web]
From URL: http://www.modul-stufen-konzept.ch/seiten-e/oekomor-e.htm
Example of a river bank area with the representation of the natural riparian zones which are the P. nigra habitat. It is characterized by a great diversity of population type, from isolated trees to huge pure or mixed stands. P. nigra has a rapid growth. Individual trees may live over 400 years.
This tree has a linear habitus, its height can reach 20-25 m with a diameter up to 1 m. The trunk, very right, is easily ramified and the canopy is wide and dense with large and dispersed branches (Fig. 3).
Fig. 3: Picture of Populus nigra L and Populus nigra var. italica at different seasons. [online: web]. From URL:
http://centros.edu.xunta.es/iesaslagoas/slorenf /arb7.htm
P. nigra is represented at winter, spring and autumn season and on the right italica variety at spring and winter season.
The bark on young branches and small trunks is nearly smooth and grayish-green in color. Bark on larger trunks begins to split forming rough, fissured, dark gray patterns (Fig. 4).
Fig. 4: P. nigra bark at old age. [online: web]
From URL: http://www.lhi.org.uk/images/thumb_NE00107_Black_Poplar.jpg/
The size, shape, and character of P. nigra leaves are rather variable within a single tree (Fig. 5). The blade of juvenile leaves is usually flat but also sinuate along margins. The blade margins are shallowly often irregularly crenate. Adult leaves show a blade which is more or less similar to a rhombic form terminated by a narrow point. The upper surface of the blade is dark green shiny, dully light green underneath, glabrous, leathery and flat. The blade margin is shallowly crenate to dentate. At the end of growing season leaves are often infested by rust fungi while healthy leaves get yellow before leaf fall (Mottl and Uradnieek, 2003).
Fig. 5: Photo of P. nigra leaves [online: web]
P. nigra is a dioecious species with trees that are either male or female. They reach the reproductive stage when they are 10-15 year old, but will not begin to produce remarkable quantities of seeds until they are more than 20 year old (Braatne et al., 1996). Approximately 1-2 weeks prior to leaf initiation in the early spring (March-April), during the flood peak period along the rivers in temperate Europe, male and female trees produce flowers clustered in pendulous catkins. The catkins (<10 cm long) tend to be borne in the upper tree crown and are reddish-purple in appearance on males and slightly larger and green in females (Fig. 6). Wind-dispersed pollen landing on receptive stigma will fertilize ovule within 24 hours of arrival and the subsequent ripening and seed maturation process lasts 4-6 weeks. During this period the female catkins lengthen and swelling green fruit capsules appear along their length. Approximately 20-50 fruit capsules will ripen on each catkin producing up to 225 seeds per catkin (about 4-5 seeds per capsule). The period of seed release in P. nigra is strategically timed to coincide with the abatement of floodwaters in spring when, for a short period, ideal conditions for seed germination and seedling establishment are present. Vast quantities of seeds will also be dispersed by the river extending the period of seed dispersal by 2-3 weeks.
Fig. 6: Picture of P. nigra leaves, catkins, flowers, and seeds. [online: web]
In common with many colonizer species, P. nigra depends on the wind for pollination and is capable of vegetative regeneration. The generation of ramets is not spontaneous in this species. Asexual reproduction is promoted only by flood disturbances when through extended periods of submergence and/or mechanical damage to parent plants, dormant primordial in roots and shoots are stimulated to produce new shoots and roots (Barsoum, 2001).
P. nigra is affected at all stages of its life cycle by hydrological conditions and is reliant on them for regeneration. Seeds are disseminated through wind and water, have a short viability and need very specific soil-water conditions for germination. Successful regeneration occurs in years when soil moisture remains high enough for roots to grow down at the same rate as water recedes from the saturated waterfront, but not so high that anoxic conditions prevail. It follows that in many years, successful regeneration does not occur, and that in naturally occurring stands a strong age structure frequently exists, reflecting the history of flooding. Regeneration is generally poor within old established stands; the riparian forest naturally evolves towards hardwood formations (Vanden Broeck, 2003).
1.1.3 Importance and uses
1.1.3.1 Economic importance of Populus nigra
P. nigra is a tree of social and economic interest. It is important as a crossing parent in the production of healthy and fast-growing Populus x canadensis Moench (P. deltoides x P. nigra) hybrids which are grown widely in Europe and in other parts of the world (Vanden Broeck, 2003). It is predominantly used as a parent pool in breeding programs in many parts of the world: 63% of the poplar cultivars used in forest plantations descend from P. nigra either as a pure species or from inter-specific hybrids. In some Eastern European countries up to 50% of the production of poplar wood comes from P. nigra. In Europe a surface of about one million ha is estimated with an annual production of poplar wood in excess of ten million cubic metres which goes for a variety of uses.
• The wood of hybrid poplars is mainly used as raw material for the industries: furniture, packaging, particleboard, plywood, and matches. It is particularly favored for the manufacture of fruit boxes because the wood has no fragrance. On the other hand, P. nigra wood is used as round wood for rural construction and for the daily needs of rural people. In Turkey, there are approximately 130000 ha of poplar plantations, of which 70000 ha are hybrid poplar and 60000 ha consist of various clones of P. nigra. This species provides about 57% of Turkey’s annual poplar wood production (3.5 million cubic
metres) and more than 80% of P. nigra wood (1.75 million cubic metres) is used for domestic needs (Vanden Broeck, 2003; Toplu, 2005).
• P. nigra is used as a pure species for soil protection and afforestation in polluted industrial zones (Vanden Broeck, 2003).
Since the Kyoto Conference (1997), there has been an increasing interest about renewable energy sources and possible alternatives to fossil fuels that could contribute to a significant reduction in greenhouse gas emission and enhance the overall sustainability of modern society. In order to reduce the carbon dioxide emission levels, many fast growing hardwoods such as poplar species are tested for the biomass production. P. nigra and its descend inter-specific hybrid are among the most promising (Benetka et al., 2002; Laureysens et al., 2005). P. nigra can be hybridized with P. deltoides, P. trichocarpa and other exotic Populus species (Fig. 7) providing adaptability to various soil and climate conditions, rooting ability, high resistance to bacterial canker caused by Xanthomonas populi, fair resistance to Marssonina brunnea and to poplar mosaic virus (Vanden Broeck, 2003).
Fig. 7: Crossability of Populus species from Zsuffa (1975) The red outline indicates the fertile crosses of P. nigra.
For the commercial poplar cultivation the P. x canadensis clones proved an extraordinary success. They were introduced into many European, Asian, North and South American countries. Until the 1960s, all poplar species used for commercial cultivation were either new hybrids or varieties of
combinations of P. deltoides and P. nigra. A number of pests and diseases threaten the present clones and the creation of healthy, fast growing clones is a constant process which depends on P. nigra as one of the crossing parents. It specifically contributes resistance to bacterial canker (Xanthomonas populi) in the P. x canadensis hybrids. However, only the cross with P. nigra as father provides an hybrid offspring. In cross-breeding trials with the reciprocal combination P. nigra x P. deltoides, the embryos died off in an early stage (Hofmann, 2001). Therefore, P. nigra is used in breeding programs in many parts of the world. In Italy, the breeding program is an example, at species level, of how a subdivided breeding population gives flexibility in maintaining genetic variation (Bisoffi and Gullberg, 1996) (Fig. 8).
Fig. 8: The Italian breeding program for poplar
From Bisoffi and Gullberg (1996)
(1) 1958-1981: collection, provenance and progeny testing, and scoring for growth, phenology, and Melampsora resistance that result in 300 P. deltoides selected clones; (2) 1982-1984: collection of 300 P. nigra clones covering the whole of Italy; (3) 1987: common tester progeny trial of P. nigra males: 6 P. deltoides x 147 P. nigra males; (4) 1988: polycross test of P. deltoides female: 95 P. deltoides x P. nigra pollen mix; (5) 1989-1991: common tester progeny trial of P. deltoides males: 6 P. deltoides females x 148 P. deltoides males. (6) 1990: polycross test ofP. nigra females: 97 P. nigra females x P. nigra pollen mix.
P.
nigra
147
males
39
males
15
females
next cycle
97
females
intra-species
mating and
selection
selec-tion
selec-tion
3
2
6
95
females
25
females
34
males
next cycle
males
148
intra-species
mating and
selection
selec-tion
selec-
tion
P.
deltoides
4
1
5
7
females
males
8
“commercial” breeding
and clonal selection
commercial
varieties
Recently, in Turkey, to improve the quantity and the quality of wood harvest from poplar plantations, classical breeding programs with P. deltoides, native P. nigra, and P. x canadensis are carried out for commercial release of the most productive hybrid clones. Useful traits of parents, such as fast growth, desired wood quality, and resistance to frost, can be combined in a hybrid, and some clones are selected from intra- or inter-specific crossings. Domestic P. nigra provenances are included in the breeding program because of their adaptability to continental conditions (Toplu, 2005).
1.1.3.2 Environmental interest of Populus nigra
P. nigra is also of ecological importance. It is a pioneer species of riparian ecosystems and contributes to the natural control of flooding and water quality. The riparian ecosystems are very dynamic environment and are characterized by a high level of diversity of the fauna and flora.
However, populations of P. nigra face severe threats. It is one of the most threatened tree species in Europe. Three main factors have been recognized (De Vries and Turok, 2001):
• the alteration of riparian ecosystems throughout the species’ distribution area.
Agriculture and urbanization of floodplain areas have displaced native poplar stands while other human activities, including regulation of floods through hydraulic engineering practices, have favored later successional hardwood forests over poplar stands in the remaining wild areas. Although the species may demonstrate locally highly successful regeneration, some regions of Europe have witnessed significant reductions in populations or the complete disappearance of P. nigra.
• the autochthonous P. nigra resources have been overexploited for the use of wood and
faster growing hybrid poplars have been planted to replace them.
• there is a potential threat of introgression from cultivated clones, and other poplar
species. Very few clones are extensively cultivated and these contribute to a large extent to the pollen and seed pools. The risk concerns not only introduced hybrids, but also pure P. nigra varieties with a wide distribution such as the male clone P. nigra cv italica, distributed all over continental Europe.
Currently, there is a great interest in Europe to restore the bottomlands. Not only for the natural control of flooding but also because the bottomlands will serve as ecological corridors through which larger natural areas are connected. Strategies for restoration and conservation of the riparian ecosystem should be based on firm scientific footing.
Two main projects, “EUFORGEN P. nigra network” and “EUROPOP”, are working on the evaluation of the existing biodiversity of P. nigra natural populations. The objectives of these projects are the conservation and the restoration of the remaining natural riparian ecosystems. Traditional methods will be combined with modern techniques and the high level of standardization will ensure a synthesis of the genetic diversity of P. nigra in Europe. This information is essential for the evaluation of the existing biodiversity in river populations so guidelines and strategies for in situ and ex situ conservation can be provided. Static ex situ conservation is a widely applied strategy for short-term conservation to preserve genotypes in collections or gene banks. Many ex situ collections have been already carried out such as in Turkey since 1962 by the Poplar and Fast-Growing Forest Trees Research Institute in Izmit (Toplu, 2005). In Italy, in 1981 the Istituto di Sperimentazione per la Pioppicultura and the Centro di Sperimentazione Agricola e Forestale started a joint program on the identification and collection of spontaneous P. nigra individuals (Bisoffi et al., 1987). Recently, nine European gene bank collections were analyzed with molecular markers in order to estimate the number of hybrids, the extent of clone duplications and the genetic diversity within and between the gene bank collections. This work allowed evaluating the quality of the gene bank and the existing genetic diversity of P. nigra in these nine European collections (Storme et al., 2003).
However, when the objective is the long-term gene conservation and maximization of the adaptive potential of a species, a dynamic in situ conservation is preferable. This can be achieved through in situ conservation of native stands (including their restoration), long-term breeding programs or both. Successful in situ conservation of P. nigra in Europe depends on the location and protection of its natural habitats. A preliminary assessment of the genetic diversity among adult trees in the candidate populations is recommended to conserve a high amount of diversity and a low number of clonal duplicates (Vanden Broeck, 2003). In this purpose the genetic diversity of P. nigra population was evaluated, for example, along Rhine river (Arens et al., 1998), in the Upper Severn area of the UK (Winfield et al., 1998), along the Drome river in France (Imbert and Lefèvre, 2003). These studied showed a higher conservation of the genetic variability in France than in UK and in Netherlands where in the populations analyzed there are few different genotypes and many clonal duplicates.
Conclusion: P. nigra is a tree of social and economic interest. It is also of ecological importance as an indicator species of riparian woodlands. It dominates the early successional stage of floodplain woodlands in many temperate areas. Its current rarity in some cases is due to the loss of its natural habitat for the anthropic activities as the drainage of rivers and management of river banks. Another threat to the gene pool of P. nigra might come from the potential inter-specific hybridization. Fortunately, there is now a great interest to preserve and restore P. nigra natural populations and its natural habitat. In order to achieve these objectives many studies on P. nigra are carried out with traditional methods combined with modern techniques where the field of molecular genetic is a keystone. A deep knowledge of P. nigra genome is therefore an essential starting point to develop molecular markers to study the genetic diversity. In this context, a genetic map provides important tools for both the assessment of P. nigra diversity and breeding programs.
1.2 Genetic mapping
1.2.1 Introduction
Just like a state map allows finding a specific place, genetic maps allow scientists to search for a specific gene somewhere within a vast genome of plants or animals. To continue the comparison, state maps have cities and towns that serve as landmarks and genetic maps have landmarks known as genetic markers, or "markers" for short. Therefore the construction of the genetic map consists in placing beacons or markers on the genome (Fig. 9). The figure 9 is a good illustration of the markers which are beacons to represent the genome, here the human chromosome 11.
Fig. 9: The Visible Genetic Map of Human Chromosome 11. [online: web]
From URL: http://www.csmc.edu/csri/korenberg/chroma11.html. (Korenberg, J.R)
The markers were labeled with fluorescent dyes and hybridized simultaneously on the Human chromosome 11.
The markers on the genetic map allow then to access to the genes. The map is an important tool to study the genome structure and to detect, localize, and identify genes. In particular, the decomposition of a complex trait, such as yield for plants, in its discrete components (Quantitative Trait Loci or QTL) can be realized. The linkage among markers and QTLs of agronomic interest permits to use these markers in breeding programs. The main objective of QTL mapping is to find the genes responsible for the traits however this is a complex and long work. Therefore, finding markers linked to traits, and indirectly to genes, is faster in a first step.
In the last decade, genetic mapping has been particularly developed with the technological advancement of molecular biology. The PCR (Polymerase Chain Reaction), which can be considered the basic technique of molecular biology, has permitted to set up many molecular markers
(Fig. 10). The sequencers have also become powerful tools for genetic mapping because they allow the development of new markers but also gaining time, precision, and working at large scale (Fig. 11). Therefore, the availability of this large number and kind of molecular markers has allowed the construction of saturated genetic maps in many plant species. For example: the highly saturated map of tomato (Haanstra et al., 1999) including 67 RFLP (Restriction Fragment Length Polymorphism) and 1078 AFLP (Amplified Fragment Length Polymorphism) markers, spanning 1482 cM (centi Morgan); the sorghum map of 1713 cM encompassing 2926 loci constituted of AFLP, RFLP and SSR (Simple Sequence Repeat) (Menz et al., 2002); the high resolution rice map containing 1383 DNA markers distributed along 1575 cM (Kurata et al., 1994). The genomes of more marginal species such as forest trees have been also mapped: Norway spruce (Picea abies) (Acheré et al., 2004), loblolly pine (Pinus taeda) (Remington et al., 1999), eucalyptus (Grattapaglia and Sederoff, 1994), European chestnut (Casasoli et al., 2001), and different poplar species and hybrids (Cervera et al., 2001).
Fig. 10: Scheme of PCR reaction. [online: web]
From URL: http://www.science2discover.com/images/PCR.gif and http://134.174.23.167/zonrhmapper/images/PCR.JPG. A specific region of DNA can be amplified thanks to primers (small pieces of DNA which bind to a complementary sequence of the DNA), nucleotides (small molecules which compose the DNA) and, the Taq Polymerase enzyme (which has the property to add the nucleotides at the 3’ end of the primers). The PCR reaction consists in 3 consecutive steps. The double strand DNA has the property to separate its strands at high temperature (94°C), it is the denaturation step. After the DNA denaturation, the temperature is lowered (50 – 60°C) to permit the binding of primers, it is the annealing step. Then the temperature is increased to reach the optimal condition of work for the Taq (72°C), it is the elongation step. These 3 main steps are repeated and a large quantity of DNA copies is obtained (exponential amplification). The
DNA is heated to 94-96°C to separate both strands (First Cycle)
Primers+nucleotides+enzymes
T CAG
Annealing temperature between 50 and 60°C Extension at 72°C
GCT A
DNA is heated again (same as before) (Second round of cycle)
The result is amplified piece of DNA Enzyme-Taq Polymerase Primer 1
Primer 2
DNA piece that will anneal to primers DNA is heated to 94-96°C to separate both strands
(First Cycle)
Primers+nucleotides+enzymes
T CAG
Annealing temperature between 50 and 60°C Extension at 72°C
GCT A
DNA is heated again (same as before) (Second round of cycle)
The result is amplified piece of DNA Enzyme-Taq Polymerase Primer 1
Primer 2
Fig. 11: Photo of a sequencer. [online: web]
From URL: http://newton.bhsu.edu/biology/images/DNAsquencersetup.jpg
This is an example of a capillary sequencer which allows to sequence the nucleic acids but also to separate the DNA fragments obtained by PCR. The sequencer generates new molecular markers and separates PCR products with high throughput, allowing a rapid analysis of molecular markers on a large number of individuals.
1.2.2 Principle of genetic mapping
The construction of a genetic linkage map is based on the segregation study of simple genetic traits (morphological, biochemical, and molecular), the markers, in a progeny. The genetic markers must have a Mendelian segregation, be polymorphic, and easy to follow in each individual. When chromosomes pair in the first division of meiosis, crossovers occur between two non-sister chromatids generating an exchange of genetic material between the maternal and paternal chromosomes (crossing-over). If there are genetic markers (alleles) on the chromosomes, it is possible to observe new combinations of alleles at different loci as a result of these crossing-overs (Fig. 12).
Fig. 12: Scheme of gamete formation with and without crossing-over. [online: web]
From URL: http://www.saintemarie-caen.asso.fr/svt/Term/TPS9_fichiers/image008.jpg (photo) and http://fig.cox.miami.edu/Faculty/Dana/F05_08.JPG (table)
The table represents the possible gametes obtained after the meiosis. The gametes descending from a crossover between loci are recombinant, the other ones are the parental type (non recombinant). On the left the photo illustrates chromosome pairs with crossing-overs.
The recombination rate between 2 loci is proportional to their distance: the greater is the distance between loci, the higher is the probability of recombination. In the same way two loci closer have less probability to recombine. Therefore the distance separating loci can be deduced from the recombination rate. This parameter is estimated for each pair of loci by analyzing allele distribution in the gametes or in the progenies. Then loci are ordered one each other to construct the genetic map of parents. The precision of the map depends on the number of meiosis analyzed (Fig. 13).
Fig. 13: Example of cross used for mapping population and genotype of gametes formed during F1 individual meiosis.
A and B represent 2 loci with 2 alleles, A/a and B/b. The distance between these 2 loci can be calculated by the recombination rate r = n/N, where N is the total number of gametes and n is the number of recombinant gametes. If the frequencies of the 4 genotypes (AB, ab, Ab, aB) is the same, r = 0.5, that means the 2 loci segregate independently and therefore they are unlinked.
The map construction needs three main elements:
• a progeny within which it is possible to follow the segregation of genetic markers;
• genetic markers to characterize individuals of the progeny;
• statistical analysis of data segregation.
1.2.2.1 Pedigrees used for genetic mapping in plants
The first step of the genetic map construction is the choice of parents of the cross and the type of progenies to analyze. The parents are chosen in order to have a maximum of detectable segregation in the progeny. The main pedigrees used for genetic mapping in plants are the following:
• F2 progeny descend from a self fertilization of F1 hybrids. In this case, there are two
efficient meiosis, the female and male gametes can be recombinant. Two very divergent lines were often chosen to obtain the F1: maize (Sibov et al., 2003), cotton, (Rong et al.,
2005).
• Recombinant Inbred Lines (RIL) stem from a F2 family after five or six self
fertilization cycles. At each generation an individual of each line is self fertilized to give
Parent 1
AABB
Parent 2
aabb
F1
AaBb
F1 gametes
Parental = N-n
AB/ab
Recombinant = n
Ab/aB
r = n/N
A
B
a
b
rise to the next generation. Individuals of the same line are genetically identical. The last generation lines are highly homozygous and each line presents particular allelic combinations. The segregation are observed among these lines in these species: wheat (Ellis et al., 2005), sunflower (Al Chaarani et al., 2005).
• Backcross (BC) results from the crossing between a F1 individual and one of its parents.
If the parent is genetically fixed (homozygote for all these loci), the meiosis do not carry segregation. On the other hand, the F1 individuals form four types of gametes
(Fig. 13) responsible of the segregation observed like for example in cacao (Crouzillat et al., 1996) and pepper (Rao et al., 2003).
• Doubled haploids come from the regeneration of plants from microspores or
macrospores. This is possible for some species such as Poaceae, Solanaceae, etc. The regenerated plants are diploids because they have undergone a chromosomal doubling induced or spontaneous. At the genetic level each plant corresponds to a meiosis product therefore, a genetic map can be constructed with a progeny of these individuals. This is equivalent to the recombinant inbred lines but the plants are produced in one generation, for example in sweet pepper (Sugita et al., 2005) and in cotton (Song et al., 2005).
• Endosperm (or megagametophyte) of conifer, the nutritive tissue of the seed, is haploid
with the same genetic constitution of the female’s gametes. The megagametophytes of an individual form a mapping population as reported for pine, (Remington et al., 1999), Norway spruce (Paglia et al., 1998).
• F1 family hybrids (outbred crosses) are used when the other mapping population, previously viewed, can not be obtained. Two cases are concerned: i) auto-incompatible species or for which it is impossible to have pure lines, such as diploid clones of potatoes, ii) perennial species with long life cycle such as trees, where the constitution of mapping population could take long time. For the F1 family hybrids, the segregation is observed at
heterozygous loci of each parent taken separately. As the trees have particularly high level of heterozygosity, the F1 progeny can be used for map construction like in poplar
(Zhang et al., 2003) and in European beech (Scalfi et al., 2004).
Therefore the choice of a pedigree for genetic mapping depends on the species characteristics (reproduction biology, time of generation, cost) but also on the kinds of markers used.
1.2.2.2 Markers used for genetic mapping
Genetic markers, in general, can be classified as morphological markers, biochemical markers (isozymes, proteins) and molecular markers (at DNA level). The ideal genetic marker should be:
• polymorphic;
• multi-allelic;
• co-dominant: the heterozygote presents simultaneously the characters of the two
homozygote parents; so it can be differentiated from each parental homozygote;
• no epistatic: there is no interaction between loci. The genotype can be read from the
phenotype independently of the genotype of the other loci;
• neutral: the allelic substitution has not phenotypic effects, so there is no selective
effect;
• insensitive to environment: the genotype can be inferred from the phenotype whatever
the environment.
Morphological markers badly respond to these criteria. They are poorly polymorphic, generally dominants, often interfere with other characters and can be influenced by the environment. On the other hand, biochemical and molecular markers have, mostly, all the required qualities.
Two main techniques use the protein markers: the isozymes and the total proteins. Isozymes are based on the staining of proteins with identical function, but different electrophoretic mobility. The change of the polypeptide sequence induces physical properties alteration and, consequently, different migration, corresponding to the different alleles of the enzyme. Their expression are co-dominant and multi-allelic. These markers are used in many genetic linkage maps (Lespinasse et al., 2000; Casasoli et al., 2001) but the number available and the limited allelic variation of isozymes do not allow a sufficient coverage of the genome. Total proteins allow analyzing more loci. The allelic variation of genes coding for protein result in variation of mass and/or iso-electric point which can be revealed by electrophoresis. Because of technical and interpretation (alleles definition) difficulties, these protein markers are poorly used. In bibliography there are some examples on the use of protein markers such as in Pinus (Gerber et al., 1993). Morphological and protein markers have been the first genetic markers used for the linkage analysis but linkage maps were limited in size until the advent of molecular markers.
Indeed the development of molecular markers, revealing the polymorphism at DNA level, permits to obtain many markers more easily. Also for these markers there was a technical evolution. First the RFLP (Restriction Fragment Length Polymorphism) were commonly used in genetic mapping (Helentjaris et al., 1986; Helentjaris, 1987; Gebhardt et al., 1989). These markers are
based on the polymorphism of the fragment length produced by the DNA digestion with restriction enzymes. After separation by gel electrophoresis they are detected by hybridization with a labeled probe (Fig. 14). These markers are co-dominant and multi-allelic but the method is time consuming and difficult.
After extraction, the DNA digested by restriction enzymes is separated on a gel. Then the fragments are transferred on a membrane (Southern blot) and finally hybridized with a labeled probe. DNA fragments are revealed and analyzed.
After RFLPs, molecular markers based on PCR were developed and revolutionized the world of mapping. The RAPD (Random Amplified Polymorphic DNA) are one of the first PCR-based molecular markers. This technique substantially reduce time, labor, and cost required for molecular mapping. RAPDs involve the use of a single DNA primer for simultaneous
amplification of multiple random sequences (Fig. 15).
Fig. 15: Description of RAPD technique. [online web]
From URL: http://www.usask.ca/agriculture/plantsci/classes/plsc416/projects_2002/pawlin/resources/rapds.html (Scheme) and http://www.cipotato.org/market/PgmRprts/pr95-96/program2/prog25.htm (photo)
The RAPD analysis consists in amplifying unknown target sequences. Short primers (10 base pairs) with an arbitrary sequence are designed and used for PCR amplification of genomic DNA. The products of amplification are then separated by electrophoresis. The photo represents an example of results obtained after gel electrophoresis and staining.
The RAPD markers are dominants (presence or absence of DNA fragment) which is not ideal for genetic mapping, but they are so simple and quick that they were widely used in diverse species: rice (Kurata et al., 1994), eucalyptus (Grattapaglia and Sederoff, 1994), white spruce (Gosselin et al., 2002), douglas fir (Jermstad et al., 1998), chestnut (Casasoli et al., 2001), poplar (Bradshaw et al., 1994; Yin et al., 2001). A major disadvantage of RAPD technology is the inconsistent reproducibility of the results (Jones et al., 1997). Another technique, AFLP (Amplified Fragment Length Polymorphism) was developed by Vos et al. (1995) and provides greatly enhanced performance in terms of reproducibility and efficiency. Now the AFLPs are more used than RAPDs even if they also provide dominant markers (Fig. 16). AFLPs allow the construction of dense maps even for large genomes such as trees.
Fig. 16: Description of AFLP technique
From URL: http://www.scri.sari.ac.uk/SCRI/Web/MultimediaFiles/AFLP.JPEG (photo gel) and http://www.chelab.it/Images/News/upl/OLIO-AFLP-Taggiasca_small.jpg (photo electopherogram)
The procedure of AFLP is divided into three main steps: i) digestion of total genomic DNA with restriction enzymes and ligation of restriction half-site specific adaptors to all restriction fragments, ii) selective amplification of some PCR fragments with two primers that have corresponding adaptor and restriction site specific sequences, iii) electrophoretic separation followed by visualization of the band pattern.
Am plification 2 w ith 2nd prim er Am plification Denaturing Addition of 1st prim er couple Digestion Adaptator ligation Digestion Electrophoretic separation
The more recent published maps were constructed with AFLP and SSR (Simple Sequence Repeat) (Yin et al., 2004b; Kenis and Keulemans, 2005; Tsuro et al., 2005). The SSR, or microsatellite markers, are co-dominant markers and are defined by a variable number of repetitions of a very small number of nucleotides within a sequence. As these regions are very variable, the number of repeats for a given microsatellite may differ between individuals. SSRs can show a large number of different alleles for one locus. They are abundant and there is an even distribution across the genome. Another important advantage of these markers is the potential transferability among the species. Actually, they are obtained thanks to primers corresponding to the flanking regions of the microsatellite which are unique for each locus (Fig. 17).
A couple of primers are used to amplify a specific SSR with the PCR reaction. The high variability of the microsatellite regions allows the detection of many allele at the locus.
The development of SSR markers requires a high initial investment because the knowledge of the DNA sequence is necessary. However, the important progress of the sequencing techniques and the cost reduction have permitted the availability of SSR databases for many species. Over the past few years, the sequencing of many entire genomes allowed a new kind of marker, the SNPs (Single Nucleotide Polymorphism). The SNPs consist in single base changes or small insertions and deletions (indels) between homologous DNA fragments and they are present in all parts of the genome, coding or non coding regions (Fig. 18). In principle, SNPs could be bi-, tri- or tetra-allelic polymorphisms. However, tri-allelic and tetra-allelic SNPs are rare almost to the point of non-existence and for this reason SNPs are sometimes simply referred to bi-allelic
co-Individual 1 PCR am plification: - Denaturation - Prim er annealing Electrophoretic Individual One locus Allele 1 Allele 2 TATATATATA TATAT TATAT TATATATAT TATAT TATAT TATATATATA TATATATAT
Primer 1 Primer 2 Primer 1 Primer 2
Individual 1 Individual 2
Exam ple of electrophoretic separation in agarose gel of one SSR on 8 individuals
dominant markers. This is somewhat misleading because SNPs are only a subset of all possible bi-allelic polymorphisms (e.g., multiple base variations) (Brookes, 1999).
Fig. 18: Description of SNP [online web]
From URL: http://bldg6.arsusda.gov/~pooley/soy/cregan/snp.html
SNPs are polymorphisms due to single nucleotide substitutions (transitions > transversions) or single nucleotide insertions/deletions.
As SNPs are predominantly bi-allelic, they are considered less informative than SSRs. It is estimated that 2.25-2.5 SNPs are required to provide the same genotyping information as one SSR marker (Paris et al., 2003). This single base polymorphism can be revealed by several approaches of different technical complexity. The most obvious result is obtained by direct sequencing but with a large number of individuals and/or SNPs it is relatively expensive. The most simple approach is by AS-PCR (Allele Specific-PCR) (Liu et al., 1997; Bundock et al., 2005) and the most advanced and expensive are the MALDITOF (Matrix-Assisted Laser Desorption/Ionization Time-Of-Flight) mass spectrometry (Sun et al., 2000; Paracchini et al., 2002) and the analysis of the extension products on DNA chips (microarray) (Rostoks et al., 2005; Huentelman et al., 2005). The choice of the method depends on the number of individuals and SNPs to analyze and on the available technical resources.
There are other types of marker often derived from the previously techniques described such as the PCR-RFLP. In this case, a DNA region is amplified by PCR and then digested by restriction enzymes. One locus is targeted and a simple gel can be sufficient to reveal the genotype.
Conclusion: The choice of a genotyping method for the genetic map construction depends on the available resources but also on the information level of the markers. Therefore the maps are generally constructed with several kinds of markers such as AFLP and SSR. AFLPs allow to obtain a large quantity of markers in short time at a relative low cost and are ideal markers to saturate the map while SSRs are less numerous and more time consuming but more informative for segregation analysis. Another advantage of using different type of markers is to increase the probability to have a good coverage of the genome.

![Fig. 12: Scheme of gamete formation with and without crossing-over. [online: web]](https://thumb-eu.123doks.com/thumbv2/123dokorg/2809687.2107/29.892.113.786.792.1032/fig-scheme-gamete-formation-crossing-online-web.webp)
![Fig. 15: Description of RAPD technique. [online web]](https://thumb-eu.123doks.com/thumbv2/123dokorg/2809687.2107/33.892.114.782.203.563/fig-description-of-rapd-technique-online-web.webp)