Bulletin of Volcanology
Constraining pre-eruptive magma conditions and unrest timescales during the Monte
Nuovo eruption (Campi Flegrei, Southern Italy): integrating textural and CSD results for
experimental and natural trachy-phonolites
--Manuscript Draft--Manuscript Number:
Full Title: Constraining pre-eruptive magma conditions and unrest timescales during the Monte Nuovo eruption (Campi Flegrei, Southern Italy): integrating textural and CSD results for experimental and natural trachy-phonolites
Article Type: Research Article
Corresponding Author: Fabio Arzilli, Ph.D. University of Manchester Manchester, UNITED KINGDOM Corresponding Author Secondary
Information:
Order of Authors: Fabio Arzilli, Ph.D. Monica Piochi Angela Mormone Claudia Agostini Michael R. Carroll
Funding Information: 2005–2006 INGV-DPC project V3-2/UR14 Dr Monica Piochi
FAR 2012 Prof. Michael R. Carroll
Abstract: We present crystallization experiments concerning a broad range of growth conditions of alkali feldspar and sodalite in trachy-phonolite magma composition during their later evolution state. Our results include: i) textural data and mineral assemblage of synthetic samples, ii) feldspar kinetics and growth rate estimates, and iii) textural data, mineral abundances and Crystal Size Distribution trend of samples representative of the Monte Nuovo eruption (1538 AD, last in the Campi Flegrei, Southern Italy). Experiments reproduced the texture and feldspar content of natural products indicating that the kinetics data can provide insights into processes within the volcanic system shortly before and during this small-magnitude eruption, and, particularly, about magma ascent timescale. Based on the bulk of the results we suggest that the groundmass crystallization of Monte Nuovo magma started between 7 and 4 km of depth (≤200 MPa) at a temperature between 825 and 840 °C (close to the liquidus of alkali feldspar). The crystallization kinetics of alkali feldspar and the absence of sodalite in most of the natural samples indicate that the magma ascent was faster between 2 and 3 km (50-70 MPa) before to reach the fragmentation zone, during the first phases of the eruption. The crystallization time of the magma allows us to definitively constrain that the magma reached the fragmentation level in few days to several hours. Here we also show that a small decrease in pressure could induce a dramatic increase of crystallinity with associated rheological changes able to modify the eruption style. Thus, the products from the later phases of the Monte Nuovo eruption are more crystalline and contain sodalite in response to the reaching a shallower fragmentation depth.
Suggested Reviewers: Caroline Martel
[email protected] Francesco Vetere [email protected] Luca Caricchi [email protected] Christopher R. J. Kilburn
[email protected] Malcolm J. Rutherford
Constraining pre-eruptive magma conditions and unrest timescales during the Monte Nuovo 1
eruption (Campi Flegrei, Southern Italy): integrating textural and CSD results for 2
experimental and natural trachy-phonolites 3
4
Fabio Arzilliab*, Monica Piochic, Angela Mormonec, Claudia Agostinib, Michael R. Carrollb 5
a School of Earth, Atmospheric and Environmental Sciences, The University of Manchester, Oxford
6
Road, Manchester, M13 9PL, UK 7
bSchool of Science and Technology - Geology Division, University of Camerino, Via Gentile III da 8
Varano, 62032 Camerino, Italy 9
cIstituto Nazionale di Geofisica e Vulcanologia, sezione Osservatorio Vesuviano, Via Diocleziano
10
328, 80124 Napoli, Italy 11
12
*Corresponding author: Dr. Fabio Arzilli
13
Corresponding author present affiliation: School of Earth, Atmospheric and Environmental 14
Sciences, The University of Manchester, Oxford Road, Manchester, M13 9PL, UK 15
E-mail address: [email protected] 16 Phone: +393298429732 17 18 19 20 21 22 23 24 25 26
Manuscript Click here to download Manuscript Arzilli et al_manuscript.doc
Abstract 27
We present crystallization experiments concerning a broad range of growth conditions of alkali 28
feldspar and sodalite in trachy-phonolite magma composition during their later evolution state. Our 29
results include: i) textural data and mineral assemblage of synthetic samples, ii) feldspar kinetics 30
and growth rate estimates, and iii) textural data, mineral abundances and Crystal Size Distribution 31
trend of samples representative of the Monte Nuovo eruption (1538 AD, last in the Campi Flegrei, 32
Southern Italy). Experiments reproduced the texture and feldspar content of natural products 33
indicating that the kinetics data can provide insights into processes within the volcanic system 34
shortly before and during this small-magnitude eruption, and, particularly, about magma ascent 35
timescale. Based on the bulk of the results we suggest that the groundmass crystallization of Monte 36
Nuovo magma started between 7 and 4 km of depth (≤200 MPa) at a temperature between 825 and 37
840 °C (close to the liquidus of alkali feldspar). The crystallization kinetics of alkali feldspar and 38
the absence of sodalite in most of the natural samples indicate that the magma ascent was faster 39
between 2 and 3 km (50-70 MPa) before to reach the fragmentation zone, during the first phases of 40
the eruption. The crystallization time of the magma allows us to definitively constrain that the 41
magma reached the fragmentation level in few days to several hours. Here we also show that a 42
small decrease in pressure could induce a dramatic increase of crystallinity with associated 43
rheological changes able to modify the eruption style. Thus, the products from the later phases of 44
the Monte Nuovo eruption are more crystalline and contain sodalite in response to the reaching a 45
shallower fragmentation depth. 46
47
Keywords: alkali feldspars; trachytic melts; crystallization kinetics; CSD; Monte Nuovo; Campi 48
Flegrei 49
1. Introduction 50
1.1 The aim of the study 51
Alkali feldspar is an abundant crystal phase in evolved alkaline rocks (phonolites, alkali 52
rhyolites), and is widespread in the Campania Province (Piochi et al. 2005). Its occurrence as 53
microlites in the pumice and scoria groundmass potentially provides information on the timescale of 54
magma migration within the crust, specifically from the magma chamber to the fragmentation level 55
(Marsh 1988; Cashman and Marsh 1988; Marsh 1998). This information may be unraveled by 56
studying the size distribution of microlites pre- and syn-eruptively crystallized and quenched in the 57
matrix of juvenile fragments. Since the crystals present in an igneous rock and the observed 58
variations in both their composition and texture reflect the integrated pressure (P) - temperature (T) 59
- composition (X) - time (t) history of the magma from which they formed, it is possible to link 60
textural observations with experimentally derived data for rates of crystal growth (YL) and crystal
61
number density (Na) for the specific mineral phase and the undercooling (T) values of the parental
62
melt. In fact, this allows us to gain insights into magmatic processes and their time-scales using 63
textural observation. 64
However, there are few studies about crystallization kinetics on trachy-phonolitic melts (e.g., 65
Iezzi et al. 2008; Arzilli and Carroll 2013). In this study we present results for 16 new 66
crystallization experiments on hydrous trachytic melt, which complement the previous experimental 67
work of Arzilli and Carroll (2013). All of the experiments use the same single-step (cooling and 68
decompression) method to reproduce the trachytic melt evolution in response to instantaneously 69
applied thermodynamic driving force (i.e., undercooling, ∆T = Tliquidus - Texperimental).
70
The experiments were conducted at different pressures and ∆T, in order to highlight the differences 71
in crystallinity between high and low pressure (and thus melt H2O content). The preliminary study
72
of Arzilli and Carroll (2013) focused mainly on the influence of ∆T and time on the nucleation and 73
growth of alkali feldspar. They showed the occurrence of several nucleation events of alkali 74
feldspar in short times (hours), with dominance of nucleation at large ∆T. Here we utilize our 75
experiments and those performed by Arzilli and Carroll (2013) to study how the crystallization may 76
change as a function of PH2O (proportional to melt water content for the water-saturated conditions
77
investigated) and ∆T (induced by cooling and/or decompression). Our study is focused in 78
understanding how fast the crystallinity of a trachytic magma could change after small variation of 79
pressure. These experiments provide constraints on the P-T conditions of the trachytic to phonolitic 80
melts during their ascent to the surface. Therefore, differently from Arzilli and Carroll (2013), here 81
we use the experiments to better understand the volcanological and magmatic processes during the 82
Monte Nuovo eruption in the Campi Flegrei (Southern Italy; Fig. 1). This eruption is particularly 83
interesting because it occurred after 3000 years of volcanic quiescence and following a period of 84
ground level movements and seismicity with characteristics comparable to the recent bradyseisms 85
in the Campi Flegrei area (Parascandola 1947; Del Gaudio et al. 2010), as described by historical 86
chronicles (Guidoboni and Ciucciarelli 2011). Constraining the timing of magma movements in the 87
subsurface shortly before the eruption is crucial to unravel the significance of phenomena affecting 88
the Campi Flegrei during volcanic quiescence. The eruption was already the object of similar 89
studies (D’Oriano et al. 2005; Piochi et al. 2005) that, nevertheless, were limited by the lack of 90
crystallization kinetic data for trachytic-phonolitic melt compositions (D’Oriano et al. 2005; Piochi 91
et al. 2005). In order to constrain the conditions and the timescales of magmatic processes, we focus 92
on the crystallization kinetics of alkali feldspar in trachytic melts and new crystal size distribution 93
(CSD) data for groundmass feldspars in the natural samples. This choice is in line with several 94
studies (e.g. Geschwind and Rutherford 1995; Hammer and Rutherford 2002; Couch et al. 2003; 95
Armienti et al. 2007; Martel 2012) that used crystallization kinetics and CSD of feldspar (mainly 96
plagioclase) to unravel shallow dynamics in pre- and syn-eruptive conditions at several calc-97
alkaline volcanoes; our new data allow similar investigation using the abundant alkali feldspar 98
crystals in the Campi Flegrei system (e.g., Piochi et al. 2005; 2008 and reference therein). 99
100
1.2 Volcanological and petrological background 101
The 1538 Monte Nuovo eruption (Fig. 1a-e) was characterized by relatively low intensity and 102
magnitude (Di Vito et al. 1987; D’Oriano et al. 2005; Piochi et al. 2005, 2008). Similar to the 103
majority of volcanic eruptions of the last 14.9 ka b.p. in the area (see Rosi et al. 1983; Di Vito et al. 104
1999; Isaia et al. 2009), it occurred from a monogenic vent and extruded <0.1 km3 of magma (Lirer 105
et al. 1987; Rosi and Sbrana 1987; Mormone et al. 2011; Smith et al. 2011) with a K-rich, phono-106
trachytic composition (Fig. 2) that generated sparsely porphyritic magmas, with typically alkaline 107
feldspars, and variably vesicular pumice and scoria fragments (e.g., Rosi and Sbrana 1987; Piochi et 108
al. 2008; D’Oriano et al. 2005). However, the Monte Nuovo eruption seems to be an exceptional 109
event in the Campi Flegrei history, given that in the past 14.9 ka Campi Flegrei volcanism mostly 110
concentrated in epochs of intense activity, alternating with quiescence periods of thousands of 111
years; in such epochs eruptions occurred with a decadal frequency (Di Renzo et al. 2011; Smith et 112
al. 2011). Instead, the Monte Nuovo event was the last and occurred after a volcanic quietness of 113
~3000 years. 114
The eruption occurred in an area characterized by persistent fumarolic activity and by 115
bradyseisms since AD 1450 (Parascandola 1947; Lirer et al. 1987; Guidoboni and Ciucciarelli 116
2011) (Fig. 1d). Uplift episodes (bradyseisms) occurred in 1503 and 1511 AD (Fig. 1d) inducing 117
the local Authorities to work on the reconstruction of earthquake damaged buildings and to 118
establish the ownership of the new land created. However, strong and continuous seismicity was 119
described since the middle of AD 1536 with a significant progressive intensification about 3 months 120
before the eruption (see table 2 in Guidoboni and Ciucciarelli 2011; see also Fig. 1d,e). In the 121
middle of September, 1536, the ground deformations focused in a small zone where a vent opened 122
along the coastal sector of the Averno Lake (Fig. 1a). Up to 4.5 meters of uplift occurred 1 day 123
before the eruption, with the sea recession of about 400 m. Fractures at the surface with hot 124
groundwater outflow, flames, and sudden uplift of a sunken area preceded the explosion of smoke 125
and incandescent material that destroyed Le Tripergole Village. The eruption started in the night 126
between September 29th and 30th (Guidoboni and Ciucciarelli 2011) and the first phreato-magmatic 127
phase produced pumiceous lapilli-bearing ash deposits that built the cone, whereas the final activity 128
generated scoria deposits. The first main deposit (LM in D’Oriano et al. 2005, and Unit I-II in Di 129
Vito et al. 1987) is composed of coarse to fine ash levels, being coarser-sized and lapilli-bearing in 130
the lowermost levels (Unit I) where they are intercalated with pumice or scoria lenses or beds 131
(Boivin et al. 1982). Block sags are common, while juvenile fragments are often sub-rounded, 132
associated to infrequent obsidian-like clasts and lava and tuff lithics. This deposit was emplaced by 133
pyroclastic flow mechanism. On October 3, after two days of diminishing violence, explosions 134
produced two dark scoriae layers intercalated with a gray ash bed (UM1 or Unit III, in D’Oriano et 135
al. 2005 and Di Vito et al. 1987, respectively). The final phase, after 3 days of eruptive quiescence, 136
produced a scoria unit by flow (UM2 in D’Oriano et al. 2005) or/and fallout (Unit IV in Di Vito et 137
al. 1987) mechanism. 138
139
2. Methods: synthetic and natural products 140
2.1 Synthetic products: starting material and experimental strategy 141
We complete the experiments of Arzilli and Carroll (2013) to obtain a wider data set of feldspar 142
crystallization conditions involving growth under cooling, decompression and 143
“cooling+decompression” experiments. The starting material (Table 1) is the same obsidian used in 144
previous runs; it was sampled within the Breccia Museo Unit, a pyroclastic breccia associated with 145
the Campanian Ignimbrite eruption dated at c.a 39 ka (Melluso et al. 1995; Fedele et al. 2008). The 146
sample is known as ZAC in the literature (Di Matteo et al. 2004; Fabbrizio and Carroll 2008; 147
Calzolaio et al. 2010; Arzilli and Carroll 2013). It is sub-aphiric with <10% by volume of crystals. 148
Phenocrysts are mostly alkali feldspar with minor plagioclase, clinopyroxene, biotite and magnetite, 149
in order of decreasing abundance; apatite and titanite are accessory phases. The composition is 150
trachytic, near the trachyte-phonolite border in the TAS diagram (Di Matteo et al. 2004). It is 151
similar but not identical to the Monte Nuovo products in terms of whole-rock and glassy matrix 152
chemistry (Fig. 2; Table 1); also it presents slight differences for content of phenocrysts (<10% 153
ZAC vs. 3% Monte Nuovo) and mineral assemblage (much abundance of pyroxene and biotite in 154
ZAC). Despite these small differences, we use ZAC for which the phase diagram (Fabbrizio and 155
Carroll 2008; Arzilli and Carroll 2013) allowed us to choose accurately the experimental conditions 156
relevant for our study the feldspar crystallization kinetic. Also, Piochi et al. (2008) proposed similar 157
composition for the magma systems feeding eruptions at the Campi Flegrei. 158
To complete the experimental data set of Arzilli and Carroll (2013), we have performed 16 new 159
crystallization experiments. Particularly, we extend cooling and degassing experiments in water-160
saturated conditions towards higher pressure (experimental final pressure, Pf = 100, 150 and 200
161
MPa) and lower pressure (Pf = 30 and 50 MPa) within a range of temperatures between 750 and 850
162
°C (Table 2). The initial conditions of the experiments were above the liquidus of the alkali 163
feldspar. The experiments were carried out using Cold Seal Pressure Vessels (CSPV) at the 164
Geology Division (University of Camerino); details on CSPV facilities, capsule preparation and 165
experimental methods are described in Arzilli and Carroll (2013). 166
167
2.2 Natural products 168
Analyzed pumice and scoria fragments are from the Lower and Upper Members of the Monte 169
Nuovo formation (Fig. 1a, b, c), respectively. Fragments and eruption levels were selected on the 170
basis of previous textural and chemical characterization (D’Oriano et al. 2005; Piochi et al. 2005; 171
Piochi et al. 2008) with the aim to analyze in major detail the textural and petrological variability in 172
products representative of the eruption phase, including new X-ray diffraction data. 173
Pumices are mostly angular clasts, yellowish in colour and with sub-spherical vesicles, from few 174
to several centimetre in dimension. Other pumices are characterized by alternating yellow and 175
brown portions and are referred to as banded pumices. Scoriae are mostly blackish clasts, generally 176
dm-sized, containing heterogeneous vesicles and often a more vesicular core and less vesicular 177
margin, with elongated vesicles in some pumice fragments. The pumice and scoria fragments 178
contain <3% of phenocrysts including mostly feldspars, subordinate magnetite and rare spinel. The 179
vesicularity and groundmass crystallization degree is variable (Fig. 3) (see also, D’Oriano et al. 180
2005; Piochi et al. 2005; Piochi et al. 2008). Microcrystallinity is determined by alkali-feldspars 181
(anorthoclase and sanidine). It varies with vesicularity: microlites are less abundant and smaller in 182
size in highly vesicular pumice compared with the scoria clasts. Overall, the products are denser 183
and more crystalline upwards in the sequence, as observed by D’Oriano et al. (2005) and Piochi et 184
al. (2005). Bands in pumice fragments are strongly parallel to each other and are associated with 185
variations in groundmass texture: brown bands being more crystalline and less vesicular than 186
yellowish bands (Piochi et al. 2008). The microlites have a general acicular shape with larger sizes 187
compared with those in scoriae; some of them are curved, following the shape of adjacent vesicle, 188
suggesting that they grew concomitantly with vesicle (Piochi et al. 2005; Piochi et al. 2008). In 189
pumices, microlites are nearly-to-strongly aligned, and microlites and color bands share the same 190
alignment. 191
Early fragmentation caused by magma-water interaction during magma ascent produced the 192
pumices at the base of sequence (samples LM inf d and LM inf l; Fig. 1a). This is texturally (Fig. 193
3) testified by i) the vesicle walls that are broken and show shocking cracks, ii) their vesicularity up 194
to 80% higher than in other pumices and scoriae; and iii) the lower groundmass crystallinity. All 195
these associated to higher water content with respect to products higher in the sequence (Piochi et 196
al., 2008). Textural variation of brown pumices (LMC3; Fig. 1c) and scoriae (MN4top; Fig. 1b and 197
Fig. 3b) mostly resulted from the variable magma outgassing occurring in relation to the magma 198
ascent dynamics (Piochi et al. 2008) during the proceeding of the eruption (D’Oriano et al. 2005; 199 Piochi et al. 2005). 200 201 3. Analytical methods 202
3.1 SEM and image analysis 203
Electron microscope images were taken for both synthetic and natural samples in order to obtain 204
more details on the textural features and mineralogical assemblage (Figs 3, 4, 5). Back scattered 205
electrons (BSE) images were collected for experimental samples using JEOL JSM-6390LA FE-206
SEM (at the Institute of Geochemistry and Petrology, ETH Zurich) and JEOL JSM-6500F - 207
upgraded to 7000 series – FEG at the INGV of Rome. More details about image analysis procedure 208
and the calculation method of crystallization kinetics are provided by Arzilli and Carroll (2013). 209
BSE images of pumices and scoriae of Monte Nuovo were acquired through a LEO 430 SEM at 210
“Istituto Geomare Sud – CNR” of Napoli, Italy and a ZEISS SUPRA 35 at the ‘‘Dipartimento di 211
Ingegneria dell’Informazione’’ of the II Università di Napoli in Aversa, Italy, operating at 10 keV, 212
and a work distance of 15 mm and 7–12 mm, respectively. 213
214
3.2 CSD analysis 215
The fragments from the selected natural samples were studied through CSD in order to estimate 216
the magma residence time, knowing the relation between feldspar population density, the sizes and 217
the specific growth rates of alkali feldspar. CSD studies provide quantitative information on relation 218
between crystal population density and crystal length for a population of crystals. The linear 219
relation provides estimates of time scales of magmatic processes (Marsh, 1988; Cashman and 220
Marsh, 1988). The slope of the correlation is equal to –1/(growth rate * residence time) and the 221
intercept is equal to the nucleation density. 222
Crystal dimensions and abundances of each size population were recovered through accurate 223
image analyses by using BSE images and Adobe Photoshop ® software package. The crystals were 224
manually segmented because the contrast between trachytic glass and feldspar microlites is weak. 225
We were able to define the contour of each single crystal also in agglomerate structures. However, 226
for highly crystalline samples, the geometry of each crystal was affected by some interpretation. 227
Several elaborations were made to define different crystal geometry in agglomerates but they 228
provided similar results. The reconstructed image was processed through ImageJ software (NIH 229
Inage; Abramoff et al. 2004; Schneider et al. 2012) package to quantify data on crystallinity 230
percentage and sizes. The relation between crystal population density and crystal length for a 231
population of crystals were finally obtained employing the CSD Corrections 1.3 program (Higgins 232
2000; Higgins 2002). 233
234
3.3 X-ray diffraction analysis 235
Selected whole-rocks and related hand-picked shards from the same sampled units used for CSD 236
were examined by powder XRD. Samples were powered in an agate mortar and analyzed by X-ray 237
diffraction method with the aim to further characterize mineralogy and semi-quantitative phases 238
estimation, on larger amount of sample than that studied on thin section. 239
X-ray powder diffraction (XRPD) patterns were obtained by using a Panalytical X'Pert Pro 240
diffractometer of the Istituto Nazionale di Geofisica e Vulcanologia, sezione Osservatorio 241
Vesuviano (Naples, Italy), as illustrated in Mormone et al. (2014). Operating conditions were: 242
CuKα radiation, 40 kV, 40 mA, 2θ range from 3 to 100°, equivalent step size 0.0179° 2θ, equivalent 243
counting time 298.09 s per step. The X'Pert High Score Plus 2.2 d software allows qualitative and 244
semi-quantitative data of the analysed natural powders. Semi-quantitative XRD analysis was carried 245
out on 7 samples by using the X'Pert High Score Plus 3.0e d package interface as detailed in the 246 Supplementary Material 1. 247 248 4. Results 249
4.1 Experimental samples: crystallization kinetics and textural features 250
The experiments performed in this study are characterized by several phases: alkali feldspar, 251
clinopyroxene, Fe-Ti oxide, biotite, sodalite, glass and vesicles (Table 3). The sodalite (Table 3) is 252
always generated at pressure ≤50 MPa, and it occurs at high crystal fraction of alkali feldspar (). 253
The experiments were texturally analyzed in order to study the crystallization kinetics of the 254
alkali feldspar, quantifying the number density (Na), crystallinity (), crystal size (L) and growth
255
rates (YL) of alkali feldspar (Table 3). The experiments between 50 and 200 MPa show that the
256
number density of alkali feldspar ranges from 104 and 106 cm-3 (Table 3) and the order of 257
magnitude of Na increase with decreasing pressure. The experiments are characterized by a wide
258
range of crystallinities of alkali feldspar () which vary between 0.01 and 0.95. The experiments at 259
high pressure (100, 150 and 200 MPa) and short experimental duration (7200 – 28800 s) change 260
from 0.01 to 0.32 (Table 3). Whereas, for the same pressures but at long duration (57600 s) is ~ 261
0.42. The experiments at 50 MPa and 15 ≤ ∆T ≤ 40 °C, ranges between 0.29 and 0.55 Table 3. 262
Several samples (see D69, D78, D21 and D62 in the Table 3) show that low pressure (30-50 MPa), 263
H2O content (1.7-2.7 wt % H2O) and 40 ≤ ∆T ≤ 115 °C favor an extreme crystallization of alkali
264
feldspar (0.72 ≤ ≤). Therefore, strongly intergrown textures were favored between 30 and 50 265
MPa, characterized by a large quantity of tiny crystals (tabular and acicular crystal intergrowth) 266
with very low abundance of glass (Fig. 4a, b, c, i). Alkali feldspars have commonly tabular and 267
elongated rectangular shapes (Figs 4a, b, c, i and 5b, c, d) at the different experimental conditions. 268
Instead, spherulitic alkali feldspar crystals are more common at higher Pf (=PH2O), and they are
269
present in the same way both in cooling and decompression experiments. Furthermore, although the 270
difficulty to obtain reliable chemical analysis, it was possible to establish that 1) alkali feldspars 271
have less than 8 mol% of An and 39 to 71 mol% of Or and 2) glasses are trachytes. 272
The growth rates (YL) of alkali feldspar range from 10-8 to 10-7 cm/s (Table 3), showing a
273
sensible decreasing at long experimental duration (57600 s), probably related to a closer approach 274
to equilibrium at longer times. 275
276
4.2 Natural samples: textural, XRPD and CSD data 277
The dominant alkali-feldspar mineral phase is present in various percentages, with nearly glassy 278
matrix (Fig. 3e) to very high abundance (Fig. 3b). X-ray diffraction patterns (see Supplementary 279
Material 1) allow evaluating the relative proportion of anorthoclase and sanidine and the accessory 280
minerals present in the various samples (Table 4) providing information additional to the that 281
derived by the optical and electron microscope investigations (Fig. 3). The anorthoclase abundance 282
is higher in the highly crystalline brown pumices (71-83%) and scoriae (55-60%). These products 283
also show small % of sodalite (~3 and ~6%, respectively). Biotite contributes to the XRPD patterns 284
of several samples with relative abundance <0.2-0.6%. Note that the biotite is absent in the scoriae 285
erupted at the end of the eruption. Furthermore, the XRPD semi-quantitative data on whole-rock 286
and related separated shards of each sample indicate comparable mineral phase percentage. 287
Therefore, the contribute of phenocrysts is not significant and the XRPD can be used to asses 288
microlite abundance, as also it results by comparing semi-quantitative data by XRPD 289
(Supplementary materials 1) and BSE images (Piochi et al., 2008). 290
Alkali feldspars are generally aligned in the bands and, sometimes, clustered in spherulitic clots. 291
No significant contortion characterizes the bands. The size and abundance of alkali feldspar 292
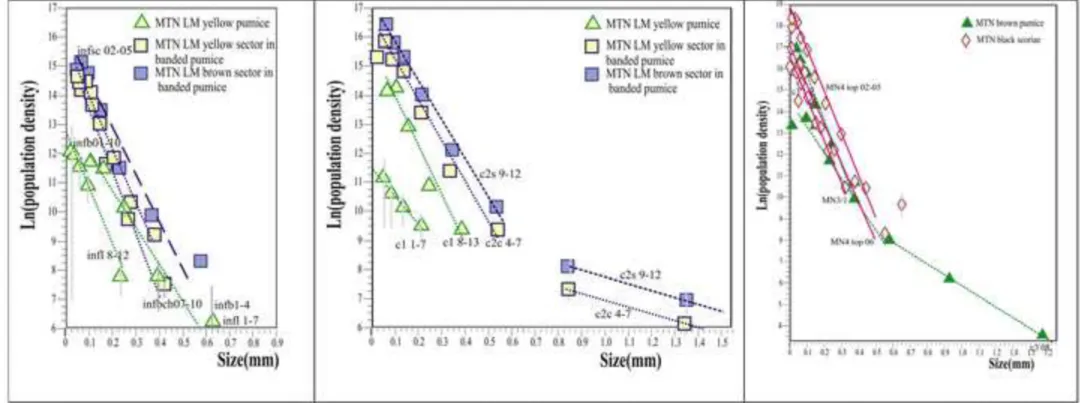
determined in natural samples allow us to obtain several measurements of CSDs (Fig. 6). In 293
agreement with previous analysis (D’Oriano et al. 2005; Piochi et al. 2005; Mastrolorenzo and 294
Pappalardo 2006), the size distributions of microlites appear to define two approximately linear 295
trends, a steeper one for crystals smaller than about 0.6 mm, and another, more shallow slope for 296
larger crystals; trends for different samples are nearly parallel. However, our CSDs are more 297
accurate in comparison to those in the literature that show comparable intercept values, but lower 298
crystal size as the consequence of smaller area investigated by previous authors (Piochi et al., 299
2005). The stratigraphically lower pumices show a simple CSD with a unique growth trend, while 300
scoriae are characterized by two trends that show two timing of crystal growth (Fig. 6). Therefore, 301
the smaller microlites define CSD curves with slopes that range from -22 to -8 and an intercept at 302
10-11 mm-2; instead the curves for larger microlites have slopes between -2 and -7 and extrapolated 303
intercepts at 10-9-10-11 mm-2 (Table 5). Lower slope values are generally determined in the lower 304
vesicular brownish bands and black scoria (c2s 9-12 – 1 and MN4 top 06 – 1, respectively, in Table 305
5); whereas higher slopes are from the highly vesicular yellow glass. 306
307
5. Discussion 308
5.1 The rapid change of crystallinity: the role of PH2O and ∆T
The cooling experiments performed by Arzilli and Carroll (2013) show that varies between 310
0.05 and 0.64, instead, here we show that could be ranged from 0.01 to 0.93 a certain conditions. 311
This can be also observed in decompression experiments: shows similar variation, from 0.13 to 312
0.76 for “decompression + cooling” experiments and from 0.09 and 0.77 for isothermal 313
decompression (Arzilli and Carroll 2013). Here we show that in the latter kind of experiment 314
reaches 0.95 at 30 MPa and long duration (14 h). Instead, the abundances of clinopyroxene and 315
magnetite remain low (0.01 to 0.10) for this feldspar-dominated bulk composition (Arzilli and 316
Carroll, 2013). 317
The abundance and morphologies of alkali feldspar are linked to Pf (= PH2O), water content, T
318
and experimental duration (as observed by Arzilli and Carroll, 2013). By combining our results with 319
those of Arzilli and Carroll (2013) we show that cooling experiments at 50 and 70 MPa can produce 320
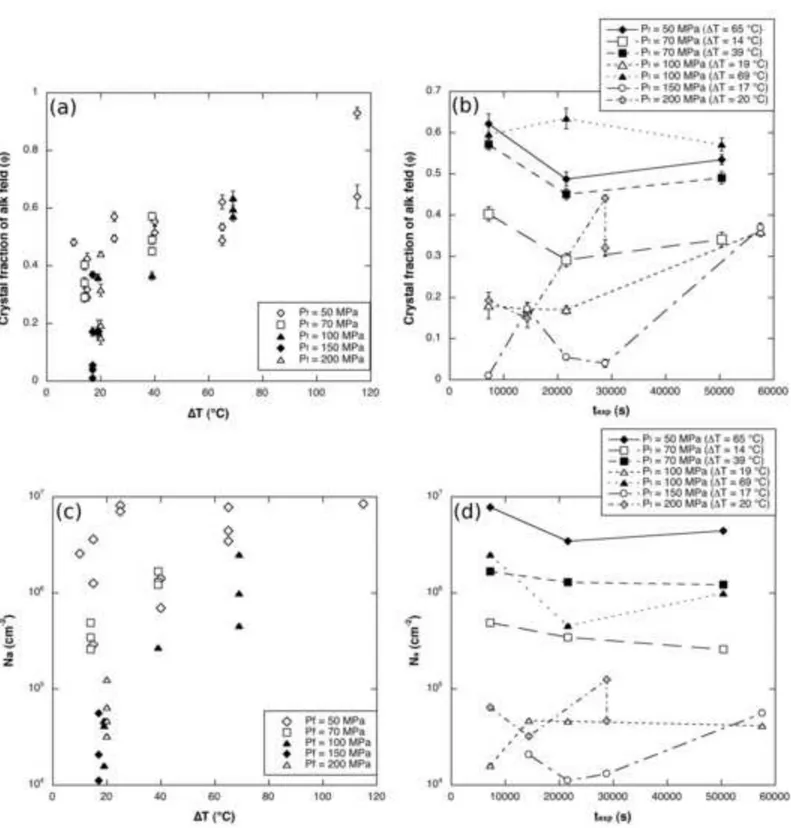
higher than those at 100, 150 and 200 MPa (Fig. 7a, b). The relation between Na and ∆T as a
321
function of Pf for cooling experiments (Fig. 7c) show that at 70 and 100 MPa, Na increases as ∆T
322
increases, whereas for experiments at 50 MPa, Na is almost constant with ∆T. The main evidence is
323
that at low ∆T, Na increases as Pf decreases and the nucleation process is favored at low pressure,
324
with lower melt water contents. The diagram in Fig. 7d shows also that Na is almost constant with
325
the time, confirming that Pf (=PH2O) and ∆T play a crucial role on the nucleation of alkali feldspar,
326
producing either high or low crystallized rocks over the limited temperature range investigated. 327
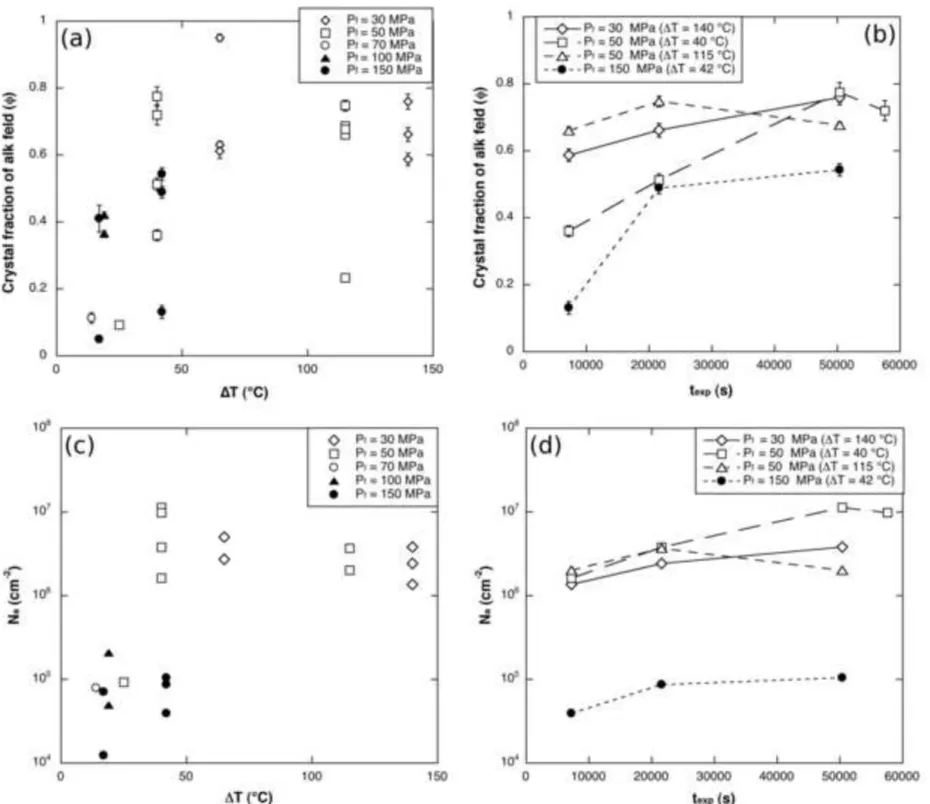
The decompression experiments show the same relations observed for cooling experiments. The 328
high crystallinity textures are produced at 30 and 50 MPa (Fig. 8a, b). The order of magnitude of Na
329
for experiments at 30 and 50 MPa is up to three times higher than experiments at 70, 100 and 150 330
MPa (Fig. 8c), increasing with decreasing water content. The exceptions are the samples at 50 MPa 331
(∆T = 25 °C) and that at 70 MPa (∆T = 14 °C), which have a low value of Na similar to the
332
experiments at 150 MPa (Fig. 8c). Probably, small ∆T could slow down the nucleation process, 333
favoring the growth. As shown above from cooling experiments, the orders of magnitude of Na is
almost constant over time, while low pressures facilitate greater nucleation of alkali feldspar (Fig. 335
8c,d). The latter diagram highlights also that similar ∆T (~40 °C) can produce different orders of 336
magnitude of Na, confirming that a strong nucleation of alkali feldspar is induced at low pressure.
337
Although we have studied the isobaric cooling and isothermal decompression processes, we have 338
not distinguished the concept of undercooling (∆T) and effective undercooling (∆Teff), the effective
339
undercooling related to decompression process at constant temperature (Hammer and Rutherford, 340
2002) because, as shown by Arzilli and Carroll (2013), under the same experimental conditions, 341
both processes produce similar crystallization kinetics. Furthermore, we performed "cooling + 342
decompression" experiments where it is difficult to separate ∆T and ∆Teff. The comparison between
343
cooling and decompression experiments shows that at similar conditions, in terms of Pf, ∆T and
344
superheating, cooling and decompression experiments produce similar Na and . This may mean
345
that the distinction between ∆T (related to cooling process) and ∆Teff is useless when a single fast
346
step of cooling and decompression occurs. 347
The nucleation of large amount of crystals (tabular and acicular crystal intergrowth) was favored 348
at low pressure (Figs 4, 7 and 8) and not necessarily at low ∆T, instead it was reduced at high 349
pressure (Figs 5, 7 and 8), highlighting that a small decrease in pressure can induce a dramatic 350
increase of crystallinity. 351
352
5.2 Experimental vs natural materials 353
The experiments produced material texturally comparable with natural products, although the 354
pyroxene occurrence represents the most important discrepancy. This may depend on the starting 355
experimental conditions as pyroxenes are already contained in ZAC, and the oxygen fugacity of the 356
CSPV (~NNO+1 log units) may also be different in comparison to that of the Monte Nuovo system. 357
The alkali feldspar morphologies of natural samples (Fig. 3) are similar to in the experimental 358
ones (Figs 4 and 5). Experimental alkali feldspars are characterized by elongated rectangular 359
crystals and they occur in clots (Fig. 4) or isolated in the glass (Fig. 5), as in the natural pumices. 360
Both types of decompression experiments at 50 MPa produced similar textures to natural scoriae, 361
with high crystallinity and aligned tabular or elongated rectangular crystals (see Figs 3b and 5c), 362
also including magnetite and sodalite crystals (Table 4). These highly crystalline charges also show 363
vesicles with irregular margin similarly to the natural scoriae. Furthermore, the Or content of the 364
synthetic alkali feldspars and those of natural ones are similar (D’Oriano et al. 2005; Piochi et al. 365
2005; Piochi et al. 2008). 366
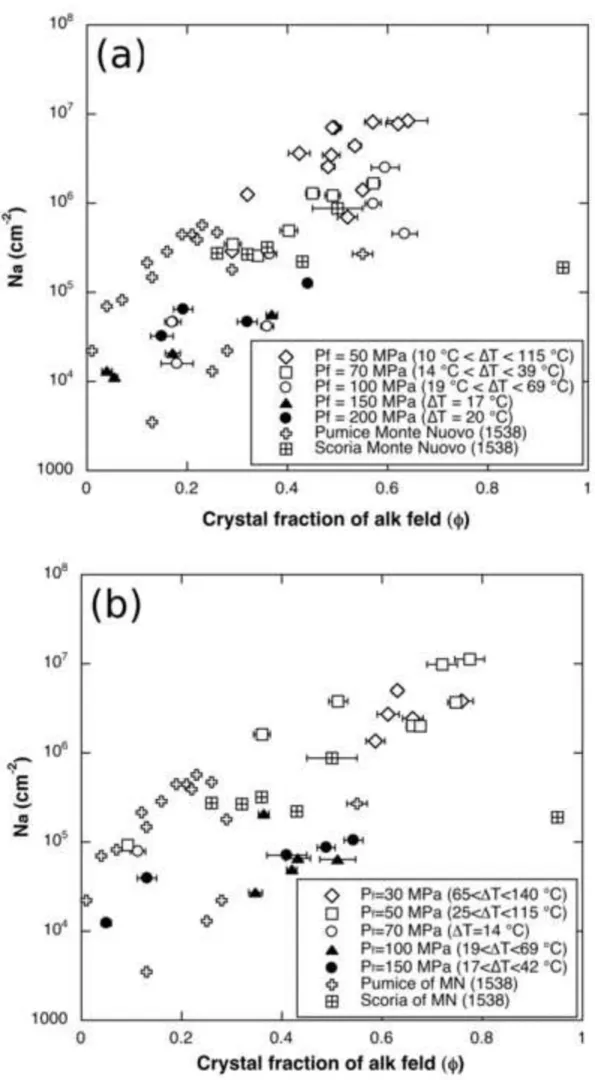
Diagrams in Fig. 9a and b allow quantitatively comparing experimental and natural crystalline 367
textures. Fig. 9a shows a relation between Na andobtained through cooling experiments, where
368
increases as growth dominates the crystallization process. Instead, Na increases as nucleation
369
dominates the process. In particular, Na increases as Pf (therefore water content) decreases (Fig.
370
9a), showing that PH2O and the water content have an important effect on textural evolution. Low
371
experimental pressure and low water content seems to enhance nucleation density, thus producing 372
more alkali feldspar nuclei. The diagram also suggests that natural alkali feldspars of the glassy 373
pumices must crystallize at ≥70 MPa, based on comparison of relative nucleation densities. 374
Sodalite absence and biotite occurrence in these samples support such barometric conditions. In 375
agreement with Mastrolorenzo and Pappalardo (2006), glassy pumices are characterized by low Na
376
of alkali feldspar. Moreover, of natural alkali feldsparsis between 0.01 and 0.30, suggesting a 377
crystallization event at low T, therefore crystallization temperature could be close to the liquidus 378
of alkali feldspar. Instead, data from more crystal-rich pumice and scoria resemble most closely 379
experimental samples produced at 70 MPa pressure, under less than 69 °C and 39 °C of ∆T (Arzilli 380
and Carroll, 2013), respectively. Nevertheless, these experiments do not reproduce sodalite. 381
Notably, the natural sample with ~0.95 (Fig. 9a; D’Oriano et al. 2005) could be reproduced at 382
high T (>60 °C), in agreement with the experiments performed in this study (D69, D78 and D62). 383
The holocrystalline texture probably requires low pressures (between 50 and 30 MPa) and more 384
time for crystal growth, supporting a possible origin involving magma stagnation in the conduit (in 385
agreement with D’Oriano et al. 2005). Hence, the sodalite occurrence should be due to the high 386
crystallinity and the enrichment of Cl in the residual melt (Carroll 2005). 387
The results of “decompression + cooling” and isothermal decompression experiments are shown 388
separately in Table 3, but for the discussion they are included together to have a wider range of 389
potential pre- and syn-eruptive conditions. Decompression experiments are characterized by two 390
populations of samples which have differences in nucleation density (Fig. 9b). The first population 391
at low pressure (30 MPa < Pf < 50 MPa) has values of Na between 106 and 107 cm−2, exceeding
392
values observed in the natural samples. In contrast, the second group off higher P experiments (100 393
MPa < Pf < 150 MPa), has values of Na between 104 and 105 cm−2, and closely resemble
394
observations on natural scoria and pumices. The experiments at 50 MPa (charge D81), 70 MPa 395
(charge D82), 100 MPa (charge D80) and 150 MPa (charge D55) are characterized by Na = 105
396
cm−2 and between 0.10 and 0.30 (see Table 3 and the results of Arzilli and Carroll, 2013), 397
therefore comparable with poorly crystallized natural pumice. As a whole, the of alkali feldspar = 398
0.01-0.30 in the pumice fragments implies T<50 °C, the increase up to 0.40-0.60 in the scoriae, as 399
well as the highest one at 0.95 (D’Oriano et al. 2005), requires higher T and low pressure. In 400
particular, scoriae trend toward experiments at ≤70 MPa in terms of Na and , as well as containing
401
traces of sodalite. 402
Experimental results suggest that crystallization of natural alkali feldspar occurred: i) between 403
200 and 70 MPa and, mostly 150-100 MPa (low T), at temperature between 750 °C and 825 °C, in 404
water saturated cooling conditions or/and ii) at >50, and mostly 150 MPa, at temperature between 405
750 and 840 °C, if melt decompressed. Furthermore, the absence or presence of sodalite crystals 406
indicate that natural glassy samples register P 50 MPa, whereas lower pressure corresponds to the 407
more crystalline brown pumices and scoriae. Thus, we constrain: the crystallization in the brown 408
pumice and scoriae occurred over a longer time compared with pumice sample crystallization. 409
Furthermore, for water saturated conditions and in the 200-50 MPa pressure range, temperature 410
850 °C means that conditions are always above the alkali feldspar liquidus. Therefore, natural 411
alkali feldspar crystallization between 200 and 150 MPa needs temperature of 750-775 °C, or 800-412
825 °C at 100 to 70 MPa, or 840-860 °C at 50 MPa. 413
414
5.3 Magma residence time deduced from growth rates and CSDs 415
Measurements of Crystal Size Distribution (CSD), when combined with experimental growth 416
rate data for alkali feldspar (YL), can help us to better constrain the time of magma crystallization
417
just before fragmentation (e.g., Marsh 1988; Cashman and Marsh 1988; Higgins 1996; Armienti et 418
al. 2007). Following Piochi et al. (2005) and D’Oriano et al. (2005), these times may correspond to 419
the time of magma crystallization in the chamber (cooling-dominated conditions) or to magma 420
movements in the volcanic conduit (decompression-dominated conditions). 421
We use new data on both CSDs (Fig. 6) and feldspar growth rate in recalculating crystallization 422
times (tr) for the Monte Nuovo magma. The estimated growth rate (YL) mostly varies between
423
1.1*10-8 and 7.2*10-7 cm/s (considering YL obtained in this study and from Arzilli and Carroll,
424
2013), with an isolated higher value at 1.2*10-6 cm/s and the mean YL equal to 2.21*10-7 cm/s
425
(Table 5). Because the crystal growth rate varies by up to two orders of magnitude, significant 426
variations of the magma timing must be expected. Therefore, the crystallization time is from few 427
months to few hours. However, the mean YL suggests that magma was stored for a few days in the
428
subsurface and the ascent lasted a few hours. Notably, the lower CSD slopes, i.e., the higher 429
residence times, characterize the most crystalline matrices. This is in agreement with the feldspar 430
chemistry detected by XRPD and reproduced in longer experiments (Supplementary Material 1). 431
432
5.4 Implication for magma dynamics 433
Experimental results suggest that the crystallization of alkali feldspars in magma erupted during 434
the Monte Nuovo eruption started between <200 and 100 MPa when temperature was close to the 435
liquidus of alkali feldspar (at least 825 °C). This is also supported by the few biotite in our natural 436
products (Supplementary Materials 1); in fact, previous experimental work and the present results 437
(see charges D20, D15, D17, D25 in Tables 1 and 2) on trachytic melts indicate the stability field of 438
biotite at pressure >135 MPa (Fabbrizio and Carroll 2008). Based on these results, we constrain the 439
pre-eruptive magma storage at a depth allowing the biotite crystallization, i.e., >4 km, comparable 440
or slightly higher than hypothesized in Piochi et al. (2005). Furthermore, our experimental data 441
indicate that the early erupted Monte Nuovo magma (LM unit) fragmented before reaching 50-70 442
MPa (~2 km of depth). Pre-eruptive pressure estimates (50-70 MPa) suggested by our results are in 443
agreement with the pre-eruptive fH2O of phlegraean magma at ~70 MPa estimated by Fabbrizio et
444
al. (2009), implying a repetitive behaviour for the volcanic system. Low ∆T can be suggested for 445
the early erupted products, in agreement with previous inferences (D’Oriano et al., 2005). Our 446
results indicate lower pressures for the later erupted magma (i.e., scoriae in the Upper Member) 447
registers. The high groundmass crystallinity with alkali feldspar as prevalent phase and the sodalite 448
occurrence in these later erupted fragments (Table 4) suggest effective undercoolings of several 449
hundreds °C (Fig. 9) and pressure of crystallization below 50 MPa. Notably, Mastrolorenzo and 450
Pappalardo (2006) also placed the fragmentation level of phlegraean volcanoes between 10 and 30 451
MPa, but without distinction among eruptive phases. Decompression was the main process 452
controlling the textures of the Monte Nuovo products, in agreement with occurrence of microlites 453
that are curved following the morphology of adjacent vesicles, suggesting that they grew 454
concomitantly with vesicles (Piochi et al., 2005; Piochi et al. 2008). In particular, our results 455
support the idea that open-system degassing promoted massive crystallization in later erupted 456
magma (Fig. 3), moving the melt towards the most evolved compositions observed (D’Oriano et al., 457
2005; Piochi et al., 2008). 458
The magma ascent from the storage (≤135 MPa) to fragmentation (≤50 MPa) pressures occurred 459
rapidly, with timescales on the order of hours suggested by our CSD results (see Table 5). Fabbrizio 460
and Carroll (2008) also suggested that the travel of the biotite-bearing phlegraean magma from 461
reservoir at depth of c. 7 km (~200 MPa) to the surface was rapid, based on dissolution rate data of 462
biotites (hours to a maximum of 1-2 days; Fabbrizio and Carroll, 2008). Low ascent rate results in 463
dissolution of biotite. Therefore, the magma ascent rate is estimated in 400-100 m/h from a depth 464
of 4-5 km (biotite-stable). Magma storage of some days in the shallow crust is indicated by the 465
occurrence of some phenocrysts (that forms slope >-10, Table 5, Fig. 6), whereas the smaller-sized 466
crystals (and the CSD with higher slopes; Table 5 and Fig. 6) were able to crystallize in few hours. 467
These results better constrain previous reconstruction of this eruption (Piochi et al. 2005; D’Oriano 468
et al. 2005). The detected CSD variation reflects the textural features of samples, resulting from 469
small differences in rates of magma ascent, crystallization, and degassing (see also D’Oriano et al. 470
2005; Piochi et al. 2005, 2008) during eruption. The LM vesicular pumices (early erupted; Fig. 1) 471
register the magmatic fragmentation generated by magma-water interaction following gas 472
expansion; while syn-eruptive outgassing-induced crystallization produced brown pumices and 473
scoriae (later erupted magma; Fig. 1) in the course of the eruption. The most crystalline and less 474
vesicular scoriae contain lower amount of H2O than LM microlite-poor and vesicle-rich pumices
475
(Piochi et al. 2008). 476
The Phlegraean trachyte can rapidly crystallize large crystal fractions of alkali feldspar, over 477
small pressure-temperature intervals, as shown in this experimental study, and this can strongly 478
modify the rheology of a trachytic magma, favoring rapid changes in eruptive style, if not the 479
ending of the eruption. The obtained results allow us to constrain the magma processes producing 480
the change in the eruptive style from pumice to scoria type deposits, due to an increase of magma 481
viscosity (Caricchi et al., 2008; Vona et al. 2013), quantitatively supporting the idea of D’Oriano et 482
al. (2005) about the plug generation in the volcanic conduit in the last eruptive phase. In fact, 483
values of between 0. and observed in the natural scoriae of Monte Nuovo produced in this 484
phase requires higher ∆T and lower P, as suggested from the experiments. Therefore, the same 485
experimental data indicates lowering water content, corroborating hypothesis of open degassing 486
conditions during the scoria eruption (D’Oriano et al. 2005; Piochi et al. 2008). The abundance of 487
crystals in the scoria deposits reaching values higher than 90% (D’Oriano et al. 2005) may be 488
related to high ∆T and low Pf (=PH2O) or long residence of the magma in shallower part (Pf < 50
MPa) of the conduit, as shown from our results (see samples D69, D78 and D62). ∆T can enhance 490
crystal fraction by increasing crystal nucleation rate, changing the magma rheology toward more 491
viscous behaviour as crystal content increases. This is in agreement with evidence showing that in 492
a closed magmatic system undergoing continuous decompression and cooling, crystal could only 493
become larger and more numerous with time (Wolf and Eichelberger 1997). Futhermore, Melnik 494
(2000) shows that the high viscosity value of the magma in the conduit is probably responsible for 495
increasing pressurization, and our results justify a potential overpressure in the conduit, which may 496
have triggered the final vulcanian explosion of Monte Nuovo. 497
Finally, the coexistence of pumices with different vesicle and microlite textures (for example, 498
samples LM inf l, LM in d and LM c3) suggests a complex process of magma ascent dynamics. 499
Mingling between magmas that reached the surface through different pathways and pressure-500
temperature-time conditions in the subsurface or, following D’Oriano et al. (2005), the horizontal 501
zoning of magma conditions in the conduit are possibilities to be further investigated. 502
503
6. Conclusion 504
The comparison between experimental data and data from natural samples furnishes a set of P-T-505
H2O content conditions for trachytic magmas valid for the Monte Nuovo eruption, at the Campi
506
Flegrei. The cooling and decompression experiments allowed reproducing textures observed in 507
pumices and scoriae produced during the 1538 AD eruption. First, the obtained results indicate that 508
the juvenile pyroclastic components i) represent the magma at or near the fragmentation surface and 509
ii) register the magma condition within the volcanic conduit. Also, this eruption requires a water-510
saturated magma stored at around 135 MPa, near the liquidus temperature of alkali feldspar; its 511
ascent toward the surface lasted a few hours to several days. Months of magma crystallization are 512
registered in some pyroclastic fragments. Therefore, the intense seismicity, gas emissions and 513
ground deformations described by the historical chronicles (see Guidoboni and Ciucciarelli 2011 514
and references therein) in the months before the eruption are phenomena related to the volcanic 515
unrest. Our results, instead, suggest that the low seismicity and gas emissions that affected the 516
Campi Flegrei area prior to at least 1530-1536 AD are not directly connected to the unrest and 517
should be related either to the deeper magmatic system or to the hydrothermal environment. Our 518
results do not furnish direct information concerning what triggered the eruption at Monte Nuovo. 519
As a whole, this experimental study offers a set of pressure, temperature and undercooling (water 520
saturated) conditions, useful to constrain the timescale and to better understand the magma behavior 521
of numerous phlegraean eruptions, starting from the texture of their eruptive products. In fact, alkali 522
feldspar is the main crystal phase in the phlegraean rocks and, as shown for the Monte Nuovo 523
eruption, its crystallization could be started between 7 and 4 km depth (≤200 MPa) and proceed in 524
the conduit, where the magma ascent was faster and texture was effectually frozen in, located 525
mostly between 2 and 3 km (50-70 MPa). The sodalite absence in most of the natural samples 526
impies that magmas generally fragmented before reaching 30-50 MPa (pressure for sodalite 527
stability) or magmas stored at these levels only occasionally were erupted. Furthermore, the 528
temperature of the magma, in pre-eruptive conditions, is most likely between 825 and 840 °C (close 529
to the liquidus of alkali feldspar). Notably, this study allows us to tentatively forecast the pre-530
eruptive magma conditions and timescales of future events in the Campi Flegrei area. 531
532
Acknowledgements 533
This work was supported by the 2005–2006 INGV-DPC project V3-2/UR14 (M. Piochi) and 534
PRIN 2009 (R. Moretti), FAR 2012 (M. R. Carroll). The authors are indebted to N. Cennamo (II 535
University of Napoli, Napoli, Italy) for help with the BSE image acquisition and Luigi Zeni (II 536
University of Napoli, Napoli, Italy) that allowed access to the laboratory. The VULCAMED 537
project provided funds to install in October 2012 the XRD laboratory at the Istituto Nazionale di 538
Geofisica e Vulcanologia, in Naples. We would like to thank P. Scarlato, C. Freda and A. Cavallo 539
for assistance with the SEM at INGV, Rome. We thank also Prof. M. W. Schmidt for providing 540
SEM access at ETH of Zurich (Institute of Geochemistry and Petrology). We also thank P. Landi 541
for SEM analysis and M. R. Cicconi for assistance during experiments. 542
543 544
References 545
Abramoff MD, Magalhaes PJ, Ram SJ (2004) Image Processing with ImageJ. Biophotonics 546
International 11:36-42 547
Armienti P, Francalanci L, Landi P (2007) Textural effects of steady state behaviour of the 548
Stromboli feeding system. J Volcanol Geoth Res 160:86-98 549
Arzilli F, Carroll MR (2013) Crystallization kinetics of alkali feldspars in cooling and 550
decompression-induced crystallization experiments in trachytic melt. Contrib Mineral Petrol 551
166:1011–1027 552
Boivin P, Bourdier JL, Camus G, de Goer de Herve A, Gourgaud A, Kieffer G, Mergoil JM, 553
Vincent PM, Auby R (1982) Influence de la Nature des Magmas sur l'Activité 554
Phreatomagmatique: Approche Volcanologique et Thermodynamique. Bull Volcanol 45:25-39 555
Calzolaio M, Arzilli F, Carroll MR (2010) Growth rate of alkali feldspars in decompression-556
induced crystallization experiments in a trachytic melt of the Phlegraean Fields (Napoli, Italy). 557
Eur J Mineral 22:485-493 558
Caricchi L, Giordano G, Burlini L, Ulmer P, Romano C (2008) Rheological properties of magma 559
from the 1538 eruption of Monte Nuovo (Phlegrean Fields, Italy): An experimental study. 560
Chemical Geology 256: 158-171 561
Carroll MR (2005) Chlorine solubility in evolved alkaline magmas. An Geophys 48: 619-631 562
Cashman KV, Marsh BD (1988) Crystal size distribution (CSD) in rocks and the kinetics and 563
dynamics of crystallization II: Makaopuhi lava lake. Contrib Mineral Petrol 99:292–305 564
Couch S, Sparks RSJ, Carroll MR (2003) The kinetics of degassing- induced crystallization at 565
Soufriere Hills volcano, Montserrat. J Petrol 44:1477–1502 566
Del Gaudio C, Aquino I, Ricciardi G.P, Ricco C, Scandone R (2010) Unrest episodes at Campi 567
Flegrei: A reconstruction of vertical ground movements during 1905–2009. J Volcanol 568
Geotherm Res 195:48–56 569
Di Girolamo P, Ghiara MR, Lirer L, Munno R, Rolandi G, Stanzione D (1984) Volcanology and 570
petrology of Campi Flegrei. Boll Soc Geol It 103:349-413 571
Di Matteo V, Carroll MR, Behrens H, Vetere F, Brooker R (2004) Water solubility in trachytic 572
melts. Chem Geol 213:187-196 573
Di Renzo V, Arienzo I, Civetta L, D’Antonio M, Tonarini S, Vito MD, Orsi G (2011) The 574
magmatic feeding system of the Campi Flegrei caldera: Architecture and temporal evolution. 575
Chem Geol 281:227-241 576
Di Vito M, Lirer L, Mastrolorenzo G, Rolandi G (1987) The 1538 Monte Nuovo eruption (Campi 577
Flegrei, Italy). Bull Volcanol 49:608-615 578
Di Vito MA, Isaia R, Orsi G, Southon J, de Vita S, D’Antonio M, Pappalardo L, Piochi M (1999) 579
Volcanism and deformation since 12,000 years at the Campi Flegrei caldera (Italy). J Volcanol 580
Geoth Res 91:221-246 581
D’Oriano C, Poggianti E, Bertagnini A, Cioni R, Landi P, Polacci M, Rosi M (2005) Changes in 582
eruptive style during the A.D. 1538 Monte Nuovo eruption (Phlegrean Fields, Italy): the role of 583
syn-eruptive crystallization. Bull Volcanol 67:601-621 584
Dowty E (1980) Crystal growth and nucleation theory and the numerical simulation of igneous 585
crystallization. In: Hargraves RB (ed) The physics of magmatic processes. Princeton University 586
Press, Princeton, NJ, pp 419–485 587
Fabbrizio A, Carroll MR (2008) Experimental constraints on the differentiation process and pre-588
eruptive conditions in the magmatic system of Phlegraean Fields (Naples, Italy). J Volcanol 589
Geoth Res 171:88-102 590
Fabbrizio A, Scaillet B, Carroll MR (2009) Estimation of pre-eruptive magmatic water fugacity in 591
the Phlegrean Fields, Naples, Italy. Eur J Mineral 21:107–116 592
Fedele L, Scarpati C, Lanphere M, Melluso L, Morra V, Perrotta A, Ricci G (2008) The Breccia
593
Museo formation, Campi Flegrei, southern Italy: geochronology, chemostratigraphy and
594
relationship with the Campanian Ignimbrite eruption. Bull Volcanol 70:1189-1219
595
Fedele L, Insinga D, Calvert A, Morra V, Perrotta A, Scarpati C (2012) Reply to the comment on 596
the article 40Ar/39Ar dating of tuff vents in the Campi Flegrei caldera (southern Italy): toward a 597
new chronostratigraphic reconstruction of the Holocene volcanic activity by Isaia et al. Bull 598
Volcanol 74:1-3 599
Geschwind C, Rutherford MJ (1995) Crystallization of microlites during magma ascent: the fluid 600
mechanics of 1980-1986 eruptions at Mount St Helens. Bull Volcanol 57:356–370 601
Guidoboni E, Ciuccarelli C (2011) The Campi Flegrei caldera: historical revision and new data on 602
seismic crises, bradyseisms, the Monte Nuovo eruption and ensuing earthquakes (twelfth century 603
1582 AD). Bull Volcanol 73:655–677 604
Hammer JE, Rutherford MJ (2002) An experimental study of the kinetics of decompression-605
induced crystallization in silicic melt. J Geophys Res 107:2021 606
Higgins MD (1996) Magma dynamics beneath Kameni volcano, Thera Greece, as revealed by 607
crystal size and shape measurements. J Volcanol Geoth Res 70:37-48 608
Higgins MD (2000) Measurements of crystal size distributions. Am Mineral 85:1105–1116 609
Higgins MD (2002) Closure in crystal size distributions (CSD), verification of CSD calculations, 610
and the significance of CSD fans. Am Mineral 87:171–175 611
Kirkpatrik RJ (1975) Crystal growth from a melt: a review. Am Mineral 60:798–814 612
Isaia R, Marianelli P, Sbrana A (2009) Caldera unrest prior to intense volcanism in Campi Flegrei 613
(Italy) at 4.0 ka B.P.: Implications for caldera dynamics and future eruptive scenarios. Geophys 614
Res Lett 36: L21303 615
Le Bas MJ, Le Maitre RW, Streckeisen A, Zanettin B (1986) A chemical classification of volcanic 616
rocks based on the total alkali-silica diagram. J Petrol 27: 745-750 617
Lirer L, Luongo G, Scandone R. (1987). On the volcanological evolution of Campi Flegrei. Eos 618
Trans AGU 68:226 619
Marsh BD (1988) Crystal size distribution (CSD) in rocks and the kinetics and dynamics of 620
crystallization. Contrib Mineral Petrol 99:277–291 621
Marsh BD, (1998) On the interpretation of crystal size distributions in magmatic systems. J Petrol 622
39:553–599 623
Martel C (2012) Eruption dynamics inferred from microlite crystallization experiments: Application 624
to Plinian and dome-forming eruptions of Mt Pelée e (Martinique, Lesser Antilles). J Petrol 625
53:699-725 626
Mastrolorenzo G, Pappalardo L (2006) Magma degassing and crystallization processes during 627
eruptions of high-risk Neapolitan-volcanoes: Evidence of common equilibrium rising processes 628
in alkaline magmas. Earth Planet Sci Lett 250:164–181 629
Melnik O (2000) Dynamics of two-phase conduit flow of high-viscosity gas- saturated magma: 630
large variations of sustained explosive eruption intensity. Bull Volcanol 62:153–170 631
Melluso L , Morra V, Annamaria Perrotta A, Scarpati C, Adabbo M (1995) The eruption of The 632
Breccia Museo (Campi Flegrei, Italy) : Fractional crystallization processes in a shallow, zoned 633
magma chamber and implications for the eruptive dynamics. J Volc Geophys Res 68:325-339 634
Mormone A, Piochi M, Bellatreccia F, De Astis G, Moretti R, Ventura GD, Cavallo A, 635
Mangiacapra A (2011) A CO2-rich magma source beneath the Phlegraean Volcanic District
636
(Southern Italy): Evidence from a melt inclusion study. Chem Geol 287:66–80 637
Mormone A, Piochi M, Troise C, De Natale G (2014). Il laboratorio di Diffrattometria a raggi X 638
dell’Osservatorio Vesuviano (Istituto Nazionale di Geofisica e Vulcanologia, Napoli): 639
identificazione e stima quantitativa delle fasi in campioni polverizzati. Rapporti tecnici INGV, 640
279: 7-21, ISSN 2039-7941 641
Parascandola A (1947) I fenomeni bradisismici del Serapeo di Pozzuoli. Genovese, Napoli 642
Piochi M, Mastrolorenzo G, Pappalardo L (2005) Magma ascent and eruptive processes from 643
textural and compositional features of Monte Nuovo pyroclastic products, Campi Flegrei, Italy. 644
Bull Volcanol 67:663– 678 645
Piochi M, Polacci M, De Astis G, Zanetti A, Mangiacapra A, Vannucci R, Giordano D (2008) 646
Texture and composition of pumices and scoriae from the Campi Flegrei caldera (Italy): 647
Implications on the dynamics of explosive eruptions. Geochem Geophys Geosyst 9:Q03013 648
Rosi M, Sbrana A, Principe C (1983) The Phlegrean Fields: structural evolution, volcanic history 649
and eruptive mechanism. J Volcanol Geotherm Res 17:273-288 650
Rosi M, Sbrana A (1987) The Phlegrean Fields. CNR Quaderni di La Ricerca Scientifica di La 651
Ricerca Scientifica 652
Schneider CA, Rasband WS, Eliceiri KW (2012) NIH Image to ImageJ: 25 years of image analysis. 653
Nature Methods 9:671-675 654
Smith VC, Isaia R, Pearce N (2011) Tephrostratigraphy and glass compositions of post-15 kyr 655
Campi Flegrei eruptions: implications for eruption history and chronostratigraphic markers. Quat 656
Scie Rev 30: 3638-3660 657
Swanson SE (1977) Relation of nucleation and crystal-growth rate to the development of granitic 658
textures. Am Mineral 62:966–978 659
Vona A and Romano C (2013) The effects of undercooling and deformation rates on the
660
crystallization kinetics of Stromboli and Etna basalts. Contrib Mineral Petrol 166(2):491-509
661
Wolf KJ, Eichelberger JC (1997) Syneruptive mixing, degassing, and crystallization at Redoubt 662
Volcano, eruption of Decem- ber 1989 to May 1990. J Volcanol Geoth Res 75:19–37 663
Figure captions 665
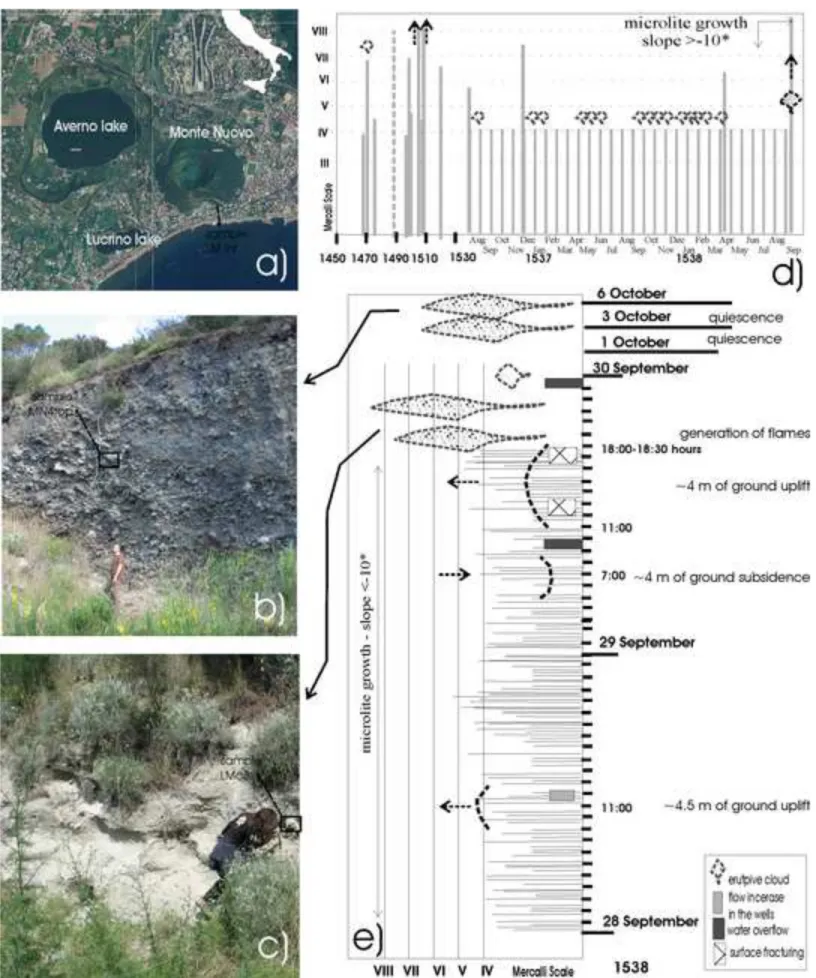
666
Figure 1: The Monte Nuovo tuff cone location (a) with image of the lowermost ash- to sand- 667
levels and the uppermost scoria deposits (b and c, respectively). The diagrams show the timing of 668
the phenomena preceding the eruption since 1470 AD (d) and 1538 (e), on the basis of Guidoboni 669
and Ciucciarelli (2011). The d and e diagrams indicate the time of occurrence for seismicity 670
(vertical bars), flow output (cloud) and ground deformation (arrows and dotted lines, right 671
concavity meaning inflation and viceversa). The relation between phenomena and outcrops is also 672
indicated. The onset for microlite growth as suggested by CSD is also indicated. The brown pumice 673
and scoria samples location is indicated by black boxes in panels a and b. The sampling site of the 674
early erupted yellow pumices of LM inf d and LM inf l is in panel a. 675
676
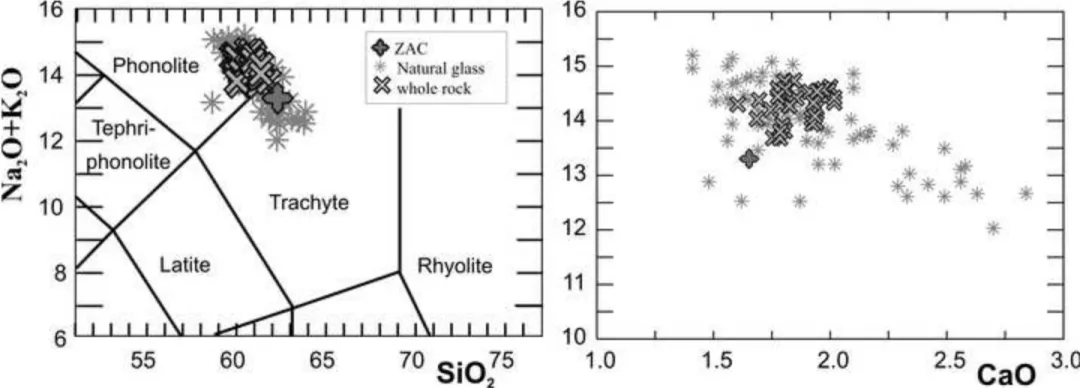
Figure 2: TAS (Le Bas et al. 1986), on the left, and Alkali vs. CaO, on the right, diagrams for the 677
Monte Nuovo natural glasses and ZAC bulk rock. Data on natural glass and whole-rocks from 678
Piochi et al. (2008), Rosi and Sbrana (1987), D’Oriano et al. (2005). 679
680
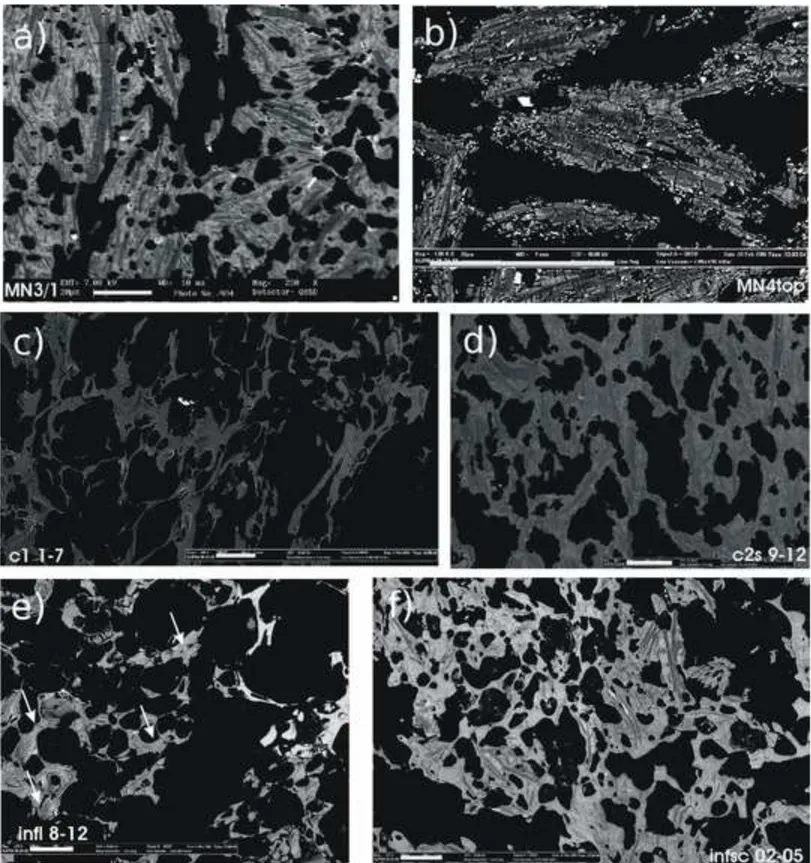
Figure 3: I have changed contrast-maybe better to see phases Groundmass texture of natural 681
pumice (samples: c1 1-7, c2s 9-12, infl 8-12, infsc 02-05) and scoriae (samples: MN3/1, MN4top) 682
from base upwards in the stratigraphic sequence. Samples MN3/1 (a) and MN4top (b) are two 683
scorias upwards in the sequence. Note the cuspate shape of vesicle and the magnetite occurrence in 684
the most crystallized and low-vesicular MN4top. Samples c1 1-7 (c) and c2s 9-12 (d) evidence the 685
groundmass crystallinity and vesicularity feature of a yellowish and a brown pumice, respectively, 686
within the main pyroclastic unit. Note the microlite alignment and the curved shape of several 687
crystals. Rare microlites and high vesiculation of pumice at the base of the flow sequence. In 688
particular, sample infl 8-12 (e) shows the cracks (white arrows) produced by water/magma 689
interaction. Sample infsc 02-05 (f) is a banded pumice within the main pyroclastic unit 690
characterized by low crystal abundance and higher vesiculation of yellowish band (on the left) with 691
respect of the adjacent brown sector. White bars are 100 µm. 692
693
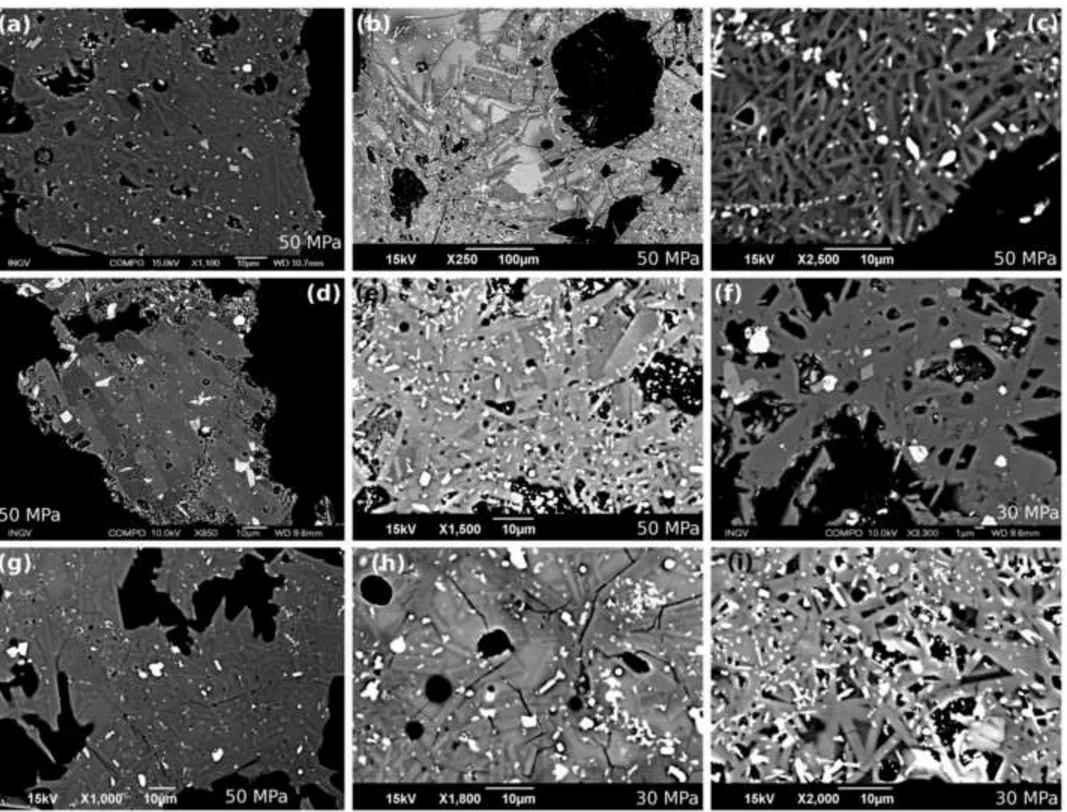
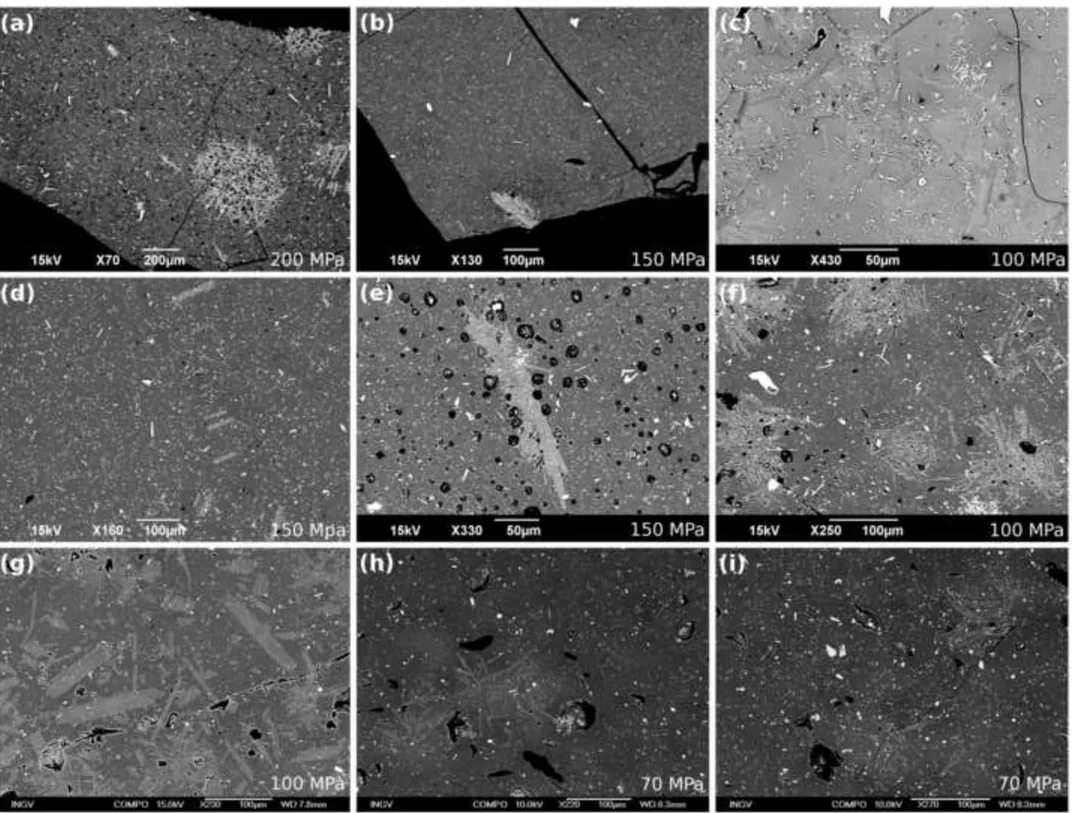
Figure 4: Backscattered SEM images of textures obtained at low pressure (50 and 30 MPa) from 694
isobaric cooling, “decompression+ cooling” and isothermal decompression experiments. Cooling 695
experiments: (a) D33 (Pf =50 MPa, T = 25 °C); (b) D10 (Pf =50 MPa, T = 40 °C); (c) D69 (Pf
696
=50 MPa, T = 115 °C). “Decompression+ cooling” experiments: (d) D45 (Pf =50 MPa, T = 115
697
°C); (e) D43 (Pf =50 MPa, T = 115 °C); (f) D47 (Pf =30 MPa, T = 140 °C). Isothermal
698
decompression experiments: (g) D57 (Pf =50 MPa, T = 40 °C); (h) D60 (Pf =30 MPa, ; T = 65
699
°C); (i) D62 (Pf =30 MPa, T = 65 °C). The samples D33, D10, D69 and D62 were performed in
700
this study, the other ones are data of Arzilli and Carroll (2013). 701
702
Figure 5: Backscattered SEM images of textures obtained at high pressure (200, 150, 100 and 70 703
MPa) from isobaric cooling, “decompression+ cooling” and isothermal decompression experiments. 704
Cooling experiments: (a) D1 (Pf =200 MPa, T = 20 °C); (b) D15 (Pf =150 MPa, T = 17 °C); (c)
705
D6 (Pf =100 MPa, T = 19 °C). “Decompression+ cooling” experiments: (d) D17 (Pf =150 MPa,
706
T = 17 °C); (e) D55 (Pf =150 MPa, T = 42 °C); (f) D51 (Pf =100 MPa, T = 69 °C). Isothermal
707
decompression experiments: (g) D80 (Pf =100 MPa, T = 19 °C); (h) D82 (Pf =70 MPa, ; T = 14
708
°C); (i) D82 (Pf =70 MPa, T = 14 °C). The samples D15, D6 and D17 were performed in this
709
study, the other ones are data of Arzilli and Carroll (2013). 710
711
Figure 6: CSDs of early erupted low-crystalline and highly vesicular pumice (left), brown 712
pumices intermediate in the stratigraphic sequence (central diagram) and scoriae (right diagram). 713
Note the occurrence of two microlites population and the similarity of slopes of smaller microlites. 714
Figure 7: The relation of and Na with Pf, ∆T and texp in cooling experiments. (a) Relation
716
between crystal fraction of alkali feldspar () and ∆T as a function of Pf. (b) Relation between
717
crystal fraction of alkali feldspar () and texp as a function of Pf and ∆T. (c) Relation between Na and
718
∆T as a function of Pf. (d) Relation between Na and texp as a function of Pf and ∆T.
719 720
Figure 8: The relation of and Na with Pf, ∆T and texp in “decompressio+cooling” and isothermal
721
decompression experiments. (a) Relation between crystal fraction of alkali feldspar () and ∆T as a 722
function of Pf. (b) Relation between crystal fraction of alkali feldspar () and texp as a function of Pf
723
and ∆T. (c) Relation between Na and ∆T as a function of Pf. (d) Relation between Na and texp as a
724
function of Pf and ∆T.
725 726
Figure 9: Na vs . a) Relation between Na (nucleation density) and (crystallinity) as a function
727
of Pf and ∆T for cooling experiments and natural samples of Monte Nuovo (pumices and scoriae);
728
b) relation between Na and as a function of Pf and ∆T for both types of decompression
729
experiments and natural samples of Monte Nuovo (pumices and scoriae). 730
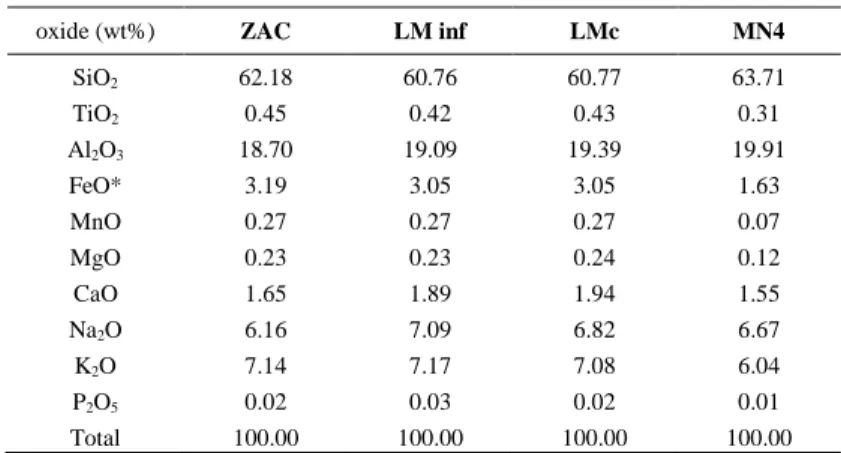
Table 1: Chemical composition of ZAC (from Di Matteo et al. 2004) and average for natural
samples from units selected for this study (see Piochi et al., 2008 for not H2O-free normalized data).
FeO* = total iron as FeO.
oxide (wt%) ZAC LM inf LMc MN4
SiO2 62.18 60.76 60.77 63.71 TiO2 0.45 0.42 0.43 0.31 Al2O3 18.70 19.09 19.39 19.91 FeO* 3.19 3.05 3.05 1.63 MnO 0.27 0.27 0.27 0.07 MgO 0.23 0.23 0.24 0.12 CaO 1.65 1.89 1.94 1.55 Na2O 6.16 7.09 6.82 6.67 K2O 7.14 7.17 7.08 6.04 P2O5 0.02 0.03 0.02 0.01 Total 100.00 100.00 100.00 100.00 Table 1