1
PhD course in Biochemistry
XXXIII Cycle (Academic year 2017-2020)
Aberrant protein O-GlcNAcylation promotes
Alzheimer-like neuropathology
PhD Student Ilaria Zuliani
Tutor PhD Coordinator
2
1. INTRODUCTION ………...5
1. Protein O-GlcNAcylation………...5
1.1 The hexosamine biosynthetic pathway……….………..6
1.2 Enzymes regulating O-GlcNAc cycling………...9
1.2.1 O-GlcNAc transferase (OGT)………....9
1.2.2 O-GlcNAcase (OGA)………...12
1.3 Crosstalk between protein O-GlcNAcylation and phosphorylation ………..14
2. Down syndrome………..16
2.1 Aging in Down syndrome and the development of Alzheimer-like dementia………..17
2.1.1. Down syndrome and APP processing……….…...20
2.1.2. Down syndrome and tau protein………....22
2.1.3. Metabolic alterations in Down syndrome………..25
2.2 Role of altered O-GlcNAcylation in Alzheimer’s Disease progression………..…31
3. Metabolic disease and neurodegeneration………..34
3.1 High-fat-diet in mice: a model of metabolic-induced cognitive decline……….36
3.2 Role of O-GlcNAcylation in metabolic disease………...38
2. AIM OF THE WORK……….………41
3. MATERIAL AND METHODS………..43
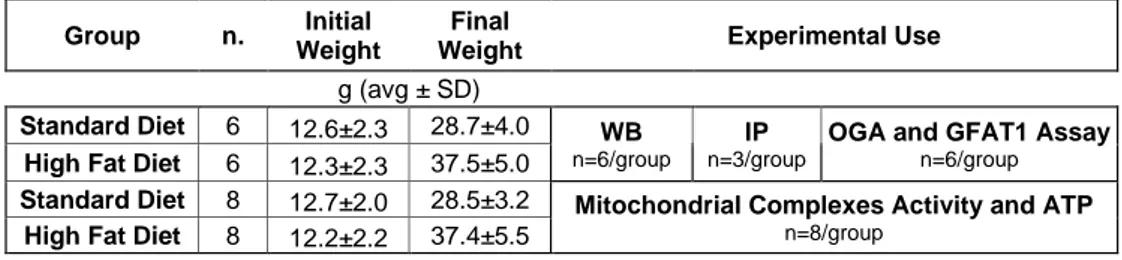
3.1 Animal models……….43
3.2 High-fat-diet……….45
3.3 Thiamet-G intranasal treatment………....46
3 3.5 Western blot……….48 3.6 Slot blot………51 3.7 Immunoprecipitation………50 3.8 OGA Assay……….….53 3.9 GFAT1 Assay………...54
3.10 RNA extraction and quantitative Real-Time PCR……… 56
3.11 Aβ 1-42 ELISA………..57
3.11 Respiratory chain complexes activity and ATP homeostasis....57
3.12 Statistical analysis………..58
4. RESULTS………...………...59
4.1 Project 1: The dysregulation of OGT/OGA cycle mediates tau and APP neuropathology in Down syndrome………..59
4.1.1 Ts2Cje mice show an aberrant and tissue-specific O-GlcNAcylation profile at 6-months of age……….59
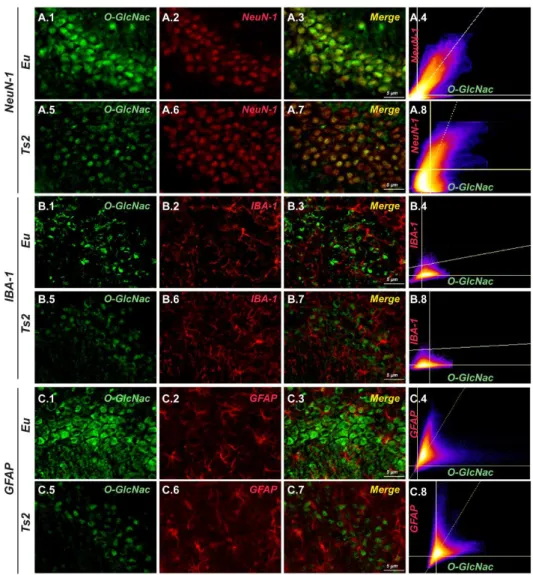
4.1.2 The reduction of O-GlcNAcylated proteins in the hippocampus of 6-months-old Ts2Cje is area and cell-type specific...62
4.1.3. Reduced O-GlcNAcylation results from the dysregulation of OGT/OGA cycle……….66
4.1.4 The aberrant O-GlcNAc/phosphorylation ratio of tau and APP drives Alzheimer-like neurodegeneration in Ts2Cje mice……….69
4.1.5 Ts2Cje mice show alteration of the HBP and the induction of the insulin cascade………..71
4.1.6 Intranasal Thiamet G rescued aberrant protein O-GlcNAcylation and OGA activity in 6-months-old Ts2Cje...74
4
4.1.7 Intranasal Thiamet G rescued aberrant APP and tau PTMs
in Ts2Cje hippocampus………..78
4.1.8 Thiamet G treatment boosts autophagic clearance an reduced oxidative damage in 6-months-old Ts2Cje mice……..82
4.2 Project 2: High fat diet leads to aberrant protein O-GlcNAcylation and the development of Alzheimer’s Disease signatures in mice……….87
4.2.1 HFD mice shown an aberrant and tissue-specific O-GlcNAcylation profile………..….87
4.2.2 The HBP flux is impaired in HFD mice compared to SD…...92
4.2.3 Alzheimer’s disease hallmarks in HFD mouse brain………..96
4.2.4 High-fat-diet affects mitochondrial function………...98
5. DISCUSSION……….102
6. Conclusions……….112
7. References………...113
5
1. INTRODUCTION
1. Protein O-GlcNAcylation
Protein post-translational modification (PTM) enables cells to promptly adapt to different stimuli trough the direct and dynamic control of protein functions. Considering their importance, a great deal of effort has been put over the years into understanding the role of most common PTMs such as phosphorylation, ubiquitylation and acetylation in cell physiology. However, beyond these well-characterized modifications, there are few others PTMs whose role is far from being understood. Among these, protein O-GlcNAcylation is the most recently discovered and has emerged as very abundant in cells with a prominent role in a wide range of cellular processes.
Protein O-GlcNAcylation was first discovered in the early 1980s by Hart et al. when bovine milk galactosyltransferase, in conjunction with UDP-[3H] galactose, was used to probe for accessible N-acetylglucosamine (GlcNAc) moieties on glycoconjugates of living cells. This study revealed the presence of O-glycosidically linked GlcNAc on lymphocyte cell-surface proteins1. Subsequent analysis clarified that O-linked GlcNAc monosaccharide residues are present in most intracellular compartments and are particularly abundant in cytoplasmic, nuclear and mitochondrial proteins2,3.
O-GlcNAcylation differs in many aspects from other forms of canonical protein glycosylation: (I) O-GlcNAc is not elongated to form more complex glycan structures; (II) unlike other O-glycosylation the addiction of O-GlcNAc does not typically occur in the Golgi apparatus; (III) O-GlcNAc is almost exclusively found in nuclear, cytoplasmic and mitochondrial proteins rather than membrane and secretory proteins; (IV) O-GlcNAcylation occurs through
6
a highly dynamic process that involves the rapid addiction and removal of the sugar from serine and threonine residues4,5. This dynamic process seems to be unique to this glycosylation motif and gives to O-GlcNAc the ability to modulate protein functions, cellular signalling and transcription regulatory pathways in response to nutrients and stress3,6,7. After decades of study, more than one thousand O-GlcNAcylated proteins have been identified in viruses, bacteria, plants and animals and this number continues to rapidly grow as the technology for the detection of O-GlcNAc improves. O-GlcNAc-proteome, although not yet complete, has revealed a diverse set of proteins engaged in numerous cellular functions. Indeed, protein involved in functions ranging from carbohydrate metabolism, signalling, transcription and stress response are well represented in the GlcNAc-proteome. In this sense, O-GlcNAcylation has a great similarity with protein phosphorylation and shares with this PTM the ability to transiently modulate protein function according to cellular state7.
1.1 The hexosamine biosynthetic pathway
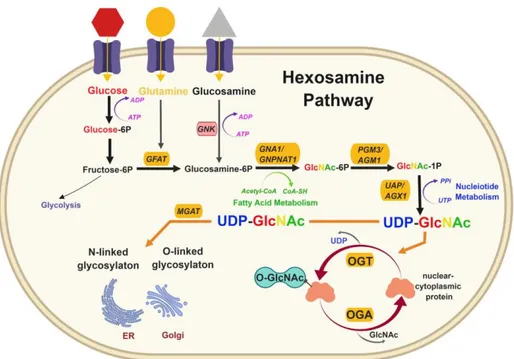
The sugar substrate for O-GlcNAcylation is provided by a specific metabolic pathway named the hexosamine biosynthetic pathway (HBP), which integrates extracellular physiological inputs, including nutrient availability, with the metabolism of carbohydrate, amino acid, nucleotide and fatty acid components to produce UDP-GlcNAc8. Upon entering the cell by glucose transporting proteins (GLUT), glucose is converted to glucose-6-phosphate. Glucose-6-phosphate can undertake glycogen synthesis or, after conversion to fructose-6-phosphate, enter the glycolytic pathway. Whereas most of the glucose is consumed in these metabolic pathways, approximately 2-5% of intracellular glucose is channelled into the HBP to form UDP-GlcNAc.
7
Glutamine-fructose-6-phosphate amidotrasferase 1 (GFAT1) catalyses the first and rate-limiting step of the HBP, which converts fructuse-6-phosphate and glutamine into glucosamine-6-phosphate. GFAT1 activity is regulated by feedback inhibition by UDP-GlcNAc9,10 but also by other key sensors of cellular nutrient state. In this context, adenosine 3’-5’-monophosphate (cycling AMP)-dependent kinase (AMPK) is known to inhibit GFAT1 activity under nutrient depletion or stress conditions, in order to reduce the amount of nutrients entering the HBP flux11,12. In the subsequent step, the enzyme glucosamine-phosphate N-acetyltransferase (GNPNAT) catalyzes the acetylation of glucosamine-6-phosphate to generate N-acetylglucosamine-6-phosphate (GlcNAc-6P). This is followed by GlcNAc phosphomutase-mediated isomerization into GlcNAc-1-phosphate (GlcNAc-1-P). Finally, UTP from nucleotide metabolism and GlcNAc-1P produce UDP-GlcNAc through UDP-N-acetylglucosamine pyrophosphorylase enzyme. Moreover, free GlcNAc can be recycled via the GlcNAc savage pathway, which converts GlcNAc to GlcNA-6-phosphate that can be utilized by the HBP13,14. Since the HBP utilizes major metabolites to produce UDP-GlcNAc, cells use it as a sensor of energy/nutrients availability. As a result, O-GlcNAc signalling is highly sensitive to metabolic state and cellular stress (i.e. heat shock, hypoxia, nutrient deprivation), although the mechanisms mediating this response are only partially elucidated15.
8
Figure 1: The hexosamine biosynthetic pathway. The hexosamine biosynthetic pathway (HBP) is a minor branch of the glycolitic pathway that results in the production of UDP-GlcNAc, the activated substrate for protein O-GlcNAcylation. As the HBP flux integrates molecules from carbohydrate (fructose-6-phosphate), amino acid (glutamine/glucosamine), neucleotide (UTP) and lipid (Acetyl-CoA) metabolism, the production of UDP-GlcNAc is considered a valuable intracellular sensor of cell metabolic status. UDP-GlcNAc is the substrate for O-GlcNAc transferase (OGT), which catalyzes the post-translational modification of serine/threonine protein residues by O-linked β-N-acetylglucosamine (O-GlcNAc). Differing from most protein post-translational modifications, O-GlcNAcylation is regulated by a single enzyme for attachment (OGT) and a single enzyme for removal (OGA). This PTM is a dynamic and ubiquitous process that occurs predominantly in the cytosol and nucleus, affecting a diverse array of protein functions and transcriptional events.
9
1.2 Enzymes regulating O-GlcNAc cycling
Unlike other PTMs which are under the control of multiple writers and erasers, only two highly evolutionarily conserved enzymes are responsible for the cycling of O-GlcNAc on Ser/Thr residues of targeted proteins. The enzyme O-GlcNAc transferase (OGT) catalyses the addiction of the activated sugar UDP-GlcNAc produced by the HBP, whereas the enzyme O-GlcNAcase (OGA) is responsible for its rapid removal. Unlike protein phosphorylation, O-GlcNAcylation is not associated with a clear consensus motif and different mechanisms are responsible for target specificity of O-GlcNAc cycling enzymes. These mechanisms appear to be built into the cellular machinery at multiple levels and include differences in structure and localization among OGT and OGA isoforms, post-translational modification of O-GlcNAc cycling enzymes and interactions with multiple accessory proteins, which address their actions toward specific substrate groups16. This complex regulation of O-GlcNAc cycling enzymes activity ensure the maintenance of O-O-GlcNAcylation homeostasis under different cellular conditions.
1.2.1 O-GlcNAc transferase (OGT)
Structure. OGT is ubiquitously expressed in all mammalian tissues but is most
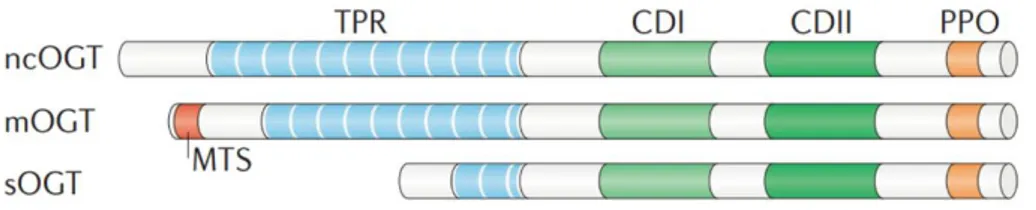
abundant in pancreas, brain, heart and skeletal muscle17,18. The human Ogt gene is located at the Xq13.1 genomic locus and is alternatively spliced to generate nucleocytoplasmic (nc), mitochondrial (m) and short (s) isoforms. These isoforms are distinguished by their N-terminal domains which contain diverse number of tetratricopeptide repeats (TPRs)19. Despite differences in their N-terminal domains, all OGT isoforms share a common C-terminal
10
domain which contains two catalytic regions responsible for their glycosyltransferase activity20. The OGT TPR-domain participates in substrate recognition and is necessary for the glycosylation of numerous substrates such as nucleoporin 62 and the RNA pol II C-domain21,22. Furthermore, growing evidences suggest that the TPR-domain may also influence OGT selectivity by mediating its oligomerization and the transient interaction with accessory proteins. As a matter of fact, heterotrimeric OGT complexes have been reported in tissues such as kidney, spleen, liver and pancreas23–25 and multimerization of OGT into homo-oligomers has also been observed26. Mutations of TPR-domain prevent the formation of OGT multimers and attenuate O-GlcNAcylation of selected substrates, suggesting that OGT-OGT association may favour interactions with certain targets27.
Figure 2: Schematic representation of O-GlcNAc transferase (OGT) isoforms.
The nucleocytoplasmic (ncOGT), mitochondrial (mOGT) and short (sOGT) isoforms of OGT differ in length owing to variable numbers of amino-terminal tetratricopeptide repeats (TPRs) but share common carboxy-terminal catalytic (CDI and II) and phosphoinositide-binding (PPO) domains. mOGT contains a unique N‑terminal mitochondrial targeting sequence (MTS).
Regulation. Considering the importance of maintaining O-GlcNAc
homeostasis, the regulation of OGT takes place at different levels ranging from post-translation modifications, subcellular partitioning of different isoforms and fluctuations of protein expression levels under certain stimuli. OGT itself
11
is both O-GlcNAcylated and phosphorylated at multiple Ser, Thr and Tyr residues26,28. Although the effect of OGT O-GlcNAcylation has still to be clarified, its phosphorylation on specific residues seems to be linked to its enzymatic activity. In this context, acute insulin stimulation is known to enhance insulin-receptor mediated OGT tyrosine phosphorylation and activity29. An interplay between OGT and the insulin-regulated mitotic protein glycogen synthase kinase (GSK3) has also been hypothesized. Indeed, GSK3β-mediated phosphorylation of OGT on Ser3 and 4 enhances OGT activity as well30. Interestingly, both Ser3 and 4 are also sites of O-GlcNAcylation30, supporting the idea of a cross-talk between O-GlcNAc and phosphorylation that may regulate the function of OGT itself. In addition, OGT can be phosphorylated by the nutrient-sensitive AMP-activated protein kinase (AMPK) on Thr444, regulating both OGT selectivity and nuclear localization31. Interestingly, both AMPK and GSK3β are OGT substrates and their activities are sensitive to global O-GlcNAc perturbation21,31,32, providing a perfect example of the dynamic regulation between O-GlcNAc cycling enzymes and kinase/phosphatase which is necessary for the coordination of protein signalling.
Although mechanisms controlling OGT intracellular trafficking are not well understood, different stimuli may influence OGT subcellular localization thus affecting OGT interaction with subsets of cellular proteome. In line with its nutrient-sensing role, insulin stimulation is known to promote OGT transfer from the nuclear compartment to the cytosol and plasma membrane in adipocytes and fibroblasts29,33. On the contrary, glucose-deprivation has proved to favour OGT cytosolic localization upon AMPK activation31. In this context, several AMPK subunits have shown to be dynamically modified by
12
GlcNAc and AMPK activation itself seems to be influenced by its O-GlcNAcylation state, defining a complex interplay between these enzymes31. These evidences suggest that the cellular metabolic state may not only influence OGT activity but also its subcellular localization and therefore its targets. Finally, OGT transcript and protein levels are known to fluctuate in response to various stimuli such as oxidative or nutrient stress34–36, consistent with the role of this enzyme as a sensor of cellular metabolic state. Growing evidence also suggests that tissue-specific regulation of OGT is impacted during physiological aging, thus contributing to the imbalance of O-GlcNAc cycling that characterize many age-related disorders37–39.
1.2.2. O-GlcNAcase (OGA)
Structure. The O-GlcNAcase (OGA) enzyme is a monomeric hexosaminidase
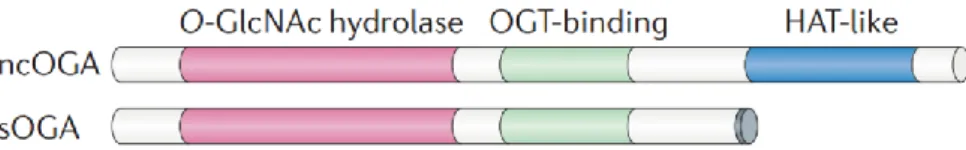
(~130kDa) ubiquitously expressed with a prevalent distribution in the brain, skeletal muscle and pancreas40–42. OGA is known to exert its optimal O-β-linked GlcNAc cleaving activity at near neutral pH41,43. This characteristic, together with its prevalent distribution into the nucleus and the cytosol, clearly distinguish this O-GlcNAc cycling enzyme from the acidic hexosaminidases located into the lysosomes40. Two different isoforms of OGA have been identified, a full-length protein (OGA) and a short isoform (sOGA), both arising from the alterative splicing of the human Mgea5 gene on chromosome
1040,44. Both OGA isoforms contain an N-terminal domain with glycosidase
activity, while just the full-length OGA is characterized by a C-terminal domain sharing homology with acetyl-transferase (AT) enzymes40. The functional role of the AT-like domain of OGA is still a matter of discussion. If on one hand a study by Toleman et al. reported an intrinsic histone
13
acetyltransferase activity of OGA in vitro45, a more recent study reported the lack of detectable binding between acetyl-CoA and the recombinant AT-like domain of human OGA46, possibly excluding its assumed AT activity.
Figure 3: Schematic representation of O-GlcNAcase (OGA) isoforms. The
nucleocytoplasmic (ncOGA) and short (sOGA) isoforms of OGA possess identical N‑terminal O‑GlcNAc hydrolase domains and central OGT-binding regions; however, sOGA lacks the C‑terminal histone acetyltransferase-like (HAT-like) domain that is present in ncOGA.
Regulation. Although O-GlcNAc cycling enzymes share common regulation
strategies, some mechanisms are still not fully elucidated. Even though the catalytic mechanism of OGA and its function in cellular homeostasis have been intensively studied, the regulation of this enzyme activity is poorly understood. A specific site of O-GlcNAcylation at Ser405 has been described for OGA, within the region that mediates its interaction with OGT47,48. Moreover, OGA has been shown to be an OGT substrate49, suggesting a reciprocal regulation between these two enzymes that has no further been clarified. Like OGT, also OGA levels change according to certain stimuli. For example, OGA protein levels are reduced upon OGT silencing thus implicating the involvement of OGT in the regulation of OGA expression and stability32. A possible account for OGA regulation by OGT is that the gene encoding for OGA is located in a region targeted by the PcG repressor complex of which OGT is a component50,51. Furthermore, OGA protein levels seem to fluctuate according to the relative abundance of O-GlcNAcylated proteins. Pharmacological
14
elevation of global O-GlcNAc levels indeed induces OGA transcription, suggesting a possible feedback loop aimed at upholding O-GlcNAc homeostasis52.
1.3 Crosstalk between protein O-GlcNAcylation and
phosphorylation
O-GlcNAcylation is in many ways similar to protein phosphorylation. Both modifications occur on serine and threonine residues, cycling on their protein substrates with a variable rate that depends upon the protein, the modification site and cellular state. They are also highly responsive to nutrients, as their donor substrates (UDP-GlcNAc and ATP) are high-energy products from cellular metabolism. Taking all these factors into consideration, a reciprocal crosstalk between these two PTMs is easily conceivable. A large-scale study by Wang et al. first described the consistent changes in phospho-proteome dynamics in response to the global increase of protein O-GlcNAcylation. Indeed, elevated O-GlcNAc levels resulted in lower phosphorylation at 280 sites and increased phosphorylation at 148 sites. Also, changes in the O-GlcNAcylation profile were observed upon inhibition of serine/threonine phosphatases, giving proof of the extensive interplay between these two PTMs53. Subsequent studies clarified that O-GlcNAcylation/phosphorylation crosstalk takes place at different levels: if on one hand the two PTMs compete for the occupancy of the same or proximal sites (reciprocal crosstalk) on to the other side also the mutual modification of each other writers and erasers has a role in their regulation54–56. In this context, a study on the proteome of murine synaptosomes revealed that 52% of the identified protein phosphatases were
15
phosphorylated and 8% were O-GlcNAc-modified. In addition, 66% of the identified kinases were phosphorylated, whereas 16% were O-GlcNAcylated, confirming that most of kinases and phosphatases undergoes these two PTMs as a mechanism of regulation57. In the last decade, growing knowledge on this topic confirmed the importance of a correct balance between these two PTMs to regulate cellular signalling, transcription and correct response to nutrients and stress conditions. Indeed, abnormal interplay between O-GlcNAcylation and phosphorylation has proved to underly dysregulation in cancer, diabetes and neurodegenerative diseases58,59.
16
2. Down syndrome
Down syndrome (DS) is the most common chromosomal disorder and the most frequent genetic cause of intellectual disability affecting about 6 million people worldwide60,61. Although the primary cause of this condition is the abnormal triplication of chromosome 21, DS may be considered as a multifactorial disease, where an abnormal expression of trisomic genes arises not only from genetic, but also environmental factors. Thus, trisomy leads to a deregulated scenario that also affects disomic genes and that ultimately results in largely different phenotypes. The increased dosage of the gene encoded on chromosome 21 is known to affect diverse pathways, including those involved with brain development, metabolism, and neuronal networks62,63 . The genetic alterations indeed are responsible of the major clinical features of the disease such as craniofacial abnormalities, small brain size, accelerated aging, and cognitive defects. Individuals with DS are also more likely to develop certain health conditions, including hypothyroidism, autoimmune diseases, epilepsy, haematological disorders, and Alzheimer-like dementia64. Because of recent advance in health care and management of co‐ occurring illnesses, life expectancy of people with DS has largely improved65,66. As a matter of fact, the average lifespan of DS individuals has approximately doubled over the past 30 years to 55-60 years of age67–69. Consequently, up to 35 years old, mortality rate of adults with DS is comparable to that of adults affected by other intellectual disabilities. However, after age 35, mortality rates double every 6.4 years in DS as compared to every 9.6 years for people without DS67. Despite the consistent increase in life expectancy, one of the reasons that strongly compromise adult
17
DS subjects’ quality of life has to be found in the development of a form of dementia similar to Alzheimer’s disease69–71.
2.1 Aging in Down syndrome and the development of
Alzheimer-like dementia
The aging process in DS population lead to increased risk of developing Alzheimer's disease (AD) since adult age. Recent findings suggest that 75% of adults with DS survive to 50 years old and 25% reach the age of 6072. The portion of these surviving individuals that develop clinical signs of dementia can fluctuate considerably. In the range of age of 20-29, virtually no individual show symptoms of dementia73,74. Between the ages of 30-39 years, reports of prevalence range between 0 to 33% of individuals being clinically demented. From 40-49 years of age, 5,7-55% may be demented and between 50-59 years prevalence ranges from 4-55%. In the end, the range of individuals affected by dementia over the age of 60 years is between 15-77%68.For DS people older than 40 years old, dementia follows a similar course to that seen in Alzheimer’s disease75,76, with declines in recall and explicit memory77 and in language function78 usually preceding dementia. However, early-onset dementia in younger DS individuals (aged 30-40 years) often manifests as changes in behaviour and personality75,76, with symptoms including apathy, increasing impulsivity and executive dysfunction. Understanding the factors that underlie the variation in symptom presentation and age of clinical onset of dementia in people with DS may provide insights into the pathophysiological mechanisms of both sporadic and DS‐associated AD (DS‐AD)79,80. Thus, DS offers a unique
18
model to investigate the early molecular changes that precede the appearance of the manifest clinical signs of AD-related dementia.
Alzheimer's disease (AD) is a chronic neurodegenerative disease with well-defined pathophysiological mechanisms, mostly affecting medial temporal lobe and associative neocortical structures. Neuritic plaques and neurofibrillary tangles represent the pathological hallmarks of AD, and are respectively related to the accumulation of the amyloid-beta peptide (Aβ) in brain tissues, and to cytoskeletal changes that arise from the hyperphosphorylation of microtubule-associated Tau protein in neurons. According to the amyloid hypothesis of AD, the overproduction of Aβ is a consequence of the disruption of homeostatic processes that regulate the proteolytic cleavage of the amyloid precursor protein (APP)81. Several studies on this topic revealed that from a molecular point of view, DS neuropathology and AD have many common features, counting the deposition of senile plaques and neurofibrillary tangles, together with cellular dysfunction such as mitochondrial defects, increased oxidative stress, and metabolic alterations63,71,82,83. One of the main links between AD and DS is related to the triplication of the amyloid precursor protein gene (APP), which is encoded on chromosome 21. As a matter of fact, a small percentage of DS individuals having only a partial trisomy for APP gene do not have the same elevated risk to develop AD, even still more consistent than the rest of the population84,85. Likewise, high expression of APP in fibroblasts of individuals with DS is necessary and enough to cause morphological and functional anomalies in early endosomes, which participate in neuron growth, homeostasis, and synaptic functions86. Taken together these findings support the conclusion that an extra dose of the APP gene is sufficient to cause AD in DS subjects.
19
Moreover, trisomy of chromosome 21 results in increased gene dosage for all
genes on this chromosome, including several genes in addition to APP that may also be involved in related mechanisms. Among triplicated genes, both dual specificity tyrosine phosphorylation regulated kinase 1A (DYRK1A) and the regulator of calcineurin 1 (RCAN1) have a well-established role in the aberrant phosphorylation of tau protein, which is one of the main mechanisms underlying the formation of toxic neurofibrillary tangles in AD87–90. Furthermore, trisomy 21 is characterized by mitochondrial dysfunction and enhanced production of reactive oxygen species (ROS)87,91 that may contribute to accelerated aging reported in DS people92. Indeed, oxidative damage is increased in prenatal DS brain compared to non-DS controls93,94and is also higher in adult DS brain compared to age-matched controls82,95. Interestingly, superoxide dismutase 1 (SOD1), which has a pivotal role in ROS processing, is encoded on chromosome 21. Consistent with this, increased SOD1 activity has been suggested to cause accelerated cell senescence by the abnormal accumulation of toxic hydrogen peroxide96. According these evidences, several genes can modulate the course of AD neuropathology in DS population and further work is required to determinate their role and relative importance.
20
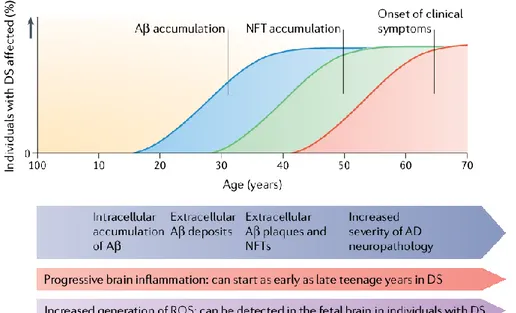
Figure 4: Hypothetical progression of Alzheimer-like neuropathology in Down syndrome. A proposed timeline from birth to over 60 years of age of Alzheimer’s disease (AD) pathology in individuals with Down syndrome (DS). Mitochondrial dysfunction and increased generation of reactive oxygen species (ROS) occur as early as in the foetal brain. Brain inflammation can begin as early as in the late teens with the presence of activated microglial cells. By the age of 40 years, both extracellular Aβ and neurofibrillary tangles (NFTs) are present in sufficient quantities for a neuropathological diagnosis of AD. As individuals with DS As individuals with DS age to over 50 years, AD neuropathology increases in severity and clinical signs of dementia become frequent.
2.1.1. Down syndrome and APP processing
Among the aberrantly over-expressed genes in DS individuals, the gene encoding the amyloid precursor protein (APP) is thought to have the key role in the pathology of AD. The additional copy of APP may drive the development of AD in DS population by increasing the levels of amyloid-β (Aβ), a cleavage product of APP that misfold and accumulates in the brain forming toxic plaques. APP is a type I transmembrane protein essential for normal brain development and possibly also for adult brain plasticity97. This
21
protein can undergo two major proteolytic pathways by different sets of enzymes: a canonical via (non-amyloidogenic) and an amyloidogenic one that leads to the formation of amyloid plaques. In the non-amyloidogenic pathway APP is initially cleaved by an α-secretase in the middle of the Aβ sequence, thus precluding the formation of Aβ. This activity generates a soluble APP fragment (sAPPα) and a membrane-bound C-terminal fragment of APP (α-CTF). α-CTF can be further cleaved by γ-secretase generating the so-called p3 fragment and the amyloid intracellular domain (AICD). On to the other hand, the potentially amyloidogenic pathway consists of a β-secretase-mediated cleavage of APP that results in the secretion of sAPPβ, and a second membrane-bound C-terminal fragment of APP (β-CTF). Further cleavage of β-CTF by γ-secretase generates several aggregation-prone Aβ peptides that results in the progressive formation of senile plaques in the brain parenchyma98.
The additional copy of APP in DS does not typically result in substantial Aβ accumulation until the second or third decade of life. This lack of early Aβ accumulation may be due to APP not becoming dosage sensitive until adulthood, as it’s suggested by both animal and human studies99–101. Despite this, increased levels of soluble Aβ are found in one out of two DS foetal brain102, suggesting that APP processing may not be sufficient to cause extensive Aβ accumulation in the developing brain but is still present even decades before the overt presence of clinical symptoms. In line with these findings, increased Aβ levels have been reported in human cell models like pluripotent stem cells derived from children and young adults affected by
DS86,103,104. One of the possible explanations for the lack of early Aβ
22
Indeed, the progressive dysfunction of intracellular degradative systems that characterize DS neuropathology may contribute to the later accumulation of toxic aggregates105,106.
2.1.2 Down syndrome and tau protein
Tau is the major microtubule associated protein in neurons and interacts with tubulin to promote and stabilize its assembly into microtubules107, allowing axonal transport of vesicles108. In AD, tau can no longer associate with microtubules because of its hyperphosphorylated state, thus resulting in the formation of toxic neurofibrillary tangles (NFTs). Pathological brain changes of aged subjects affected by DS are nearly identical to those of patients with AD consisting of both amyloid plaques and NFTs. Studies on
post-mortem samples have shown that progression of NFTs in DS adults follows a
similar staging as in AD, starting in the cortex region, and then spreading in the hippocampus, inferior temporal cortex and neocortex109. As observe di AD patients without DS, NFTs expansion beyond these areas appears to be preceded by Aβ accumulation110. A potential contributing factor for tau hyperphosphorylation in DS brain may be the overexpression of the dual specificity tyrosine phosphorylation regulated kinase 1A (DYRK1A), a ubiquitously expressed protein kinases which is strongly expressed in heart and brain tissues111,112. DYRK1A is encoded on chromosome 21 and its mRNA has been found overexpressed in DS foetal brains113. DYRK1A was proved to phosphorylate tau at Thr212 in vitro, a residue that is found hyperphosphorylated in AD brains114. Furthermore, mice overexpressing human DYRK1A shows high levels of phosphorylated tau both on Thr212 and Ser202-204, sites proved to be involved in NFTs formation115. In addition,
23
DYRK1A also downregulates the levels of neural restrictive silencing factor (NRSF), a neuroprotective protein, which is reduced people with AD116. According to these evidences, the extra copy of DYRK1A seems to contribute at different levels to the early onset of AD in DS subjects.
Another potential factor contributing to DS tau hyperphosphorylation is the overexpression of the regulator of calcineurin 1 (RCAN1), also encoded on chromosome 21. RCAN1 inhibits calcineurin and may enhance tau phosphorylation by lowering calcineurin phosphatase activity and increasing GSK3β levels, one of the main kinases driving tau phosphorylation117. In addition, high levels of RCAN1 is observed in the hippocampus and cortex region from AD individuals, supporting its possible role in the neurodegenerative mechanisms118. Furthermore, APP may also play a role in tau phosphorylation in DS brain since Aβ-42 peptide seems to upregulate both DYRK1A119 and RCAN1120. Thus, the overexpression of chromosome 21-encoded genes appears to cooperate driving both precocious Aβ accumulation and aberrant tau phosphorylation and consistently favouring the neurodegenerative process in DS.
24
Figure 5: Molecular cross-talking between Down syndrome and Alzheimer's disease. Overexpression of some genes located on chromosome 21 have been linked to the development of neuropathological characteristics of AD in DS. Among them, the APP gene encodes the amyloid precursor protein, and the EST2 gene encodes a transcription factor that promotes the expression of APP, giving rise to the Aβ toxic peptides, which form the amyloid plaques. Also, the overexpression of RCAN1 and its activity as an inhibitor of the phosphatase Calcineurin contributes to the hyperphosphorylation of tau driven by some kinases, among them, the kinase encoded by the DIRK1A gene, that contributes to the formation of neurofibrillary tangles. In addition, SOD1 leads to an increase in ROS levels and oxidative stress due to an imbalance in the ratio of SOD1 and other antioxidant enzymes, resulting in H2O2 accumulation and mitochondrial dysfunctions. Defects in endosomal trafficking and lysosomal proteolysis linked to DS-related genes further contribute to DS neuropathological phenotype. In the end, the astrocyte-derived cytokine S100B has been associated with the activation of glial cells, following by an increase in IL-1β in the nervous system, influencing the neuropathology of AD and DS.
25
2.1.3 Metabolic alterations in Down syndrome
Among the previously described alterations, trisomy is known to contribute to altered energy metabolism that appears to be a strong determinant in the development of pathological phenotypes associated with DS. Alterations include, among others, mitochondrial defects, increased oxidative stress levels, impaired glucose, and lipid metabolism, finally resulting in reduced energy production and cellular dysfunctions. These molecular defects seem to account for a high incidence of metabolic disorders in DS individuals, i.e., diabetes and/or obesity, as well as a higher risk of developing AD.
Amino acids. Among metabolic defects, alterations of several amino acid
concentrations have been observed in the blood of DS individuals compared with age-matched control subjects121. Specifically, plasma from DS subjects showed: (I) reduced levels of histidine, lysine, tyrosine, phenylalanine, leucine, isoleucine, and tryptophan; (II) increased levels of phenylalanine and tyrosine; (III) higher levels of leucine, isoleucine, cysteine, and phenylalanine at an age vulnerable to Alzheimer’s changes; (IV) decreased concentration of serine at any age; and (V) increased lysine concentration in patients above 10 years old, possibly associated to accelerated aging121. A recent study also evidenced changes in the levels of metabolites involved in the methylation cycle, including cysteine, cystathionine, choline, and dimethylglycine. Indeed, mass spectrometry analysis reported a significant increase of the concentrations of these amino acids in DS plasma as well as the levels of S-adenosylhomocysteine and S-adenosylmethionine122. Higher levels of these metabolites in DS seem to be strongly associated with the triplication of cystathionine β-synthase (CBS), an enzyme catalysing the synthesis of cystathionine from homocysteine which is encoded on chromosome 21123.
26
Indeed, DS-related CBS overexpression seems to be linked with reduced homocysteine levels together with impaired mitochondrial function, as indicated by accumulation of Krebs cycle intermediaries in DS human dermal fibroblasts. Furthermore, the study by Szabo et al. showed that consequent increased production of H2S is responsible for mitochondrial deficits, in particular though the inhibition of complex IV124. In line with these results, DS cells showed a significant impairment of mitochondrial complexes activities, oxygen consumption and ATP generation, showing how alterations in amino acids metabolism may drive mitochondrial defects that characterized DS pathology.
Lipid metabolism. DS individuals are characterized by an altered lipid
metabolism. Growing number of studies demonstrated that DS children show higher levels of circulating cholesterol, low-density lipoproteins (LDL), and triglycerides with respect to age-matched controls125–127. Altered lipid profile in DS seems to lead an increased risk of cerebrovascular events128 and overweight/obesity126. In this context, defects in lipid metabolism seems to be extended also to the brain since altered lipid profile was also reported in prefrontal cortex samples from DS individuals with respect to matched controls129. Indeed, a lipidomic study by Yu et al. showed reduced glycerophospholipid metabolism in DS together with reduced ratio of cholesterol to phospholipid concentration, phosphatidylcholine, and phosphatidylethanolamine levels129. In addition, in a very recent study, Hwang
et al. observed that DS fibroblast are characterized by reduced levels of
sphingosine derivatives called long chain bases (LCBs), which seem to be responsible for nuclear membrane alterations associated with accelerated aging process in DS130.
27
Glucose metabolism. People affected by DS have a significantly lower glucose
metabolic rate in the parietal and temporal cortical areas, which are the first typically affected in AD131. In addition, the cerebral glucose metabolic rate measured with the aid of positron emission tomography (PET) and [13 F]2-fluoro-2-deoxy-D-glucose undergoes to a significant reduction in older DS patients compared to younger DS132. Subsequent analysis also demonstrated that DS individuals are characterized by less efficient glycolytic flux. Hexokinase-II protein levels are significantly reduced in the frontal cortex of DS individuals133, confirming an altered glycolytic pathway. In addition, phosphoglucose isomerase (PGI) is down regulated in foetal brain with DS and phosphofructokinase (PFK) activity, the rate limiting enzyme of glucose metabolism, is markedly impaired in frontal and temporal lobe and cerebellum from DS individuals while it is increased in the occipital lobe 134. Interestingly, the human liver-type subunit of PFK (PFKL) is encoded by a gene residing on chromosome 21 and is triplicated in DS. In line with this, increased PFK activity is commonly found in fibroblasts and erythrocytes from DS patients, as a result of increased gene dosage135. Transgenic mice that overexpress PFK liver type (Tg- PFKL) showed alteration in glucose metabolism as indexed by increased metabolic flux in brain and reduced clearance from blood136. Although controversial results have been observed in different areas of DS adult brain, PFK specific activity is almost doubled in brains of embryonic Tg-PFKL mice, suggesting that the gene-dosage effects may change during aging137. These age-dependent changes of gene expression further complicate the “gene-dosage effects” hypothesis of trisomy 21, contributing to the multifaceted aberrant metabolism observed at different ages138.
28
Glucose is the major source of energy for mammalian brain. Since brain neurons cannot synthesize or store glucose, they are fully dependent on glucose import to ensure their functionality. Glucose enters the brain via glucose transporters (GLUTs) primarily present at the BBB. Among the most important GLUTs in mammalian brain, GLUT1 is expressed in micro vessels and glia, but not in neurons. GLUT3, together with GLUT1, is the predominant GLUT responsible for glucose transport and its mainly neuron specific. On to the other hand, GLUT2 seems to be only expressed in astrocytes. GLUT4 instead seems to be the mediator of insulin effects on the brain139. Post-mortem investigations of AD brains showed decreased protein levels of GLUT1 and GLUT3140, especially in the cerebral cortex141. On the other hand, in these patients, the level of GLUT2 is significantly increased; whereas, there is no significant difference in GLUT4 level in the brain of AD patients compared to healthy controls142. According to the required role of GLUTs in delivering glucose to the brain, altered GLUTs levels detected in DS brain133 could further contribute to disrupted glucose metabolism. While glucose uptake and metabolism are finely regulated by insulin in peripheral tissues/organs, the brain was thought to be not affected by insulin in terms of glucose uptake143. Recent advances in the comprehension of brain functions highlighted that the actions of insulin are more pronounced in the central nervous system than previously thought. Indeed, insulin plays a major role in the regulation of gene expression and cellular metabolism, both events that sustain neuronal activity and synaptic plasticity mechanisms143. In this scenario, dysfunctions of insulin signalling in the brain of DS patients are of interest in order to better understand DS neurodegeneration. Although insulin or proteins belonging to the insulin signalling pathway are not encoded by genes located on chromosome 21, insulin signalling is at the crossroad among intracellular events driving cell
29
metabolism in terms of glucose, fatty acids, and proteins synthesis/utilization144. Recent advances in the comprehension of brain functions highlighted that the actions of insulin are more pronounced in the central nervous system than previously thought. Furthermore, alterations of brain insulin signalling have been associated with a higher risk of developing age-related cognitive decline and neurodegenerative diseases145. In this context, brain insulin resistance (defined as an insufficient response to insulin by target cells; Figure 6) represents a pivotal event driving AD neurodegeneration143 and has been associated with increased Aβ production146, increased inflammatory processes147, and high oxidative stress levels148. Moreover, insulin resistance may even precede other neuropathological alterations by several decades, indicating an active role of impaired glucose metabolism in driving AD neurodegenerative processes149. Interestingly, among the common neuropathological features with AD, also DS brains seems to be early characterized by brain insulin resistance133. Indeed, markers of brain insulin resistance are evident in DS brains even before the appearance of clinical signs of AD neuropathology133, suggesting a role for insulin signalling alterations in the early onset of AD in people with DS79.
30
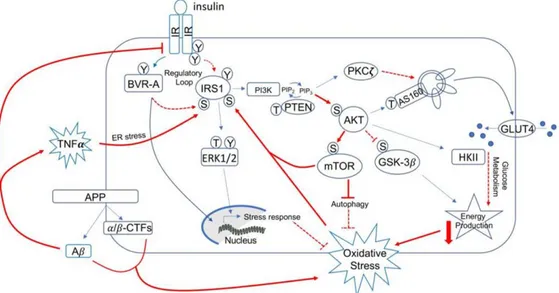
Figure 6: Schematic representation of the insulin signalling: Under physiological conditions, the activation of insulin signalling requires the binding of insulin to the insulin receptor (IR), which auto-phosphorylates on Tyr residues (e.g., Tyr1158/1162/1163) and promotes the receptor tyrosine kinase-mediated phosphorylation of its substrate (IRS1) on specific Tyr residues (e.g., 632). Once activated, IRS1 works as a scaffold protein, driving the activation of the two main harms of the insulin signalling: (I) the MAPK pathway, mainly involved in gene transcription and (II) the PI3K/Akt axis that is critical for activating downstream proteins that mediates insulin neurotrophic outcomes. Indeed, Akt promotes the phosphorylation of several targets, among which are: (I) GSK3β which has a role energy production and tau phosphorylation; (II) mTOR, which regulates protein synthesis and autophagy; and (III) AS160. This latter is responsible for the translocation of GLUT4-containing vesicles to the plasma membrane to mediate glucose uptake. During the development of brain insulin resistance, a dysregulation of a number of these proteins was observed. From a molecular point of view, brain insulin resistance phenomenon is characterized by key events such as reduced IR protein levels and/or increased IRS1 inhibitory phosphorylation levels (e.g., Ser307, Ser636), that are responsible for the uncoupling between IR and IRS1.
Energetic metabolism. The pathological metabolic phenotype of DS may
result in reduced catabolic processes and impaired energy production. Within this scenario, defects of mitochondrial function are known to contribute to a
31
general loss of cellular functions, most of which strictly depend on ATP availability150–152. Indeed, growing evidence demonstrated that loss of mitochondrial structure and function, together with increased ROS production, strongly contribute to DS pathological phenotypes152. As a matter of fact, defects in mitochondrial functionality have been observed in basically all DS cells. Fibroblasts and lymphoblastoid cells from DS subjects show deficits in the oxidative phosphorylation (OXPHOS) system such as the complex I activity, the ATP synthase, the ADP/ATP translocator, and the adenylate kinase enzyme, ultimately leading to significant energy deficit and increased ROS production in mitochondria153,154. Reduced OXPHOS rate was also found in neural progenitor cells (NPCs) isolated from the hippocampus of Ts65Dn mice (murine model of DS)155 and skin fibroblasts form DS subjects156. Thus, mitochondrial dysfunction is considered an inherent feature of DS, associated with increased oxidative stress157.
2.2 Role of altered O-GlcNAcylation in Alzheimer’s
Disease progression.
An increasing number of studies have recently highlighted the importance of altered glucose metabolism in the progression of AD158. Among the molecular mechanisms that may clarify the contribution of glucose hypometabolism in the neurodegenerative process, the alteration of O-GlcNAc homeostasis seems an appealing theory. This hypothesis suggests that impaired glucose uptake/metabolism in the brain could lead to decreased protein O-GlcNAcylation levels. Such decrease in O-GlcNAc levels reflects a failure of the protective mechanism of O-GlcNAc in the brain and thereby favours the
32
progression of AD. In this context, several studies have recently correlated brain hypoglycaemia with decreased O-GlcNAcylation, supporting their convergence to AD neurodegeneration159–161. Most importantly, altered O-GlcNAcylation of brain’s key proteins, such as APP and tau has proved to affect their phosphorylation and to trigger the formation of amyloid plaques and neurofibrillary tangles162. Indeed, although reduced glucose metabolism may be a downstream consequence of Aβ toxicity163, many studies also confirmed that impaired O-GlcNAcylation in the brain could, in principle, contribute to Aβ accumulation. Although APP was proved to be O-GlcNAcylated almost 20 years ago by Griffith et al.164, only recently this PTM has proved to affect its processing and thus Aβ formation. In this context, a recent work by Jacobsen and Iverfeldt demonstrated that increasing overall protein O-GlcNAcylation in SHSY cells though the use of OGA inhibitors or OGA siRNAs results in an increase in sAPPα, a product of the non-amyloidogenic pathway, and a decrease in Aβ secretion, suggesting that O-GlcNAcylation could have protective effects in AD progression165. Furthermore, the reduction of APP amyloidogenic cleavage induced by the boost of O-GlcNAcylation seems to be related to the inhibition of APP endocytosis that prevents its amyloidogenic processing by BACE1. As a matter of fact, O-GlcNAcylation on Thr576 residue of APP is known to prevent its endocytosis, eventually reducing Aβ production166. In this context, it has recently been proved that long-term OGA inhibition leads to the reduction of toxic Aβ-40 and Aβ-42 peptides in the brain, decreased Aβ plaques formation and neuroinflammation, finally resulting in improved cognition in 5xFAD-AD mice167. In line with the putative role of O-GlcNAcylation in regulating APP processing, OGA inhibitor treatment proved to reduce Aβ production also by lowering γ-secretase activity both in vitro and in vivo167.
33
Unlike APP, the role of protein O-GlcNAcylation for tau protein has been more extensively studied during the last decades. O-GlcNAcylation on tau proteins, when first discovered in samples of bovine tissues, indicated a stoichiometry of about 4 moles of O-GlcNAc per mole of tau proteins168. Since then, many O-GlcNAcylation sites were identified on human tau protein (e.g. Thr123, Ser208, Ser400, Ser409, Ser412), most of which are found to be phosphorylated in brains from AD patients169,170. Most interestingly, O-GlcNAcylation seems to inhibit tau intracellular aggregation by reducing its abnormal phosphorylation, thus restoring cognitive functions171. In line with these reciprocal relationship between O-GlcNAcylation and phosphorylation, O-GlcNAcylated levels of tau have proved to be inversely related to phosphorylated tau levels172. In this contest, the reduction in glucose levels in fasting animals have proved to reduced O-GlcNAcylation and increase tau phosphorylation173. Furthermore, O-GlcNAcylated tau levels are reduced upon the use of okadaic acid (Ser/Thr phosphatase inhibitor)174, confirming the cross-talk between this two PTMs. Conversely, when AD mice were treated with the selective OGA inhibitor, Thiamet-G, which increased the level of O-GlcNAcylation, the decrease in tau phosphorylation was proportional to the increase in O-GlcNAc level in the brain175. On the contrary, when tau phosphorylation was increased using an OGT inhibitor, the opposite effect was observed176. Chronic OGA inhibition also reduced tau levels in the CSF of AD mice177. Moreover, a recent study using bigenic TAPP mice, which manifest both amyloid and tau pathologies, reported the effects of long-term OGA inhibition using Thiamet-G. OGA inhibition blocked cognitive decline in these mice in parallel to decreases in Aβ levels and amyloid plaques in the brain and showed a clear trend toward decreased insoluble tau171, thus confirming the
34
modulation of protein O-GlcNAcylation as a promising approach to counteract AD progression.
3. Metabolic diseases and neurodegeneration
Metabolic syndrome is a cluster of conditions (insulin resistance, obesity, hyperglycaemia, hypertension, and dyslipidaemia) that underlie the onset and progression of a number of pathologies including Type-2 diabetes mellitus (T2DM), non-alcoholic steatohepatitis, coronary heart disease, obesity, stroke and cognitive decline. Growing body of epidemiological evidence suggest that metabolic syndrome may be important in the development of age-related cognitive decline, mild cognitive impairment, vascular dementia and Alzheimer’s disease178. In line with the relationship between altered metabolic phenotype and dementia, it is suggested that T2DM and defect in glucose metabolism might predispose to poorer cognitive performances and more rapid cognitive decline during ageing. Clinical and experimental evidence has indicated that glucose intolerance and diabetes induce dementia through various mechanisms such as atherosclerosis, microvascular disease, glucose toxicity, and impaired insulin metabolism179. Several large longitudinal population-based studies on this topic in fact confirmed a complex relationship between diabetes mellitus and dementia180. In this scenario, a prospective study by Ohara identified diabetes as a risk factor for all-cause dementia, especially AD. In addition, higher levels of 2-hour post-load glucose, fasting insulin and homeostasis model assessment of insulin resistance were significantly associated with increased risk of neuritic plaques181. Furthermore, a recent study by Janson et al. observed that T2DM or impaired fasting glucose might be present in up to 80% of patients with AD182. Aside from AD, T2DM is also
35
liked to other forms of cognitive disfunctions, such as mild cognitive impairment (MCI) or diabetes-associated cognitive decrements183. Interestingly, in 2015, a large cohort study from Canada indicated that the risk of dementia is already increased in patients with newly diagnosed diabetes184. Moreover, elevated plasma concentrations of glucose in individuals without diabetes have also been linked to an increased risk of dementia185, confirming the relevance of altered metabolic profile in driving cognitive decline. In this context obesity has also been related with increased risk of developing dementia. Indeed, overweight and increased body mass index (BMI) in midlife has revealed to be a risk factor for dementia in later life186. In addition, the link between obesity in mid-life and the future risk of developing dementia has been confirmed by several studies187–189. Most interestingly, obesity has been shown to increase the risk of dementia independently from T2DM. A longitudinal study by Withmer et al. proved that individuals with the largest sagittal abdominal diameter have a nearly 3-fold risk of developing dementia compared to the smallest diameter190. Another study on this topic observed that larger waist-hip ratio is associated with decreased hippocampal volume191, confirming the link between the accumulation of abdominal fat and cognitive dysfunctions. According to these data, metabolic alterations such as those occurring in diabetes and obesity seems to drive cognitive alterations, probably based on overlapping neurodegenerative mechanism, including oxidative stress, mitochondrial dysfunction, and inflammation.
36
3.1 High-Fat-Diet in mice: a model of metabolic-induced
cognitive decline
The associations between consumption of a high-fat or ‘standard’ diet and metabolic disorders such as obesity, diabetes, and cardiovascular disease have long been recognized and a great deal of evidence now suggests that diets high in fat can also have a profound impact on the brain, behaviour, and cognition. As the brain cannot synthesise or store energy reserves, food provides its immediate source of energy and thereby may influence structure and function192. Indeed, the brain is particularly vulnerable to the effects of obesogenic diets, especially during early life comprising periods of rapid growth, maturation, and development193. Growing evidence have proved the detrimental impact of diets rich in saturated fatty acids, and extensive research has shown that diet-induced obesity potentially results in memory impairment in rodents194. In this context, animal models have proven to be very precious in acquiring basic knowledge about metabolic alterations driving cognitive decline. One of the most well-characterized experimental models used to study the role of metabolic syndrome in driving obesity, T2DM and consequent cognitive decline is obtained by feeding mice with the so called “high-fat diet”. This model of diet-induced obesity and insulin resistance closely mimic molecular changes occurring in metabolic syndrome that precede obesity, diabetes and dementia, such as hyperglycaemia, hyperinsulinemia, insulin resistance, decreased autophagy and dyslipidaemia195. In this scenario, mice fed with a high-fat diet (HFD) for only one day show a rapid drop in the performance of episodic memory task, that can be rapidly reversed switching to a low-fat diet196. Furthermore, mice fed with a HFD for a long period of time show poor learning and memory performance197, as well as depressive and
37
anxiety-like behaviours198,199. Several interactive processes have been proposed to underlie cognitive decline related to poor diet including oxidative stress and inflammation200, increased blood brain barrier permeability201, reduced neurotrophic factors202, altered mitochondrial functionality203 and insulin insensitivity204,205. In a study by Woodie and Blythe, by focusing on hypercaloric diet (high in fat and fructose) and its effects on cognitive performances, the authors demonstrated that hypercaloric diet promotes insulin dysregulation, hyperlipidaemia, and poor cognitive performance. These observations indicate that the combination of a high-fructose and high-fat diet may altered lipid and energy metabolism similar to clinical diabetes, with elevation of fasting glucose and increased cholesterol levels206. These changes were also found in rats fed with a HFD, suggesting that insulin resistance is a probable mediator to HFD-induced cognitive deficits207. In support of this, also mice fed with HFD exhibit a significant increase in obesity, lower glucose and insulin tolerance as compared to animals fed with standard diet. These changes are accompanied by consistent alterations of the insulin signalling in the brain, with reduced insulin receptor activation together with increase inhibitory phosphorylation of the insulin receptor substrate (IRS)208. In addition, HFD mouse brain exhibits biochemical changes related to increase A deposition, neurofibrillary tangle formation and decreased synaptic plasticity, suggesting that changes in insulin sensitivity might contribute to cognitive impairment and the onset of AD-related hallmarks in HFD mice208. In line with these findings, human epidemiological studies indicate that long-term hyperinsulinemia and obesity caused by dietary fat intake are risk factor for dementia, whereas insulin administered to AD patients, by regulating glucose transport, energy metabolism, neuronal growth and synaptic plasticity, improves memory formation209, thus confirming the role of insulin-resistance in AD progression.
38
Together with reduced insulin sensitivity, mice fed with high fat diet also show reduced brain cortex bioenergetic, altered mitochondrial function and oxidative stress. Indeed, mitochondria from brain cortex of HFD mice showed reduced respiratory capacity, decreased oxygen consumption and reduced ATP production210. In addition, HFD animals also showed a decrease in SOD enzyme activity, the first line of defence against oxidative stress, contributing to the increased oxidative stress of these animals. Accordingly, HFD induces an imbalance of ratio GSH/GSSG, a clear sign of altered redox state210. In line with these findings, another work by Miotto et al. indicates that HFD consumption is responsible for impaired mitochondrial bioenergetic together with an increased mitochondrial H2O2 emission as a result of impaired ADP sensitivity203. Furthermore, mice fed with HFD show increased levels of catalase and superoxide dismutase (enzymes involved in the antioxidant response) and high levels of 4-hydroxynonenal-adducts (marker of oxidative damage), supporting an increase in oxidative stress/damage and the stimulation of an antioxidant response203. All together this data supports the idea of common molecular mechanisms that could underlie both neurodegenerative disease and cognitive decline in HFD animals.
3.2 Role of O-GlcNAcylation in metabolic diseases
Nutrients-responsive protein O-GlcNAcylation has emerged as an important key actor in many of the major diseases associated with metabolic dysfunctions. O-GlcNAc signalling has been proved to have a role in regulating adipose tissue dynamics in metabolic adaptation to nutrient availability. In details, a recent study by Yang et al. proved that loss of adipose OGT specifically promotes lipolysis in visceral fat by decreasing
O-39
GlcNAcylation, while overexpression of adipose OGT inhibits adipose tissue lipolysis and promotes diet-induced obesity and whole-body insulin resistance. This study provided extensive evidences for the role of increased adipose O-GlcNAcylation as a molecular signature for obesity and diabetes and further confirmed the essential role for OGT in lipolysis regulation211. In line with these recent findings, an aberrant increase of protein O-GlcNAcylation has been directly linked to insulin resistance and to hyperglycaemia-induced glucose toxicity, two hallmarks of diabetes and diabetic complications. Indeed, hyperglycaemia induces elevated O-GlcNAcylation of some key transcription factors and cofactors (e.g. FoxO1, PCG-1α), promoting gluconeogenesis and lipogenesis. This, in turn, further increases glucose level, forming a vicious cycle that worsens the glucose toxicity effects and thus aggravates the progression of diabetes and diabetic complications212. In this context, biochemical analysis of erythrocyte proteins (from patients diagnosed as normal, prediabetic or diabetic) reveals that the levels of both protein O-GlcNAcylation and OGA are elevated in diabetic compared to that of the control group213. And more importantly, protein O-GlcNAcylation and OGA levels are significantly elevated in prediabetic samples as well, suggesting that O-GlcNAcylation could be used as a potential tool for the early screening of pre-diabetic conditions.
Together with its role in the regulation of gluconeogenesis and lipid metabolism, O-GlcNAcylation has been proved to play a pivotal role in controlling insulin signalling. Indeed, many effector molecules of insulin signalling pathway are also O-GlcNAcylated, often in a reciprocal manner to phosphorylation on specific serine residues7,212,214. Interestingly, it has been reported that almost all major player of insulin signalling pathway (e.g. IRS1,
40
PI3K, AKT) are regulated through a reciprocal crosstalk between O-GlcNAcylation and phosphorylation that regulates insulin signalling through positive/negative feedbacks. In this context, chronic elevation of O-GlcNAc has been hypothesized as a possible contributor to the onset of insulin resistance, at least in part though the persistent O-GlcNAcylation of PI3K and Akt on stimulatory serine sites212,215. In vitro and in vivo studies have proved that rising total protein O-GlcNAcylation levels, by either genetic manipulation or OGA inhibition, results in the development of insulin resistance and diabetes216–218. However, OGA inhibition in 3T3-L1 adipocytes did not induce insulin resistance219, suggesting a more complex relationship between phosphorylation and O-GlcNAcylation rather than just a yin-yang mechanism. Interestingly, inhibitory serine residues of IRS1 can also be O-GlcNAcylated220, leading to the possibility of hypoglycaemia-mediated reduced O-GlcNAcylation on inhibitory serine residues of IRS1 that may result in its increased phosphorylation and development of impaired insulin signalling in AD brain. This evidence seems to suggest that the disruption of the harmonious balance between O-GlcNAcylation and phosphorylation may contribute to the unproper functioning of the insulin pathway and be responsible for the onset of the insulin resistance4. As extensively discussed before, hypoglycaemia and reduced protein O-GlcNAcylation are well-demonstrated feature of AD progression160,172,221. Since altered glucose metabolism, impaired O-GlcNAcylation and defective insulin signalling seems to cooperate in the progression of the neurodegenerative process, the comprehension of the complex interplay between them could highlight new insights into the pathological mechanisms.
41
2. AIM OF THE WORK
Growing evidences have recently pointed out disturbances of protein O-GlcNAcylation as a possible link between altered brain metabolism and the progression of neurodegenerative processes. As observed in Alzheimer’s disease (AD) brain, flaws of the cerebral glucose uptake translate into reduced HBP flux thus leading to impaired protein O-GlcNAcylation. Notably, the nutrient-related reduction of O-GlcNAcylated proteins triggers an aberrant increase of tau and APP phosphorylation in AD brain, favouring the formation of toxic neurofibrillary tangles and β-amyloid plaques therefore contributing to disease pathogenesis.
Given that Down syndrome (DS) and AD share similar metabolic alterations and common pathological markers within the brain, it is conceivable to suppose a role for aberrant O-GlcNAcylation in driving DS neurodegeneration. In this scenario, the present work discloses, for the first time, the possible role of protein O-GlcNAcylation in DS-related dementia. To achieve this goal, we exploited a well-established murine model of DS (Ts2Cje) to investigate changes in global protein O-GlcNAcylation, focusing on the hippocampal region, which has a high impact on cognitive functions. We also evaluated possible alterations occurring in the O-GlcNAc enzymatic machinery, by analysing OGT/OGA cycle and GFAT1 activation state. Supporting the notion that impaired protein O-GlcNAcylation can affect commonly recognized AD hallmarks, we further investigated APP and tau post-translational modifications in Ts2Cje mice to assess the role of impaired O-GlcNAcylation in mediating the progression of AD-like dementia in DS. Since defective O-GlcNAcylation has been proved to play a key role in AD progression, current research is focused on small molecules that can possibly
42
modulate protein O-GlcNAcylation as a novel therapeutic target to counteract neurodegeneration222. Considering the promising results obtained on various AD models170,175,177,223, we also tested putative neuroprotective effects of a brain-targeting strategy in our DS model, shading a light on the possible mechanisms through which the intranasal administration of Thiamet-G (selective OGA inhibitor) could exert benefits in Ts2Cje mice.
The common motif that has emerged from these studies strongly suggests that altered metabolism, defective HBP and impaired O-GlcNAcylation are important hallmarks associated with neurodegeneration. As extensively discussed before, an altered O-GlcNAcylation profile is a well-demonstrated feature of both AD160,172,221 and metabolic disorders like T2DM and obesity211,213. In order to discern the contribution of metabolic-induced changes in the neurodegenerative process, the second part of this work has focused on the study of O-GlcNAcylation homeostasis in wild type mice fed with a diet high in fat content. In details, we aimed to confirm the role of altered O-GlcNAcylation as a driving event that favours the development of AD signatures in the brain identifying the contribute of nutrients overload by using high fat diet (HFD) mice. Furthermore, we explored the impact of nutrients overload on mitochondrial functionality, thus suggesting another possible link between dysfunctional O-GlcNAcylation and cognitive decline in the HFD model.