UNIVERSITÀ DEGLI STUDI DELLA TUSCIA DI VITERBO DIPARTIMENTO DI SCIENZE ECOLOGICHE E BIOLOGICHE
Corso di Dottorato di Ricerca in Genetica e Biologia Cellulare - XXVIII Ciclo.
THE KINASE HIPK2 REGULATES CYTOKINESIS
THROUGH THE MICROTUBULE SEVERING SPASTIN
s.s.d. BIO/11
Tesi di dottorato di:
Dott.ssa Loredana Biancolillo
Coordinatore del corso Tutore
Prof. Giorgio Prantera Dott.ssa Cinzia Rinaldo
INDEX
INDEX 1
ABSTRACT 3
INTRODUCTION 1 Cytokinesis and its molecular control 4
1.1 Central spindle assembly 5
1.2 Cleavage furrow ingression 7
1.3 Midbody formation 8
1.4 Abscission 9
1.5 Spastin 11
2 Cytokinesis defects 14
3. Homeodomain Interacting Protein Kinase 2 (HIPK2) 15
3.1 HIPK2 and DNA damage 16
3.2 HIPK2, cytokinesis and genomic stability 17
3.3 HIPK2 and cancer 18
AIM 19
RESULTS Epistatic localization relationships analyzes 20
HIPK2-dependent cells show aberrant midbody resembling those of spastin-depleted cells 24
Microtubules midbody stability in H-i cells 26
Exogenous spastin over-expression rescues cytokinesis defects in HIPK2-depleted cells 27
Spastin over-expression rescue cytokinesis defects but not H2B phosphorylation at S14 30
HIPK2 regulates spastin 31
HIPK2 regulates spastin in a post-trascriptional manner 33
HIPK2 regulates spastin in a phosphorylation-dependent manner 35
HIPK2 binds and phosphorylates spastin in vitro 36
S268 phosphorylation site is crucial for spastin protein levels 38 Spastin S268A mutant over-expression does not rescue cytokinesis defects
in H-i cells 40
DISCUSSION 44
MATERIAL AND METHODS 49
ABSTRACT
The oncosuppressor HIPK2 is a kinase involved in the cell fate decisions in the development and response to stress. Recently, it was demonstrated the relevance of this kinase in the control of cytokinesis and prevention of chromosomal instability (CIN). HIPK2 is required for cytokinesis and prevents tetraploidization by phosphorylating the extra-chromosomal histone H2B at the midbody, the organelle-like structure formed at the cleavage furrow between the two daughter cells (Rinaldo et al., 2012). HIPK2-depleted cells do not successfully complete cytokinesis, leading to polyploidization, CIN, and increased tumorigenicity (Valente et al., 2015).
To get hints on the mechanism through which HIPK2 controls cytokinesis, we have investigated the interplay between HIPK2 and crucial cytokinesis factors by analyzing their epistatic localization relationships at midbody in HIPK2-depleted cells (H-i).
Our results show that HIPK2 depletion does not affect the localization of proteins involved in midbody formation/stabilization (i.e. CPC proteins, PLK1, MKLP1, MgcRacGAP1, PRC1, ECT2 and citron Kinase), while strongly affects the localization of the microtubule severing protein spastin, whose activity is required for abscission, the final step of cytokinesis. Spastin could not be detected at the midbody in a high percentage (37±4.9%) of H-i cells. Spastin possesses microtubule (MT)-severing ability and contributes to different processes involving MT/cytoskeleton, such as cytokinesis, membrane modelling, intracellular and axonal vesicle transports (Trotta et al., 2004; Connell et al., 2009). Interestingly, we noticed that H-i cells show cytokinesis defects strongly resembling those of spastin-depleted cells and spastin over-expression rescues H-i cytokinesis defects, but not H2B phosphorylation at the midbody, indicating that the two events are independent. A biochemical characterization of the HIPK2/spastin cross-talk showed that HIPK2 directly regulates spastin levels in a phosphorylation-dependent manner. In particular, HIPK2 phosphorylates spastin at S268 in vitro and this phosphorylation is required for spastin stability. Notably, we observed that over-expression of a phosphomimetic spastin S268D mutant, but not non-phosphorylatable S268A mutant, rescues cytokinesis defects in H-i cells. Overall, these findings support the idea that HIPK2-mediated phosphorylation of spastin contributes to reach the spastin dosage required for abscission.
INTRODUCTION
1 Cytokinesis and its molecular control
Cytokinesis follows mitosis (Fig. 1), partly overlaps with it and completes the cell division. Cytokinesis is usually divided in four stages: central spindle (midzone) assembly, cleavage furrow ingression, midbody formation and abscission (Fig. 2; Chen et al., 2012).
Figure 1. The stages of mitosis in an animal cell.
The eukaryotic cells ensure the faithful segregation of sister chromatids and the proper maintenance of genome stability through mitosis. (a) Interphase: The G2 stage of interphase immediately precedes the beginning of mitosis and follows chromosomal DNA replication during the S phase. The chromosomes, each containing a sister chromatid, are still dispersed and not visible as distinct structures. During interphase, the centrioles are replicated, forming small daughter centrioles. (b) Early prophase: The centrosomes, each with a daughter centriole, begin moving toward opposite poles of the cell. The chromosomes can be seen as long threads, and the nuclear membrane begins to disaggregate into small vesicles. (c) Prophase: Chromosome condensation is completed; each visible chromosome structure is composed of two chromatids held together at their centromeres. The microtubular spindle fibres begin to radiate from the regions just adjacent to the centrosomes. Some spindle fibers reach from pole to pole; most go to chromatids and attach at kinetochores. (d) Metaphase: The chromosomes move toward the equator of the cell, where they become aligned in the equatorial plane. (e) Anaphase: The two sister chromatids separate into independent chromosomes. Each contains a centromere that is linked by a spindle fiber to one pole, to which it moves. Simultaneously, the cell elongates, as do the pole-to-pole spindles. Cytokinesis begins as the cleavage furrow starts to form. (f) Telophase: New nuclear membranes form around the daughter nuclei; the chromosomes uncoil and become less distinct; the nucleolus becomes visible again. Cytokinesis is nearly complete, and the spindle disappears as the MTs and other fibers depolymerize. Throughout mitosis the “daughter” centriole at each pole grows, so that by telophase each of the emerging daughter cells has two full-length centrioles. Upon the completion of cytokinesis, each daughter cell enters the G1 phase of the cell cycle and proceeds again around the cycle. (Molecular Cell Biology. 4th edition. Lodish H, Berk A, Zipursky SL, et al. New York: W. H. Freeman; 2000.)
Midzone assembly Cleavage furrow ingression Midbody formation Abscission
Figure 2. The four stages of cytokinesis.
Following entry into cytokinesis, the actomyosin ring and antiparallel midzone MTs form between the segregated chromosomes. In early cytokinesis, midzone MTs gradually compact through the crosslinking of associated midzone proteins, and the cleavage furrow narrows. After furrowing, the intercellular bridge (midbody) with the compacted MTs connects the two daughter cells. The midbody contains overlapping MTs, the midbody ring (derived from crosslinked midzone proteins) and amorphous, electron-dense material. Abscission occurs adjacent to the midbody by multiple pathways that orchestrate severing of the intercellular bridge. In certain cell types, a second bridge-severing event occurs on the other side of the bridge (Modified by Chen et al., 2012).
This process is finely regulated and drove by mitotic spindle MTs and the spindle midzone. At the center of the spindle midzone, actin filaments with motor protein myosin II and other proteins assemble a contractile ring that bisects the dividing cell. The position of the division plane and the formation of the ring are established by two populations of MTs: astral and central spindle MTs, after the sister chromatids move towards the two opposite spindle poles in anaphase. The contractile ring determines a constriction forming a cleavage furrow at the cell’s equatorial cortex. The constriction of the contractile ring progressively compacts the central spindle to form a thin intercellular bridge, an organelle-like structure called midbody. This transient structure undergoes a series of morphological changes during cytokinesis and contributes to cell fate determination by recruiting and organizing many proteins and factors that regulate the final separation of the two daughter cells, called abscission (Fededa and Gerlich, 2012).
1.1 Central spindle assembly
Cytokinesis starts during anaphase, when the MTs are stabilized and mitotic spindle organizes in a dense interdigitating and antiparallel bundles of MTs associated with multi-proteins complexes at the central region, to form the midzone (Mollinari et al., 2002). Some MTs of central spindle derive from interpolar MTs of the metaphase spindle. Central spindle assembly is mainly due to several MTs binding and bundling proteins and to regulative kinases, such as Aurora B, PLK1 (polo-like kinase 1) and CDK1 (cyclin-dependent kinase 1) (Fig. 3; Normand and King, 2010). One of the main bundling protein is PRC1 (protein required for cytokinesis 1). PRC1 acts as an homodimer that specifically binds to the interface between antiparallel MT (Zhu et al., 2006); CDK1 regulates PRC1 through its phosphorylation to avoid dimerization during anaphase. Another key factor for central spindle assembly is the tetrameric centralspindlin complex formed by two dimers of the kinesin motor protein MKLP1 (mitotic kinesin-like protein 1) and the Rho-family GTPase activating protein, MgcRacGAP (Male germ cell Rac GTPase-activating protein) (Mishima et al., 2002). Similar to PRC1, the interaction of centralspindling with MTs is inhibited by CDK1 phosphorylation before anaphase onset. During anaphase, CDK1 levels and activity strongly decrease and the centralspindlin forms higher-order clusters in a manner that is regulated by Aurora B kinase and 14-3-3 proteins. The kinase Aurora B, the scaffolding subunit inner centromere protein INCENP, Borealin and Survivin are the component of a multi-subunit complex essential of the central spindle formation, the so-called CPC (chromosome passenger complex). This complex in metaphase localizes at the centromeres, where regulates attachment of chromosomes to the mitotic spindle. After the dephosphorylation of INCENP, in anaphase, the complex localizes at the central spindle where recruits the kinesin motors MKLP1 and MKLP2. CPC not only regulates PRC1 and MKLP1, but also promotes actomyosin ring formation (D'Avino and Capalbo, 2016).
Figure 3: Regulation of cytokinesis by mitotic kinases
A major function of CDK1 is to prevent precocious cytokinesis before proper chromosome segregation. CDK1 thus negatively regulates some of the main players of cytokinesis. At the same time, CDK1 plays a positive role in cytokinesis by releasing cytokinesis proteins from the Golgi apparatus, and by facilitating binding of Plk1 to its substrates. Plk1 and Aurora B phosphorylate substrates that are important for both early and late steps of cytokinesis. Solid arrows indicate phosphorylation; dashed arrows indicate changed protein localization; dotted arrows indicate protein interactions. IF, intermediate filaments. (Modified by Normand and King 2010)
In this stage occurs the positioning of the division plane between the daughter nuclei; the specific site is determined through GTPase RhoA activation mediated by Rho-GEF ECT2 (epithelial cell trasforming 2) in a cascade of phosphorylations/dephosphorylations involving MgcRacGAP, PLK1 and CDK1. Another midzone motor is the kinesin-4, that accumulates at the plus end of MTs and reduces MT polymerisation and depolymerisation dynamics, stabilizing central spindle formation (Petronczi et al., 2007).
1.2 Cleavage furrow ingression
The pathway of RhoA, together with actin cross linking proteins, septin filaments and specific lipids, are involved in the organization and function of the actomyosin contractile ring at the cell equator. This dynamic structure, adequately RhoA-stimulated, undergoes remodeling and induces the attached plasma membrane ingression and the spacing of the separated material to the two opposite cell's poles (Severson et al., 2002).
1.3 Midbody formation
After the furrow ingression, the daughter cells remain connected by the midbody. At the end of the 19th century Flemming first described this dynamic organelle as tightly packed bundles of MTs with an amorphous electron dense matrix, "bulge", at its centre. Several recent studies have identified many proteins and factors, that localize at the midbody (Skop et al.2004, Hu et al.,2012). These factors are involved in several pathways, such as cytoskeletal processes, lipid rafts and vesicle trafficking. Midbody structure has been largely described, too (Hu et al., 2012). In immunofluorescence (IF) images, a non-stained region at the anti-tubulin antibodies, the so-called "dark region", is present at the center of midbody.
The organization and function of the midbody are finely regulated by the three master kinases, Cdk1, PLK1 and Aurora B (Fig. 3; Normand and King, 2010). The midbody consists of various components with dynamic distribution showing different temporal and spatial localization. According to their localization, observed by IF, the proteins of the midbody are divided into three categories: bulge, dark zone and flanking proteins. For example, as shown in the fig.4, MKLP1, MgcRacGAP and Ect2 localize at the bulge; PRC1 and KIF4A localize in the dark region; MKLP2 and Aurora B localize in the flanking zones (Hu et al., 2012).
Some components of the central spindle and contractile ring (i.e. MKLP1, KIF4, PRC1 and Aurora B) appear localize at the midbody for the whole time of their existence, and persist into a midbody remnant, a structure that, in some conditions, can persist in one of the daughter cells, after abscission. Since their asymmetric inheritance, midbody remnants are very intriguing structures, whose putative functions are still largely unknown.
Figure 4. Domains of midbody.
Midbody proteins were categorized into three groups according to their localizations (Modified by Hu et al., 2012)
1.4 Abscission
The abscission is an actin-indipendent process that removes the cytoskeletal structure from the intercellular bridge and causes the fission of the plasma membrane, allowing the physical separation of two daughter cells. Although several recent studies were performed, the abscission's molecular mechanisms are still largely unknown.
At the intercellular bridge, when furrow ingression is complete, two symmetric sites of cortical constriction become visible and the midbody look similar to a ‘bow tie’. It was hypothesized that in this zone, some filaments forming an helix surround the midbody determines a MT rearrangement and a thinning of the midbody that indicates the scission site (Elia et al., 2012).
Several trafficking regulators, such as Spastin, SNARE (soluble N-ethylmaleimide-sensitive fusion protein attachment protein receptors), Exocysts complex components and members of ESCRTs (endosomal sorting complexes required for transport) are recruited to the abscission site just outside the flanking zone after midbody assembly as components of the abscission machinery that drive this process (Elia et al., 2011; Guizetti et al., 2011). Furthermore, trafficking vesicles are accumulated at the midbody and at the abscission site (Hu et al., 2012).
In contrast with the abundance of factors identified to localize at the midbody and at the abscission site, the mechanisms required to complete the final cytokinesis stage remains not completely understood; different models have been proposed to explain the abscission mechanism. The current model involves a complex and orderly successions of events that require many components, such as members of the ESCRT's machinery, including members of ESCRT-I, ESCRT-II and ESCRT-III. This family is involved in some events, such as the formation of multi-vesicular bodies and the maintaining the integrity of midbody. Members of this family are sequentially recruited to midbody to orchestrate membrane fission during abscission (Fig. 5; Neto and Gould, 2011). During late telophase, the ESCRT complex localizes to the midbody and its recruitment is finely regulated. As described in Fig 5, in response to complex phosphorylation events by PLK1, Cep55 (centrosomal protein 55kDa) localizes to the midbody where it is recruited by the centralspindlin component, MKLP1 (Bastos and Barr, 2010). Cep55 recruits the ESCRT-I factor Tsg101 (tumor-susceptibility gene 101) to the site of scission, together with the ESCRT-I-related protein ALIX (apoptosis-linked gene 2-interacting protein X) (Hurley and Hanson, 2010). Subsequently, multiple subunit of the downstream ESCRT-III complex CHPM4B (charged multivesicular body
protein 4B), polymerize to form spiral filaments that expose their membrane interaction sites on the surface, leading to the deformation of the MT bundles, that become progressively thinner, and transform a membrane neck into a narrow constriction (Guizetti et al., 2011). MT bundles extending from either side of the dark zone of the midbody converge in two narrow membrane-constriction site that are cleaved sequentially or only one of these sites are cleaved. Here, the member of ESCRT-III's complex CHMP1B, recruits and binds the MT severing enzyme, spastin, that cuts MTs, disassembling the intercellular bridge (Connell et al., 2009; Yang et al., 2008). A portion of the midbody including the dark zone often persists after abscission, as a midbody remnant in one of the daughter cells where it is removed by autophagy.
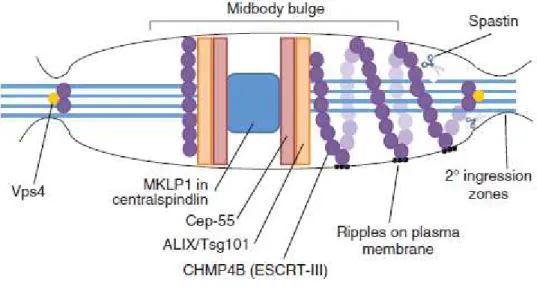
Figure 5: The ESCRT complex in abscission. The centralspindlin component recruits Cep-55 to the midbody.
Cep-55 interacts with the ESCRT-I protein Tsg101 or the adaptor protein ALIX, which are in turn proposed to recruit ESCRT-III components. Tsg101 and the ESCRT-III subunit CHMP4B (shown here as purple spheres) are sequentially recruited into the centre of the intercellular bridge where they form a series of cortical rings, shown here in the left half of this schematic midbody (Elia et al., 2011). Later in cytokinesis, CHMP4B concentrates at the narrow secondary abscission zones, closely followed by Vps4 (yellow circles), which leads to abscission at these sites. CHMP4B forms two narrow cortical rings adjacent to the midbody prior to disassembly of the MT. ESCRT-III subunits (such as CHMP4B) extend towards these sites of cortical constriction forming a series of intertwined, regularly spaced, filaments, which extend towards the site of secondary ingression, shown here on the right of this schematic midbody. These rings also give rise to the appearance of ‘ripples’ on the plasma membrane. ESCRT-III can then recruit the MT-severing enzyme spastin (shown here as scissors). (Neto and Gould, 2011)
1.5 Spastin
Spastin is a member of the AAA (associated with a variety of cellular activities) ATPases protein family. It is encoded by the SPG4 gene (Hazan, et al., 1999; Fonknechten et al., 2000; Lindsey et al., 2000). Mutations in the SPG4 gene occurs in 40% of autosomal dominant Hereditary spastic paraplegia (HSPs) cases, neurodegenerative disorders characterized by progressive spasticity of the lower extremities due to degeneration of corticospinal motor tracts (Soderblom and Blackstone, 2006; Blackstone, 2012). SPG4 mutations destroy the enzymatic activity of spastin leading to pathogenesis mainly by a haploinsufficiency mechanism. Alternatively, a few SPG4 cases involve dominant-negative or gain of function mechanisms.
Spastin possesses MT-severing ability and contributes to different processes involving MT/cytoskeleton, such as cytokinesis, membrane modelling, intracellular and axonal vesicle transports, number and motility MTs regulation and distribution of their dynamic plus-ends through breaking longer MTs into shorter ones (Trotta et al., 2004; Connell et al., 2009; Errico et al., 2002; Baas et al., 2006). It was observed that polyglutamylation of tubulin stimulates spastin-mediated severing most likely because of an increase in negative charge of the MT tails (Lacroix et al., 2010). Polyglutamylation and other modifications, such us acetylation, correspond to MTs stability; spastin preferentially cuts stable regions of axonal MTs compared to more labile and dynamic regions at the MTs plus-ends (Riano et al., 2009). Spastin is enriched in regions characterized by extensive MT/cytoskeleton remodelling, such as centrosome in interphase and during mitosis, midbody in cytokinesis, and growth cones and branching points in neurons (Errico et al. 2004; Yu et al. 2008).
Recently, ultra-structural studies have shown that spastin forms hexameric rings with pore loops that bind and tug the tubulin C-terminal tails to disrupt tubulin polymeric interactions and severs MTs (Fig. 6) (White et al., 2007; Roll-Mecak and McNally, 2010; Sharp and Ross, 2012).
Several evidence suggest that the precise stoichiometric levels of spastin are crucial for its biological functions and has been hypothesized that alterations in the level of spastin production contribute to the development or progression of the disease (Riano et al., 2009).
In proliferating cells, spastin is essential for ESCRT-dependent final abscission step, it is recruited by CHMP1B to the abscission site where is responsible for the final cut of the MT midbody; it catalyzes and resolves the intercellular bridge leading to the separation of
the two daughter cells. Spastin's MIT (microtubule interactingand trafficking) domain binds to CHMP1B and it is crucial to localize spastin to midbody (Fig. 7) (Reid et al., 2005).
Figure 6: Schematic depiction of domain architecture of Spastin
Model of hexameric Spastin showing central pore and location of pore loops and N-terminal MTBD (microtubule-binding domain). The majority of the ring is formed by the AAA ATPase domain (purple). Image is looking down into the pore cavity. Each monomer of Spastin contributes two pore loops. Pore loop 1 (yellow) lies near the mouth of the pore, whereas pore loop 2 (pink) resides deeper in the pore. The N-terminal region projects from the ring. The cartoon is loosely based on structures of many AAA ATPases. (modificated by White et al., 2007)
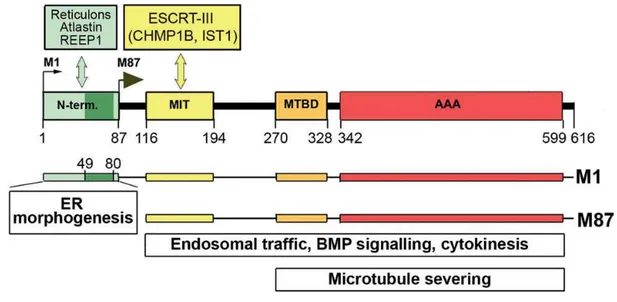
Figure 7: Schematic representation of spastin structure
M1 and M87 interacting proteins and involvement of spastin isoforms in cellular functions. Insertion of hydrophobic region (dark green, amino acids 49–80) of the M1-specific N-terminal domain (amino acids 1–87) into endoplasmic reticulum (ER) membrane and interaction with reticulons, atlastin and REEP1 is responsible for endoplasmic reticulum morphogenesis. Interaction of MIT domain (aminoacids 116–194) with ESCRT-III complex proteins is required for endosomal trafficking and cytokinesis. MT-binding domain (MTBD) (aminoacids 270–328) and AAA domain (aminoacids 342–599) are essential for MT severing, as well as endosomal trafficking and cytokinesis. BMP = bone morphogenic protein. (Solowska 2015)
As show in the Figure 8, spastin consists of four isoforms, generated by an additional translation initiation site and differential exon splicing: M1 full-length (616 aminoacids, 68 kDa) protein, a shorter isoform lacking the first 86 aa of the full-length protein (M87, 530 aminoacids, 60 kDa) and splice variants of both of these, excluding exon 4, (M1∆ex4, 64 kDa, M87∆ex4, 55 kDa) (Claudiani et al., 2005; Mancuso and Rugarli, 2008). M87 and M87∆ex4 isoforms are the two major isoforms and are ubiquitously expressed, whereas M1 isoforms expression seems to be restricted to neuronal cells. M87 isoform is always more abundant than M1, in both neuronal and non-neuronal tissues. Different solubility and stability of M1 and M87 isoforms have been observed on exogenously expressed proteins suggesting that the degradation of M87 is more efficient that that of M1 (Solowska et al., 2010); however, no studies have been carried out on the endogenous spastin isoforms.
Figure 8: Schematic representation of spastin structure.
(A) Spastin exons 1–17. (B) Spastin functional domains: N-term = N-terminal sequence present only in M1 spastin isoform; MIT = MT interacting and trafficking domain spanning residues 116-194; MTBD = microtubule-binding domain situated between residues 270-328; AAA = ATPase associated with various cellular activities spanning residues 342-599. The Kozak’s sequence tgaAUGa surrounding M1 start codon deviates considerably from a good consensus sequence g(a)ccAUGg. A better Kozak sequence ctcAUGg is present at the M87 initiation codon. (C) A leaky scanning of the first initiation codon with a poor Kozak’s sequence leads to a preferred initiation of translation at the second AUG. As a result, both 68 kDa M1 and 60 kDa M87 spastin isoforms are expressed simultaneously but at different levels. A thin dark red line represents low levels of M1 expression and a dark red bar represents considerably higher levels of M87. Light red represents the M1 and M87 regions that are not present in spastin isoforms encoded by alternatively spliced mRNA lacking exon 4. (Solowska 2015)
All spastin isoforms could be recruited to the midbody, although it was reported that M87 appears to be recruited with more efficiency than M1. (Connell et al. 2009). In spastin depleted cells, the normal abscission MT breakage does not occur, daughter cells remained attached by thin, frequently very extended intercellular bridge for many hours, and this results in delayed abscission (Connell et al., 2009; Guizetti et al., 2011).
Spastin, beside to co-localize with MTs in the cell body and midbody, is present at the ER and endosomes (Reid et al., 2005; Sanderson et al., 2006). In agreement to this localization, spastin depletion leads to increased tubulation of the early endosomal compartment and to defective receptor sorting through endosomal tubular recycling compartments. An increase in complex tubular structures has also been observed in axonal growth cones of motor neurons cultured from spastin-depleted zebrafish embryos (Allison et al., 2013). Furthermore, it was demonstrated that membrane traffic and MT regulation are coupled through spastin. ATPase-defective M1 delays traffic of cargo from the endoplasmic reticulum (ER) to the Golgi network (Connell et al., 2009). Spastin is also involved in promoting axonal branching (Yu et al., 2008). Axonal branching requires delivery of new membrane to the branch site, where MT disruption is necessary and sufficient to promote delivery of membrane-bound cargoes that can insert membrane into the growing branch (Zakharenko et al., 1998). Spastin overxpression in axons results in decreased MT mass and formation of many shorter MTs due spastin's MT-severing activity (Yu et al., 2008).
At present, few studies have been carried out to investigate the mechanisms involved in the regulation of spastin expression. The transcription factors NRF1, SOX11, and ELK1 and the microRNAs (miRNAs) miR-182 and miR-96 have been involved in spastin regulation (Henson et al., 2012; Canbaz et al., 2011).
2. Cytokinesis defects
Progress through cytokinesis in an orderly sequence of events is crucial for the maintenance of genome stability, for the control of gene expression after cell division, and for morphogenesis and tissue homeostasis. The ability to coordinate these complex systems of trafficking and remodelling of the cytoskeleton and membranes to a precise set of temporal and indeed spatial coordinates is an essential part of the cell division; whereby it is highly regulated, mainly by reversible protein phosphorylation.
Cytokynesis failure, leading tetraploid cells, might promote genome instability and tumourigenesis. Therefore, high fidelity activity of cytokinesis' regulators is essential for the cells fate (Ganem et al., 2007; Valente et al., 2015).
Uncontrolled activation/inactivation of cytokinesis factors can lead to different defects. For example, starting cleavage furrow ingression, before the complete chromatids separation, or its precocious regression might induce midbody iperstability, the persistence of long uncut
intercellular bridge (LIBs) and binucleation. Blocking furrow ingression causes cells to accumulate with midzone-like MT assemblies (Normand and King, 2010). Errors of chromosome segregation lead to form chromosome bridge that delay abscission. In the presence of chromosome bridge, the timing of abscission is controlled by Aurora B by a regulatory pathway termed "NoCut", when Aurora B remains active and maintains MKPL1 phosphorylated (Mathieu et al., 2013). This event stabilizes the interaction between the ingression furrow and the midbody and prevents the furrow regression until chromosome bridge is disassembled (Steigemann et al., 2009). Blocking abscission factors, for example by depleting single members of ESCRT-III machineries, leads to cytokinesis failure and binucleated cell formation.
3. Homeodomain Interacting Protein Kinase 2 (HIPK2)
The Homeodomain Interacting Protein Kinase 2, HIPK2, is an evolutionary conserved multifunctional serine/threonine kinase, originally identified together with other two members of the HIPK family, HIPK1 and HIPK3, as interactor of homeodomain trascription factors (Fig. 9) (Kim et al., 1998).
Figure 9. Schematic representation of HIPK2 structural domains. N-ter: N-terminal domain; HID: Homeobox
Interactive Domain; PEST: region important for HIPK2 regulation and interaction with other protein; AID: Auto-Inhibitory Domain; YH: Y and H rich domain. (Adapted from Siepi et al, 2013)
HIPK2 is involved in a lot of different signal transduction pathway and cellular events, such as cell survival, cell proliferation, transcriptional regulation, differentiation, development, apoptosis during development and DNA damage or hypoxia response, angiogenesis and antiviral responses. (Calzado et al., 2007; Rinaldo et al., 2007a; D'Orazi et al., 2012)
HIPK2 binds and phosphorylates many targets, such as trascriptional regulators, signal trasducers and chromatin modifiers (Fig. 10) (D'Orazi et al., 2002; Hofmann et al., 2002; Ritterhoff et al., 2010; Bracaglia et al., 2009). HIPK2 shows a preferential site-specific phosphorylation target at proline-flanked Ser/Thr residues. HIPK2 might act as coactivator or corepressor, depending on the promoters or the cellular context.
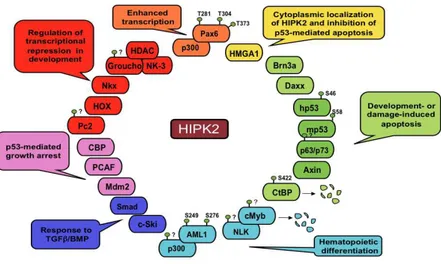
Figure 10. HIPK2 targets.
Schematic representation of HIPK2 targets with indicated biological activity and phosphorilation site/s (Adapted from Rinaldo et al., 2007a)
3.1 HIPK2 and DNA damage
The cells have generated a highly efficient signal transduction and response network to counteract and repair DNA damage.
HIPK2 plays a role in DNA damage response pathway by phosphoregulating several transcription factors and coregulators, such as the tumor suppressor p53, the p53 inhibitor MDM2, the transcriptional corepressor CtBP, the PML (tumor suppressor promyelocytic leukaemia) factor. HIPK2 and p53 colocalize at PML-Nuclear bodies and HIPK2 regulates p53 localization, phosphorylation, acetylation, and transcriptional activity. HIPK2 activity enhances both the p53-mediated trascriptional activation of proapoptotic factor, PIG3, BAX and NOXA, both the inhibition the antiapoptotic factor Galectin-3 (D’Orazi et al., 2002; Hofmann et al., 2002; Cecchinelli et al., 2006). It was demonstrated that HIPK2 is critical to control the p53 activity and to balance the cell fate of DNA damaged cells between growth arrest and apoptosis (Rinaldo et al., 2007b). In physiological conditions, HIPK2 activation is finely controlled by several protein degradation mechanisms, while in presence of DNA lesions, HIPK2 degradation is blocked. Upon DNA damage, HIPK2 binds and phosphorylates p53 at Ser46 contributing apoptosis induction and subsequent cell death (D’Orazi et al., 2002; Hofmann et al., 2002). HIPK2 can also controls DNA damage response driving degradation of the transcriptional corepressor CtBP by phosphorylation at Ser422 (Zhang et al., 2003), or controlling the activity of other apoptosis related proteins, such as p73 and p63 (Kim et al., 2002; Lazzari et al., 2011) and the p53 inhibitor MDM2 (Wang et al., 2001).
3.2 HIPK2, cytokinesis and genomic stability
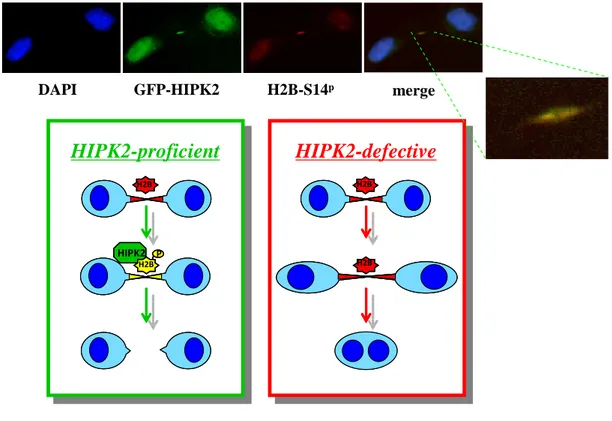
A recent study of Rinaldo and coworkers has identified a novel role of HIPK2 in cytokinesis (Rinaldo et al., 2012). This kinase controls cytokinesis by preventing tetraploidization and genome instability (Rinaldo et al., 2012; Valente et al., 2015). In particular, it was demonstrated that HIPK2 and the extra-chromosomal histone H2B co-localize at midbody during cytokinesis. Furthermore, HIPK2 was shown to phosphorilate H2B at Ser14. The localization of HIPK2 at midbody and its H2B specific phosporilation (H2B-Ser14P) are critical for a successful cytokinesis. Indeed, HIPK2 depletion, by genetic inactivation or RNA interference or HIPK2 kinase dead mutant over-expression, results in the absence of H2B-Ser14P at midbody, causing accumulation of cytokinesis defects, such as LIBs and binucleation. Notably, the over-expression of phosphomimetic mutant H2B-Ser14D is able to rescue cytokinesis failure in Hipk2 null cells, demonstrating that a catalitically active HIPK2 is required for cytokinesis through the phosphorylation of histone H2B in Ser14 (Rinaldo et al., 2012; Figure 11).
GFP-HIPK2 H2B-S14p merge DAPI
HIPK2-proficient
HIPK2-defective
H2B H2B H2B HIPK2 P H2BHIPK2-proficient
HIPK2-defective
H2B H2B H2B HIPK2 P H2B H2B H2B H2B H2B H2B HIPK2 P H2B H2BFigure 11. Graphical representation of cytokinesis in HIPK2 proficient or defective cells.
The IF images show HIPK2 and Ser14P localization during cytokinesis in HeLa cells. Lacks of H2B-Ser14P localization at midbody in HIPK2-defective cells results in cytokinesis defects and binucleation. (adapted from Rinaldo et al., 2012)
3.3 HIPK2 and cancer
HIPK2 has been reported to act as a tumour soppressor (Hofmann et al., 2012; D'Orazi et al., 2012). Reduction of HIPK2 expression leads to impaired apoptosis and induces resistance to different chemotherapeutics (Krieghoff-Henning and Hofmann, 2008; Puca et al., 2010). Hipk2-/- mice are mice more sensitive to carcinogen-induced skin cancer formation than Hipk2+/+ mice (Wei et al., 2007). Many pathways that inactive HIPK2 have been found in human cancers. In leukemogenesis and in breast carcinomas HIPK2 is trapped in cytoplasm (Wee et al., 2008; Pierantoni, personal comunications), in acute myeloid leukemia HIPK2 is mutated (Li et al., 2007), and in thyroid cancers was reported an allele-specific loss of heterozygosity (Lavra et al., 2011). A screening in thymic lymphomas demonstrated that Hipk2 is a haploinsufficient tumor suppressor gene also in vivo, with loss of one Hipk2 allele in 30% of the tumors and increased susceptibility of Hipk2+/- mice (Mao et al., 2011).
Hipk2-/- mice born at a reduced mendelian rate; though they survive and are fertile, they are smaller than their wild-type littermates throughout adulthood (Isono et al., 2006) and present proliferation defects in MEFs and in sensory neurons (Rinaldo et al., 2012 Wiggins et al., 2004). Hipk1/Hipk2 double knockout embryos die between 9.5 and 12.5 days post-coitus with proliferation defects (Isono et al., 2006). Hipk2-/- mice show an array of psychomotor abnormalities, underscoring an important role of this kinase in the nervous system (Wiggins et al, 2004; Isono et al, 2006; Zhang et al, 2007; Anzilotti et al., 2015).
Hipk2-null MEFs show cytokinesis failure and accumulate subtetraploid karyotypes developing chromosomal instability. These defects lead to inhibition of proliferation and spontaneous immortalization of primary MEFs, while increase tumorigenicity when MEFs are transformed by the E1A and Harvey-Ras oncogenes. Mice injected with E1A/Ras-transformed Hipk2-null MEFs generate tumors with genetic alterations resembling those of human cancers derived by initial tetraploidization event (Valente et al., 2015).
In conclusion, HIPK2 has many key roles in safety control of the cells, and among its oncosuppressive functions there is also the prevention of tetraploidization and genome instability.
AIM
Cytokinesis consists of an orderly sequence of crucial dynamic events that allow the segregation of the cytoplasmic material and the physical separation of two daughter cells during cell division. Proper cytokinesis is essential for maintaining ploidy and genome stability. Its failure is known to lead to genetically unstable states, such as tetraploidization and multinucleation. These events can lead to chromosomal instability (CIN), a hallmark of human cancers, and are considered critical steps in tumor formation/progression. However, the pathways involved in this process are not yet well understood.
The oncosuppressor HIPK2 is a multifunctional serine/threonine kinase involved in different signal transduction pathways and cellular events A recent study of Rinaldo and coworkers has identified a novel role of HIPK2 in cytokinesis. This kinase regulates cytokinesis preventing tetraploidization through the phosphorylation of the extra-chromosomal histone H2B at S14. These two proteins colocalize at the midbody, the organelle-like structure formed at the cleavage furrow between the two daughter cells during cytokinesis. However, which are the cytokinesis pathways regulated by HIPK2 is still missing. HIPK2-depleted cells accumulate aberrant midbodies and fail cytokinesis, leading to CIN and increased tumorigenicity (Rinaldo et al., 2012; Valente et al., 2015).
To evaluate which cytokinesis pathways are affected by HIPK2 depletion, we first analyzed the epistatic relationships localization to the midbody of known factors of cytokinesis in HIPK2 depleted cells. Once identified factors affected by HIPK2 depletion, we characterized at the biochemical and functional levels HIPK2 cross-talk with these factors.
RESULTS
EPISTATIC LOCALIZATION RELATIONSHIPS ANALYZES
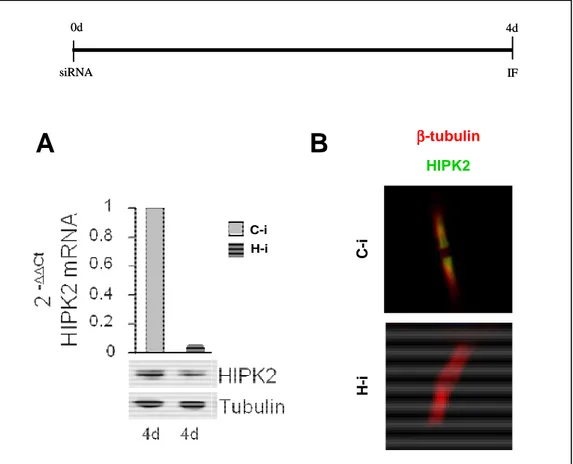
The oncosuppressor HIPK2 predominantly localizes to nuclear bodies in interphase, but during cytokinesis it is localized at the midbody (Rinaldo et al., 2012; Fig. 12-B). To start investigating the mechanisms underlying cytokinesis role of HIPK2 and to evaluate which cytokinesis stages are affected by HIPK2 depletion, we analyzed the epistatic localization relationships of known cytokinesis components at the midbody in HIPK2 depleted cells by immunofluorescence (IF). HIPK2 depletion (H-i) was obtained by transducting HIPK2 specific stealth siRNAs in HeLa cells. Cells transducted with siRNAs, whose sequence does not specifically recognize any human mRNA were used as control (C-i). IF was performed by using specific antibodies (Abs) previously verified and characterized. As reported in Fig. 12-A and B, we first verified the depletion of HIPK2 by Real Time RT-PCR, Western Blot (WB) and IF. We observed a drastic reduction of HIPK2 mRNA and protein levels four days after transduction. At this time no localization of HIPK2 at the midbody was detectable in H-i cells (FH-ig. 12-B)
0d siRNA 4d IF 0d siRNA 4d IF C-i H-i C-i HIPK2 ββββ-tubulin H -i
A
B
Figure 12. HIPK2 levels post RNAi
Upper: Schematic representation of HIPK2 interference protocol. (A) HeLa cells were transduced with control or HIPK2 siRNAs and pair samples were harvested 4 days post transduction. RNA and protein were extracted to verify HIPK2 depletion by Real-Time RT-PCR (A, upper panel) and by WB (A, lower panel), respectively. Tubulin expression was used as loading control. (B) Representative merged IF images of indicated cells are reported (midbody magnifications are shown). As expected, HIPK2 localizes at the flanking zone of the midbody in C-,i cells, while is absent in H-i cells. HIPK2 was marked with Ab 946 (green) and MT were marked with anti-β-tubulin Ab (red). DNA was stained with Hoechst (blue); in normal condition midbodies are negative to Hoechst-staining. d: days.
Next, we examined the spatio-temporal distribution of a series of structural and functional proteins sequentially recruited at different stages of cytokinesis at the midbody by IF. All the analyzes were performed four days after transduction.
Aurora B
C
-i
α αα α-tubulinINCENP
Survivin
α αα α-tubulin αααα-tubulinH
-i
PLK1
β -tubulinFigure 13. HIPK2 depletion effects on the localization of master regulative kinases involved in cytokinesis.
HeLa cells were transduced as in Fig 1. Representative merged IF images of indicated proteins in C-i and H-i cells are reported (midbody magnifications are shown). CPCs proteins (i.e. Aurora B, INCENP and Survivin) were marked with specific Abs (red); PLK1 was marked with specific Ab (green); MT were marked with
anti-α-tubulin Ab (green) or with anti-β-tubulin Ab (red); DNA was marked with Hoechst (blue). N:=80 midbodies at least were analyzed for each IF.
MKLP1
β -tubulin
McgRacGAP1
β -tubulin
ECT2 PRC1 Citron kinase
β -tubulin β -tubulin β -tubulin
C
-i
H
-i
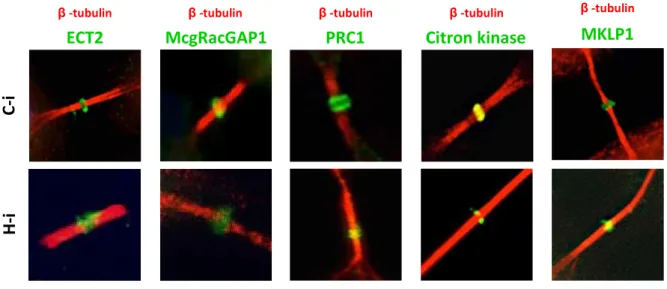
Figure 14. HIPK2 depletion effects on the localization of proteins involved in midzone/midbody formation.
HeLa cells were transduced as in Fig 1. Representative merged IF images of indicated proteins in C-i and H-i cells are reported (midbody magnifications are shown). Cytokinesis proteins were marked with specific Abs (green); MT were marked with anti-β-tubulin Ab (red); DNA was marked with Hoechst (blue). N=80 midbodies at least were analyzed for each IF.
Cep55 ββββ-tubulin ALIX ββββ-tubulin CHMP4B ββββ-tubulin Spastin ββββ-tubulin
A
B
100% 56% 96% 55% 100% 42% 100% 14% 44% 4% 45% 58% 28% 37% 0% 20% 40% 60% 80% 100% 120%C-i H-i C-i H-i C-i H-i C-i H-i
% localized % disorganized % absent
C-i H-i C-i H-i C-i H-i C-i H-i
N=191 N=56 N=191 N=110 N=150 N=178 N=296 N=294
Cep55 ALIX CHMP4B Spastin
C -i H -i % M id b o d y
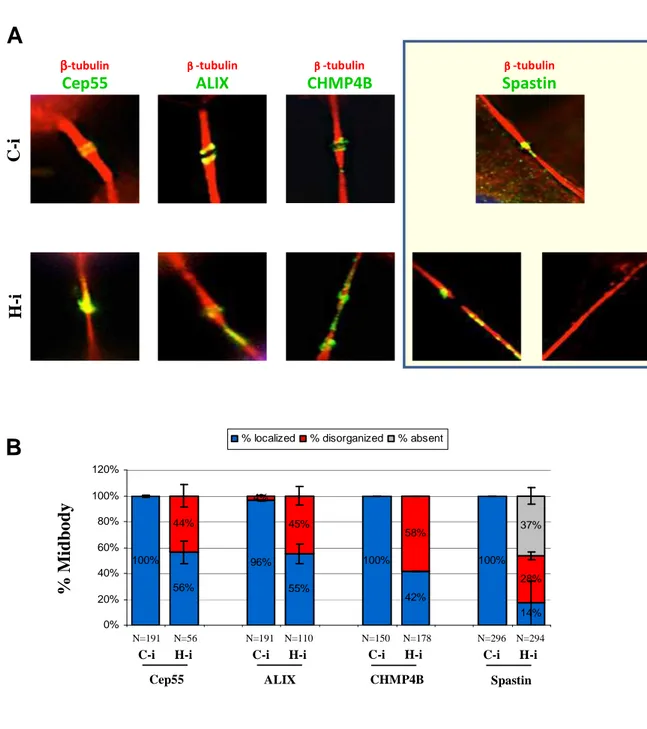
Figure 15. HIPK2 depletion effects on the localization of proteins involved in abscission.
(A) HeLa cells were transduced as in Fig 1. Representative merged IF images of indicated proteins in C-i and H-i cells (midbody magnifications are shown). Abscission proteins were marked with specific Abs (green); MT were marked with anti-β-tubulin Ab (red); DNA was marked with Hoechst (blue). (B) The percentage of midbodies in which the indicated proteins are localized, disorganized or absent is reported in the chart as mean±Standard Deviation (SD). N: numbers of analyzed midbodies for each IF.
As reported in the Figures 13, 14 and 15, we observed that in C-i cells all the examined proteins localize at the midbody, as expected (Hu et al., 2012). In particular: Aurora B, INCENP, survivin, PLK1 and ALIX localized at the flanking zone of the midbody; MKLP1, ECT2, MgcRacGAP1, Citron kinase and Cep55 localized at the bulge zone; PRC1 and CHMP4B localized at the dark zone; spastin localized at the flanking zone and at the site of ingression. In H-i cells, we observed that the master regulative kinases (i.e. Aurora B and PLK1) and the proteins involved in the formation/stabilization of midbody (i.e. MKLP1, MgcRacGAP1, ECT2 and Citron kinase) correctly localize at the midbody, as well as in C-i cells, indicating that midbody localization of these proteins is not affected by HIPK2 depletion. Conversely, some abscission factors, such as Cep55, ALIX, CHMP4B and spastin appear partly disorganized (i.e. they show a widespread distribution along the MT) in H-i cells, suggesting a role of HIPK2 at the abscission stage (Fig. 15-B). It is noteworthy that the MT severing spastin in the only factor which is absent at the midbody in a high percentage (37±4.9%) of H-i cells.
HIPK2-DEPLETED CELLS SHOW ABERRANT MIDBODY
RESEMBLING THOSE OF SPASTIN-DEPLETED CELLS
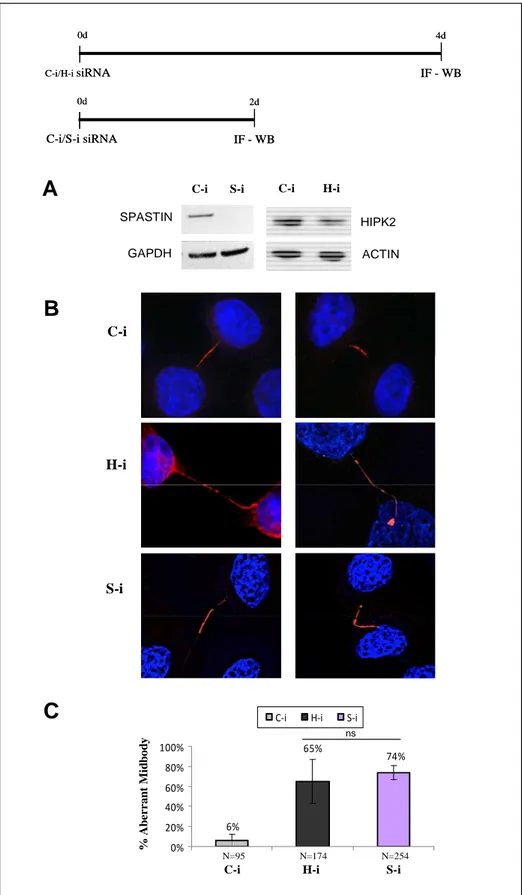
In HeLa cells, spastin depletion leads to delayed abscission, MT breakage does not occur, and daughter cells remained attached by LIB for many hours (Connell et al., 2009; Guizetti et al., 2011). This phenotype seems similar to that of HIPK2-depleted cells observed by Rinaldo and colleagues (Rinaldo et al., 2012). Therefore, we started to compare the midbody defects of HIPK2-depleted and spastin-depleted cells by IF. Spastin depletion was obtained by RNAi (S-i) in HeLa cells by transducting commercially available spastin-specific stealth siRNA; HIPK2 depletion was obtained as previously described; C-i cells were used as control. The depletion efficiency of both proteins was evaluated by WB (Fig. 16-A). Microscopy analyzes of fixed asynchronous cells revealed that aberrant midbodies of H-i cells are very similar to those of S-i cells. These aberrant midbodies are characterized by LIBs and MT disorganization, a phenotype that was hypothesized linked to LIBs formation and stretching condition triggered by abscission defects in S-i (Fig. 16-B; Connell et al., 2009). Furthermore, also the percentage of aberrant midbodies in H-i cells is similar to that of S-i cells (Fig. 16-C). These observations suggest a role of spastin in the cytokinesis defects of H-i cells.
0d C-i/H-isiRNA 4d IF - WB 0d C-i/S-i siRNA 2d IF - WB 0d C-i/H-isiRNA 4d IF - WB 0d C-i/S-i siRNA 2d IF - WB GAPDH SPASTIN
C-i S-i C-i H-i
ACTIN HIPK2 C-i H-i S-i
A
B
65% 74% 6% 0% 20% 40% 60% 80% 100%C-i H-i S-i
C-i H-i S-i
ns
C
% A b e r r a n t M id b o d yC-i H-i S-i C-i H-i
C-i S-i
N=95 N=174 N=254
Figure 16. Analyzes of midbody defects in HIPK2- and spastin- depleted cells
HeLa cells were transduced with control, spastin or HIPK2 siRNAs. Schematic representation of HIPK2 and spastin interference protocols is reported (upper panel). (A) HIPK2 and spastin protein levels were analyzed by WB. GAPDH and ACTIN were used as loading control. (B) Representative merged IF images of indicated cells stained with anti β-tubulin Ab in red and DNA marked with Hoechst in blue are shown. Aberrant midbody, such as those characterized by LIBs (left panels) or MT disorganization (right panels) are showed in S-i and H-i cells. (C) The percentage of aberrant midbodies is indicated in the chart as mean±SD. ns: not statistically significant. N: number of analyzed midbodies.
MICROTUBULES MIDBODY STABILITY IN H-i CELLS
The MT aberrant phenotype observed in H-i cells led us to hypothesize that H-i cells show a iper-stability of the MT midbody. Thus, we examined the stability of the MT midbody in H-i cells by performing a cold MT depolymerization assay in the presence of the MT depolymerising agent, Nocodazole (Fig. 17).
Treatment with Nocodazole 10µM at 4ºC
0’ 10’ 20’ 50’ time C-i H-i β-tubulin Acetyl-tubulin A % C el ls w it h A ce ty l-T u b u li n (+ ) M id b o d y Time (minutes) 0 25 50 75 100 0 10 20 30 40 50 Time (minutes) C-i H-i 0 50 100 0 10 20 30 40 50 Time (minutes) % C e ll s C-i H-i # 1 H-i # 2 H-i # 3 H-i # 4
Time (minutes) Time (minutes)
B % C el ls w it h A ce ty l-T u b u li n (+ ) M id b o d y
Figure 17. MT stability assay.
HeLa cells were transduced with control or HIPK2 siRNAs as in Fig. 12-A and treated with nocodazole at 4°C for the indicated time and then analyzed by IF 4 days post transduction. (A) Representative merged IF images of indicated cells were shown; MT were marked with anti-β-tubulin Ab (red) and acetyl-tubulin Ab (green). (B) The percentage of cells with midbodies positive for acetyl-tubulin staining is reported in the chart as mean±SD. (C) HeLa cells were transduced with control or single indicated HIPK2-specific siRNAs and treated as in A. A representative chart of the percentage of cells with midbodies positive for acetyl-tubulin staining is reported.
Cells were analyzed at different time post treatment by IF. MT midbody were marked by using not only anti-β-tubulin Ab, but also anti-Acetyl-tubulin Ab, a specific marker of stable MT (Asthana et al., 2013). As reported in the Fig. 17-A-C, we observed that Acetyl-tubulin midbody staining is completely absent 30 minutes after treatment in C-i cells. In contrast, Acetyl-tubulin midbody staining is still present in the 50% of the cells 30 minutes after treatment in H-i cells, suggesting a greater stability of the MT midbody in H-i than in C-i cells.
EXOGENOUS SPASTIN OVER-EXPRESSION RESCUES
CYTOKINESIS DEFECTS IN HIPK2-DEPLETED CELLS
Next we evaluated whether cytokinesis defects in H-i cells might be rescued by spastin exogenous expression, thus we over-expressed spastin and analyzed cytokinesis by IF in H-i cells (see Fig. 18 for protocol scheme). Flag-empty vector expressing C-i and H-i cells were used as control. Microscopy analyzes of fixed asynchronous cells show a statistically significant reduction of the percentage of binucleated cells and of aberrant midbody in transfected cells in the H-i cells over-expressing spastin variant (v) 1, compared to C-i cells over-expressing the same exogenous protein (Fig. 18-A-B). Similar data were obtained by over-expressing vectors carrying spastin v1 coding sequence fused to GFP and spastin v2 coding sequence fused to flag-myc tag (data not shown).
C-i and H-i HeLa cells were transfected with Spastin-v1 or flag-empty control vector, as above, and the abscission time (i.e., from midbody formation to abscission) was analyzed by video Time-Lapse (Fig. 19-A-C). We observed that, as expected, the abscission time is higher in flag-empty vector transfected H-i cells than in C-i cells transfected in the same manner. Notably, a significant reduction of the abscission time is evident by comparing spastin v1- and flag-empty vector- transfected H-i cells (Fig. 19-A-C), suggesting that the expression of exogenous spastin is able to partially rescue also delayed abscission phenotype in the H-i cells.
Altogether these results show that spastin over-expression is able to rescue cytokinesis defects in H-i cells.
79% 17% 11% 36% 0% 20% 40% 60% 80% 100% 1 2 3 4 5 1,5% 0,5% 0,9% 2,9% 0% 1% 2% 3% 4% 5%
empty vector spastin v1 N=3138 N=2909 N=4695 N=4049
C-i
H-i
e m p ty v e ct o r S p a st in v 1 M1 M87 M1∆ex4 M87∆ex4 flag flag flag flag V1 V2 0d siRNA 4d IF 2d Vectors 0d siRNA 4d IF 2d VectorsA
B
** ns βtubulin flag C-i H-i % f la g (+ ) B in u cl ea te d c el ls C-i H-i empty vector spastin v1N=114 N=121 N=192 N=102 C-i H-i C-i H-i
*** ns % f la g (+ ) A b er ra n t M id b o d y
Figure 18: Effects of exogenous spastin expression in HIPK2-depleted cells.
Upper: Schematic representation of RNAi followed by the plasmid transfection protocol and representation of flag-myc tagged spastin isoforms expressed by each spastin variant. C-i and H-i HeLa cells were transfected with indicated vectors and analyzed by IF. (A) Representative merged IF images of indicated cells stained with anti-flag Ab in green, anti β-tubulin Ab in red, and Hoechst in blue are shown. Midbody magnification is reported at the right of each image. (B) The percentage of flag positive aberrant midbodies (left panel) and of flag positive binucleated cells (right panel) are reported in the chart as mean±SD. N: number of analyzed midbodies or cells. *** p<0.01; ** p<0.05 t test Student.
time 37% 35% 44% 45% 45% 50% 19% 51% 20% 34% 15% 3% 0% 25% 50% 75% 100%
C-i flag em pty vector H-i flag em pty vector C-i Spastin V1 wt H-i Spastin V1 wt
0 - 150 min 150 - 300 min > 300 min
276 200 327 208 0 200 400 600
C-i flag empty vector
H-i flag empty vector
C-i Spastin V1 w t H-i Spastin V1 w t
** *** *** N=180 N=152 N=239 N=151 N = 1 7 2 N = 1 2 4 N = 2 2 8 N = 1 3 7 0d siRNA 4d 2d vectors 3d Time lapse A B C
Figure 19. Effects of exogenous spastin protein on abscission time.
Upper: Schematic representation of RNAi followed by the plasmid transfection protocol. C-i and H-i HeLa cells were transfected with indicated vectors and analyzed by Time-Lapse microscopy. Abscission time (minutes) of each cell was measured. (A) abscission time distribution is reported for the indicated samples, each horizontal bar represents one cell. (B) The abscission time is reported for
the indicated cells as mean±SD; **p<0.05;
***p<0.01 t test Student. (C) The percentage of cells with the indicated abscission time is s h o w n . N : n u mb e r o f a n a l y z e d c e l l s . C -i e m p ty v ec to r H -i em p ty v ec to r C -i S p a st in v 1 H -i S p a st in v 1
empty vector Spastin v1
C-i H-i C-i H-i
N=171 N=110 N=224 N=135
empty vector Spastin v1
C-i H-i C-i H-i
% C el ls A b sc is si o n T im e
SPASTIN OVER-EXPRESSION RESCUE CYTOKINESIS DEFECTS
BUT NOT H2B PHOSPHORYLATION AT S14
It was demonstrated that a catalytically active HIPK2 is required for faithful cytokinesis through the phosphorylation of H2B at S14 at the midbody (Rinaldo et al., 2012). To analyze whether spastin over-expression rescue cytokinesis defects by acting also on H2B-S14 phosphorylation, we evaluated spastin over-expression effect on P-H2B-S14 by IF in H-i cells. C-i H-i em p ty v ec to r S p a st in v 1 ββββ-tubulin P-H2B-S14 % H 2 B S 1 4 ( + ) a t m id b o d y 93% 33% 97% 43% 0% 20% 40% 60% 80% 100% 120% 1 2 3 4 5 N=30 N=21 N=23 N=23
empty vector spastin v1
C-i H-i C-i H-i
Figure 20. Effects of exogenous spastin expression on P-H2B-S14 in HIPK2-depleted cells.
HeLa cells were transduced with siRNA and transfected with indicated vectors as in Fig. 18, and P-H2B-S14 at the midbody localization was analyzed by IF, 4 days after transduction. Representative merged IF images of C-i and H-i cells stained with anti-P-H2B-S14 Ab in green; anti β-tubulin Ab in red and Hoechst in blue are shown (left panel). Representative chart (one of two different experiments) showing the percentage of P-H2B-S14 positive midbody in indicated cells is reported (right panel). N: number of analyzed midbodies.
We observed that the percentage of P-H2B-S14 positive midbody in H-i cells transfected with vector expressing spastin v1 (or v2; data not shown) is similar to that in H-i cells transfected with control empty vector; while, as expected, P-H2B-S14 positive midbodies are present in C-i cells transfected with empty control or vector expressing spastin v1 (Fig. 20). This result indicates that spastin over-expression rescues cytokinesis defects by acting downstream, or independently from the phosphorylation of H2B at S14.
HIPK2 REGULATES SPASTIN
The above described results suggest the existence of a relationship between spastin and HIPK2 during cytokinesis and prompted us to investigate the mechanism underlying HIPK2/spastin crosstalk. Thus, we started to analyze the protein levels of spastin in H-i cells both in asynchronous and in telophase-enriched cells compared to C-i cells, by WB.
SPASTIN ACTIN C-i H-i Asynchronous Telophase-enriched HIPK2 M87∆ex4 M87 1 0.6 1 0.5 Densit. values SPASTIN/ACTIN C-i H-i Human HeLa
Figure 21. Spastin levels in HIPK2-depleted cells.
HeLa cells were transduced with HIPK2 or control siRNA as in Fig 12. Four days after transduction asynchronous cells and telophase-enriched cells were analyzed by WB. ACTIN expression was used as loading control. Densitometric analyzes were performed. As already reported (Connell et al., 2009) and as expected for non-neuronal cells, only the two isoforms of spastin, M87 and M87∆ex4, are expressed in HeLa cells.
We observed a decrease of both detectable endogenous spastin isoforms in H-i compared to C-i cells. This reduction is observed in a mixed population of asynchronous cells as well as in telophase-enriched cells, suggesting that it is not a telophase-specific event (Fig. 21).
To exclude cell-specific events we verified that spastin decrease occurs in several different cell lines other than HeLa, such as in human lung adenocarinoma H1299, murine embryonal carcinoma p19 and murine immortalized motoneurons NSC-34. In all these cells protein levels of spastin decrease after HIPK2 depletion (Fig. 22).
Murine P19 SPASTIN ACTIN C-i H-i HIPK2 C-i H-i Human H1299 M1 M87∆ex4 M87 Long exposure C-i H-i Murine NSC-34 F o ld c h a n g e S P A S T IN /A C T IN NSC-34 M87 P19 M87 H1299 M1 M87 M87∆ex4 H-i C-i
Figure 22. Spastin protein levels in different HIPK2-depleted cells
Indicated cells were transduced with control or HIPK2 siRNAs as in Fig 12A. HIPK2 and Spastin protein levels were analyzed by WB, four days post transduction. Representative WB showing a drastic reduction of endogenous spastin protein levels in H-i cells are reported on the left. Right image show the fold changes in the densitometric values of indicated spastin isoforms (normalized against ACTIN). To be note, as expected, M1 spastin isoform is present only in the neuronal cells NSC-34. M1∆ex4 is less expressed than M1 in NSC34 cells and is not clearly detectable in this WB condition.
C-i SPASTIN GAPDH Densit. value SPASTIN/GAPDH H-i #1 1.0 0.4 0.4 0.2 Human HeLa HIPK2 H-i #2 H-i #3
Figure 23. Spastin protein levels after single HIPK2 siRNA transduction
HeLa cells were transducted with indicated single HIPK2 siRNA. HIPK2 and Spastin protein levels were analyzed by WB four days post transductions. Densitometric analyses were performed.
To exclude RNA interference off-target effects, we verified that spastin reduction occurs also by transducing each HIPK2-specific siRNA alone (Fig. 23).
Furthermore, we observed that the over-expression of exogenous HIPK2 leads to an increase of endogenous spastin levels (Fig. 24).
GFP WT GFP Empty HeLa SPASTIN GAPDH GFP-HIPK2 GFP
Figure 24. HIPK2 over-expression increases endogenous spastin protein levels.
HeLa cells were transfected with indicated GFP-HIPK2 wt or GFP expressing vectors and protein levels of indicated proteins were analyzed by WB 24 hours post transfection.
HIPK2 REGULATES SPASTIN IN A POST-TRANSCRIPTIONAL
MANNER
Next, to understand the mechanism underlying HIPK2-dependent spastin regulation, we analyzed at which level HIPK2 regulates spastin. Because HIPK2 was demonstrated to act as a transcriptional co-regulator of several promoters (Rinaldo et al., 2007; D'Orazi et al., 2012), we compared RNA and protein levels of spastin by Real Time RT-PCR and WB in H-i cells. We observed that HIPK2 depletH-ion does not sH-ignH-ifH-icantly affect spastH-in mRNA levels, suggesting that HIPK2 regulates spastin at post-transcriptional level (Fig. 25).
72 h 96 h
GAPDH
A
SPASTIN
C-i H-i C-i H-i
2 -Δ Δ Δ Δ Δ Δ Δ Δ C t S P A S T IN m R N A 2 -Δ Δ Δ Δ Δ Δ Δ Δ C t H IP K 2 m R N A
B
1.00 0,70 1.00 0,64 1.00 0,70 1.00 0,64 Densit. values SPASTIN/GAPDH 72 h 96 h ns nsFigure 25. HIPK2 interference down-regulates Spastin in a post-transcriptional manner.
A-B, HeLa cells were transduced with control or HIPK2 siRNAs as in Fig. 12-A, pair samples were collected and used to analyze protein and mRNA levels of HIPK2 and spastin by WB (A) and by Real Time RT-PCR (B), respectively at indicated time post transduction. GAPDH expression was used as loading control. Densitometric analyzes were performed.
In agreement with this result, we observed that there is a negative regulation of its expression also when spastin is expressed under the control of an exogenous promoter in H-i cells. In particularly we analyzed the effects of HIPK2 depletion on exogenous spastin variants. Two days post siRNA transduction, we transfected H-i and C-i cells with plasmids expressing one the two spastin variants (i.e. Spastin-v1-flag-myc-tagged and Spastin-v2-flag-myc-tagged) under the control of a CMV promoter. Flag empty vector was used as control. Cells were collected and analyzed by WB two days post plasmid transfection. As show in the Fig. 26, a strong reduction of endogenous and exogenous spastin isoforms was observed in H-i compared to C-i cells. Similar data were obtained also by trasfecting vectors expressing spastin variant 1 fused to GFP (data not shown). These findings indicate that HIPK2 regulates spastin at post transcriptional level and that HIPK2 might control the expression of all the known spastin isoforms.
empty vector Spastin v1 Spastin v2 C-i H-i GAPDH SPASTIN endogenous M87 *1 *2 *3 *4 C-i H-i C-i H-i
Figure 26. Effects of HIPK2 depletion on exogenous spastin proteins.
HeLa cells were transduced with control or HIPK2 siRNAs, transfected with indicated plasmids and analyzed by WB two days after siRNAs transduction. Representative WB is shown for indicated proteins. *1=M1, *2=M87, *3=M1∆exon4, *4=M87∆exon4 are exogenous tagged proteins. WB analyzes was also performed by using anti-flag and anti-myc Abs to further confirm the down-regulation of exogenous spastin isoforms (data not shown). As already reported (Solowska et al., 2014), when start codons of both isoforms had equally good Kozak’s sequences allowing equally efficient translation, as in our spastin expressing vectors, M1 isoforms accumulate significantly more than corresponding M87.
HIPK2 REGULATES SPASTIN IN A PROTEASOME-DEPENDENT
MANNER
To get an early indication of possible pathways involved in post-transcriptional regulation of spastin mediated by HIPK2, we used different inhibitors, such as the proteasome inhibitor, MG132, and the pan-caspase inhibitor, Zvad-fmk. Cells were treated four days post
interference and analyzed by WB. The solvent dimethylsulfoxide (DMSO) was used as control. 0.5 0.9 0.3 0.8 0.5 0.9 0.3 0.8 MG10 Zvad MG20 S S MG20 Zvad MG10 C-i H-i Fold change M87 SPASTIN/GAPDH GAPDH SPASTIN M87 M87∆ex4
Figure 27: Spastin down-regulation in H-i cells is proteasome-dependent.
HeLa cells were transduced with control or HIPK2 siRNAs as in Fig. 12-A and treated with indicated inhibitors or their solvent (S) DMSO. Four days post transduction cells were collected, 8 hours post inhibitor treatment, and analyzed by WB for indicated proteins. Densitometric analyzes was performed and for each treatment fold change were calculated, as ratio of spastin levels, normalized with GAPDH, between H-i samples and relative C-i. MG10=MG132 10µM; MG20=MG132 20µM; ZVAD=pan Caspase inhibitor ZVAD-fmk 50µM.
We observed that caspases inhibition does not rescue spastin protein levels in H-i cells, suggesting that caspases pathway are not involved in HIPK2-mediated spastin regulation. In contrast, proteasome inhibition partially rescues endogenous spastin protein levels in H-i cells, indicating that spastin is regulated in a proteasome-dependent manner in HIPK2-depleted cells.
HIPK2 REGULATES SPASTIN IN A
PHOSPHORYLATION-DEPENDENT MANNER
Since HIPK2 is a kinase that regulates the stability of many of its substrates through phosphorylation, we investigated whether HIPK2 kinase activity is necessary to regulate spastin protein levels. Thus, we over-expressed HIPK2 wild-type (wt) or HIPK2 kinase dead mutant, K221A, and analyzed the effects on spastin protein levels by WB. As show in Fig. 28, the over-expression of HIPK2 wt, but not kinase-dead mutant, leads to an increase of endogenous spastin protein levels, indicating that HIPK2 kinase activity is required for spastin regulation.