Section II: OPTIC DISC MORPHOLOGY IN IIH PATIENTS WITH AND WITHOUT PAPILLEDEMA: THE ROLE OF PULSE WAVE AMPLITUDE
Background
Papilledema, with the subsequent visual field loss, is the most important clinical consequence of Idiopathic intracranial hypertension (IIH). At fundus examination, optic disc appears to be hyperemic with blurring of peripapillary retinal fiber layer and absence of spontaneous venous pulsations (Tandon R, Sihota R, 2011). This condition is the result of increased perineural pressure and it is closely related to increased cerebrospinal fluid (CSF) pressure. The optic nerve is surrounded by the meningis (dura, aracnoid and pia) as it leaves the cranial cavity (Fig.1) (Jonas JB, et al. 2003. Killer HE, et al. 2003). At the subaracnoid level, numerous trabeculae and septae make up the optic nerve subaracnoid space (ONSAS) in which lymphatic structures are located. Since CSF is drained via the arachnoid
granulations as well as via the trabeculae and septae of the ONSAS, CSF pressure disorders can influence the drenage of CSF from the ONSAS and the axonal transport of toxic metabolities, the intraocular pressure (IOP) and optic venous flow (Davson H, et al. 1987. Morgan WH, et al. 2012). Optical coherence tomography (OCT) is considered a reliable non-invasive technique to study optic disc and in particular the retinal nerve fiber layer (RNFL) in order to determine the thickness of the optic nervous head (ONH). Many authors have recently described the characteristics of ONH in IIH patients with RNFL analysis and its correlated parameters: neuro rim thickness and area, optic cup volume (Huang-link, et al. 2015). These results show that OCT parameters well correlate with increased intracranial pressure (ICP). This technique can be useful to set the evolution of the optic nerve edema (Huang-link, et al. 2015. Zhang Z, et al. 2014).
There is a rapidly growing body of literature reporting significant effects of static ICP upon diseases causing papilledema but, meanwhile, there is a lack of studies about the effects of dynamic ICP on optic nerve structures.
Objective of the study
Aim of this study was to evaluate ONH structures of IIH patients with and without papilledema by OCT measurements and to investigate if the abnormalities recorded into the two groups could be influenced by CSF pwa values.
Materials and methods
Patients
Ten out of the 16 IIH patients previously enrolled for analyzing CSF parameters by lumbar pressure monitoring, were examined with OCT to evaluate optic nerve head structures.
Most of IIH patients (10 females, mean age ± SD:33.7 ± 13.1 years, range 22-53) were obese (7 out of 10; BMI:31.7±4.7 kg/m2, 24.2-43). The durantion of IIH was from 4 to 24 months.
All the IIH patients underwent the OCT measurement 24 hours before the lumbar puncture as previously reported, and were never treated with pharmacological or CSF removing before the
hospitalization. Fundus status showed papilledema in 50% of IIH patients, but none of them had optic atrophy. Only 1 patient out of 10 showed mild visual field deficit on opthalmological examination. Five out of the 12 control patients were examined with OCT and CSF lumbar pressure monitoring. The control patients (4 females and 1 male, 38.6 ± 13 years, range 25-53), were overweight (3 out of 5; BMI: 28.2±6.4 kg/m2, 19.1-37) but they had never complained visual disturbance or chronic headache.
Optical coherence tomography (OCT) measurements of optic nerve head
Imaging of optic nerve head and macula was obtained with spectral domain (SD) Cirrus HD-OCT, (model 5000, software version 6.5.0.772; Carl Zeiss Meditec Inc., Dublin, Calif., USA) for each eye of the patients and controls. Peripapillary data were obtained with 6 x 6 mm Optic Disc Cube of A-scan data centered over the optic nerve in which a 3.4 mm diameter circle of RNFL data is extracted to create what is referred to as the TSNIT map (temporal, superior, nasal, inferior, temporal).
Neuro-retinal rim area and thickness, cup volume, disc area and finally cup-to disc ratio were also calculated (see Appendix for definitions). All scans were collected by an experienced operator (C.C.) and in some cases papilledema was easily identified by ONH images alone.
The control group underwent the same ophthalmological evaluation as IIH patients.
Statistical analysis
Normality of the all values was confirmed using Saphiro–Wilk test. Student’s t-tests has been applied for parametric variables, while for non-parametric variables, differences between subgroups are analyzed with a χ 2 test. Nominal data were analyzed by Pearson’s Chi Square or Fisher’s exact test, where applicable. The difference between values in the groups was calculated by Kruskall-Wallis test and Wilcoxon test. The correlation between retinal parameters and clinical variables was evaluated by Spearman’s correlation coefficient. Statistical significance was defined as p ≥0.05. Statistical analysis was assessed using STATA 11 (Boston RC, Sumner AE. STATA: a statistical analysis system for examining biomedical data. Adv Exp Med Biol. 2003;537:353-369).
Results
Characteristics of patients are presented in Table 1.
ONH values from OCT evaluation in IIH patients are shown in Table 1 and Figure 1-2. Increased values of Rim thickness (708.5±164 μm; p=0.002) and rim area (1.7±0.2 mm2; p=0.002) are reported
in IIH group if compared to control group (Table 1; Fig.2b-c). RNFL (161.3±87.5 μm; p=0.01) was also increased in IIH group and in particular, if analyzed by separating RNFL in 4 sectors, RNFL of the inferior sector (220±160.1μm; p=0.01) was the most involved (Table1; Fig.1a). As a consequence, cup-to-disc ratio (0.03±0.00; p=0.002) and cup volume (0.05±0.1; p=0.006) were decreased if
compared to control group (table 1; Fig.2a-d). There was no significant difference for disc area (Table 1; Fig.2e). As regard the CSF pressure, all CSF values recorded showed significant difference between the two groups (Table 1).
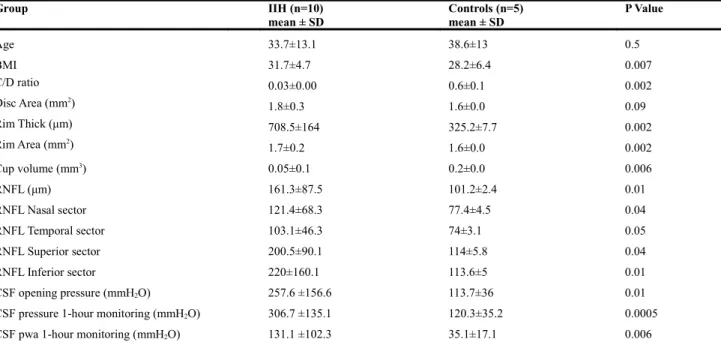
Table 1. SD-OCT measurements in IIH patients and controls.
Group IIH (n=10) mean ± SD Controls (n=5) mean ± SD P Value Age 33.7±13.1 38.6±13 0.5 BMI 31.7±4.7 28.2±6.4 0.007 C/D ratio 0.03±0.00 0.6±0.1 0.002 Disc Area (mm2) 1.8±0.3 1.6±0.0 0.09 Rim Thick (μm) 708.5±164 325.2±7.7 0.002 Rim Area (mm2) 1.7±0.2 1.6±0.0 0.002 Cup volume (mm3) 0.05±0.1 0.2±0.0 0.006 RNFL (μm) 161.3±87.5 101.2±2.4 0.01 RNFL Nasal sector 121.4±68.3 77.4±4.5 0.04 RNFL Temporal sector 103.1±46.3 74±3.1 0.05 RNFL Superior sector 200.5±90.1 114±5.8 0.04 RNFL Inferior sector 220±160.1 113.6±5 0.01 CSF opening pressure (mmH2O) 257.6 ±156.6 113.7±36 0.01
CSF pressure 1-hour monitoring (mmH2O) 306.7 ±135.1 120.3±35.2 0.0005
CSF pwa 1-hour monitoring (mmH2O) 131.1 ±102.3 35.1±17.1 0.006
IIH= idiopathic intracranial hypertension; BMI= body mass index (kg/m2); C/D ratio=cup-to-disc ratio; RNFL=retinal nerve fiber layer; CSF=cerebrospinal fluid; pwa= pulse wave amplitude.
Fig.2a.
OCT measurement CSF parameters in IIH with papilledema and controls.
When we compared data from IIH patients with papilledema (IIHWP) to control group, OCT values showed significant difference between the two groups (Table 2; Fig.2). Increased values were observed for rim thickness (776.8±168.7μm; p=0.009) and rim area (1.8±0.2mm2; p=0.009) (Table 2; Fig.2b-c).
RNFL (221±91.1 μm; p=0.01) was also increased in IIH group and, in comparison to control group, all 4 sectors were equally interested (Table 2; Fig.1b). Cup-to-disc ratio (0.02±0.01; p=0.008) and cup volume (0.02±0.00; p=0.008) were decreased if compared to control group (Table 2; Fig.2a-d). No significant difference was observed for disc area between the two groups (Table 2; Fig.2e).
All CSF values recorded showed significant difference between the two groups, and in particular CSF mean pressure (306.7 ±135.1 mmH2O; p=0.009) and CSF pwa (131.1 ±102.3 mmH2O; p=0.008)
(Table 2).
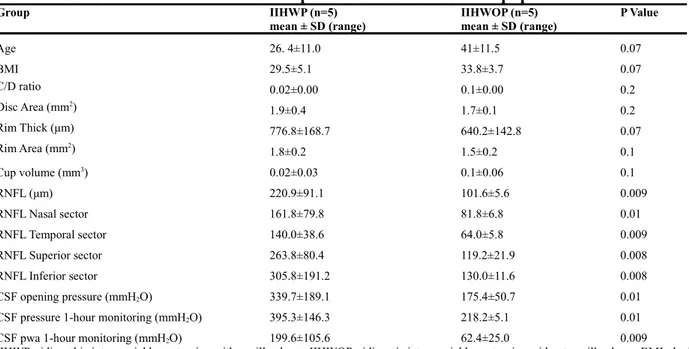
Table 2. SD-OCT measurements in IIH with papilledema patients and controls.
Group IIHWP (n=5) mean ± SD Controls (n=5) mean ± SD P Value Age 26. 4±11.0 38.6±13 0.1 BMI 29.5±5.1 28.2±6.4 0.7 C/D ratio 0.02±0.01 0.6±0.1 0.008 Disc Area (mm2) 1.9±0.4 1.6±0.0 0.1 Rim Thick (μm) 776.8±168.7 325.2±7.7 0.009 Rim Area (mm2) 1.8±0.2 1.6±0.0 0.009 Cup volume (mm3) 0.02±0.0 0.2±0.0 0.008 RNFL (μm) 221±91.1 101.2±2.4 0.009 RNFL Nasal sector 161.8±79.8 77.4±4.5 0.008 RNFL Temporal sector 140±38.6 74±3.1 0.008 RNFL Superior sector 263.8±80.4 114±5.8 0.009 RNFL Inferior sector 305.8±191.2 113.6±5 0.007 CSF opening pressure (mmH2O) 257.6 ±156.6 113.7±36 0.04
CSF pressure 1-hour monitoring (mmH2O) 306.7 ±135.1 120.3±35.2 0.009
CSF pwa 1-hour monitoring (mmH2O) 131.1 ±102.3 35.1±17.1 0.008
IIHWP= idiopathic intracranial hypertension with papilledema; BMI= body mass index (kg/m2); C/D ratio=cup-to-disc ratio; RNFL=retinal nerve fiber layer; CSF=cerebrospinal fluid; pwa= pulse wave amplitude.
Fig.2 b.
OCT measurement CSF parameters in IIH without papilledema and controls.
IIH patients without papilledema (IIHWOP) showed significant difference in the OCT measurement in rim thickness (640.2±142.8 μm; p=0.009) and rim area (1.5±0.2mm2; p=0.009) in respect to control
group (Table 3; Fig.2b-c). RNFL taken as a whole (101.6±5.6 μm; p=0.7) was not significant in IIHWOP patients, but separating RNFL in 4 sectors, the inferior one showed statistical difference between the two groups (Table 3; Fig.1c). In IIHWOP, cup-to-disc ratio (0.1±0.00; p=0.008) and cup volume (0.1±0.06; p=0.04) were decreased if compared to control group (Table 3; Fig.2a-d). As in the previous description of OCT values, no significant difference was observed for disc area between the two groups (Table 3; Fig.2e). As regard CSF values in IIHWOP, only CSF mean pressure (218.2±5.1 mmH2O; p=0.009) showed significant difference if compared to controls (Table 3).
Table 3. SD-OCT measurements in IIH without papilledema patients and controls.
Group IIHWOP (n=5)
mean ± SD Controls (n=5)mean ± SD P Value
Age 41±11.5 38.6±13 0.7 BMI 33.8±3.7 28.2±6.4 0.2 C/D ratio 0.1±0.00 0.6±0.1 0.008 Disc Area (mm2) 1.7±0.1 1.6±0.0 0.2 Rim Thick (μm) 640.2±142.8 325.2±7.7 0.009 Rim Area (mm2) 1.5±0.2 1.6±0.0 0.009 Cup volume (mm3) 0.1±0.06 0.2±0.0 0.04 RNFL (μm) 101.6±5.6 101.2±2.4 0.7 RNFL Nasal sector 81.8±6.8 77.4±4.5 0.3
RNFL Temporal sector 64.0±5.8 74±3.1 0.1 RNFL Superior sector 119.2±21.9 114±5.8 0.3 RNFL Inferior sector 130.0±11.6 113.6±5 0.009 CSF opening pressure (mmH2O) 175.4±50.7 113.7±36 0.2
CSF pressure 1-hour monitoring (mmH2O) 218.2±5.1 120.3±35.2 0.009
CSF pwa 1-hour monitoring (mmH2O) 62.4±25.0 35.1±17.1 0.2
IIHWOP= idiopathic intracranial hypertension without papilledema; BMI= body mass index (kg/m2); C/D ratio=cup-to-disc ratio; RNFL=retinal nerve fiber layer; CSF=cerebrospinal fluid; pwa= pulse wave amplitude.
Fig. 1c
OCT measurement and CSF parameters in IIH with and without papilledema.
All data from the 2 groups are showed in Table 4. By comparing data from IIHWP and IIHWOP groups, all RNFL values showed significant difference between the two groups (Table 4, Fig.1d). Rim thickness, rim area, cup-to-disc ratio, cup volume and disc area showed no significant difference between the two groups (Table 4; Fig.2a-b-c-d-e). All CSF values recorded into the two groups showed significant difference if compared, but the most involved CSF parameter was the CSF pwa
Table 4. SD-OCT measurements in IIH patients with and without papilledema.
Group IIHWP (n=5)
mean ± SD (range) IIHWOP (n=5)mean ± SD (range) P Value
Age 26. 4±11.0 41±11.5 0.07 BMI 29.5±5.1 33.8±3.7 0.07 C/D ratio 0.02±0.00 0.1±0.00 0.2 Disc Area (mm2) 1.9±0.4 1.7±0.1 0.2 Rim Thick (μm) 776.8±168.7 640.2±142.8 0.07 Rim Area (mm2) 1.8±0.2 1.5±0.2 0.1 Cup volume (mm3) 0.02±0.03 0.1±0.06 0.1 RNFL (μm) 220.9±91.1 101.6±5.6 0.009 RNFL Nasal sector 161.8±79.8 81.8±6.8 0.01 RNFL Temporal sector 140.0±38.6 64.0±5.8 0.009 RNFL Superior sector 263.8±80.4 119.2±21.9 0.008 RNFL Inferior sector 305.8±191.2 130.0±11.6 0.008 CSF opening pressure (mmH2O) 339.7±189.1 175.4±50.7 0.01
CSF pressure 1-hour monitoring (mmH2O) 395.3±146.3 218.2±5.1 0.01
CSF pwa 1-hour monitoring (mmH2O) 199.6±105.6 62.4±25.0 0.009
IIHWP= idiopathic intracranial hypertension with papilloedema; IIHWOP= idiopatic intracranial hypertension without papilloedema; BMI= body mass index (kg/m2); C/D ratio=cup-to-disc ratio; RNFL=retinal nerve fiber layer; CSF=cerebrospinal fluid; pwa= pulse wave amplitude.
Fig.2a Fig.2b
Fig.2c Fig 2 d
Fig.2e
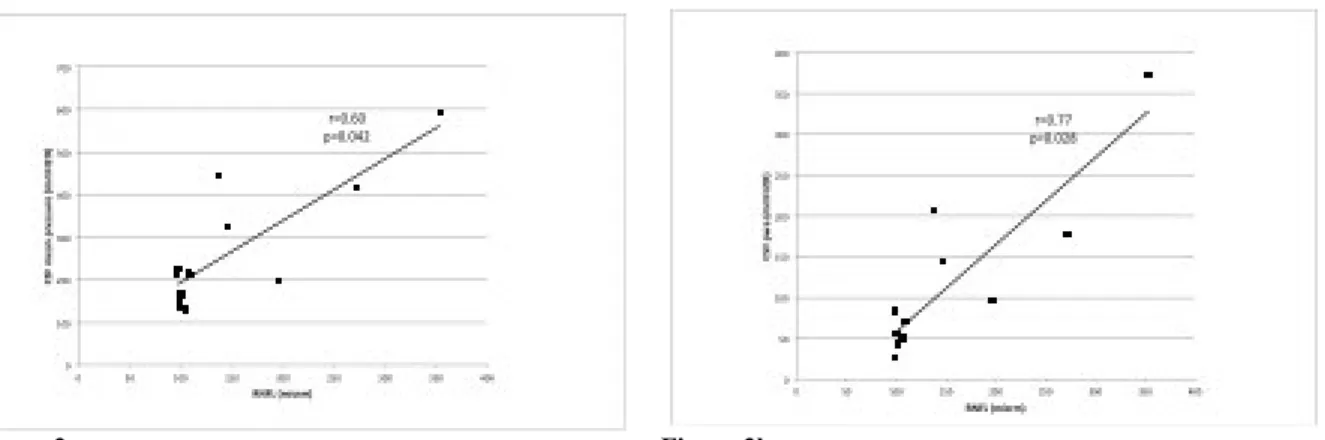
According to the presence of statistical difference for CSF opening pressure, CSF mean pressure, CSF pwa and RNFL values between these two groups, we correlated RNFL with CSF opening pressure, CSF mean pressure and CSF pwa collected in all participants. We found statistical significance for CSF mean pressure and RNFL (r=0.60, p=0.042; Fig.3a) and CSF pwa and RNFL (r=0.77, p=0.028; Fig.3b). No correlation was found for CSF opening pressure and RNFL (r=0.49; p=0.15) among patients.
Figure 3a Figure 3b
Discussion
Raised ICP affects ONH, expecially the anterior and posterior segments of lamina cribrosa. At this site IOP raises and inhibites the outflow of CSF from the ONSAS (El-Dairi MA, et al. 2007). The results are: CSF stasis in ONH; reduction of venous blood flow with increased pressure in the retinal central vein. Recently, some authors (Balaratnasingam C, et al. 2011)have reported the intermittent elevation of ICP inducing similar impairment of axonal transport in rabbit optic nerve if compared to a sustained elevation of ICP.
In this study, all IIH patients had a disease hystory not superior to 24 months and the 50% had not papilledema. CSF pressure and CSF pwa, collected from a short-term (1hour) monitoring via lumbar access, were all increased if compared to control group.
IIH group showed OCT rim thickness and area were increased, meanwhile, C/D ratio and cup volume were reduced, except for disc area that remained unchanged. These results are in line with a recent study (Huang-link, et al. 2015) in which the authors found both raised rim thickness and area. We further found reduction of C/D ratio and cup volume but normal RNFL in patients with mild
papilledema. RNFL thickness of the 4 sectors were all increased and in particular its inferior sector. This last result is probably due to the mixed sample of IIH patients, 50% of whom had papilledema. Nevertheless, our data confirm what previously shown by other authors who reported inferior sector being the thickest (El-Dairi MA, et al. 2007. Ahuja S, et al. 2015).
However, results changed when we divided the IIH group into two groups according to the presence of papilledema. In IIHWP group, all OCT measurements and CSF abnormalities were confirmed if compared to control group. In IIHWOP group rim area and thickness, cup volume and C/D ratio were pathological. Surprisingly, RNFL was normal, but when we analyzed the 4 sectors, inferior sector was increased in respect to control group. Some authors explained the presence of normal RNFL in IIH with a potentially different segmentation of swollen ONH(Huang-link, et al. 2015).
CSF pressure was increased with normal CSF pwa in IIHWOP. These results were further confirmed by comparing OCT measurements and CSF parameters between the two IIH groups.
Abnormalities of rim area and thickness, cup volume and C/D ratio could be related to a first phase of disease when CSF pressure is raised. These abnormalities do not appear to be related by the magnitude of CSF pwa. In my opinion, raised CSFpwa, as observed in IIHWP, could be considered integral part of the forces that act on retinal nerve fiber layer region.
CSF pressure influences ONSAS pressure for its anatomical proximity only when the pressure is greater than 0 mmHg (Morgan WH, et al. 1998. Wiig H, Reed RK. 1983). Similarly, there is a strong relationship between CSF pwa and IOP amplitude to generate venous pulsatility. During cardiac cycle in normal subjects, the diastolic phase generates the minimum value of arterial pressure pulse, and rapidly after minimum value of CSF pwa and IOP minima. In this cardiac cycle period, the minima vein pulsation occurs with collapse of the central retinal vein and outflow of venous blood from it (Morgan WH, et al. 2012).
In pathological conditions of increased CSF pressure and IOP pressure, CSF pwa and IOP pulse amplitudes rise together and increased venous pressure of eye and orbit, especially after acute elevation of ICP, is observed. Increased venous pressure determines slower blood flow in the retina, disc and choroid but without reduction of arterial blood flow (Rios-Montenegro EN, et al 1973. Donnelly SJ, Subramanian PS. 2009). This study suggests that the magnitude of CSF pwa in addition to the increased CSF pressure, contributes to determine more complex structural and metabolic
changes in optic nerve of IIH patients. Findings of this report may have relevance for understanding that both static and dynamic parameters of CSF pressure can define the severity of disease.
Moreover, OCT measurements can catch on the severity of the CSF dynamic disorders with a non-invasive technique.
Limitations
The CSF mean pressure and CSF pwa analyzed in the present study arise from a limited group of patients and controls. Further studies will show whether OCT parameters correlate to CSF pwa changes and whether this CSF parameter may improve its clinical usefulness.
Strength of this study
If these data will be confirmed, OCT measurements could set if a patient with signs and symptoms of raised intracranial hypertension has to undergo a CSF pressure monitoring for supporting the
diagnosis.
Conclusions
1) Raised magnitude of CSF pwa in IIH can contribute to provoke neuroretinal tissue damage by
reducing axonal transport across the optic nerve and increased resistance to the venous blood outflow from the central retinal vein.
2) OCT can be a valid instrument to evaluate ONH morphometry and to appraise the neuroretinal
tissue damage linked to raised CSF pressure and CSF pwa in IIH. In particular rim area and thickness, cup volume, C/D ratio and inferior sector of RNFL are the first parameters to become abnormal. RNFL is the last parameter to become completely abnormal when a CSF dynamic disorder is established.
BIBLIOGRAPHY
1) Ahuja S, Anand D, Dutta TK, Roopesh Kumar VR. Retinal nerve fiber layer thickness analysis
in cases of papilledema using optical coherence tomography.A case control study. Clin neurol neursurg 2015; 136:95-99.
2) Balaratnasingam C, Cringle S, Fatehee N, Morgan WH, Yu DY. Comparison of fluctuating and
sustained neural pressure perturbations on axonal transport processes in the optic nerve. Brain research 2011; 1417:67-76.
3) Bering EA Jr. Circulation of the cerebrospinal fluid demonstration of the choroid plexuses as
the generator of the force for flow of fluid and ventricular enlargement. J Neurosurg 1962; 19:405-413.
4) Bering EA Jr. Choroid plexus and arterial pUlsation of cere- brospinal fluid. Demonstration of
the choroid plexuses as a cerebrospinal fluid pump. Arch Neurol Psychiat 1955; 73: 165-172.
5) Bono F, Messina D, Giliberto C, et al. Bilateral transverse sinus stenosis predicts IIH without
papilledema in patients with migraine. Neurology 2006; 67:419-423.
6) Bono F, Salvino D, Tallarico T, et al. Abnormal pressure waves in headache sufferers with
bilateral transverse sinus stenosis. Cephalalgia 2010; 30(12):1419-1425.
7) Caballero B. The global epidemic of obesity: an overview. Epidemiol Rev 2007; 29:1–5. 8) Cardoso ER, Rowan JO, Galbraith S. Analysis of the cerebrospinal fluid pulse wave in
intracranial pressure. J Neurosurg 1983; 59:817-821.
9) Czosnyka M, Pickard JD. Monitoring and interpretation of intracranial pressure. J Neurol
Neurosurg Psychiatry 2004; 75:813-821.
10) Dandy WE. Intracranial pressure without brain tumor. Diagnosis and treatment. Ann Surg
11) Datiridou AI, Ginis HS, De BD, Tsilimbaris MK, Pallikaris IG. Ocular rigidity, ocular pulse amplitude, and pulsatile ocular blood flow: the effect of intraocular pressure. Invest Ophtalmol Vis Sci 2009; 50:5718-5722.
12) Davson H, Welch K, Segal MB. The physiology and pathophysiology of the cerebrospinal fluid. Edinburgh: Churchill Livingstone, 1987.
13) De Simone R, Ranieri A, Bonavita V. Advancement in idiopathic intracranial hypertension
pathogenensis: Focus on sinus venous stenosis. Neurol Sci 2010; 31 (Suppl 1): S33-S39.
14) Digre KB. Idiopathic Intracranial Hypertension. BMJ 2010; 341:c2836.
15) Digre KB. Not so benign intracranial hypertension. BMJ 2003; 326(7390):613-614.
16) Donnelly SJ, Subramanian PS. Relationship of intraocular pulse pressure and spontaneous venous pulsations. Am J Ophtalmol 2009; 147:51-55.
17) Eide PK, Brean A. Intracranial pulse pressure amplitude levels determined during preoperative
assessment of subjects with possible idiopathic normal pressure hydrocephalus. Acta Neurochir (Wien) 2006; 148: 1151-1156.
18) Eide PK, Brean A. Lumbar cerebrospinal fluid pressure waves versus intracranial pressure waves in idiopathic normal pressure hydrocephalus. Br J Neurosurg. 2006 Dec; 20 (6):407-14.
19) Eide PK, Egge A, Due-Tonnessen BJ, Helseth E. Is intracranial pressure waveform analysis useul in the managment of pediatric neurosurgical patients? Pediatr Neurosurg 2007; 43:472-481.
20) Eide PK, Kerty E. Static and pulsatile intracranial pressure in idiopathic intracranial
hypertension. Clin Neurol Neurosurg 2011; 113:123-128.
21) Eide PK. Intracranial pressure parameters in idiopathic normal pressure hydrocephalus patients treated with ventriculo-peritoneal shunts. Acta Neurochirur (Wien) 2006; 148:21-29.
22) Eide, Sorteberg W. Diagnostic intracranial pressure monitoring and surgical management in
2010; 66:80-91.
23) El-Dairi MA, Holgado S, O'Donnell, Buckley EG, Asrani S, Freedman SF. Optical coherence tomography as a tool for monitoring pediatric pseudotumor cerebri. J AAPOS 2007; 11:564-570.
24) Farb RI, Vanek I, Scott JN, et al. Idiopathic intracranial hypertension: the prevalence and morphology of sinovenous stenosis. Neurology 2003; 60:1414-1418.
25) Gega A, Utsumi S, Iida Y, et al. Analysis of the wave pattern of CSF pulse wave, in Shulman K, Marmorou A, Miller JD, et al (eds): Intracranial pressure IV.
Berlin/Heidelberg/New York:Springer-Verlag, 1980, pp 188-190.
26) Gucer G. Vierenstein L. Long-term intracranial pressure recording in mamagment of
pseudotumor cerebri. J Neurosurg 1978; 49:256-263.
27) Headache Classification Committee of the International Headache Society (IHS). The International Classification of Headache Disorders, 3rd edition (beta version). Cephalalgia 2013; 33: 629-808.
28) Higgingns JNP, Gillard JH, Owler BK, et al. MR venography in idiopathic intracranial hypertension:unappreciated and misunderstood. J Neurol Neurosurg Psychiatry 2004; 75:621-625.
29) Huang-Link , Al-Hawasi A, Oberwahrenbrock T, Jin YP. (2015) OCT measurements of
optic nerve head changes in idiopathic intracranial hypertension. Clin Neurol Neurosurg 130:122-127.
30) Hurst JW, Schlant RC. Examination of the arterial pulse, in Hurst JW, Logue RB, et al (eds):
The heart, arteries, and veins, ed. 3. New York: McGraw-Hill, 1974:170-179.
31) Jonas JB, Berenshtein E, Holbach L. Anatomic relationship between lamina cribrosa, intraocular space, and cerebrospinal fluid space. Invest Ophthalmol Vis Sci 2003; 44:5189–95.
32) Kapoor KG. More than meets the eye?redefining idiopathic intracranial hypertension. Int J Neurosci 2010;120:471-482.
33) Killer HE, Laeng HR, Flammer J, et al. Architecture of arachnoid trabeculae, pillars, and septa in the subarachnoid space of the human optic nerve: anatomy and clinical
considerations. Br J Ophthalmol2003; 87:777–81.
34) Luaces M, Cachofeiro V, Garcià-Munõz-Najar A, et al. Anatomical and functional alterations of the heart in morbid obesity. Changes after bariatric surgery. Rev Esp cardiol 2012; 65(1):14-21.
35) Marmarou A, Schulman K, LaMorgese J. Compartmental analysis of compliance and outflow
resistance of cerebrospinal fluid system. J Neurosurg 1975; 43:523-534.
36) Morgan WH, Lind CRP, Kain S, Fatehe N, Bala A, Yu DY. Retinal vein pulsation is in phase with intracranial pressure and not intraocular pressure. Inv Ophtalmol Vis Sci 2012; 53: 4676-4681.
37) Morgan WH, Yu DY, Alder VA et al. The correlation between cerebrospinal fluid pressure and retrolaminar tissue pressure. Inv Ophtalmol Vis Sci. 1998; 39:1419-1428.
38) Quincke H. Über Meningitis serosa: sammlung linische Vortra 67. Inn Med 1893; 23:655-694
39) Rios-Montenegro EN, Anderson DR, Noble JD. Intracranial pressure and ocular hemodynamics. Arch Ophtalmol 1973;89:52-58.
40) Tandon R, Sihota R, editors. (2011) Diseases of the optic nerve. Parsons’ Diseases of the Eye. India: Elsevier: 328–52.
41) Torbey MT, Geocadin RG, Razumovsky AY, Rigamonti D, Williams MA. Utility of
CSF pressure monitoring to identify idiopathic intracranial hypertension without papilldema in patients with chronic daily headache. Cephalalgia 2004; 24:495-502.
42) Tso MO, Hayreh SS. Optic disc edema in raised intracranial pressure. III. A pathologic study of experimental papilledema. Arch Ophthalmol 1977;95:1448–57.
43) Tso MO, Hayreh SS. Optic disc edema in raised intracranial pressure. IV. Axoplasmic transport in experimental papilledema. Arch Ophthalmol 1977;95:1458–62.
44) Urbina EM, Khoury PR, McCoy C, et al. Cardiac and vascular consequences of pre-hypertension in youth. J Clin Hypertens (Greenwich) 2011; 13(5):332-342.
45) Wall M. Idiopathic Intracranial Hypertension. Neurol Clin 2010; 28:593-617.
46) Wiig H, Reed RK. Rat brain interstitial fluid pressure measured with micropipettes. Am J Physiol 1983; 244:h239-246.
47) Yada K, Nakava Y, Tsuru M. Circulatory disturbance of the venous system during experimental
intracranial hypertension. J Neurosurg 1973; 39:723-729.
48) Zee CM, Shapiro K. The origin of CSF pulse wave. In Hoff JT, Betz AL (eds) Intracranial pressure VII. Springer, Berlin: 164-165
49) Zhang Z, Wang X, Jonas JB, Wang H, Zhang X, Peng X et al. Valsalva manouver, intraocular pressure, cerebrospinal fluid pressure, optic disc topography:beijing intracranial and intra-ocular pressure study. Acta ophtalmol 2014;92:e475-80.