1
Analysing the Systemic Risk of Indian Banks
AbstractThis paper adopts the TENET – Tail Event Driven Network modeling structure to assess the systemic risk of Indian banks. Building upon the Value at Risk (VaR), Conditional Value at Risk (CoVaR) and a Single Index Model (SIM) in a generalized quantile regression framework, the results suggest that the interconnectedness among Indian banks intensifies during the crisis period. These results open a new avenue to explore the deeper cracks in the Indian banking system.
JEL Classifications: G01, G18, G32, C21, C51, C63
Keywords: Systemic Risk Network, Government Policy and Regulation, Financial Policy,
1
1. Introduction
Indian economy is currently experiencing an unprecedented level of systemic risk in its banking system. The genesis of this crisis is often linked with the mid-2000s investment boom when the Indian government announced major infrastructure investment plans related to power generation, steel, and telecom sectors to augment the growth process. The Economic Survey (2016-2017) also linked it with the Twin Balance Sheet (hereafter TBS) syndrome under which worsening profit and consequent default on corporate loans impaired the balance sheet of lending banks. In a comprehensive policy exercise, in 2015, the Reserve Bank of India (henceforth, RBI) conducted an Asset Quality Review (AQR) under which banks were directed to clear the debris of bad corporate debt and to report the number of loans accounts which may turn sooner or later into non-performing assets (NPAs). From research perspective, the crisis has opened a flood gate to examine the Indian banks from various dimensions including the assessment of systemic risk.
In this study, we aim to measure the strength of interconnectedness among government and privately owned banks to understand the riskiness of the Indian banking system. To do this, we apply the methodology of Tail-Event-Driven Networks (TENET) proposed by Härdle et al. (2016). We use the model for two reasons: Firstly, it helps to calculate the riskiness of Indian banking system under an ultra high-dimensional set-up which allows incorporating not only the macroeconomic variables but also the balance sheet variables in systemic risk analysis. Second, the magnitude of directional connectedness helps us identify the major systemic risk receiver (SRR) and systemic risk emitter (SRE) banks. By taking into account
2
the period of release of the AQR report and Bank of Baroda as an anecdotal event, this study is the first systemic attempt to study the systemic risk in the Indian context.1
The notable studies in the field of systemic risk can be divided into three generations: the first generation focusses upon the factor approach based correlations of financial assets across financial institutions to calculate their default probabilities (Huang et al., 2009; Zhou, 2010; Kritzman et al., 2011; Billio et al., 2012; Patro et al., 2013). The second generation focusses upon tail dependence across financial institutions at different risk levels (Zhou, 2010; Acharya et al., 2012; Banulescu and Dumitrescu, 2015; Adrian and Brunnermeier, 2016; Acharya et al., 2017; Brownlees and Engle, 2017). The third generation covers the systemic risk using network models to analyse the interconnectedness across financial institutions by inferring upon the magnitudes of nodes and edges (Billio et al., 2012; Diebold and Yılmaz, 2014; Levy-Carciente et al., 2015; Battiston et al., 2016; Härdle et al., 2016; Wang et al., 2018).
The rest of the paper is organized as follows. In section 2, we explain the data and TENET model specification. Section 3 discusses the results and application of TENET model. Section 4 concludes.
2. Data and methodology
In this study, we use weekly data that covers the period from 12 January 2007 to 31 March 2017 on 31 Indian Banks, out of which 20 are government-owned banks and 11 are private banks. The banks considered in our study are listed in Table (1) along with their abbreviations and the descriptive statistics for the returns of these banks over the sample period. The sample series are retrieved from Thomson DataStream and Reserve Bank of India
1
We consider Bank of Baroda (hereafter, BOB) because after the promulgation of AQR report by RBI, BOB has reported the maximum loss (Economic Survey, 2016-2017). For TENET analysis, we have identified February 2016.
3
(RBI). Following Härdle et al. (2016) and Wang et al. (2018), we include the balance sheet variables, which include leverage, size, market to book ratio, debt to maturity, return on assets (ROA). Keeping in mind the liquidity and risk coverage dimension, we consider short-term liquidity spread, immediate period changes in the 90-day treasury bill rate, spread between ten-year and three-month treasury bill rate, credit spread, stock market returns, market volatility, lending rate and weekly equity returns of each sample bank. The sample variables are outlined in online appendix Table (A1) along with their description and sources.
Following Härdle et al. (2016), we adopt three steps empirical procedure to perform TENET analysis of Indian banks. At first step, we calculate the Value at Risk (VaR) and CoVaR (Conditional Value at Risk) of sample banks at 0.01 and 0.05 quantiles to capture the tail event and also to test the robustness of results. We calculate VaR of each bank i at given
(0,1)
at time t as: P B( i t, VaRi t, ,) , where is the quantile level, Bi t, shows the log returns of bank i at time t. The CoVaR of a sample bank j given Bi t, at given level (0,1)is defined as P B( j t, VaRj t| , |Ri t,), where Ri t, denotes the information set which includes the events of Bi t, VaRi t, ,and Mt1. Mt1 includes the vector of macroeconomic variables. Following Härdle et al. (2016), our specification of CoVaR follows two-step linear quantile regression (hereafter, LQR) procedure:
, 1 , i t i i t i t B M (1) , | | 1 | , | , j t j t j i t j i j t j i t B M B (2)
We then apply the quantile regression of return of a bank i on the macro variables to determine the VaR of a bank i . j i| shows the extent of sensitivity of a bank j to changes in
4
tail event log return of a bank i. Similarly, the CoVaR is obtained by plugging in VaR of bank i at level τ estimated in equation (3) into the equation (4):
, , 1 i t i i t VaR M (3) | , , | | 1 | , , j i t j t j i t j i i t CoVaR M VaR (4)
At the second step, we adopt a single index model (SIM) for generalized quantile regressions to find the systemic risk contribution of each banks in our sample conditional on its tail interconnectedness with relevant banks. The step builds the systemic risk network by applying the directional spillover approach given by Diebold and Yilmaz (2014) as follows:
, | j , , j t j R j t j t B f R (5)
| j, , ˆ | j , j R t j R j t CoVaR f R (6)
, , | , |R R | , | , ˆ ˆ | j j j j j t j t j R j t j R j R j t j R j t f R D f R R (7)where Rj t, {Xjt,Mt1,Sj t, 1}is the information set which includes k variables.
1 2 ,
{ , ,..., }
jt t t m t
X X X X are the explanatory variables, which include the returns of all the
sample banks except for Bank of Baroda (BOB) j. m shows the number of banks. Sj t, 1 is the bank-specific characteristics indicators calculated from their balance sheet. We define the
parameters as |
| , | , |
j j
j R j j j M j S
which are static. To get the time-varying estimates, we use the rolling window estimation to estimate all coefficients. Dj|Rjshows the gradient that
5 expression is Dj|Rj
Dj| j,Dj M| ,Dj S| j
. Dj|j shows the spillover effects across sample
banks and also to characterize their networks. It is again noteworthy that the network charts
exhibit the partial derivatives of banks j with respect to other banks i.e. Dj|j and do not
include Dj S| jand macroeconomic variablesDj M| .
In the third step, we identify the S-DIBs based on SRR and SRE measures. The SRR for a bank j therefore defined as:
, , (| | | . , ) IN s s j s j s j i i s i k SRR MC D MC
(8)The SRE for a bank j is defined as
, , (| | | . , ) OUT s s j s j s i j i s i k SRE MC D MC
(9) where IN s k and OUT sk are the set of banks connected with bank j (BOB) by incoming and
outgoing networks at window s, respectively. MCi s, represents the market capitalization of bank i at the starting point of window s. |Dsj i| | and |Di js| | are absolute partial derivatives which represent row (incoming) and column (outgoing) directional connectedness of bank j to i.
3. Results
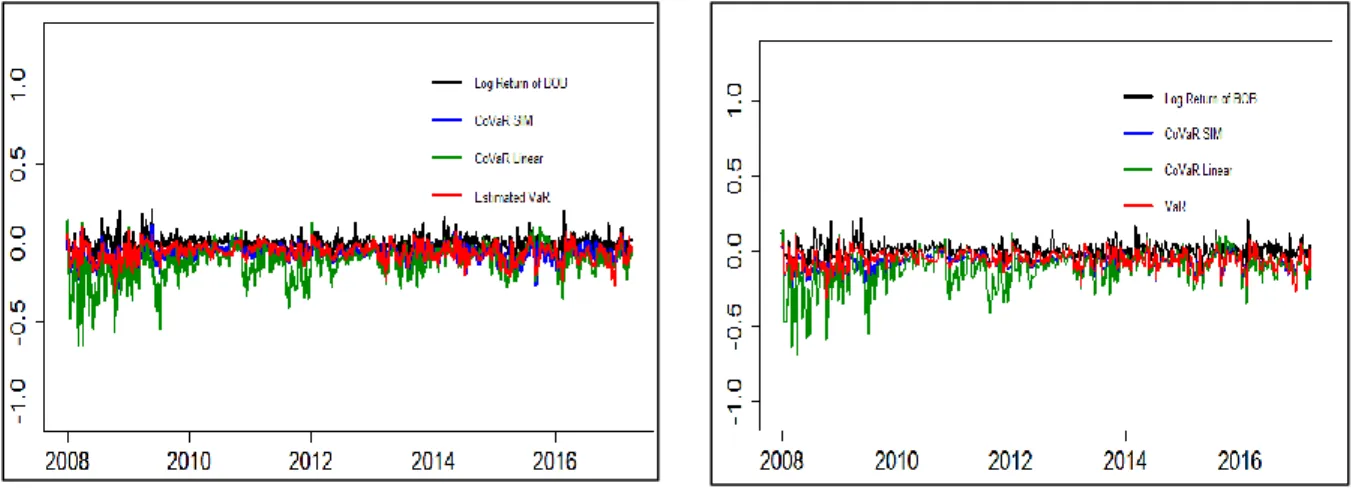
Fig. (1) shows the estimated VaR (red line) and CoVaR of BOB estimated by applying linear and SIM models (green and blue lines). The two measures (VaRs and CoVaRs) at 0.01 and 0.05 quantiles exhibit high variations during 2008-2009, a period marked as a global financial crisis (GFC, 2008). Without reporting the results of total and directional connectedness, we analyze the connectedness of Indian banks with incoming and outgoing links at 0.05 and 0.01
6
quantiles shown in figs (2, panels A&B).2 We divide our sample of Indian banks into two groups: government-owned banks (GOBs) and private-owned banks (POBs). Using the rolling window of 50 weeks (534 observations), the results indicate that the GOBs appear to be more sensitive during crisis and slowdown phases as compared to POBs. The figures also capture the major crisis events such as the GFC and the periods of the subdued performance of Indian banks reported by the Financial Stability Report (FSR, December 2015) of RBI. The FSR (2015) revealed the issues of reforms and recapitalization of Indian banks and balance sheet slowdown.3 The steep rise in the incoming and outgoing links of both the groups exhibit the strong connection, suggesting the possible impact of post-TBS crisis and the enactment of IBC.
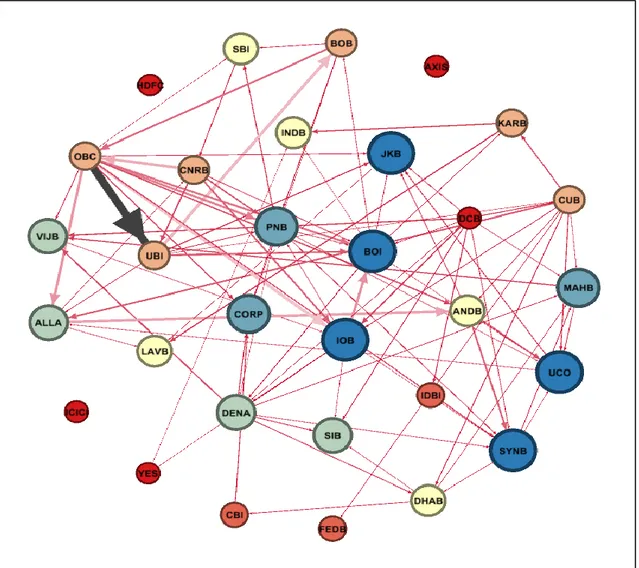
Fig. (3) shows the bank level interconnectedness using networks:DCsj i| |Dˆsj i| |. The node shows the size of the bank represented by market capitalization and edge shows the strength of pairwise connections. We find that at 0.05 quantile, OBC appears to be strongly connected to UBI and ALLA. And at 0.01 quantile, two pairs (ALLA to ANDB) and (OBC to UBI) exhibit strong relationship. Overall, we find that OBC appears to be the common at both quantiles exhibiting the strong interbank connectedness. It may need further investigation at micro level.
We also find that the mid-size banks appear to have strong bilateral connections than the large banks. GOBs exhibit directional connectedness with POBs. For instance, HDFC, ICICI, AXIS, FEDB and YES banks exhibit limited interdependence except for DCB. We also rank the banks based on the magnitude of outgoing (To) and incoming (From) links shown in online appendix tables (A2 & A3). We find that the most connected bank with incoming link is UBI followed by IOB and OBC. The most connected bank with the outgoing
2 The detailed results are available upon request.
7
link is OBC followed by UBI and DCB. These results suggest that the most risk emitting bank seems to be OBC followed by ALLA.
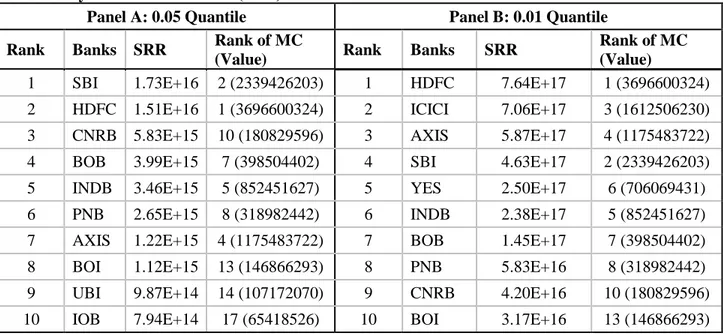
We also calculate the exact systemic risk measure for each bank based on their extent of connectedness using equations (8 & 9). We do this by considering the market capitalization of each bank and its connected banks with incoming and outgoing links. Tables (2&3) show the ranking of the top 10 calculated SRRs and SREs at 0.05 and 0.01 quantiles, respectively. At 0.05 quantile, top three SRRs and SREs are SBI, HDFC & CNRB and PNB, YES & AXIS, respectively. At 0.01 quantile, top three SRR and SRE are the same: HDFC, ICICI, and AXIS. The striking finding is that the rankings confirm the RBI’s classification of D-SIBs. Since August 2015, RBI has been publishing the list of D-SIBs as part of its Financial Stability Report. As of April 2016, the D-SIB included SBI, ICICI and HDFC banks.4 Out of these three, two banks (SBI and HDFC) appeared in our list of SRR rankings. Similarly, at 0.01 quantile, we find HDFC and ICICI as the major SRE banks.
4. Conclusion
In this paper, we assess the systemic risk of the crisis-ridden Indian banking sector using the novel methodology. The analysis almost explains the different facets of inter-bank connectedness. The key takes away is that the model helps identify the major risk receiving and emitting banks. The model also helps identify the D-SIBs which agree with the rankings of RBI. We finally recommend the formal adoption of TENET model in systemic risk analysis.
References
Acharya, V. V., Pedersen, L. H., Philippon, T., & Richardson, M. (2017). Measuring system risk. The Review of
Financial Studies, 30(1), 2–47.
4 For more details, please refer: https://rbi.org.in/Scripts/BS_PressReleaseDisplay.aspx?prid=41556 (accessed
8
Acharya, V., Engle, R., & Richardson, M. (2012). Capital shortfall: A new approach to ranking and regulating systemic risks. American Economic Review, 102(3), 59-64.
Adrian, T., & Brunnermeier, M. K. (2016). CoVaR. American Economic Review, 106(7), 1705-41.
Banulescu, G.-D., & Dumitrescu, E.-I. (2015). Which are the SIFIs? A Component Expected Shortfall approach to systemic risk. Journal of Banking & Finance, 50, 575-588.
Battiston, S., Gatti, D. D., Gallegati, M., Greenwald, B., & Stiglitz, J. E. (2012). Liaisons dangereuses: Increasing connectivity, risk sharing, and systemic risk. Journal of Economic Dynamics and Control,,
36(8), 1121-1141.
Billio, M., Getmansky, M., Lo, A. W., & Pelizzon, L. (2012). Econometric measures of connectedness and systemic risk in the finance and insurance sectors. Journal of Financial Economics, 104(3), 535-559. Bisias, D., Flood, M., Lo, A. W., & Valavanis, S. (2012). A Survey of Systemic Risk Analytics. Annual Review
of Financial Economics, 4, 255-296.
Brownlees, C., & Engle, R. F. (2016). SRISK: A conditional capital shortfall measure of systemic risk. The
Review of Financial Studies, 30(1), 48-79.
Diebold, F. X., & Yılmaz, K. (2014). On the network topology of variance decompositions: Measuring the connectedness of financial firms. Journal of Econometrics, 182(1), 119-134.
Härdle, W. K., Wang, W., & Yu, L. (2016). TENET: Tail-Event driven NETwork risk. Journal of
Econometrics, 499-513.
Hautsch, N., Schaumburg, J., & Schienle, M. (2014). Financial network systemic risk contributions. Review of
Finance, 19(2), 685-738.
Hautsch, N., Schaumburg, J., & Schienle, M. (2015). Financial Network Systemic Risk Contributions. Review of
Finance, 19(2), 685–738.
Huang, X., Zhou, H., & Zhu, H. (2009). A framework for assessing the systemic risk of major financial institutions. Journal of Banking & Finance, 33(11), 2036-2049.
IMF. (2009). Global Financial Stability Report: Responding to the Financial Crisis and Measuring Systemic
Risk. Washington DC: International Monetary Fund.
Kritzman, M., Li, Y., Page, S., & Rigobon, R. (2011). Principal Components as a Measure of Systemic Risk.
The Journal of Portfolio Management, 37(4), 112-126.
Levy-Carciente, S., Kenett, D. Y., Avakian, A., Stanley, H. E., & Havlin, S. (2015). Dynamical macroprudential stress testing using network theory. Journal of Banking & Finance, 59, 164-181.
Patro, D. K., Qi, M., & Sun, X. (2013). A simple indicator of systemic risk. Journal of Financial Stability, 9(1), 105-116.
Financial Stability Report (2015). Report on Trend and Progress of Banking in India 2014-15 and Financial
Stability Report December 2015. Mumbai, India: Reserve Bank of India (RBI).
Economic Survey (2016-2017). Economic Survey 2016-2017. New Delhi: Ministry of Finance, Govt. of India . Wang, G. J., Xie, C., He, K., & Stanley, H. E. (2017). Extreme risk spillover network: application to financial
institutions. Quantitative Finance, 17(9), 1417-1433.
Wang, G.-J., Jiang, Z.-Q., Lin, M., Xie, C., & Stanley, H. E. (2018). Interconnectedness and systemic risk of China's financial institutions. Emerging Markets Review, 35, 1-18.
Zhou, C. (2010). Are banks too big to fail? Measuring systemic importance of financial institutions.
Figure 1: Riskiness of Bank of Baroda (BOB)
Bank of Baroda [0.05 quantile] Bank of Baroda [0.01 quantile]
Notes: This figure shows the log returns of Bank of Baroda (BOB). The conditional risk measures (VaR, CoVaR SIM and CoVaR Linear) of BoB exhibit the clustering effect during 2008-2009, a period marked as global financial crisis period.
Figure 2: Total connectedness and Lambda
[0.05 quantile] [0.01 quantile]
TENET-IN [0.05 quantile] TENET-IN [0.01 quantile]
Panel B: Outgoing links
TENET-OUT [0.05 quantile] TENET-OUT [0.01 quantile]
Figure 4: The tail-event driven network (TENET) of Indian banks Q uant il e 0.05
Q
uant
il
e
Note: To exhibit the interbank connectedness, we identify the anecdotal event date as 12 February 2016 when the stock market received the major jolt on the back of huge losses reported by major banks.
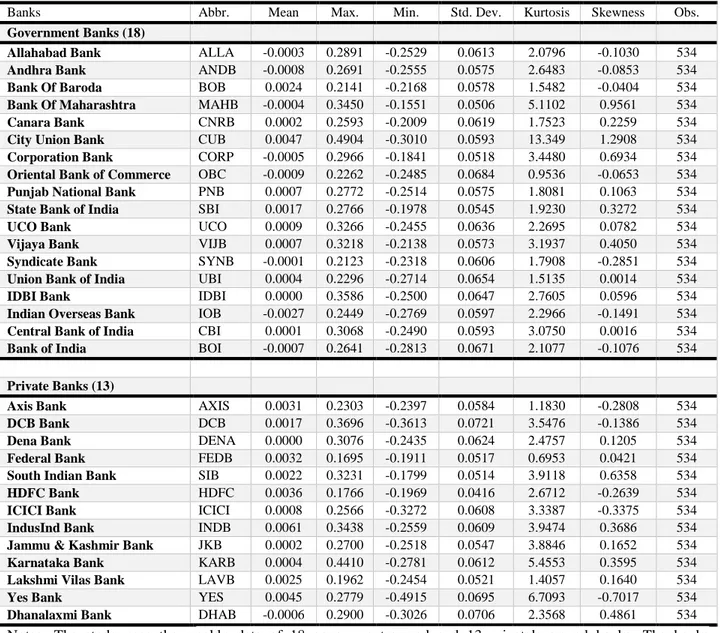
Table 1: Descriptive statistics of Indian banks
Banks Abbr. Mean Max. Min. Std. Dev. Kurtosis Skewness Obs.
Government Banks (18)
Allahabad Bank ALLA -0.0003 0.2891 -0.2529 0.0613 2.0796 -0.1030 534
Andhra Bank ANDB -0.0008 0.2691 -0.2555 0.0575 2.6483 -0.0853 534
Bank Of Baroda BOB 0.0024 0.2141 -0.2168 0.0578 1.5482 -0.0404 534
Bank Of Maharashtra MAHB -0.0004 0.3450 -0.1551 0.0506 5.1102 0.9561 534
Canara Bank CNRB 0.0002 0.2593 -0.2009 0.0619 1.7523 0.2259 534
City Union Bank CUB 0.0047 0.4904 -0.3010 0.0593 13.349 1.2908 534
Corporation Bank CORP -0.0005 0.2966 -0.1841 0.0518 3.4480 0.6934 534
Oriental Bank of Commerce OBC -0.0009 0.2262 -0.2485 0.0684 0.9536 -0.0653 534
Punjab National Bank PNB 0.0007 0.2772 -0.2514 0.0575 1.8081 0.1063 534
State Bank of India SBI 0.0017 0.2766 -0.1978 0.0545 1.9230 0.3272 534
UCO Bank UCO 0.0009 0.3266 -0.2455 0.0636 2.2695 0.0782 534
Vijaya Bank VIJB 0.0007 0.3218 -0.2138 0.0573 3.1937 0.4050 534
Syndicate Bank SYNB -0.0001 0.2123 -0.2318 0.0606 1.7908 -0.2851 534
Union Bank of India UBI 0.0004 0.2296 -0.2714 0.0654 1.5135 0.0014 534
IDBI Bank IDBI 0.0000 0.3586 -0.2500 0.0647 2.7605 0.0596 534
Indian Overseas Bank IOB -0.0027 0.2449 -0.2769 0.0597 2.2966 -0.1491 534
Central Bank of India CBI 0.0001 0.3068 -0.2490 0.0593 3.0750 0.0016 534
Bank of India BOI -0.0007 0.2641 -0.2813 0.0671 2.1077 -0.1076 534
Private Banks (13)
Axis Bank AXIS 0.0031 0.2303 -0.2397 0.0584 1.1830 -0.2808 534
DCB Bank DCB 0.0017 0.3696 -0.3613 0.0721 3.5476 -0.1386 534
Dena Bank DENA 0.0000 0.3076 -0.2435 0.0624 2.4757 0.1205 534
Federal Bank FEDB 0.0032 0.1695 -0.1911 0.0517 0.6953 0.0421 534
South Indian Bank SIB 0.0022 0.3231 -0.1799 0.0514 3.9118 0.6358 534
HDFC Bank HDFC 0.0036 0.1766 -0.1969 0.0416 2.6712 -0.2639 534
ICICI Bank ICICI 0.0008 0.2566 -0.3272 0.0608 3.3387 -0.3375 534
IndusInd Bank INDB 0.0061 0.3438 -0.2559 0.0609 3.9474 0.3686 534
Jammu & Kashmir Bank JKB 0.0002 0.2700 -0.2518 0.0547 3.8846 0.1652 534
Karnataka Bank KARB 0.0004 0.4410 -0.2781 0.0612 5.4553 0.3595 534
Lakshmi Vilas Bank LAVB 0.0025 0.1962 -0.2454 0.0521 1.4057 0.1640 534
Yes Bank YES 0.0045 0.2779 -0.4915 0.0695 6.7093 -0.7017 534
Dhanalaxmi Bank DHAB -0.0006 0.2900 -0.3026 0.0706 2.3568 0.4861 534
Notes: The study uses the weekly data of 18 government-owned and 13 privately-owned banks. The banks considered in our study are listed along with their abbreviations and the descriptive statistics for the returns of these banks over the sample period. The sample period: 12 January 2007 to 31 March 2017.
Panel A: 0.05 Quantile Panel B: 0.01 Quantile Rank Banks SRR Rank of MC
(Value) Rank Banks SRR
Rank of MC (Value)
1 SBI 1.73E+16 2 (2339426203) 1 HDFC 7.64E+17 1 (3696600324) 2 HDFC 1.51E+16 1 (3696600324) 2 ICICI 7.06E+17 3 (1612506230) 3 CNRB 5.83E+15 10 (180829596) 3 AXIS 5.87E+17 4 (1175483722) 4 BOB 3.99E+15 7 (398504402) 4 SBI 4.63E+17 2 (2339426203) 5 INDB 3.46E+15 5 (852451627) 5 YES 2.50E+17 6 (706069431) 6 PNB 2.65E+15 8 (318982442) 6 INDB 2.38E+17 5 (852451627) 7 AXIS 1.22E+15 4 (1175483722) 7 BOB 1.45E+17 7 (398504402) 8 BOI 1.12E+15 13 (146866293) 8 PNB 5.83E+16 8 (318982442) 9 UBI 9.87E+14 14 (107172070) 9 CNRB 4.20E+16 10 (180829596) 10 IOB 7.94E+14 17 (65418526) 10 BOI 3.17E+16 13 (146866293) Notes: This table provides the ranking of the top 10 Systemic Risk Receiver (SRR) banks. The size is decided by the magnitude of market capitalization. The list of top 10 Indian banks based on the index of Systemic Risk Receiver (SRR) at 0.05 quantile (Panel A) and 0.01 quantile (Panel B).
Table 3: Systemic Risk Emitter (SRE)
Panel A: 0.05 Quantile Panel B: 0.01 Quantile Rank Banks SRE Rank of MC
(Value) Rank Banks SRE
Rank of MC (Value)
1 PNB 1.18E+16 8 (318982442) 1 HDFC 7.59E+1
7 1 (3696600324)
2 YES 8.94E+15 6 (706069431) 2 ICICI 7.44E+1
7 3 (1612506230)
3 AXIS 8.85E+15 4 (1175483722) 3 AXIS 5.47E+1
7 4 (1175483722)
4 BOB 7.94E+15 7 (398504402) 4 SBI 3.40E+1
7 2 (2339426203)
5 SBI 5.53E+15 2 (2339426203) 5 YES 3.25E+1
7 6 (706069431)
6 UBI 2.90E+15 14 (107172070) 6 INDB 1.82E+1
7 5 (852451627)
7 OBC 2.54E+15 22 (48758103) 7 BOB 1.26E+1
7 7 (398504402)
8 ICICI 2.25E+15 3 (1612506230) 8 PNB 1.04E+1
7 8 (318982442)
9 BOI 2.04E+15 13 (146866293) 9 CNRB 5.77E+1
6 10 (180829596) 10 CNRB 1.59E+15 10 (180829596) 10 CBI 4.65E+1
Appendix
Table A1: List of variables
Variable Definition Source
Price Index Weekly closing stock price of bank: The price index expresses the price of an
equity as a percentage of its value on the base date, adjusted for capital changes.
DataStream
MC Market capitalisation of bank: Market price-year end multiplied with common
shares outstanding
DataStream
MV Market value of bank: Market value on DataStream is the share price
multiplied by the number of ordinary shares in issue.
The amount in issue is updated whenever new tranches of stock are issued or after a capital change.
DataStream
BV Book value of bank: It represents the book value (proportioned common
equity divided by outstanding shares) at the company’s fiscal year end.
DataStream
Short-term debt Short-term debt of bank: It represents that portion of debt payable within one
year including current portion of long term debt and sinking fund requirements of preferred stock or debentures.
DataStream
Long-term debt Long-term debt of bank: It represents all interest bearing financial
obligations, excluding amounts due within one year. It is shown net of premium or discount.
DataStream
Total Loans Total loans of banks: Total loans represent the total amount of money loaned
to customers before reserves for loan losses but after unearned income.
DataStream
Total Assets Total assets of banks: Total assets represent the sum of cash & due from
banks, total investments, net loans, customer liability on acceptances (if included in total assets), investment in unconsolidated subsidiaries, real estate assets, net property, plant and equipment and other assets.
DataStream
Total Debt Total debt of bank: All interest bearing and capitalized lease obligations. It is
the sum of long and short term debt.
DataStream
Size Log of total assets is used as proxy measure for the bank's size DataStream
MTB Log of ratio of market value to book value of equity DataStream
Debt Maturity (DM) Debt maturity is ratio of short-term debt to long-term debt DataStream
Leverage Log of leverage , where leverage is ratio of total debt to market Value DataStream
ROA Return on assets is defined as the ratio of total loans to total assets DataStream
MIBOR Mumbai Interbank Offered Rate (MIBOR) RBI
T_bill 91 days 3 months treasury bill rate DataStream
T_bill 10yr 10 years bond rate DataStream
S&P-BSE 30 Price index S&P BSE 30 Price index
Commercial Paper Commercial paper by compound rate of interest average DataStream
STLS Short-term liquidity spread is difference between Mumbai Inter-bank Offered
Rate (MIBOR) and 91 days Treasury bill rate
----
Change in T_bill 91 days Change in the 3 months Treasury bill rate ----
T_bill 10yr - T_bill 3 months Difference Between 10 years Treasury bill rate and 3 months Treasury bill
rate
----
Credit Spread Credit spread is the difference between commercial paper and 3 months
treasury bill rate
----
Weekly Market Returns Weekly market returns is defined as log return of S&P BSE 30 price index ----
Market Volatility Log of market volatility is defined as conditional variances of BSE 30 index
using GARCH (1,1)
----
Lending Rate Prime lending rate of bank RBI
Table A2: Total directional connectedness (“FROM”)
Panel A: 0.05 Quantile Panel B: 0.01 Quantile Rank Banks IN-Sum Rank of MC
(Value) Rank Banks IN-Sum
Rank of MC (Value) 1 UBI 48.61 14 (107172070) 1 DCB 450.22 23 (48583281) 2 IOB 47.66 17 (65418526) 2 DHAB 418.15 31 (6242937) 3 OBC 46.62 22 (48758103) 3 JKB 413.88 27 (39099980) 4 ALLA 46.44 21 (54624020) 4 CBI 400.26 9 (200964362) 5 CNRB 43.24 10 (180829596) 5 UCO 397.03 20 (56384173) 6 BOB 38.25 7 (398504402) 6 DENA 374.89 30 (30147841) 7 BOI 37.12 13 (146866293) 7 OBC 373.15 22 (48758103) 8 JKB 35.26 27 (39099980) 8 UBI 372.48 14 (107172070) 9 ANDB 35.09 25 (39473424) 9 IOB 371.49 17 (65418526) 10 SYNB 34.18 18 (64448435) 10 CNRB 368.38 10 (180829596) Notes: This table shows the total connectedness of top 10 banks. The ranks are decided based on the magnitude of total connectedness (“Only From”) estimated using Härdle et al. (2016)model at the quantiles of 0.05 (Panel A) and 0.01 (Panel B).
Table A3: Total directional connectedness (“TO”)
Panel A: 0.05 Quantile Panel B: 0.01 Quantile Rank Banks IN-Sum Rank of MC
(Value) Rank Banks IN-Sum
Rank of MC (Value) 1 OBC 152.8 22 (48758103) 1 OBC 636.97 22 (48758103) 2 UBI 79.44 14 (107172070) 2 UBI 498.58 14 (107172070) 3 DCB 55.51 23 (48583281) 3 ALLA 486.9 21 (54624020) 4 IOB 41.47 17 (65418526) 4 CNRB 464.9 10 (180829596) 5 CUB 41.12 15 (91121435) 5 ANDB 433.99 25 (39473424) 6 BOI 38.45 13 (146866293) 6 UCO 430.74 20 (56384173) 7 PNB 38.13 8 (318982442) 7 DENA 428.23 30 (30147841) 8 DENA 33.4 30 (30147841) 8 BOI 400.77 13 (146866293) 9 ANDB 29.3 25 (39473424) 9 SYNB 394.31 18 (64448435) 10 CNRB 26.56 10 (180829596) 10 CBI 393.85 9 (200964362) Notes: This table shows the total connectedness of top 10 banks. The ranks are decided based on the magnitude of total connectedness (“Only To”) at the quantiles of 0.05 (Panel A) and 0.01 (Panel B).