R E S E A R C H A R T I C L E
Open Access
Chronic disease prevalence from Italian
administrative databases in the VALORE
project: a validation through comparison of
population estimates with general practice
databases and national survey
Rosa Gini
1,2*, Paolo Francesconi
2, Giampiero Mazzaglia
3, Iacopo Cricelli
4, Alessandro Pasqua
3,
Pietro Gallina
5, Salvatore Brugaletta
6, Daniele Donato
5, Andrea Donatini
7, Alessandro Marini
8,
Carlo Zocchetti
9, Claudio Cricelli
3, Gianfranco Damiani
10, Mariadonata Bellentani
11,
Miriam CJM Sturkenboom
2and Martijn J Schuemie
2Abstract
Background: Administrative databases are widely available and have been extensively used to provide estimates of chronic disease prevalence for the purpose of surveillance of both geographical and temporal trends. There are, however, other sources of data available, such as medical records from primary care and national surveys. In this paper we compare disease prevalence estimates obtained from these three different data sources.
Methods: Data from general practitioners (GP) and administrative transactions for health services were collected from five Italian regions (Veneto, Emilia Romagna, Tuscany, Marche and Sicily) belonging to all the three macroareas of the country (North, Center, South). Crude prevalence estimates were calculated by data source and region for
diabetes, ischaemic heart disease, heart failure and chronic obstructive pulmonary disease (COPD). For diabetes and COPD, prevalence estimates were also obtained from a national health survey. When necessary, estimates were adjusted for completeness of data ascertainment.
Results: Crude prevalence estimates of diabetes in administrative databases (range: from 4.8% to 7.1%) were lower than corresponding GP (6.2%-8.5%) and survey-based estimates (5.1%-7.5%). Geographical trends were similar in the three sources and estimates based on treatment were the same, while estimates adjusted for completeness of ascertainment (6.1%-8.8%) were slightly higher. For ischaemic heart disease administrative and GP data sources were fairly consistent, with prevalence ranging from 3.7% to 4.7% and from 3.3% to 4.9%, respectively. In the case of heart failure administrative estimates were consistently higher than GPs’ estimates in all five regions, the highest difference being 1.4% vs 1.1%. For COPD the estimates from administrative data, ranging from 3.1% to 5.2%, fell into the confidence interval of the Survey estimates in four regions, but failed to detect the higher prevalence in the most Southern region (4.0% in administrative data vs 6.8% in survey data). The prevalence estimates for COPD from GP data were consistently higher than the corresponding estimates from the other two sources.
*Correspondence: [email protected]
1Agenzia regionale di sanit`a della Toscana, Via Pietro Dazzi 1, 50141 Florence, Italy
2Department of Medical Informatics, Erasmus Medical Center, Dr. Molewaterplein 50, 3015 GE Rotterdam, The Netherlands Full list of author information is available at the end of the article
© 2013 Gini et al.; licensee BioMed Central Ltd. This is an Open Access article distributed under the terms of the Creative Commons Attribution License (http://creativecommons.org/licenses/by/2.0), which permits unrestricted use, distribution, and reproduction in any medium, provided the original work is properly cited.
Conclusion: This study supports the use of data from Italian administrative databases to estimate geographic differences in population prevalence of ischaemic heart disease, treated diabetes, diabetes mellitus and heart failure. The algorithm for COPD used in this study requires further refinement.
Keywords: Prevalence, Chronic disease, Validation studies, Data reuse
Background
Administrative healthcare data are collected by privately owned health maintenance organisations or government-run institutions for managerial reasons. Due to differences in healthcare systems, the content of the administrative data may vary from country to country. They may contain records collected at hospital discharge, during encoun-ters with the general practitioner (GP) or specialist, at drug prescription or dispensation, or upon request for, or conduct of, a diagnostic analysis or procedure. The con-tent also depends on the choices of the organisation: data may or may not contain diagnosis codes; drug prescrip-tions may or may not contain indication of use, data from laboratories may or may not contain the actual result.
Secondary use of administrative healthcare data has been increasing over the years, including the provision of prevalence estimates for chronic diseases [1], such as diabetes mellitus, chronic obstructive pulmonary dis-ease (COPD), hypertension, ischaemic heart disdis-ease, cere-brovascular disease, and depression. Case finding and ascertainment algorithms are tailored to the structure and type of information that is captured in the spe-cific administrative database. Sensitivity and spespe-cificity of such algorithms are conditioned on distinguishing fea-tures such as presence of drug dispensing as well as sources for diagnostic codes. The Canadian [2], Swedish [3] and Medicare [4] administrative databases, for exam-ple, contain diagnosis codes from hospitalization episodes as well as from outpatient care, hence enriching the data for estimation of chronic disease prevalence. In settings where outpatient care diagnoses are not available, other solutions have been explored. For instance, in Luxem-bourg and France, where only drug prescriptions are available, diabetes could be identified in treated patients by analysing the volume of prescriptions for anti-diabetic drugs [5].
Observational studies based on administrative databases need careful validation of the algorithms they rely on in order to provide sound epidemiologic research [6]. Validation of chronic disease case ascertainment algorithms has been performed either through direct [7] or indirect [8] clinical assessment or through indi-vidual record linkage with other electronic data sources, such as disease registries [9] or health surveys [4,10]. When individual record linkage with non-administrative data sources was not feasible, the performance of the algorithms has been inferred though external comparison
with prevalence estimates obtained from health surveys [5,11].
Italy has a tax-based, universal coverage national health system organised in three levels: national; regional (21 regions); and local (on average 10 local health units per region) [12]. Administrative data on healthcare reim-bursed by the system, such as inpatient care and drug dispensations, are routinely collected by local health units and, in some regions, sent to the regional level. Trans-mission to the national level is obligatory, and a common data model for data transmission is mandated by law on a national level. Before data are sent to the national level, however, unique personal identifiers are removed, hence record-linkage cannot be performed outside a sin-gle region. The Italian administrative databases therefore form a virtual national information system, with homo-geneous data collected at the local level. Actual databases allowing record-linkage only exist up to the regional level.
Data on diagnosis collected in outpatient settings are not part of the Italian administrative databases, there-fore algorithms for case ascertainment developed in other countries that make use of this information cannot be applied to the Italian situation. Several studies have inves-tigated the comparison between chronic disease preva-lence estimates from Italian administrative data and other Italian data sources [11,13]. However studies to date were only performed within local or regional databases. Capture–recapture technique, a more sophisticated anal-ysis aimed at estimating a suspected underascertainment when more than two lists of cases are available [14,15], was applied as well in estimating diabetes prevalence from administrative databases, in specific geographic areas of the country [16,17]. In light of the strong difference in health and healthcare quality across Italy [18] it is relevant to understand whether administrative databases can sup-port chronic disease prevalence surveillance in different areas of the country.
In 2010 the Italian national project VALORE was launched aimed at assessing quality of care for chronic diseases in five different Italian regions, based on sec-ondary use of data from administrative databases. In this study we describe prevalence estimates for diabetes melli-tus, heart failure, ischaemic heart disease and COPD from these data and compare the estimates with prevalence estimates obtained from a national GP electronic medi-cal record database and, where possible, from a national health survey.
Methods
Setting
The five regions which contributed data to the VALORE study were: Veneto (A, Northern Italy), Emilia Romagna (B, Northern Italy), Tuscany (C, Central Italy), Marche (D, Central Italy) and Sicily (E, Southern Italy). The following data files were used in the VALORE project:
Hospital discharge recordswith one main and five secondary diagnoses coded using the International Classification of Diseases, Ninth Revision, Clinical Modification (ICD9CM);
Drug dispensing recordscoded using Anatomic Therapeutic Chemical (ATC) codes for drug classification; the ATC system is the drug
classification system adopted by the World Health Organization [19];
Disease-specific exemptions from copayment to health carecoded using ICD9CM;
Inhabitant Registry (IR)with demographic information (birthyear, gender) and identifier of the GP in charge.
In each region, record-linkage within and between data files was done deterministically with a unique coded per-sonal identifier. Region B could not provide the file of exemptions from copayment. For organizational reasons, the regions participating in the VALORE project did not provide administrative data of the whole regional popu-lation, but only of specific geographical subareas. In each region raw data were extracted from the local data files and sent via File Transfer Protocol (FTP) to a single data management center, after anonymization of the coded personal identifier. A standardized automated routine was developed in Stata 9.2 to apply the case ascertainment algorithm and to calculate the prevalence estimates. Each regional sample consisted of all inhabitants registered in the selected geographical subareas and alive at the index date (January 1st 2009).
Case ascertainment
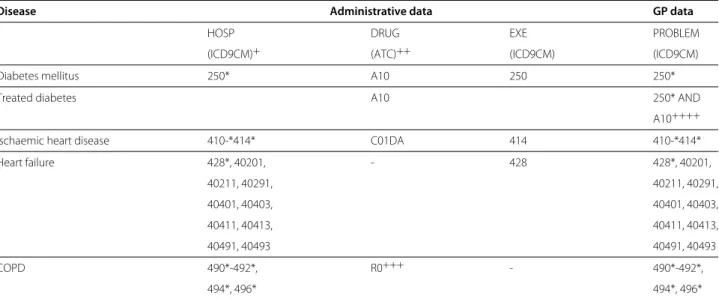
The case finding and ascertainment algorithms that were used to detect the specific diseases are shown in Table 1. Regional administrative databases link Hospital discharge records (HOSP), Drug dispensation records (DRUG), and Disease-specific exemptions (EXE) from 2003 to 2008, and a patient was classified as having the selected dis-ease if at least one of the corresponding conditions listed in Table 1 were met, i.e. condition 1 OR condition 2 OR condition 3. For 93% of the population, the full six years of follow-up data were available and were included in the analysis.
Diverse algorithms for diabetes, COPD and ischaemic heart disease case ascertainment from Italian adminis-trative databases have been previously described in the
literature. Those published in Simonato et al. [20] were the result of a workgoup involving two Italian scientific associations of epidemiologists and biostatisticians, and were therefore adopted. However, to deal with a previ-ously reported issue of lack of sensitivity, the algorithm for COPD was enriched with drug dispensing data [21]. In addition we also calculated a prevalence estimate of dia-betes based on anti-diabetic treatment alone. The heart failure algorithm was defined in the VALORE project. Comparison data
The Health Search Database (HSD) collects electronic medical record data from a network of Italian GPs who are members of the Italian College of General Practition-ers [22]. The GPs participating in HSD all use the same information software, in which they record demographic information, visits and referrals, diagnoses (both in free text and ICD9CM codes), drug prescriptions and clinical information. For this study, data from 199 GPs practic-ing in one of the five regions of the VALORE project were used. The study population comprised patients aged 16-95 who had been enrolled for at least two years and were alive on 1st January 2009. Prevalence estimates were cal-culated based on the number of patients enrolled with the GPs at the index date (January 1st 2009) as denomi-nator. The numerator represented all cases with specific diseases as ascertained through a query in the PROBLEM field of the clinical database, where diagnoses are coded. The diagnosis codes are shown in Table 1.
The Italian National Health Survey is conducted every five years by the National Institute of Statistics (ISTAT). In addition, there is a yearly survey that captures rele-vant health-related issues, and in particular diabetes and COPD. The 2008 survey in the five regions of the VALORE study comprised 11,656 people aged 16 years and above. The survey sample was extracted according to a two-stage weighted cluster sampling design (first level: municipal-ities; second level: families). Answers to two questions were used for this study: Are you affected by one or more of
the following chronic diseases? Diabetes (Yes/No) Chronic bronchitis, emphisema, repiratory failure (Yes/No). Ques-tions about heart failure and ischaemic heart disease were not asked.
Data analysis
Administrative data provided estimates of prevalence in three different ways: (1) analysis of distribution of preva-lence per GP practices; (2) pooled analysis; (3) capture-recapture analysis. While (2) and (3) provided estimates that could be compared with the regional estimates from the other two data sources, it must be noted that as the population sample from each regional population is not random, but rather geographically restricted, it was expected that the comparison was biased. The rationale
Table 1 Case ascertainment algorithms for diabetes, ischaemic heart disease, heart failure and COPD
Disease Administrative data GP data
HOSP DRUG EXE PROBLEM
(ICD9CM)+ (ATC)++ (ICD9CM) (ICD9CM)
Diabetes mellitus 250* A10 250 250*
Treated diabetes A10 250* AND
A10++++
Ischaemic heart disease 410-*414* C01DA 414 410-*414*
Heart failure 428*, 40201, - 428 428*, 40201, 40211, 40291, 40211, 40291, 40401, 40403, 40401, 40403, 40411, 40413, 40411, 40413, 40491, 40493 40491, 40493 COPD 490*-492*, R0+++ - 490*-492*, 494*, 496* 494*, 496*
Algorithms for case ascertainment of diabetes, ischaemic heart disease, heart failure, and chronic obstructive pulmonary disease (COPD), respectively from regional administrative databases and from GP databases. Regional administrative databases link Hospital discharge records (HOSP), Drug dispensation records (DRUG), and Disease-specific exemptions (EXE) from 2003 to 2008, and a patient was classified as having the selected disease if at least one of the listed conditions were met, ie condition 1 OR condition 2 OR condition 3. GP databases were queried in the PROBLEM field of the clinical database, where diagnosis are coded.
+ Either in main or in one of the secondary diagnoses. ++ At least two dispensations in different dates in a single year.
+ + + A specific algorithm involving number, heterogeneity of ATC codes and time span of dispensations is used, see [21]. + + ++ Patients having at least 2 prescriptions in one of the previous 2 years.
for analysis (1) was therefore the following: as both admin-istrative and GP data could be aggregated per practice and as practices could be considered to be (non randomly) sampled from the same population of regional practices, if the two measurement techniques (administrative versus GP data) did measure in fact the same population param-eter it was expected that the pairs of regional distributions overlapped and distributions within the same region were more similar to each other than distributions within the same data source.
All the analyses refer to the population aged≥ 16 years, both male and females, although in the GP database ages above 95 were truncated. Sex and age distribution of each regional sample were computed. The percentage of the regional population covered by the sample was estimated by dividing its number by the estimates of the regional population according to the National Institute of Statis-tics [23]. Prevalence was estimated as the total number of existing cases divided by the number of subjects in the sample. Every adult Italian inhabitant is entitled to choose a GP, and GPs may accept a maximum of 1,500 patients [12]. For each GP the population registered with that GP at the index date was calculated and used as denominator for the prevalence estimates. Median and interquartile (IQ) range of this distribution was computed in each regional sample. To avoid spurious results the disease prevalence per GP practice was computed only for those practices who had at least 300 people enrolled and at least 4 patients with the disease.
In the Health Search Database the same prevalence measures were estimated, the sample being the number of inhabitants in charge of the GPs of HSD at the index date. From the National Health Survey the variable of the first-level sampling design (municipalities) was not avail-able, hence simple weighted analysis was performed, with probability weight attributed to each individual.
Finally, to ascertain the degree of completeness in cap-turing diabetes cases from administrative data, a capture-recapture analysis was performed. Log-linear models were estimated by sequentially incorporating pair-wise depen-dency between sources, and model selection was based on the Akaike information criterion (AIC) criterion. This was not done for region B, where only two sources of data were available, since independence between two data sources could not be assumed [15].
All analyses were performed with Stata 9.2. Ethical approval
No identifiable human data were used for this study. The dataset used in the study is not openly available. Per-mission to use non-identifiable, individual data extracted from administrative databases for the VALORE project was granted by ULSS 16 Padova, ASP 7 Ragusa, Assesso-rato Politiche per la Salute Emilia Romagna, Zona Terri-toriale Senigallia, which are responsible for the use of the data of the corresponding populations. Agenzia regionale di sanit`a della Toscana is enabled by a regional law to use Tuscan data for research purposes. Approval for use of
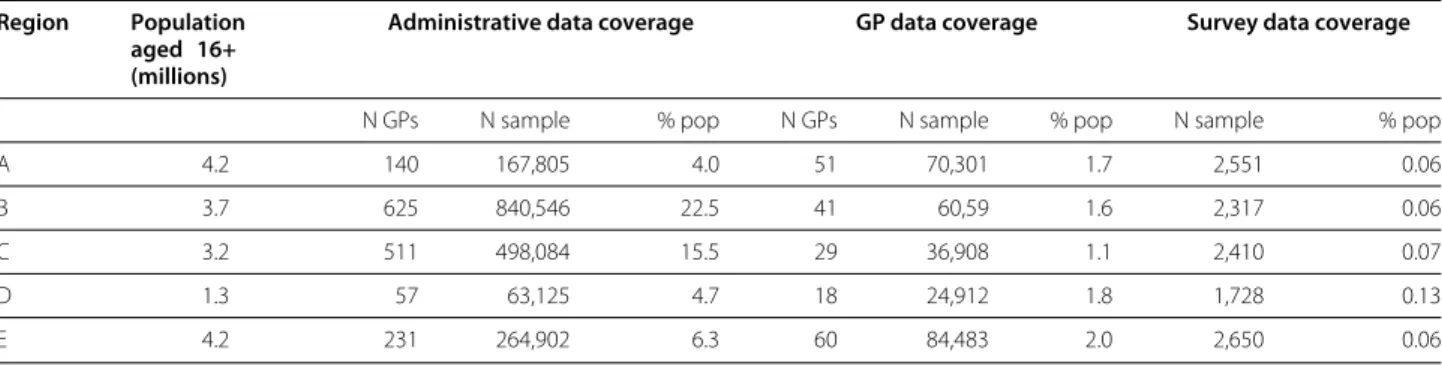
Table 2 Subpopulations covered by administrative, GP and survey data
Region Population aged 16+ (millions)
Administrative data coverage GP data coverage Survey data coverage
N GPs N sample % pop N GPs N sample % pop N sample % pop
A 4.2 140 167,805 4.0 51 70,301 1.7 2,551 0.06
B 3.7 625 840,546 22.5 41 60,59 1.6 2,317 0.06
C 3.2 511 498,084 15.5 29 36,908 1.1 2,410 0.07
D 1.3 57 63,125 4.7 18 24,912 1.8 1,728 0.13
E 4.2 231 264,902 6.3 60 84,483 2.0 2,650 0.06
Characteristics of the subpopulations of each region covered, respectively, by administrative, GP and National Health Survey data. Data on general population from the Italian National Institute of Statistics. Analysis is restricted to inhabitants aged 16+ and, for GP data, 16-95.
encrypted and aggregated data from the HSD was also obtained from the Italian College of General Practitioners. Data from the National Health Survey are openly available from ISTAT.
Results
The subpopulations whose data were collected covered a percentage of the total population of the regions, as shown in Table 2.
The age distribution of the three population samples in the five regions is shown in Figure 1. There were some dif-ferences in age distribution between the populations from the different sources (see Figure 1).
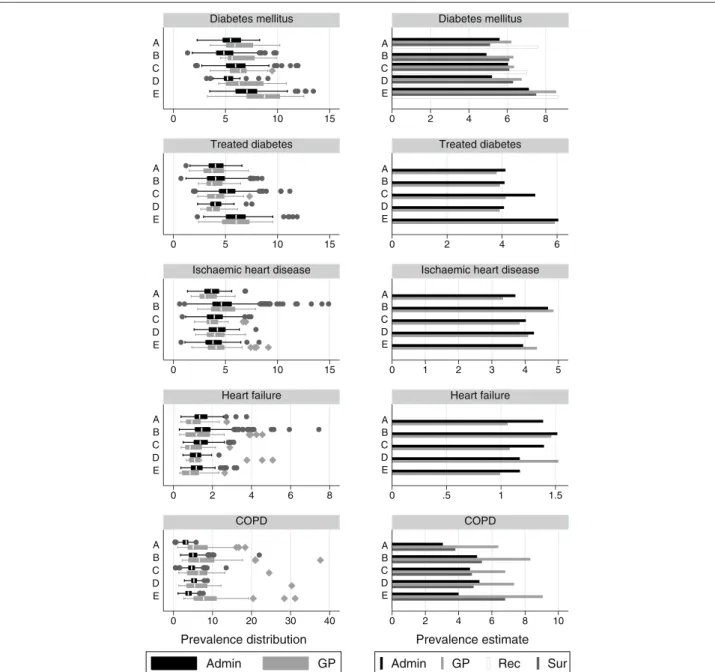
The prevalence estimates in the five regions from the three sources are shown in Figure 2 and Table 3. Adminis-trative data underestimated the prevalence of diabetes as compared to both GP and survey estimates across most regions although differences were often barely or non significant and the increasing North-South trend could be consistently observed in the three sources. Adjuste-ment for underascertainAdjuste-ment led to higher estimates with
respect to both GP and Survey figures, except in one region. The width of the interquartile range (IQ) of the practice-level estimates was higher in GP data than in administrative databases. When prevalence of diabetes was estimated based only on diabetes treatment, the prevalence estimates obtained from GP data were fairly consistent with those obtained from administrative data in all regions; the width of the IQ range of the practice estimates was similar between GP data and administrative data in all regions.
The prevalence of ischaemic heart disease, as estimated using administrative data, was similar to that estimated using GP data, prevalence ranging from 3.3% (region A, source GP) to 4.9% (region B, source GP). The width of the IQ range was similar between GP data and administrative data in all regions.
The prevalence estimates for heart failure were lower in GP data than in administrative data in three regions, with the highest difference (1.1% vs 1.4%) observed in both regions A and C, where significativeness was observed as well. According to age-specific prevalence estimates shown in Figure 3, the difference in estimates were
0 10 20 30 40 50 16−44 45−64 65−74 75−84 85+ 16−44 45−64 65−74 75−84 85+ 16−44 45−64 65−74 75−84 85+ 16−44 45−64 65−74 75−84 85+ 16−44 45−64 65−74 75−84 85+ A B C D E Admin GP Surv Percentage
Figure 1 Age distribution in each region from each data source. Age distribution in each region of the sample extracted from administrative
databases (Admin), of the sample extracted from clinical data collected by GPs participating to the Health Search Database (GP) and of the sample participating to the National Health Survey (Surv).
0 5 10 15 0 5 10 15 0 5 10 15 0 2 4 6 8 0 10 20 30 40 E D C B A E D C B A E D C B A E D C B A E D C B A Diabetes mellitus Treated diabetes
Ischaemic heart disease
Heart failure COPD Admin GP Prevalence distribution 0 2 4 6 8 0 2 4 6 0 1 2 3 4 5 0 .5 1 1.5 0 2 4 6 8 10 E D C B A E D C B A E D C B A E D C B A E D C B A Diabetes mellitus Treated diabetes
Ischaemic heart disease
Heart failure
COPD
Admin GP Rec Sur
Prevalence estimate
Figure 2 Prevalence estimates for diabetes mellitus, treated diabetes, ischaemic heart disease, heart failure and COPD from each data source. Crude prevalence estimates for diabetes mellitus, treated diabetes, ischaemic heart disease, heart failure and COPD in 5 Italian regions,
according to administrative data (Admin) and clinical GP data (GP) and, for diabetes and COPD only, the National Health Survey (Sur). For diabetes mellitus estimates from administrative data adjusted for ascertainment are also presented (Rec). On the left column prevalence is represented by box plots of the distribution of the disease prevalence in GP practices: the central line is the median value, the box covers the interquartile range, while wiskers range from a minimum to a maximum value except for some observations which are detected as outliers and are representes as single dots or diamonds; comparison is only betweem GP and Admin data sources. On the right column prevalence is represented as global estimate. Date: 1 January 2009 Population: male and females, aged 16+.
increasing with age. The width of IQ range of the practice estimates was higher for GP data in three regions.
The prevalence estimates from administrative data for COPD in regions A to D fell within the confidence interval of the survey estimates and ranged from from 3.8% (region A) to 4.9% (region D), but failed to detect the higher preva-lence in Region E (4.0% in administrative data vs 6.8% in
survey data). The estimates from GP data were consis-tently higher, ranging from 6.4% (region A) to 9.1% (region E), and detected the same increased prevalence in region E. The width of IQ range of the practice estimates was much higher for GP data.
In all diseases the width of the IQ range of the prac-tice estimates were fairly consistent across regions in
administrative data. Mean and medians were pretty close in both sources and all regions, and, except for outliers, distributions were rather symmetric, although in GP data data the distribution was slightly skewed to the right for diabetes and COPD.
Discussion
Overall, differences in prevalence estimates among the different sources in a region were lower than the differ-ences between regions, and differdiffer-ences observed among regions were similar across data sources. The fact that independent sources of data showed consistent values across different regions supports the claim that they cor-respond to actual population measures. In case systematic differences were observed, they could be interpreted as being due to differences in data collection and associated to demographic and disease characteristics. This provides evidence that administrative data actually measure a pop-ulation phenomenon that can be interpreted and supports the use of administrative data for surveillance of geo-graphical trends of the diseases in study, with the possible exception of COPD.
In the case of diabetes mellitus, the observed concor-dance between estimates from GP data and from sur-vey data confirms previous reports [24,25]. Estimates from GP data were systematically higher than estimates from administrative data. According to reports from other countries [26], the difference is likely to be due to the proportion of patients who, although being diag-nosed with diabetes to the knowledge of their GPs, have mild or well-controlled disease and thus have never had either a hospital admission or a prescription for antidiabetic drugs, and have not received an exemption from copayment of diabetes-related healthcare, there-fore escaping the algorithm for administrative databases. Indeed, when the subset of patients undergoing ther-apy with antidiabetics in the previous two years were extracted from both administrative and GP data sources, the pairs of prevalence estimates almost coincided in all of the regions, with one exception. Estimates adjusted for completeness of ascertainment, on the other hand, provided slightly higher estimates, a finding consistent with a previous study with similar data in another Italian area [16].
Ischaemic heart disease being congruently estimated by administrative and GP data in all of the regions is an unexpected finding. Angina, a less severe form of the dis-ease, does not lead per se to a hospital admission, and few cases (less than 5%) are detected by the registry of exemptions from copayment. As around 30% of cases are detected only by dispensings of nitrates (data not shown), we observe that nitrates therapy is probably specific in detecting cohorts bearing this condition, as otherwise data would have been less consistent across regions in
matching the diagnosis-based figures from GP clinical databases.
Heart failure was underestimated by GP data, although non significantly in the majority of the regions. Underesti-mation was highest in the oldest age band available in both data sources (85-95), where the prevalence is highest. This is consistent with the hypothesis that GPs belonging to HSD might occasionally perform less accurate data collec-tion when visiting patients at home [27] or in residential care [22], or consider heart failure as a complication of other underlying conditions, such as ischaemic heart dis-ease, rather than as a disease of its own. This would imply that the population detected by administrative data had a more severe form of the disease and was more often affected by disability. Another possibility is that adminis-trative database overestimate prevalence because of lack of specificity of the case ascertainment algorithm. Indeed, according to a recent review of validated algorithms for case ascertainment of heart failure [28], algorithms using secondary discharge diagnosis showed lower positive pre-dictive value (PPV) in several countries.
For COPD administrative data failed to detect the dif-ferences between regions that the other two sources consistently measured. Ascertainment of COPD from administrative sources has been shown to be challeng-ing in other studies [29,30]. In this case, the algorithm detected a particular pattern of drug prescriptions, com-bining duration, intensity and ATC class, that had been identified through a consensus process in a group of experts that was reported in Anecchino et al. [21]. Although the pattern was specifically meant to avoid mis-classification (e.g., with respect to asthma), it is possible that the conclusions of the study were in fact specific for the geographic area where the experts worked.
In light of the limitations of the sampling design of our study, the overall good agreement with other data sources supports a fortiori validity of chronic disease surveil-lance using administrative data in the regions that were involved in the study. However, support for external valid-ity of our results needs to be discussed. Althought we only collected data from few geographical areas, the same administrative data are available for the whole national population. We are in fact not claiming that administra-tive data from few geographically sparse areas can be used to estimate national prevalence of chronic diseases, but rather that administrative data seem to be consistently able to detect prevalence of some chronic diseases around
the area they were extracted from. Our positive findings (treated diabetes, ischaemic heart disease, heart failure) are indeed probably due to the fact that typical health consumption patterns of such chronic patients are simi-lar across regions. On the assumption that regions of the same macroarea of the country (North, Center, South) are similar the one to the other to this respect, our data
Public Health 2013, 13 :15 Page 8 o f 1 1
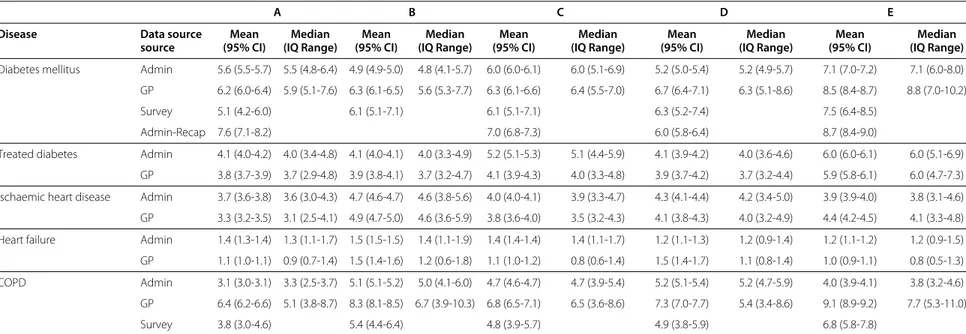
Table 3 Table of prevalence estimates for diabetes mellitus, treated diabetes, ischaemic heart disease, heart failure and COPD from each data source
A B C D E
Disease Data source Mean Median Mean Median Mean Median Mean Median Mean Median
source (95% CI) (IQ Range) (95% CI) (IQ Range) (95% CI) (IQ Range) (95% CI) (IQ Range) (95% CI) (IQ Range) Diabetes mellitus Admin 5.6 (5.5-5.7) 5.5 (4.8-6.4) 4.9 (4.9-5.0) 4.8 (4.1-5.7) 6.0 (6.0-6.1) 6.0 (5.1-6.9) 5.2 (5.0-5.4) 5.2 (4.9-5.7) 7.1 (7.0-7.2) 7.1 (6.0-8.0) GP 6.2 (6.0-6.4) 5.9 (5.1-7.6) 6.3 (6.1-6.5) 5.6 (5.3-7.7) 6.3 (6.1-6.6) 6.4 (5.5-7.0) 6.7 (6.4-7.1) 6.3 (5.1-8.6) 8.5 (8.4-8.7) 8.8 (7.0-10.2)
Survey 5.1 (4.2-6.0) 6.1 (5.1-7.1) 6.1 (5.1-7.1) 6.3 (5.2-7.4) 7.5 (6.4-8.5)
Admin-Recap 7.6 (7.1-8.2) 7.0 (6.8-7.3) 6.0 (5.8-6.4) 8.7 (8.4-9.0)
Treated diabetes Admin 4.1 (4.0-4.2) 4.0 (3.4-4.8) 4.1 (4.0-4.1) 4.0 (3.3-4.9) 5.2 (5.1-5.3) 5.1 (4.4-5.9) 4.1 (3.9-4.2) 4.0 (3.6-4.6) 6.0 (6.0-6.1) 6.0 (5.1-6.9) GP 3.8 (3.7-3.9) 3.7 (2.9-4.8) 3.9 (3.8-4.1) 3.7 (3.2-4.7) 4.1 (3.9-4.3) 4.0 (3.3-4.8) 3.9 (3.7-4.2) 3.7 (3.2-4.4) 5.9 (5.8-6.1) 6.0 (4.7-7.3) Ischaemic heart disease Admin 3.7 (3.6-3.8) 3.6 (3.0-4.3) 4.7 (4.6-4.7) 4.6 (3.8-5.6) 4.0 (4.0-4.1) 3.9 (3.3-4.7) 4.3 (4.1-4.4) 4.2 (3.4-5.0) 3.9 (3.9-4.0) 3.8 (3.1-4.6) GP 3.3 (3.2-3.5) 3.1 (2.5-4.1) 4.9 (4.7-5.0) 4.6 (3.6-5.9) 3.8 (3.6-4.0) 3.5 (3.2-4.3) 4.1 (3.8-4.3) 4.0 (3.2-4.9) 4.4 (4.2-4.5) 4.1 (3.3-4.8) Heart failure Admin 1.4 (1.3-1.4) 1.3 (1.1-1.7) 1.5 (1.5-1.5) 1.4 (1.1-1.9) 1.4 (1.4-1.4) 1.4 (1.1-1.7) 1.2 (1.1-1.3) 1.2 (0.9-1.4) 1.2 (1.1-1.2) 1.2 (0.9-1.5) GP 1.1 (1.0-1.1) 0.9 (0.7-1.4) 1.5 (1.4-1.6) 1.2 (0.6-1.8) 1.1 (1.0-1.2) 0.8 (0.6-1.4) 1.5 (1.4-1.7) 1.1 (0.8-1.4) 1.0 (0.9-1.1) 0.8 (0.5-1.3) COPD Admin 3.1 (3.0-3.1) 3.3 (2.5-3.7) 5.1 (5.1-5.2) 5.0 (4.1-6.0) 4.7 (4.6-4.7) 4.7 (3.9-5.4) 5.2 (5.1-5.4) 5.2 (4.7-5.9) 4.0 (3.9-4.1) 3.8 (3.2-4.6) GP 6.4 (6.2-6.6) 5.1 (3.8-8.7) 8.3 (8.1-8.5) 6.7 (3.9-10.3) 6.8 (6.5-7.1) 6.5 (3.6-8.6) 7.3 (7.0-7.7) 5.4 (3.4-8.6) 9.1 (8.9-9.2) 7.7 (5.3-11.0)
Survey 3.8 (3.0-4.6) 5.4 (4.4-6.4) 4.8 (3.9-5.7) 4.9 (3.8-5.9) 6.8 (5.8-7.8)
Crude prevalence estimates for diabetes mellitus, treated diabetes, ischaemic heart disease, heart failure and COPD in 5 Italian regions, according to administrative data (Admin) and clinical GP data (GP). For diabetes and COPD only: crude prevalence estimated from the National Health Survey (Surv). For diabetes only: prevalence estimates from administrative data adjusted for estimated completeness of ascertainment (Admin-Recap). Prevalence estimated both as global percentage with 95% confidence interval and, for Admin and GP only, as median with interquantile range of the distribution of prevalence in GP practices. Date: 1 January 2009. Population: male and females, aged 16-95 in GP and 16+ in the other sources.
0 3 6 9 12 15 18 21 24 45−95 85−95 75−84 65−74 45−64 45−95 85−95 75−84 65−74 45−64 45−95 85−95 75−84 65−74 45−64 45−95 85−95 75−84 65−74 45−64 45−95 85−95 75−84 65−74 45−64 A B C D E Admin GP Age−specific prevalence
Figure 3 Age-specific prevalence of heart failure. Age-specific
prevalence of heart failure in 5 Italian regions, according to administrative data (Admin) and clinical GP data (GP). Date: 1 January 2009 Population: male and females, aged 16+.
support the claim that estimates relying on the same algo-rithms should prove to be similarly effective. However, in some specific critical areas of the country where incom-plete administrative data collection is suspected, a local evaluation is recommended.
Cohorts can be selected from administrative databases to perform population-based studies on patients with chronic diseases through further record-linkage with the same databases. This study cannot provide analytical tools to assess the limitations of the findings of such studies. However, no evidence emerges for major bias, except in the case of COPD, where regional differences with the other data sources are likely to be due to differences in the characteristics of the corresponding local cohorts. Limitations
The first limitation of studies that make secondary use of existing healthcare data sources is that only prevalence of diagnosed cases is taken into account, and underestima-tion of actual populaunderestima-tion prevalence cannot be estimated [31].
An implicit assumption of both crude and adjusted rate estimation from administrative databases performed in this study was that PPV of the case detection was 100%, an assumption that we could not verify and that is not to be taken for granted, when, for instance, secondary discharge diagnosis or drug utilisation with no indication is used as a source of case ascertainment. Ecological validation studies cannot directly resolve this issue, as consistent ecological estimates between a data source and a reference gold stan-dard might as well be due to coincidental inclusion of false positive and exclusion of false negative cases. Only valida-tion studies perfomed using individual-level comparison with a gold standard could assess PPV and sensitivity.
Conclusion
This study supports the use of data from Italian admin-istrative databases to estimate geographic differences in population prevalence of ischaemic heart disease, treated diabetes, diabetes mellitus and heart failure. The algo-rithm for COPD used in this study requires further refine-ment.
Abbreviations
AIC: Akaike information criterion; ATC: Anatomic, Therapeutic, Chemical Classification System; COPD: Chronic Obstructive Pulmonary Disease; FTP: File Transfer Protocol; GP: General Practitioner; HSD: Health Search Database; ICD9CM: International Classification of Diseases Ninth Revision Clinical Modification; IQ: Interquartile range; IR: Inhabitant Registry; ISTAT: National Institute of Statistics; PPV: Positive Predictive Value.
Competing interests
The authors declare that they have no competing interests. Author’s contributions
RG conceived of the study, participated in its design and coordination, performed data management and data analysis and drafted the manuscript. PF conceived of the study, participated in its design and coordination with
responsability of the Tuscany data and helped to draft the manuscript. GM conceived of the study, participated in its design and coordination and helped to draft the manuscript. IC participated in the study design and coordination. AP provided data management and data analysis of the Health Search data. PG participated in the study design and coordination and helped to draft the manuscript. SB participated in the study coordination with responsability of the Sicily data and helped to draft the manuscript. DD participated in the study coordination with responsability of the Veneto data. AD. participated in the study coordination with responsability of the Emilia Romagna data and helped to draft the manuscript. AM participated in the study coordination with responsability of the Marche data. CZ participated in the study coordination. CC participated in the study coordination with responsability of the Health Search data. GD participated in the study design and helped to draft the manuscript. MB participated in the study design and coordination. MCJMS participated in the study design and reviewed the drafts of the manuscript. MJS participated in the study design and reviewed the drafts of the manuscript. All authors read and approved the final manuscript. Acknowledgements
This study was funded by the project named “La Valutazione dei nuovi modelli organizzativi della Medicina Generale”, acronym VALORE, funded by the Italian Ministry of Health in the context of regular health reserach (art.12-bis, d. lgs. 502/1992) and by the project named “Integrazione dei contenuti informativi per la gestione sul territorio di pazienti con patologie complesse o con patologie croniche”, acronym MATRICE, funded by the Italian Ministry of Health in the framework of the MATTONI Program.
The authors wish to thank the reviewers for their insightful advices and Preciosa Coloma for her mindful linguistic revision.
Author details
1Agenzia regionale di sanit`a della Toscana, Via Pietro Dazzi 1, 50141 Florence,
Italy.2Department of Medical Informatics, Erasmus Medical Center,
Dr. Molewaterplein 50, 3015 GE Rotterdam, The Netherlands.3Societ`a italiana
di medicina generale, Via del Pignoncino, 9-11, 50142 Florence, Italy.
4Genomedics, Via Sestese 61, 50141 Florence, Italy.5ULSS 16 Padova, Via
Enrico Degli Scrovegni 14, 35131 Padua, Italy.6ASP 7 Ragusa, Piazza Igea 1,
97100 Ragusa, Italy.7Assessorato Politiche per la Salute, Viale Aldo Moro 21,
40127 Bologna, Italy.8Zona Territoriale Senigallia, Via Piero della Francesca 14,
60019 Senigallia (AN), Italy.9Regione Lombardia, Piazza Citt`a di Lombardia 1,
20124 Milan, Italy.10Universit`a Cattolica del Sacro Cuore, Largo Francesco Vito
1, 00198 Rome, Italy.11Agenzia Nazionale per il Servizi Sanitari Regionali, Via
Puglie 23, 00187 Rome, Italy.
Received: 21 March 2012 Accepted: 2 January 2013 Published: 9 January 2013
References
1. Jutte DP, Roos LL, Brownell MD: Administrative record linkage as a tool for public health research. Annu Rev Public Health 2011, 32:91–108. [http://www.ncbi.nlm.nih.gov/pubmed/21219160]. [PMID: 21219160]. 2. Moore DF, Lix LM, Yogendran MS, Martens P, Tamayo A: Stroke
surveillance in Manitoba, Canada: estimates from administrative databases. Chronic Diseases in Canada 2008, 29:22–30. [http://www.ncbi. nlm.nih.gov/pubmed/19036220]. [PMID: 19036220].
3. Wigertz A, Westerling R: Measures of prevalence: which healthcare registers are applicable? Scand J Public Health 2001, 29:55–62. [http:// www.ncbi.nlm.nih.gov/pubmed/11355718]. [PMID: 11355718]. 4. Rector TS, Wickstrom SL, Shah M, Thomas Greeenlee N, Rheault P,
Rogowski J, Freedman V, Adams J, Escarce JJ: Specificity and Sensitivity of Claims-Based, Algorithms for Identifying Members of
Medicare+Choice Health Plans That Have Chronic Medical Conditions. Health Services Res 2004, 39(6 Pt 1):1839–1858. [PMID: 1553 3190 PMCID: 1361101].
5. Renard LM, Bocquet V, Vidal-Trecan G, Lair M-L Couffignal, S,
Blum-Boisgard C: An algorithm to identify patients with treated type 2 diabetes using medico-administrative data. BMC Medical Informatics
and Decision Making 2011, 11:23. [PMID: 21492480 PMCID: 3090314]. 6. Hern´a MA: With great data comes great responsibility: publishing
comparative effectiveness research in epidemiology. Epidemiol
(Cambridge, Mass.) 2011, 22(3):290–291. [http://www.ncbi.nlm.nih.gov/ pubmed/21464646]. [PMID: 21464646].
7. Cooke CR, Joo MJ, Anderson SM, Lee TA, Udris EM, Johnson E, Au DH: The validity of using ICD-9 codes and pharmacy records to identify patients with chronic obstructive pulmonary disease. BMC Health
Services Res 2011, 11:37. [http://www.ncbi.nlm.nih.gov/pubmed/ 21324188]. [PMID: 21324188].
8. Solberg LI: Are Claims Data Accurate Enough to Identify Patients for Performance Measures or Quality Improvement? The Case of Diabetes, Heart Disease, and Depression. Am J Med Qual 2006, 21:238–245. [http://ajm.sagepub.com/cgi/doi/10.1177/ 1062860606288243].
9. Ellekjaer H, Holmen J, Kr ¨uger O, Terent A: Identification of incident stroke in Norway: hospital discharge data compared with a population-based stroke register. Stroke; a J Cerebral Circulation 1999, 30:56–60. [http://www.ncbi.nlm.nih.gov/pubmed/9880388]. [PMID: 9880388].
10. Lix LM, Yogendran MS, Shaw SY, Burchill C, Metge C, Bond R: Population-based data sources for chronic disease surveillance.
Chronic Diseases in Canada 2008, 29:31–38. [http://www.ncbi.nlm.nih. gov/pubmed/19036221]. [PMID: 19036221].
11. Maio V, Yuen E, Rabinowitz C, Louis D, Jimbo M, Donatini A, Mall S, Taroni F: Using pharmacy data to identify those with chronic conditions in Emilia Romagna, Italy. J Health Services Res & Policy 2005, 10(4):232–238. [http://www.ncbi.nlm.nih.gov/pubmed/16259690]. [PMID: 16259690]. 12. Lo Scalzo A, Donatini A, Orzella L, Cicchetti A, Profili S, Maresso A: Italy:
Health system review. Health Syst Transition 2009, 11(6):1–216. 13. Chini F, Pezzotti P, Orzella L, Borgia P, Guasticchi G: Can we use the
pharmacy data to estimate the prevalence of chronic conditions? a comparison of multiple data sources. BMC Public Health 2011, 11:688. [PMID: 21892946 PMCID: 3223740].
14. Capture-recapture and multiple-record systems estimation I: History and theoretical development. International Working Group for Disease Monitoring and Forecasting. Am J Epidemiol 1995, 142(10):1047–1058. [http://www.ncbi.nlm.nih.gov/pubmed/7485050]. [PMID: 7485050].
15. Capture-recapture and multiple-record systems estimation II: Applications in human diseases. International Working Group for Disease Monitoring and Forecasting. Am j epidemiol 1995, 142(10):1059–1068. [http://www.ncbi.nlm.nih.gov/pubmed/7485051]. [PMID: 7485051].
16. Giarrizzo ML, Pezzotti P, Silvestri I, Di Lallo D: [Estimating prevalence of diabetes mellitus in a Lazio province, Italy, by capture-recapture models]. Epidemiologia e prevenzione 2007, 31(6):333–339. [http://www. ncbi.nlm.nih.gov/pubmed/18326425]. [PMID: 18326425].
17. Gnavi R, Karaghiosoff L, Costa G, Merletti F, Bruno G: Socio-economic differences in the prevalence of diabetes in Italy: The population-based Turin study. Nutr, Metab Cardiovasc Diseases 2008, 18(10):678–682. [http://www.sciencedirect.com/science/article/pii/S0939475307002049]. 18. Costa G, Ricciardi G, Paci E(Eds): [United Italy, 150 years later: has
equity in health and healthcare improved?]. In Epidemiologia e
Prevenzione; 2011,35(5-6 Suppl 2) 1–134.
19. ATC: Structure and principles. [http://www.whocc.no/atc/ structure and principles/]. [Accessed: September 2012].
20. Simonato L, Baldi I, Balzi D, Barchielli A, Battistella G, Canova C, Cesaroni G, Corrao G, Collini F, Conti S, Costa G, Demaria M, Fornari C, Faustini A, Galassi C, Gnavi R, Inio A, Madotto F, Migliore E, Minelli G, Pellizzari M, Protti M, Romanelli A, Russo A, Saugo M, Tancioni V, Tessari R, Vianello A, Vigotti M(Eds): [Objectives, tools and methods for an epidemiological use of electronic health archives in various areas of Italy].
Epidemiologia e Prevenzione 2008,32(3 Suppl), 1–134. [http://www.ncbi. nlm.nih.gov/pubmed/18928238].
21. Anecchino C, Rossi E, Fanizza C, De Rosa M, Tognoni G, Romero M: Prevalence of chronic obstructive pulmonary disease and pattern of comorbidities in a general population. Int J Chronic Obstructive
Pulmonary Disease 2007, 2(4):567–574. [PMID: 18268930 PMCID: 2699,968]. 22. Filippi A, Vanuzzo D, Bignamini AA, Sessa E, Brignoli O, Mazzaglia G:
Computerized general practice databases provide quick and cost-effective information on the prevalence of angina pectoris.
Italian Heart J: Official J Italian Federation of Cardiology 2005, 6:49–51. [http://www.ncbi.nlm.nih.gov/pubmed/15773273]. [PMID: 15773273]. 23. [Demography in figures]. [http://demo.istat.it]. [Accessed:
24. Cricelli C, Mazzaglia G, Samani F, Marchi M, Sabatini A, Nardi R, Ventriglia G, Caputi AP: Prevalence estimates for chronic diseases in Italy: exploring the differences between self-report and primary care databases. J Public Health Med 2003, 25(3):254–257. [http://www.ncbi. nlm.nih.gov/pubmed/14575204]. [PMID: 14575204].
25. Leikauf J, Federman AD: Comparisons of self-reported and
chart-identified chronic diseases in inner-city seniors. J Am Geriatrics
Soc 2009, 57(7):1219–1225. [http://www.ncbi.nlm.nih.gov/pubmed/ 19486197]. [PMID: 19486197].
26. Harris SB, Glazier RH, Tompkins JW, Wilton AS, Chevendra V, Stewart MA, Thind A: Investigating concordance in diabetes diagnosis between primary care charts (electronic medical records) and health administrative data: a retrospective cohort study. BMC Health Services
Res 2010, 10:347. [PMID: 2118 2790 PMCID: 3022877].
27. Filippi A, Sessa E, Pecchioli S, Trifir G, Samani F, Mazzaglia G: Homecare for patients with heart failure in Italy. Italian Heart J: Official J Italian
Federation of Cardiology 2005, 6(7):573–577. [http://www.ncbi.nlm.nih. gov/pubmed/16274019]. [PMID: 16274019].
28. Saczynski JS, Andrade SE, Harrold LR, Tjia J, Cutrona SL, Dodd KS, Goldberg RJ, Gurwitz JH: A systematic review of validated methods for identifying heart failure using administrative data.
Pharmacoepidemiology and Drug Saf 2012, 21:129–140. [http:// onlinelibrary.wiley.com/doi/10.1002/pds.2313/abstract].
29. Lacasse Y, Montori VM, Lanthier C, Maltis F: The validity of diagnosing chronic obstructive pulmonary disease from a large administrative database. Can Respir J: J Canadian Thoracic Soc 2005, 12(5):251–256. [http://www.ncbi.nlm.nih.gov/pubmed/16107913]. [PMID: 16107913]. 30. Faustini A, Canova C, Cascini S, Baldo V, Bonora K, De Girolamo G, Romor
P, Zanier L, Simonato L: The reliability of hospital and pharmaceutical data to assess prevalent cases of chronic obstructive pulmonary disease. COPD 2012, 9(2):184–196. [PMID:, 2240 9483].
31. Prevalence of chronic diseases in older Italians: comparing self-reported and clinical diagnoses. The Italian Longitudinal Study on Aging Working Group. Int J Epidemiol 1997, 26(5):995–1002. [http:// www.ncbi.nlm.nih.gov/pubmed/9363520]. [PMID: 9363520].
doi:10.1186/1471-2458-13-15
Cite this article as: Gini et al.: Chronic disease prevalence from Italian
administrative databases in the VALORE project: a validation through comparison of population estimates with general practice databases and national survey. BMC Public Health 2013 13:15.
Submit your next manuscript to BioMed Central and take full advantage of:
• Convenient online submission
• Thorough peer review
• No space constraints or color figure charges
• Immediate publication on acceptance
• Inclusion in PubMed, CAS, Scopus and Google Scholar
• Research which is freely available for redistribution
Submit your manuscript at www.biomedcentral.com/submit