Published by Canadian Center of Science and Education
The Effect of the Profitability on the Valuation Models:
Evidence from Italian Acquisitions
1Marco Angelo Marinoni1 & Anna Maria Fellegara2 1
Assistant professor, Catholic University of Sacre Hearth, Piacenza, Italy 2
Dean, Faculty of Economics and Laws, Catholic University of Sacre Hearth, Piacenza, Italy
Correspondence: Marco Angelo Marinoni, Assistant professor, Catholic University of Sacre Hearth, Piacenza, Italy.
Received: March 11, 2019 Accepted: April 18, 2019 Online Published: April 24, 2019 doi:10.5539/ibr.v12n5p95 URL: https://doi.org/10.5539/ibr.v12n5p95
Abstract
The aim of this study is to analyse the behaviour of the book-to-market index, B/MV, on a sample of Italian
listed companies that completed a M&A operation in the span 2008-2016, the decade of the economic-financial
crisis. Moreover the authors' interest in investigating the relationship between the market index and the income and non-earnings performance index. The study has verified whether the listed Italian companies sampled have
book-to-market indices in line with corporate performance in terms of profitability, and therefore of general
economic, patrimonial and financial equilibrium. The intention is to consider if the market manages to "capitalise" corporate trends regularly and with what intensity. The hypothesis concerns the possibility that the
B/MV may be more affected by financial market externalities than by the specific economic and financial outlook
in terms of market capitalisation. The profound geopolitical and macroeconomic changes of the last few decades and the consequent multiple corporate crises, have undoubtedly called into question the validity and reliability of certain valuation assumptions.
Keywords: book-to-market, firm robustness, profitability, IVS, M&A JEL Code: M160, M410, M480
1. Introduction
Publication of the International Valuation Standards, IVSs, along with adherence to the Code of Ethical
Principles for Professional Valuers issued in 2011 by the International Valuation Standards Council, IVSC, has
rekindled (not only in Italy) significant debate in doctrine and practice on how to estimate and calculate the basic parameters of valuation models, such as the discount rate in the different configurations (i.e. asset side and
equity side). The Italian IVSs, the so-called PIV, devote much room to indirect criteria based on the discounting
of future income or financial flows for company valuations (see in particular Italian PIV III.1.31 - .32)1. The profound geopolitical and macroeconomic changes of the last few decades and the consequent multiple corporate crises, profoundly affecting the production and financial systems of some countries, have undoubtedly called into question the validity and reliability of certain valuation assumptions, both in terms of scenario and of corporate balance and development, which had until then been considered somehow unchangeable and destined to be confirmed as assumptions that would never be called into question.
It should be noted that, given its transversality, this topic also features in the current interdisciplinary reference debate on the evaluation of accounting items involving the most recent accounting European Laws2. The application of the amortised cost criterion is, for example, an absolute novelty for the Italian financial statement, which, however, does not escape criticism3; in fact, it is a typical criterion for financial statements prepared according to IAS/IFRS (see IAS 39 - IFRS 9; in the Literature, see for instance Onesti, Romano, & Taliento, 2016; Sannino & Tartaglia Polcini, 2014), which, like the purchase cost (or nominal value), also considers any differences between nominal and actual interest rates with a financial approach. The amortised cost method
1
The present paper is a joint paper but the author Anna Maria Fellegara wrote the Introduction and the conclusions; the author Marco A. Marinoni wrote paragraphs 2, 3 and 4.
consists in dividing the historical cost, or part thereof, over the entire useful life of the security, i.e. over its entire duration. The qualifying element lies in the discounting process, a technique through which one can reach the best approximation of the concept, so widely discussed in the international literature, of the fair value of an asset. As often happens with themes subject to analysis from different perspectives, also in this case some confusion and lack of complementarity in approaches has surfaced. In both cases, this is a process of discounting of future income or cash flows, both for the company's own evaluation assumptions (IVS and PIV)4, and for the application of the recent model of evaluation of some accounting items affecting the accounting and market value of the equity, of which the book-to-market is the resulting index.
Hence the double need to examine, first of all, the main models that can be employed for the appreciation of the cost of equity, a component of the discount rate, a parameter on which rests the whole indirect process of valuation of future flows, followed by the need to understand whether in listed companies the book -to-market index can intrinsically represent the dynamics (Boehmer, Musumeci, & Poulsen, 1991; Guo, 2017) of corporate economic, patrimonial and financial performance indicators system, that is, whether it is unlimited, as massively conditioned by speculative market logics.
Traditional models for estimating beta risk measures include, for example, appreciating the beta unlevered through target company fundamentals. Beta is therefore conditioned by the economy of the target company, by its ability to create value through operational and financial leverage, and therefore by its economic/equity and financial equilibriums, not only historical, but also prospective.
It is therefore appropriate to ask what problems may actually arise in the application of the valuation model, for example, how to determine "prospective" cash flows, e.g. in terms of reference time frames, as certainly also an estimate of the market rate, the coverage of inflation and the riskiness of the investment, the component of the discount rate to be used5. The PIV III.1.32, for instance, states that it is preferable to use income estimates when the performance situation is stabilised, i.e. steady state. In non-stabilised situations, where there are significant deviations between distributable income and cash flows, due for example to the contraction or expansion of investments in working capital and fixed assets, it is advisable to use financial methods. The expected income flows, a reference quantity suggested by the PIV in stabilised company valuations, steady state, "discount" all the value levers (e.g. buyer power, sector structure, replacement products, innovation and marketing) and in the long run do not deviate much from the available cash flows.
Hence the need to investigate how to estimate and calculate the fundamental coefficients of the valuation models and their parameters, such as the discount rate in its different configurations (e.g. cost of equity, WACC, effective
interest rate or internal rate of return, TIE or TIR, Internal Rate of Return, IRR)6. With regard to company valuations, there is no doubt about the value of the IVSs which, for the estimation of the cost of equity, recommend the traditional Capital Asset Pricing Model, CAPM (Sharpe, 1964; Lintner, 1965)7. For the discounted processes typical of the amortised cost criterion, the Italian Legislator (and the standard setter) relies on the concept of
internal rate of return, IRR, calculated indirectly from the estimate of prospective cash flows, since it is the rate
that makes null and void the net present value of the series of flows subject to discounting. For a brief detail, investment rate, IR, turns into the equity side configuration as the ratio
growth rate g/ROE;
while in the asset side configuration as
Return on Invested Capital, ROIC,
which is the following ratio
(Net Income – Dividend)/Total debt (i.e. debt + equity)
and both idealise the rate expected in the long run.
The growth rate is g = ROE*(1-payoff), where payoff is the degree of profit retention.
The doctrine of Economia Aziendale in Italy (Zappa, 1936; 1957), regardless of the quantitative models used, which are an instrument and not a backbone, is necessary in order not to dissipate the systemic vision of the discipline (See among others, Azzini, 1957, p. 302/3. “…di quelle produzioni delle quali non sappiamo
determinare i risultati, quando non sappiamo spingere consapevolmente le nostre visioni definite o quasi definite nel prossimo futuro e le nostre visioni generiche, o forse puramente congetturarli, nel futuro meno prossimo o lontano. Evidentemente il solo accenno indistinto alle statistiche d’impresa e di mercato non basta per rivelare l’importanza e il peso specifico che le conoscenze analitiche da noi ricordate hanno per l’attuazione di una
consapevole gestione e per l’accorta determinazione dei risultati lordi o netti, riferiti a particolari o a complesse produzioni.”).
Only apparently are the themes dealt with here to be understood as pertaining to other disciplines, such as Finance. In reality, the approach that we want to follow is precisely the interdisciplinarity and complementarity that have always characterised Business Economics studies. This quality is historically typical of Economia
Aziendale, which can bring significant benefits in terms of Value Relevance and Disclosure. For instance,
corporate governance literature (Mazzotta & Veltri, 2014; Mateev & Andonov 2016, among others) recognizes the role played by an effective governance system in introducing a virtuous circle in terms of business efficiency and integrity, while also having positive impacts on the cost of equity, and then on the whole stakeholders, such as customers, creditors, consumers, suppliers, employees, communities and the environment.
Consequently, the framework of the study is as follows: a) the International Valuation Standards (by IVSC) suggest
CAPM as the generally accepted model used to determine a theoretically appropriate required “rate of return” of an
asset (it could be a proxy of discounted income or cash flows); b) due to the critical issues (mentioned in the following paragraphs) concerning the traditional CAPM, it is necessary to highlight the more advanced models, as Fama and French (2015), in which one of the main risk factors is the profitability (i.e. income); c) the book-to-market ratio is a generally accepted firm valuation variable; the predictive ability of book-to-market seems to derive from the relationship between equity book value and the ability to generate future income (Pontiff & Schall, 1998); d) for the above-mentioned reason (point c), the will to seek relationships between book-to-market and defined accounting performance (economic, patrimonial and financial) ratios in a sample of Italian Industry firms involved in M&A operations in the last years, with significant conclusions.
The rest of the paper is organized as follows: section 2 provides the theoretical background behind firms’ acquisitions and their impact on shareholder wealth. Section 3 describes the data, sample characteristics and event study methodology. In Sections 4 we present the results of analysis, and following we draw some conclusions and underline the main limitations of the study.
2. Literature Review
This study aims to be part of the reference literature on corporate risk assessment and related discount rate, in order to highlight any critical points of the traditional models (i.e. CAPM), and to investigate more advanced models (i.e. Arbitrage Pricing Model, APM, Build-up model, five-factor model of Fama & French, 2015), to understand theoretical consistency and practical applicability, even in the Italian industrial system.
The initial phase involved the analysis of Economia Aziendale literature (Italian and international) related to the theme under study, in order to select the most relevant contributions and lay the foundations to shape an initial general conceptual model of reference that would orient the subsequent developments. In present era, M&A act as an important tool for the growth and expansion of the economy and the main reason is to create synergy, and this rationale beguiles the entities for merger at the tough times (Manokaran & Radharukkumani, 2014; Mateev & Andonov, 2016). Indeed, in the last decades a vast body of literature discusses M&A phenomenon, with different perspectives. Several studies have shown the evidence on bidder (abnormal) returns of domestic or cross-border acquisitions; the literature is quite unanimous: shareholders of target firms invariably receive large premiums (on average between 20 and 40%) relative to the pre-announcement share price. In contrast, there is little consensus about the announcement wealth effects for the bidding firms. Many of the studies report small negative returns for the acquirers (Mitchell & Stafford, 2000), whereas others report zero or small positive abnormal returns for US acquirers of foreign target firms in 1990s. The results are similar for other markets as well. Moreover, if international diversification or access to new markets is valuable (Doukas & Travlos, 1988), one may expect bidders to perform better in cross-border than in domestic acquisitions. Other studies as Moeller and Schlingemann, 2005 find US bidders to lose from cross-border acquisitions. More recently, Mateev and Andonov, 2016, argued that there is not significant difference in the level of overvaluation (proxied by the ratio of Tobin’s Q), European acquirers involved in cross-border acquisitions show much better financial performance (proxied by the ratio of return on assets, ROA) than those involved in domestic acquisitions.
In parallel, a vast body of literature discusses the relationship between the M&A bid characteristics and the return; the impact of different firm- and industry-specific characteristics on the bidder’s announcement returns can be found with manifold approaches: many studies focus on the firm size (e.g. according to Moeller, Schlingemann & Stulz, 2004, returns to shareholders of smaller acquiring firms should be higher); or on the combined firm- and deal-specific characteristics (e.g. Golubov, Yawson, & Zhang, 2015); others on the kind of the targets, so listed and unlisted (e.g. Faccio, McConnell, & Stolin, 2006 find that acquirers of listed targets earn an insignificant average abnormal return of −0.38%, while acquirers of unlisted targets earn a significant
average abnormal return of 1.48%. Considering that the average target is much smaller than the average acquirer, the combined net economic gain at announcement is barely positive); following, or private and public (e.g. acquisitions of private companies are an important part of the takeover market; however, most of the existing empirical evidence is focused on public acquisitions. Fuller, Netter, & Stegemoller, 2002 and Faccio, McConnell, & Stolin, 2006, find a wide listing effect in the sense that acquirers of listed firms earn zero or negative abnormal returns, while acquirers of privately-held targets earn positive and statistically significant abnormal returns. The illiquidity makes private acquisitions less attractive. As a result, the shareholders of private firms are willing to sell their shares at a discount. Hence, the buyers of the private targets pay a lower price and obtain a higher return. Similar results are reported by Moeller, Schlingemann & Stulz, 2004. Brander & Egan, 2017 find that 54% of acquirers of publicly-traded firms obtain statistically significant negative returns, suggesting a stronger winner’s curse for public than for private acquisitions. Note that Chang, 1998, examine bidder returns at the announcement of a takeover proposal when the target firm is privately held; in stock offers, bidders experience a positive abnormal return, which contrasts with the negative abnormal return typically found for bidders acquiring a publicly traded target.
Moreover, John, Freund, Nguyen, & Vasudevan, 2010 find that bidder returns decrease with the level of creditor protection in the target country and increase with the quality of accounting standards. Their results also show that in low-protection countries, firm-level corporate governance mechanisms, such as higher insider ownership, may substitute for the lower level of investor protection.
Lastly, many of the studies report the relationship between M&A returns and the different means of payment; empirical literature (e.g. Fuller, Netter, & Stegemoller, 2002) finds that bidders making cash offers have greater abnormal returns at the bid announcement than those making stock offers. Common interpretations of the negative stock price reactions are that acquirers use stock as the method of payment when their share price is overvalued or that the market perceives the merger to be a value-destroying investment. Cash bidders experience flat to slightly positive abnormal returns (Travlos, 1987). Study by Hansen (1987) supports that when a target firm knows its value better than a potential acquirer, the acquirer will prefer to offer stock, which has desirable contingent-pricing characteristics, rather than cash. Furthermore, prior research shows that the proportion of stock used in payment is significantly lower in cross-border transactions than in domestic transactions, but Mateev and Andonov, 2016 are unable to provide relevant statistics in support of this finding.
Despite this large literature, little is known about the link between book-to-market ratio and key financial performance index of the bidder firm ex post M&A (Schipper, & Thompson, 1983; Martin, 1996; Pontiff & Schall, 1998). Thus, this paper increases and expands the literature on this field of analysis with a specific contribution considering the Italian scenario.
Many efforts have united generations of scholars in appreciating the risk of market and business, as well as many related models; yet, what has always escaped is its indeterminacy (See also Marasca, 2014). That said, the Capital
Asset Pricing Model, CAPM, undoubtedly is the commonly accepted risk-return valuation model, which breaks
down the premium for the highest expected return on a risky investment. The Italian IVSs (the so-called PIV) are anchored to this model in the determination of cost of risk capital, cost of equity, that is, the component of the discount rate.
In the literature, different methods have been proposed for the identification of empirical proxies in order to intercept the risk of expected future returns on investments. Among them, the most traditional analytical structure was proposed by Sharp (1964) and Lintner (1965) based on the CAPM model. The evolution of more advanced predictive models compared to the CAPM requires the development of multifactorial analysis, such as the
Arbitrage Pricing Theory, APT; this model was initially proposed by Ross (1976); then b y R o s s w i t h
Gibbons and Shanken (1989), from which the 3-factor model, 3F, by Fama and French (1993; 1997), was derived. The APT model is based on the assumption that return on investment can be predicted through links (i.e. linear regression) among certain specific risk factors common to markets and non-specific risk factors. Fama and French's studies (1993; 2006; 2008; 2012) focus on the association of the risk premium for a financial asset; through the creation of homogeneous portfolios and using the dividend discount model, researchers have initially intercepted the role of the following predictors of equity returns: 1. expected additional return when securities are invested in a diversified portfolio; 2. expected return on a portfolio of securities with low to high capitalisation; and 3. expected return on a portfolio of securities with a low to high book-to-market ratio. In 20158 Fama and French deepened their previous study based on theories of trading off and pecking order, and in so doing improved their model of credit risk appreciation with two additional factors, namely 4. profitability and 5. investment style. The aim of this study is to analyse the behaviour of the book-to-market index, B/MV, on a sample of Italian
listed companies that completed a merger and acquisition, M&A, operation in the span 2008-2016, the decade of
the economic-financial crisis (see Loughran, 1997; Meier, Saulquin, & Schier, 2012; Tiscini, 2014; Pavan & Paglietti, 2017). B/MV is the quantity expressive of the creation of value, where book value is defined as net equity, i.e. the configuration of working capital (historical book value), while market value is defined as the capitalisation assigned by the market, i.e. an approximation of fair value, following the conventional representation of current value (approximation of economic value, see for instance Pizzo, 2000). The comparison is based on the performance of selected performance indicators, such as Ebitda, NFP/CF, Interest/Debt, ROE,
Debt/Equity, ROI. The intention is to consider the association between the selected performance indicators
mentioned above and, in particular, the book-to-market variable, so as to understand if the market manages to "capitalise" corporate trends regularly and with what intensity. See Azzini (1957), p. 71. “Sono questi i mercati
monetari e finanziari ai quali, non di rado, si attribuisce un elevato valore segnaletico per la congettura delle tendenze dei prezzi e dei volumi negoziati nei mercati delle materie e dei prodotti, almeno per la determinazione di tendenze generali di non breve periodo.” … “In tali mercati, e nelle quantità economiche loro proprie, si riflettono, direttamente o mediatamente, le convenienze di gran parte delle imprese dei più diversi settori e pertanto gli andamenti delle quantità di tali mercati, specialmente dei prezzi fatti, hanno significato di indici premonitori di carattere generale.”.
The aim is therefore to open an interdisciplinary dialogue on synergistic issues and reaffirm the logic of business economics, for example, to appreciate the correlation between B/MV and selected indices of liquidity, solidity and also profitability, the latter, as mentioned above, as a new factor introduced by Fama and French in the model of 2015 at 5F.
Previous study (among others, Pontiff & Schall, 1998) has revealed that the book-to-market ratio manages to estimate market returns of the Dow Jones Industrial Average and excess returns of smaller companies in the period 1926-1994. The book-to-market report contains information about future returns that are not recognised by other variables, such as interest rate spreads and dividend yields. On the contrary, the book-to-market ratio seems to lack similar predictive capabilities when calculated on the post-1960? S&P index. The conclusion reached by Pontiff and Schall is that this predictive ability of book-to-market seems to derive from the relationship between
equity book value and the ability to generate future income. Furthermore, Martin (1996) finds firms that use shares
as a means of payment in M&A tend to have lower book-to-market ratios than firms that use cash.
Hence the authors' interest in investigating the relationship between the market index and the income and non-earnings performance index in the context of Italian listed companies and in a historical period characterised by uncertain economic and financial prospects and profound geopolitical and macroeconomic changes. For this reason, too, it is deemed useful to assess whether, in the decade of reference of the present study, the market managed to appreciate strategic choices, for example of M&A, in terms of comparability between accounting, management and market performance.
3. Research Design and Variable Measurement
The synthetic results of the study given below are based on a sample of listed Italian companies, with the exception of the banking and insurance sectors9, involved in merger and acquisition operations over the last decade.
Undoubtedly, such operations do affect the decision-making and strategic system of a company, its organisational structure and its internal control system. The success of an M&A operation with the aim of reorganising corporate structure or increasing access to credit (as in the case of a merger) exerts significant effects also on management policies, r e s u l t i n g i n changes in the operational processes of risk management as well adapting both internal control systems and corporate information systems. The present path of study can be included in the range of studies (Schipper, & Thompson, 1983; Martin, 1996; Pontiff & Schall, 1998) focused on verifying the effects of corporate management which intend to identify constraints on the configuration of the so-called operating capital,
book value, i.e. shareholders' equity recorded in the financial statements, and respective market capitalisation,
an approximation of the concept of fair value, economic capital, in the commonly accepted sense of current market value, market value. The result is the book-to-market as the reference value of the present study. Hence the clarification of the research question that will accompany the entire study: does the book-to-market ratio
manage to appreciate the economy of a company in times of economic-financial crisis and, as a result, of strategic M&A choices? (See Alexandridis, Antypas, & Travlos, 2017; Fraunhoffer, Kim, & Schiereck, 2018; Liberatore,
2010 and Liberatore, Amaduzzi, Comuzzi, & Ferraro, 2014; Magli, Nobolo, & Ogliari, 2017).
hp. 1 discontinuity in the correlation between book-to-market and selected indices of liquidity, solidity and
profitability - in hp. 1 the aim is to understand whether the profitability indices selected are equally significant, also supporting the 5-factor Fama and French model (compared to the previous 3-factor model which lacked "profitability").
The reason for this is that financial analysts, and in general the banking system, are usually more oriented towards appreciating indicators of capital solidity and financial sustainability (solvency) rather than profitability; the model underlying the rating, as a weighted average of performance indices, is a clear example thereof. The recent introduction of profitability in the 5-factor model by Fama and French, on the other hand, reinforces the thesis of the authors of this study who intend to show that profitability too, as the other two indicators, must be considered to appreciate the going concern of an entity, and a safe conditioning factor of the value of a business.
The study was conducted in specific complementary phases; in particular, three moments can be identified which, also from a temporal point of view, followed one another and characterised the work process:
1. initial cognitive surveys and definition of the general conceptual framework of reference;
2. definition of the sample for empirical analysis - Italian listed companies - and selection of performance parameters;
3. verification of results obtained with respect to defined objectives.
The research methodology entails an analysis divided into the following three levels of knowledge:
1. documental analysis, to examine at a later date the actual adherence of the valuation processes to the gradual implementation of the Italian IVSs, and thus deepen the typical techniques of appreciation (used by financial analysts and, consequently, by corporate advisors) of the remuneration of capital that condition discount rates and therefore value;
2. strategic-managerial analysis, to understand the effects of M&A decisions on a sample of listed Italian companies, with the exception of the banking and insurance sectors, involved in M&A operations (to overcome crises) in the last decade;
3. empirical analysis, to understand if the market (through the book-to-market variable) is able to appreciate the deviations of corporate trends in terms of economic, financial and asset performance (especially upon completing the M&A mentioned above).
The authors have chosen to select only 6 performance indicators deemed to be most significant in terms of compliance with the economic, patrimonial and financial equilibrium and the requirement of going concern. Specifically, the following:
a. profitability indicators: i. EBITDA; ii. ROE; iii. ROI; iv. INTEREST/DEBT. b. solidity indicators: i. DEBT/EQUITY. c. liquidity indicator:
i. NET FINANCIAL POSITION/CASH FLOW.
Ebitda, NFP/CF, OF/Debt, ROE, Debt/Equity, ROI are the variables associated to the variable book-to-market, B/MV, representative of value creation.
3.1 Sample and Descriptive Statistics
The s t u d y phases were defined also in relation to the availability of data and information retrievable through (with a hand-collected) the database AIDA, Bureau van Dijk. In particular, the study analysed financial statements and corporate information for the reference period 2008-2016, a span affected by the severest economic and financial crisis in recent decades, when a large number of companies (including the listed companies in the sample) were involved in M&A operations, mainly mergers and demergers, in order to reorganise their corporate structure and facilitate access to credit, among other things. In the Appendix, here below, we can found the variables used in the analysis, as descriptive statistics Table.
The methodological layout is as follows:
1. sample of reference, about 90 listed Italian companies that carried out one or more M&A transactions in the reference period 2008-2016;
2. documentary analysis of financial statements and of specific M&A documents;
3. selection of defined economic, financial and asset performance indicators, as well as stock market indicators - graphic analysis;
4. hp. expressive magnitude of book-to-market value creation, B/MV. The aim is to determine the impact of the correlation between the selected performance indicators and the B/MV.
Statistical techniques and linear programming languages were used. Observations were 783 in total, broken down by 87 listed Italian companies in the industrial & service sector affected by an M&A transaction over a period of 9 years. Out of the initial 90 companies, 3 were rejected from the sample due to a lack of reliable data or information (compare considerations by Barnes, Harp, & Oler, 2014).
The statistical model focuses on the R programming language and development environment, a free software specific for statistical data analysis (See https://www.r-project.org/; http://cran.mirror.garr.it/mirrors/CRAN/). Initially, there were major display problems, as the numbers of the variables were read as "characters" instead of "numbers". Below is the programming language to obtain the correlation matrix and the p-value test.
################################### # Load packages and sources files #
################################### # -- Define datasets data <- read.table("Accounting3.txt",header=T,sep=",") ############## # Sort data ## ############## # Correlation ## ################ datacor <- data[complete.cases(data[,2:9]),] COR <- cor(datacor[,3:9]) p.val.cor <- NULL ss <- 1
for(ii in 3:8){for(jj in (ii+1):9){p.val.cor[ss]<- cor.test(datacor[,ii],datacor[,jj])$p.value ss <- ss + 1}}. 4. Empirical Results
The correlation matrix, and the respective p-values, obtained between performance indicators and book-to- market considering all years and all companies, is as follows (it should be noted, however, that all lines have been excluded when a value in the general data matrix had a NA, not available):
Table 1. 1st Correlation matrix
BtoMV EBITDA NFPtoCF OFtoDEBT ROE DebttoEquity ROI
BtoMV p-value 1 -0.01019548 0,8209933 -0.010619952 0,8136746 -0.022360118 0,619693 -0.034482368 0,4439903 -0.01266916 0,7785803 -0.03150153 0,4843855 EBITDA p-value 1 -0.011999542 0,7900023 0.055422516 0,2183595 0.213328092 0,000001672033 -0.03368004 0,4546705 0.49060945 2,421429E-31 NFPtoCF p-value 1 -0.009004504 0,8416095 0.008390471 0,852282 0.01242279 0,7827774 -0.01439826 0,7493112 OFtoDEBT p-value 1 0.011603086 0,7967864 -0.11760608 0,008817516 0.12598444 0,00499924 ROE 1 -0.05243736 0.51070558
p-value 0,2442176 3,101509E-34 DebttoEquity p-value 1 -0.11811488 0,008526939 ROI 1
This table presents the correlation between the variables considered in the survey: BtoMV is the book-to market value; EBITDA is the main operating income margin in absolute value; NFP/CF is the main solvency index;
INTEREST/DEBT is the cost of debt capital; ROE is the return on equity; DEBT/EQUITY is the main solidity
index; ROI is the return on investment.
In a second moment, to complete the analysis, the researchers made use of panel data regression; given that the wealth effect may vary over time and among different industries, we also include dummy variables to control for time differences and industry effects. Furthermore, with the aim of making the range of variation of the variable more homogeneous (i.e. smoothing process), it was decided to use the natural logarithm. We run a regression analysis of B/MV index against the selected performance indicators while controlling for important industry effects. A year dummy was added to control for time effects. The three steps of the analysis are the followings: 1. natural logarithm (ln) financial ratios; 2. the same with a year dummy; and 3. the same of point 2. with the industry subsector as control variables (dummy) (Ferrer, 2012; Mateev & Andonov, 2016).
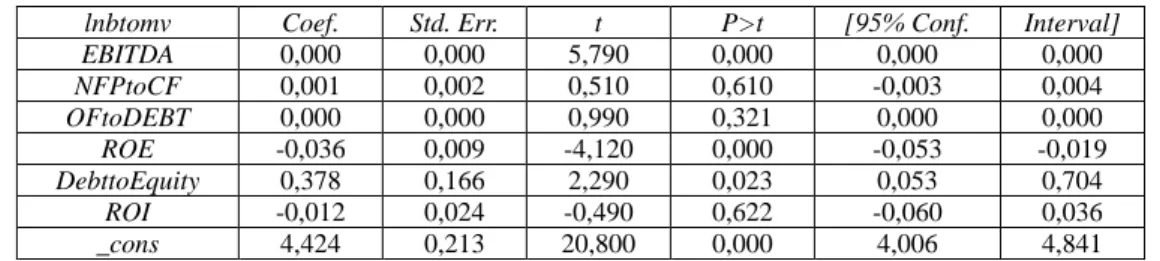
Here below the results considering the last step number 3., as above-mentioned (while in Appendix the results, considering steps 1. and 2.):
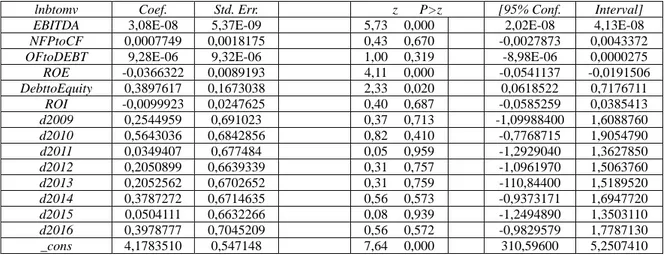
Table 2. 2nd Correlation matrix
lnbtomv Coef. Std. Err. z P>z [95% Conf. Interval]
EBITDA 2,02E-08 4,69E-09 4,31 0,000 1,10E-08 2,94E-08
NFPtoCF -0,0000955 0,0013427 0,07 0,943 -0,0027272 0,0025361
OFtoDEBT -5,97E-06 7,22E-06 0,83 0,408 -0,0000201 8,18E-06
ROE -0,0221081 0,0068808 3,21 0,001 -0,0355941 -0,008622 DebttoEquity 0,2309113 0,1319212 1,75 0,080 -0,0276496 0,4894721 ROI -0,0067363 0,0204097 0,33 0,741 -0,0467385 0,0332659 d2009 0,001523 0,5028678 0,00 0,998 -0,9840797 0,9871258 d2010 0,2439238 0,4983334 0,49 0,625 -0,7327917 1,2206390 d2011 0,0105622 0,495438 0,02 0,983 -0,9604785 0,9816029 d2012 -0,2307238 0,4866513 0,47 0,635 -1,1845430 0,7230952 d2013 -0,1847092 0,4900872 0,38 0,706 -1,145262 0,7758439 d2014 -0,0886546 0,4913498 0,18 0,857 -1,051683 0,8743732 d2015 -0,3282414 0,4839537 0,68 0,498 -1,276773 0,6202904 d2016 -0,1426267 0,5175545 0,28 0,783 -1,157015 0,8717615 d-utilities -2,520492 0,4840381 5,21 0,000 -346,9190 -1,571795 d-real estate -0,1147316 0,7499484 0,15 0,878 -1,584604 135,5140 d-clothing 3,641819 0,5911693 6,16 0,000 2,483149 480,0490 d-health 4,064097 0,7495856 5,42 0,000 2,594936 5,533257 d-publishing 5,243613 0,6076048 8,63 0,000 4,052729 6,434496 d-infrastructure -0,0534688 0,5377578 0,10 0,921 -1,107455 1,000517 d-art 3,841154 0,6725205 5,71 0,000 2,523038 515,92700 d-home 1,969174 0,640572 3,07 0,002 0,7136764 3,224672 d-green 516,58300 0,6053696 8,53 0,000 3,979327 6,352332 d-financial services 5,944245 0,7297264 8,15 0,000 4,514007 7,374482 d-automotive 1,068726 0,6502942 1,64 0,100 -0,2058269 2,343279 d-food 2,447768 0,6005241 4,08 0,000 1,2707630 3,624774 d-tech 3,521061 0,6225975 5,66 0,000 2,3007920 474,13300 d-equipment 3,837096 0,5446609 7,04 0,000 276,95800 4,904612 d-transport 3,583391 0,7206636 4,97 0,000 2,170917 4,995866 d-support services 192,80500 0,7357087 2,62 0,009 0,4860873 3,370013 _cons 2,660539 0,5414361 4,91 0,000 1,599344 3,721734 This table presents the correlation between the variables considered in the survey: in addition to the already defined dependent (i.e. BMV) and independent variables (i.e. EBITDA; NFP/CF; INTEREST/DEBT; ROE;
DEBT/EQUITY; ROI), dyears (d2008 – d2016) is the year dummy to control for time effects; d-industries (the
sample is divided in number 17 industries) is the industry dummy to control for industry effects.
Comments on correlation between the B/MV reference variable and the selected performance indicators are provided below:
- EBITDA: i n Ta b l e 1 i s -0.010, in Table 2 is approximately 0, correlation between EBITDA and book-to-market i n t h e 1s t c o r r e l a t i o n m a t r i x shows an inverse trend; an increase in the EBITDA index, that is, in gross operating margin, is inversely correlated with the trend of the reference index, namely negative/opposite, as if it showed a positive acceptance of the market in terms of capitalisation. In other words, when EBITDA rises, B/MV decreases. In the 2nd matrix, Table 2, the correlation coefficient is 0.0000000202, that is not very significant;
- NFP/CF: i n Ta b l e 1 i s -0.011, in Table 2 is approximately 0, an anomalous trend is obtained i n t h e
1s t c o r r e l a t i o n m a t r i x , n a m e l y decreasing the Net Financial Position or increasing the Cash Flow prompts also an increase in Equity, or a reduction in MV, as if the market did not appreciate (or did not "capitalise") this trend. In the 2nd matrix, Table 2, the correlation coefficient is -0.0000955, that is not very significant;
- INTEREST/DEBT: i n Ta b l e 1 i s -0.022, in Table 2 is approximately 0, an anomalous trend is obtained
i n t h e 1s t c o r r e l a t i o n m a t r i x , n a m e l y decreasing Interest or increasing Debt prompts also an increase in
Equity, or a reduction in MV, as if the market did not appreciate (or did not "capitalise") this trend. In the 2nd matrix, Table 2, the correlation coefficient is -0.00000597, that is not very significant;
- ROE: i n Ta b l e 1 is -0.034, in Table 2 is -0.022, in both cases the correlation between ROE and book-to-market shows an inverse trend; an increase in the ROE index, that is, in the remuneration of risk capital, is
inversely correlated with the trend of the reference index, namely negative/opposite, as if it showed a positive implementation of the market in terms of capitalisation. In other words, when ROE goes up, B/MV decreases; - DEBT/EQUITY: i n Ta b l e 1 i s -0.013, in Table 2 is 0.231, correlation between debt ratio and book-to-market i n t h e 1s t c o r r e l a t i o n m a t r i x shows an inverse trend; an increase in the debt ratio is inversely correlated with the trend of the reference index, namely negative/opposite, as if the increase in non-equity capital were positively perceived by the market in terms of capitalisation. In other words, when DEBT/EQUITY goes up,
B/MV decreases. This correlation is undoubtedly conditioned by the fact that Equity size is both the denominator
of the debt index and the numerator of the book-to-market reference index. Different result is obtained in t h e 2n d c o r r e l a t i o n m a t r i x , i n w h i c h t h e t r e n d i s p o s i t i v e w i t h a r o b u s t c o r r e l a t i o n .
- ROI: i n Ta b l e 1 i s -0.032, in Table 2 is -0.006, in both cases the correlation between ROI and book-to-market shows an inverse trend; an increase in the ROI index, that is, return on investment, is inversely
correlated with the trend of the reference index, namely negative/opposite, as if it showed a positive implementation of the market in terms of capitalisation. In other words, when ROI rises, B/MV decreases. At this point, in Table 1 it is important to understand also the values of the p-value. The p-value test is nothing more than a test to ascertain the level of significance observed in the association between two variables. Normally a null hypothesis is fixed, H0, as well as an alpha threshold value (by convention equal to 0.05) that indicates the level of significance of the tests. Calculating the p-value relative to the observed data, one finds that:
if p-value > alpha, the empirical evidence is not sufficiently contrary to H0, which, therefore, cannot be rejected; if p-value <= alpha, the empirical evidence is strongly contrary to H0, which, therefore, has to be rejected; thus, the observed data are statistically significant.
The following is a replication of the p-value values of the correlations between the performance indicators and the
book-to-market variable, which are indicated in the level below the correlation index within the above matrix:
- EBITDA: 0.821; - NFP/CF: 0,814; - INTEREST/DEBT: 0.620; - ROE: 0.444; - DEBT/EQUITY: 0.779; - ROI: 0.484.
In all cases, very high p-value values are obtained, and in any case higher than the alpha threshold value, which would lead to the assumption of the null hypothesis, H0; in other words, the significance of the correlation index mentioned above, between performance indices and the book-to-market indicator, is not substantial, and therefore the individual associations can be "uncorrelated" (to compare with Schipper, & Thompson, 1983; Martin, 1996; Pontiff & Schall, 1998; Shin, 2012).
5. Conclusion
Following the above-mentioned survey lines, the study has verified whether the listed Italian companies sampled have book-to-market indices in line with corporate performance in terms of profitability, and therefore of general economic, patrimonial and financial equilibrium, especially during the decade 2008-2016, after the economic and financial crisis, characterised as it was by M&A corporate reorganisation decisions such as mergers. The underlying hypothesis concerns the possibility that the book-to-market index may be more affected by financial market externalities than by the specific economic and financial outlook in terms of market capitalisation. To test the hypothesis that the B/MV may be more affected by financial market externalities than by the specific economic and financial outlook, in terms of market capitalisation, the authors divided the study in two moments. In the first one, the researchers use univariate analysis to test the hypothesis, that is, the correlation matrix between the selected performance indicators and the book-to-market index. The p-values indicate that the null hypothesis cannot be rejected, that is, there is no statistically significant correlation between these variables. In the second moment of the study the researchers have improved the analysis with the introduction of control variables, that is the “year” and “industries” dummies, and to make the results more robust.
The results of the study (Table 1 and Table 2) can be summarised as follows:
correlation between the book-to-market reference variable and the selected performance indicators: the
correlation matrix indices represent consistent associations between the B/MV market index and EBITDA, ROE,
ROI; in detail, as gross operating margin and income indices increase, the reference index shows an opposite
trend, i.e. B/MV decreases, as if the market were able to capitalise on the improvement in economic balance in the appreciation of market value, MV. In the two moments of study, an anomalous association is found in analysing the correlation between the reference index and the debt ratio, Debt/Equity; in this case, in a first moment (Table 1), it is as if an increase in Debt were perceived positively by the market in terms of capitalisation, MV; this is justifiable, for example, by the fact that a company managing to obtain credit from one or more banks enjoys a good rating, i.e. a reduced risk of default. Nevertheless, in the second moment (Table 2) the correlation shows exactly the contrary.
There is no doubt that, in addition to this justification, a number of considerations can be made, including critical ones, in terms of capital strength. It is also clear that this correlation is conditioned by the fact that Equity size is both the denominator of the debt index and the numerator of the reference index.
Equally consistent associations cannot be stated when analysing the correlation indices between the reference index, B/MV, and NFP/CF, remuneration of Debt, Interest/Debt. In this case, in fact, an anomalous trend is recorded; in detail, in the former case, decreasing the Net Financial Position (i.e. residual debt), or increasing the Cash Flow, prompts an increase in Equity, or a reduction in MV, while in the latter case, decreasing Interest, or increasing Debt, prompts an increase in Equity, or a reduction in MV, as if the market did not appreciate (or did not "capitalise") this trend.
From the p-value test, i.e. a test to ascertain the level of significance observed in the association between two variables, very high p-value values are always obtained that are in any case higher than the alpha threshold value, which would lead to the null hypothesis, H0. In other words, between the selected performance indices and the book-to-market indicator, the significance of the above correlation index is not substantial, and therefore the individual associations can also be considered "uncorrelated". This would mean that the market follows an independent, perhaps speculative, logic with respect to corporate trends, and in any case with respect to the 6 "systemic" key performance indexes such as those selected in this study.
The matrix also provides correlations between the individual selected performance indices, but no individual ratings are given here. By way of example, we can confirm that between EBITDA and ROI the correlation index is equal to 0.491, a very high value, along with an infinitely low p-value (equal to 2.421429E-31). The same can be verified between ROE and ROI, or between ROE and EBITDA, but also between Interest/Debt and debt ratio
Debt/Equity, which demonstrates the general reliability of the analysis performed. Also significant is the
correlation between Interest/Debt and ROI of 0.126, which would seem to be close to the theories on leverage; in addition, the p-value test provides a value of 0.005, so very small and still far from the conventional threshold of "uncorrelation" of 0.05.
In conclusion, we cannot confirm the hypothesis that the B/MV may be more affected by financial market externalities than by the specific economic and financial outlook, in terms of market capitalisation, but the authors would stress the correlations between the selected performance indicators and the book-to-market index, pointing out that the B/MV could suffer from the conditions of the financial and monetary markets, more than the
economic-financial conditions of the listed companies, in an even more accentuated way in times of great economic crisis. The practice is oriented to privilege the patrimonial-financial indicators with respect to the profitability ones. Therefore the valuation models that also and in particular the profitability indicators better reflect the economic-financial situation of the entity.
The study could be refined considering a larger sample of companies, including for example also listed companies in the banking and insurance sector, deliberately left out of the initial selection so as not to alter the sample balance sheet and market data, especially for the particular decade 2008-2016 taken into consideration, namely the span of the beginning and the immediate post-financial crisis years. Moreover, the fact that the marginal impact of changes in institutional factors on value creation can be different across different countries, asks for a careful assessment of these factors. We believe the research can be improved if we extend our analysis to other target countries inside and outside Europe. Nevertheless, for the purposes of this study, the regression model and the consequent conclusions described above are considered reliable.
Acknowledgments
We are thankful for the thoughtful comments received by prof. Galassi, University of Parma (Italy). References
Alexandridis, G., Antypas, N., & Travlos, N. G. (2017). Value creation from M&As: New evidence. Journal of
Corporate Finance, 45(C), 632-650. https://doi.org/10.1016/j.jcorpfin.2017.05.010
Azzini, L. (1957). Le situazioni d’impresa investigate nella dinamica economia delle produzioni. Le situazioni
patrimoniali. Milano: A. Giuffrè.
Barnes, B. G., Harp, N. L., & Oler, D. (2014). Evaluating the SDC mergers and acquisitions database. Financial
Review, 49, 793-822. https://doi.org/10.1111/fire.12057
Boehmer, E., Musumeci, J., & Poulsen, A. B. (1991). Event-study methodology under conditions of event-induced variance. Journal of Financial Economics, 30, 253-272.
https://doi.org/10.1016/0304-405X(91)90032-F
Brander, J. A., & Egan, E. J. (2017). The winner’s curse in acquisitions of privately-held firms. The Quarterly
Review of Economics and Finance, 65(C), 249-262. https://doi.org/10.1016/j.qref.2017.01.010
Cattaneo, M. (1998). Principi di valutazione del capitale d’impresa. Bologna: Il Mulino.
Chang, S. (1998). Takeovers of privately held targets, methods of payment, and bidder returns. Journal of
Finance, 53, 773-784. https://doi.org/10.1111/0022-1082.315138
Doukas, J. A., & Travlos, N. (1988). The effect of corporate multinationalism on shareholders’ wealth: evidence from international acquisitions. Journal of Finance, 43, 1161-1175.
https://doi.org/10.1111/j.1540-6261.1988.tb03962.x
Faccio, M., McConnell, J. J., & Stolin, D. (2006). Returns to acquirers of listed and unlisted targets. Journal of
Financial and Quantitative Analysis, 41, 197-220. https://doi.org/10.1017/S0022109000002477
Fama, E., & French, K. (1993). Common risk factors in the returns on stocks and bonds. Journal of Financial
Economics, 33, 3-56. https://doi.org/10.1016/0304-405X(93)90023-5
Fama, E., & French, K. (2006). Profitability, investment, and average returns. Journal of Financial Economics,
82, 491-518. https://doi.org/10.1016/j.jfineco.2005.09.009
Fama, E., & French, K. (2008). Dissecting anomalies. Journal of Finance, 63, 1653-1678. https://doi.org/10.1111/j.1540-6261.2008.01371.x
Fama, E., & French, K. (2012). Size, value, and momentum in international stock return. Journal of Financial
Economics, 105(3), 457-472. https://doi.org/10.1016/j.jfineco.2012.05.011
Fama, E., & French, K. (2015). A five-factor asset pricing model, Journal of Financial Economics, 116, 1-22. https://doi.org/10.1016/j.jfineco.2014.10.010
Fama, E., & French, K. R. (1997). Industry costs of equity. Journal of Financial Economics, 43, 153-193. https://doi.org/10.1016/S0304-405X(96)00896-3
Ferrer, R. C. (2012). An empirical investigation of the impact of merger and acquisition on the firms' activity ratios, Journal of International Management Studies, 12(2), 68-73.
Fraunhoffer, R., Kim, H. Y., & Schiereck, D. (2018). Value creation in M&A transactions, conference calls, and shareholder protection. International Journal of Financial Studies, 6(5), 4-21.
https://doi.org/10.3390/ijfs6010005
Fuller, K., Netter, J., & Stegemoller, M. (2002). What do returns to acquiring firms tell us? Evidence from firms that make many acquisitions. Journal of Finance, 57, 1763-1793. https://doi.org/10.1111/1540-6261.00477 Galassi, G. (1984). Misurazioni differenziali, misurazioni globali e decisioni d’azienda, Giuffrè, Milano.
Gibbons, M., Ross, S., & Shanken, J. (1989). A test of the efficiency of a given portfolio. Econometrica, 57, 1121-1152. https://doi.org/10.2307/1913625
Golubov, A., Yawson, A., & Zhang, H. (2015). Extraordinary acquirers. Journal of Financial Economics, 116, 314-330. https://doi.org/10.1016/j.jfineco.2015.02.005
Guatri, L., & Bini, M. (2009). Nuovo trattato sulla valutazione delle aziende, Milano: EGEA.
Guo, Z. Y. (2017) Housing dynamics, empirical facts and the business cycle, Global Conference on Business and
Finance Proceedings, Institute for Business and Finance Research, Hilo, Hi, USA, 12(2), 46-53. ISSN
1941-9589.
Hansen, R. G. (1987). A theory for the choice of exchange medium in mergers and acquisitions. Journal of
Business, 60, 75-95. https://doi.org/10.1086/296386
Heckman, J. J. (1979). Sample selection bias as a specification error. Econometrica, 47, 153-161. https://doi.org/10.2307/1912352
John, K., Freund, S., Nguyen, D., & Vasudevan, G. K. (2010). Investor protection and cross-border acquisitions of private and public targets. Journal of Corporate Finance, 16, 259-275.
https://doi.org/10.1016/j.jcorpfin.2010.02.001
Liberatore, G. (2010). La valutazione delle PMI, Milano: FrancoAngeli.
Liberatore, G., Amaduzzi, A. A., Comuzzi, E., & Ferraro, O. (2014). La valutazione delle aziende in crisi. Studi di valutazione d’azienda, Collana Sidrea. ISBN: 9788814203503.
Lintner, J. (1965). Security Price, Risk and Maximal Gains from Diversification, Journal of Finance, 20(4), 587-615. https://doi.org/10.1111/j.1540-6261.1965.tb02930.x
Loughran, T. (1997). Book-to-market across firm size, exchange, and seasonality: Is there an effect? Journal of
Financial and Quantitative Analysis, 32, 249-268. https://doi.org/10.2307/2331199
Magli, F., Nobolo, A., & Ogliari, M. (2016). Comprehensibility and transparency of the impairment test in contexts of crisis. Risk Governance & Control: Financial Markets & Institutions, 6(4), 141-150. https://doi.org/10.22495/rcgv6i4c1art4
Manokaran, G., & Radharukkumani, R. (2014). A study on impact of merger and acquisition on growth performance of selected acquirer banks in India. International Journal of Research in Commerce and
Management, 5(12), 65-70.
Marasca, S. (2014). I principali fattori d'incertezza nella valutazione d'azienda. Identificazione, analisi e
modalità di gestione, Milano: Giuffrè Editore.
Martin, K. J. (1996). The method of payment in corporate acquisistions, investment opportunities, and management ownership. Journal of Finance, 51, 1227-1246.
https://doi.org/10.1111/j.1540-6261.1996.tb04068.x
Mateev, M., & Andonov, K. (2016). Do cross-border and domestic biddingfirms perform differently? New evidence from continental Europe and the UK. Research in International Business and Finance, 37, 327-349. https://doi.org/10.1016/j.ribaf.2016.01.001
Mazzotta, R., & Veltri, S. (2014). The Relationship between corporate governance and the cost of equity capital. Evidence from the Italian stock exchange. Journal of Management & Governance, 18(2), 419-448. https://doi.org/10.1007/s10997-012-9230-9
Meier, O., Saulquin, J. Y., & Schier, G. (2012). Medium Sized High Tech International Acquisitions: A Longitudinal Perspective (1990-2011). International Business Research, 5(6).
https://doi.org/10.5539/ibr.v5n6p94
Business, 73(3), 287-329. https://doi.org/10.1086/209645
Moeller, S. B., & Schlingemann, F. P. (2005). Wealth destruction on a massive scale? A study of acquiring firm returns in the recent merger wave. Journal of Finance, 60, 757-752.
https://doi.org/10.1111/j.1540-6261.2005.00745.x
Moeller, S. B., Schlingemann, F. P., & Stulz, R. M. (2004). Firm size and the gains from acquisitions. Journal of
Financial Economics, 73, 201-228. https://doi.org/10.1016/j.jfineco.2003.07.002
Olivotto, L. (1983). La valutazione economica dell’impresa. Padova: Cedam.
Onesti, T., Romano, M., & Taliento, M. (2016). Il bilancio di esercizio nelle imprese. Dal quadro concettuale di
riferimento alle nuove regole contabili nazionali e internazionali. Torino: Giappichelli Editore. ISBN
9788892106130.
Paganelli, O. (1990). La valutazione delle aziende. Torino: Utet.
Pavan, A., & Paglietti, P. (2017). Il valore dell’impresa nelle operazioni straordinarie. Collana Azienda & Società, Maggioli.
Pizzo, M. (2000). Il fair value nel bilancio d’esercizio. Padova: Cedam.
Pollifroni, M., Militaru, G., & Ioana, A. (2016). The creation of value generated by the “Company Visit”. A theorethical model of evaluation. Economics, Management & Financial Markets, 11(1), 338-346.
Pontiff, J., & Schall, L. D. (1998). Book-to-market ratios as predictors of markets returns. Journal of Financial
Economics, 49(2), 141-160. https://doi.org/10.1016/S0304-405X(98)00020-8
Ross, S. (1976). The Arbitrage Theory of Capital Pricing. Journal of Economic Theory, 13. https://doi.org/10.1016/0022-0531(76)90046-6
Sannino, G., & Tartaglia, P. P. (2014). I fini del bilancio nel modello IASB: evoluzione o regresso? Analisi crisita e
confronto con la realtà dell’Europa Continentale. Collana di Economia Aziendale. Torino: Giappichelli.
Schipper, K., & Thompson, R. (1983). Evidence on the capitalized value of merger activity for acquiring firms.
Journal of Financial Economics, 11, 85-119. https://doi.org/10.1016/0304-405X(83)90006-5
Sharpe, W. F. (1964). Capital asset prices: a theory of market equilibrium under conditions of risk. Journal of
Finance, 19(3), 425-442. https://doi.org/10.1111/j.1540-6261.1964.tb02865.x
Shin, S. (2012). Decomposed approach of market orientation and marketing mix capability: research on their relationship with firm performance in the Korean context. International Business Research, 5(1). https://doi.org/10.5539/ibr.v5n1p22
Tiscini R. (2014). Logiche di misurazione e utilità decisionale dei bilanci. Spunti di riflessione dalle
aggregazioni aziendali tra società indipendenti e infragruppo. Scritti in onore di Pellegrino Capaldo,
Milano: Egea.
Travlos, N. G. (1987). Corporate takeover bids, methods of payment, and bidding firms’ stock returns. Journal of
Finance, 42, 943-963. https://doi.org/10.1111/j.1540-6261.1987.tb03921.x
Viganò R. (2001). Il valore dell’azienda, Cedam, Padova.
Zanda, G., Lacchini, M., & Onesti T. (2013). La valutazione delle aziende. Torino: Giappichelli Editore. Zappa, G. (1936). Il reddito d’impresa. Milano: Giuffrè.
Zappa, G. (1957). La produzione nell’economia delle imprese. Milano: Giuffrè. Notes
Note 1. The process of discounting cash flows takes place thanks to a consistent approach that expresses the opportunity-cost of equity in the equity side approach, and the weighted average cost of capital in the asset side approach.
Note 2. In particular, the Italian Legislative Decree no. 139/2015 implemented the European Directive 2013/34 on the separate and consolidated financial statements of limited liability companies, introducing significant changes to the valuation criteria for financial statement items (see traditional Italian doctrine on company valuations and financial statement items, among others, Cattaneo, 1998; Ferrero, 1966; Galassi, 1984; Guatri and Bini, 2009; Viganò, 2001).
Note 3. The introduction of the amortised cost criterion was criticised by the CNDCEC, which underlined how "the application of the IASB derivation method was born for information purposes completely different from those pursued by SMEs, the main target of the civil code regulations". Accounting and valuation standards, in a more general framework of international harmonisation, are strongly oriented towards markets and investors, the latter being the main reference subjects of financial reporting.
Note 4. See among others Guatri & Bini, 2009; Olivotto, 1983; Paganelli, 1990; Pollifroni, Militaru & Ioana, 2016; Zanda, Lacchini, & Onesti, 2013.
Note 5. Cost of capital is the main component of the discount rate used in company valuations based on indirect criteria, i.e. on the chosen flows, and is usually a nominal rate, therefore including expectations on expected inflation. In particular, for the determination of the cost of equity or risk capital, the PIV state (see PIV III.1.43, p.160):
"The Capital Asset Pricing Model (CAPM) is normally used to determine the cost of equity, and is based on
assumptions whose plausibility in the case under examination must be assessed by the expert. The use of any corrections to the CAPM, or other models, must be reported.”
The PIV, therefore, suggest the use of the traditional CAPM, and only in a second instance of any "corrective" (e.g.
Modified CAPM, APT and so on) aimed at adjusting some critical aspects of the traditional model. However, the PIV do not define the methods for estimating and calculating the coefficients to be included in these models,
leaving ample discretion to the expert in defining and justifying the choices made and, not least, the information bases consulted for the construction of the coefficients. In particular: "the expert must specify the methodological paths followed and the sources used to determine the rates used in the valuations, indicating the reasons for his choices". (See Italian PIV III.1.43, p.159).
Note 6. The expert has the burden of having to indicate the sources used to determine the discount rate, promoting transparency of information, aware of the possible diversity of available sources. The complexity of the company's evaluation process and the discretionary nature of the choice of criteria and reference quantities require careful attention in analysing corporate performance and its final and expected balances. One can easily understand how the choice of a solid and accurate database is a key process, even in rate appreciation (Heckman, 1979). The use of mathematical-statistical techniques may help to reduce the discretion of the analyst (decision taker).
Note 7. The CAPM is a static, linear and monofactorial model that d e r i v e s the opportunity-cost of capital from the company's exposure to financial market risk, measured by the beta coefficient. However, company valuation is a process that looks to the future and not only to the past. These considerations led to the design of models for estimating the beta value not only in terms of historical but also of prospective data, in line with the recommendations of the Italian PIV, among other things.
Note 8. See Fama and French (2015) who refined their model increasing multivariate analysis factors from 3 to 5, with the addition of profitability, i.e. the ability to generate returns on investment. Among the reasons i n t h e evolution of the Fama and French model, there is the observation in their study that smaller companies are characterised by higher risks. Companies with a market capitalisation lower than book net equity (the so-called
MV/B, antithesis of the book-to-market value, B/MV) are characterised by a much higher financial risk (with the
same book debt), and therefore potentially higher expected returns.
Note 9. Companies belonging to the banking and insurance sector were deliberately excluded from the study sample in order not to alter the balance sheet and market data of the sample, especially for the particular decade 2008-2016 considered, as it was the span of the beginning and the immediate post-financial crisis years.