Sigla di identificazione Distrib. Pago
~ Ricerca Sistema Elettriço XCIRTEN - LP3 - 007 L 1
Titolo
Thermal-hydra
ulic post-test analysis of the transition from
forced
t
o na
tural circulation in ICE test section
Ente emittente CIRTEN
PAGINA D
I
GUARDIA
Descrittori
Tipologia del documento: Rapporto Tecnico
Collocazione contrattuale: Accordo di programma ENEA-MSE: tema di ricerca "Nuovo nucleare da fissione"
Argomenti trattati:
Sommario
This report, carried out at the DIMNP of the University of Pisa, in collaboration with ENEA Brasimone Research Centre, illustrates the thermo-fluidynamic results of the analysis, performed by the RELAP5 system code, of anexperimental test recently carried out atENEA on CIRCE facility.
In particular, the so-called Test D ofthe last experimental campaign performed with the rCE test section was considered. This test simulates an Unprotected Loss Of Flow (ULOF) accident transient of interest for the safety of HLM reactors. The aim of this test was to investigate the transition from forced to natural circulation inthe primary system.
The RELAP5/Mod3.3 code, modified in order to take into account the LBE fluid properties, was employed to reproduce the phenomena occurring during the test transient and to assess the capability and limits of the code by comparing the numerical results with experimental data.
Note
Report PAR2008-2009 LP3.B2 - CERSE-UNIPI RL-1087-2/2011 PART-2 Autori: G. Barone, N. Forgione, F. Oriolo
UNIPI Copia n. In carico a: NOME FIRMA NOME FIRMA
IYOV
2òi1 NOME NA FIRMA DATA CONVALIDA 2 1 ~ Meloni NAo
EMISSIONE\~
REV. DESCRIZIONE VISTO APPROVAZIONE
di 33
CIRTEN
Consorzio Interuniversitario per la Ricerca TEcnologica Nucleare
Lavoro svolto in esecuzione della linea progettuale LP3 punto B2 parte II AdP MSE‐ENEA “Ricerca di Sistema Elettrico” - PAR2008-09
Progetto 1.3 – “Nuovo Nucleare da Fissione”.
UNIVERSITA’ DI PISA
DIPARTIMENTO DI INGEGNERIA MECCANICA, NUCLEARE E DELLA PRODUZIONE
Thermal-hydraulic post-test analysis
of the transition from forced
to natural circulation in ICE test section
G. Barone, N. Forgione, F. Oriolo
CERSE-UNIPI RL 1087-2/2011
2nd part
ii
Abstract
This report, carried out at the DIMNP of the University of Pisa, in collaboration with ENEA Brasimone Research Centre, illustrates the thermo-fluidynamic results of the analysis, performed by the RELAP5 system code, of an experimental test recently carried out at ENEA on CIRCE facility.
In particular, the so-called Test D of the last experimental campaign performed with the ICE test section was considered. This test simulates an Unprotected Loss Of Flow (ULOF) accident transient of interest for the safety of HLM reactors. The aim of this test was to investigate the transition from forced to natural circulation in the primary system.
The RELAP5/Mod3.3 code, modified in order to take into account the LBE fluid properties, was employed to reproduce the phenomena occurring during the test transient and to assess the capability and limits of the code by comparing the numerical results with experimental data.
iii
INDEX
Abstract ... i
Nomenclature... iii
1. RELAP5 Model ... 1
1.1 Primary loop... 1 1.2 Secondary loop ... 52. Boundary conditions ... 8
3. Obtained results... 9
4. Conclusions ... 25
References ... 26
iv
Nomenclature
Abbreviations
cp Specific heat at constant pressure [J·kg-1·K-1]
D Diameter [m]
g Acceleration of gravity [m·s-2]
HTC Heat Transfer Coefficient [W·m-2·K-1]
m& Mass flow rate [kg·s-1]
Nu Nusselt number
Pe Peclet number
Re Reynolds number
Hr Riser height [m]
∆P Pressure difference [mbar]
DF
P
∆ Driving force [mbar]
Q& Power [kW]
∆T Temperature difference [K]
p Pitch [m]
x Pitch to diameter ratio (p/D)
LBE
ρ LBE mean density [kg·m-3]
g
ρ Gas mean density [kg·m-3]
,
r TP
ρ
Riser two phase flow mean density [kg·m-3]
α
Average void fractionAcronyms
CIRCE CIRCulation Experiment
DEMETRA DEvelopment and assessment of structural materials and heavy liquid MEtal technology for TRAnsmutation systems
DIMNP Dipartimento di Ingegneria Meccanica Nucleare e della Produzione
v HLM Heavy Liquid Metal
HS Heat Section
HX Heat Exchanger
ICE Integral Circulation Experiment LBE Lead-Bismuth Eutectic
RELAP5 Reactor Excursion and Leak Analysis Program
SS Stainless steel
1
1. RELAP5 Model
In the present section only the description of the RELAP5 nodalization used for post test analysis is reported. The configuration of the CIRCE facility with ICE test section, taken as reference for the present work, is that reported in detail in Ref. [1-2].
The ICE test section has been modelled, using RELAP5/MOD3.3 code (Ref. [3]), considering two sub-systems: the first one simulates LBE circulation through the ICE section flow path (primary loop); the second one simulates water-steam circulation inside the heat exchanger secondary side (secondary loop). The two systems are coupled through the HX thermal structures.
The argon has been used as non-condensable gas to simulate the gas-injection circulating system.
Stainless steel AISI 316L thermo-physical properties have been used for all the heat structures. Furthermore, thermal properties of pressurized helium have been defined to take into account the presence of insulating gap in the bayonet tubes.
The initial temperature has been set to 566.15 K for both thermal structures and working fluids (LBE and water).
The convection heat transfer correlations implemented into RELAP5 for liquid metals flow inside a pipe with constant wall temperature, is that of Seban-Shimazaki (Ref. [4]):
0.8
5 0.025
Nu= + ⋅Pe (1)
while the correlation used for bundles with triangular pitch is the one proposed by Ushakov et al. (Ref. [5]):
(0.56 0.19 )
13 2
7.55 20 0.041 x
Nu= ⋅x− ⋅x− + ⋅x− ⋅Pe + ⋅ (2)
valid in a range of 1<Pe<4000 and 1.2<x <2.0, where x is the pitch to diameter ratio (p/D). The latter correlation (Eq. (2)) is used for vertical bundle convection boundary type and is associated to:
− Heat Section with a bundle of 37 fuel rods (p/D = 1.8) − Heat Exchanger with a bundle of 91 tubes (p/D = 1.22)
1.1 Primary loop
The primary loop nodalization, depicted in Figure 1, has been defined with LBE as working fluid, characterized by a LBE total mass approximately equal to 70 tons.
2
The hydraulic components involved in CIRCE main vessel develops vertically along a total height of 8.4 m.
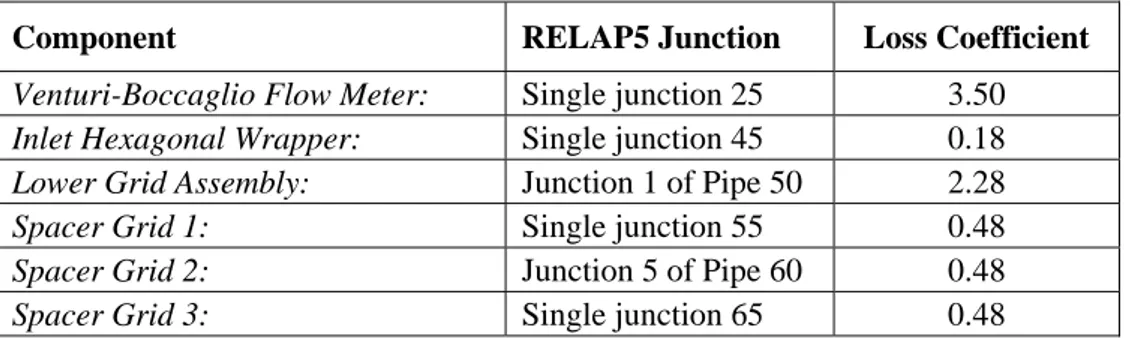
The LBE enters through the feeding conduit (PIPE 20), passes through the Venturi-Boccaglio flow meter (PIPE 30) to reach the heat section (HS) modelled by PIPE 50, PIPE 60 (1 m active section) and PIPE 70, where the fluid is heated by the 37 fuel pins. To account for the concentrated pressure losses present along the rising path, the concentrated loss coefficients, described in Table, 1 have been introduced.
Component RELAP5 Junction Loss Coefficient
Venturi-Boccaglio Flow Meter: Single junction 25 3.50 Inlet Hexagonal Wrapper: Single junction 45 0.18 Lower Grid Assembly: Junction 1 of Pipe 50 2.28 Spacer Grid 1: Single junction 55 0.48 Spacer Grid 2: Junction 5 of Pipe 60 0.48 Spacer Grid 3: Single junction 65 0.48
Table 1. Concentrate pressure losses values and positions.
Exiting the heat section, the liquid metal crosses the realease pipe (PIPE 80) to reach the
fitting volume (PIPE 90), that allows the hydraulic connection between the heat section and
the 3.7 m height riser (BRANCH 100, PIPE 110, SINGLE VOLUME 120 and PIPE 130). At the riser inlet (BRANCH 100), the argon is injected to drag the LBE to flow upward through the riser, up to the separator (BRANCH 132 and PIPE 135).
The gas lift system is responsible for the driving force that causes the LBE to circulate along ICE flow path. Argon injection is simulated by a time dependent junction (TMDPJUN 4) which forces the requested gas mass flow rate from a time dependent volume (TMDPVOL 3), containing argon at 6 bar and 650.15 K, to the riser inlet. The separator allows the separation of the LBE from the injected gas (which flows into the cover gas, modelled by BRANCH 150) and assures that the overall LBE flows directly into the heat exchanger (HX) shell side, before falling down into the surrounding downcomer (PIPE 305 and PIPE 320). However, as the experimental setup foresaw a LBE initial level of 9 cm below the top edge of the separator, at high gas injection flow, a fraction of the total LBE mass flow rate bypasses the separator barrier. Consequently, part of the hot LBE could flow in the downcomer without being cooled. This undesired phenomenon, not precisely evaluable, was taken into account in the simulation introducing a time dependent junction (TMDPJUN 117), connecting the separator upper zone (BRANCH 140) with the downcomer upper zone (BRANCH 300), in order to simulate the LBE bypass flow in case of separator maximum level exceeding. The
3
LBE bypass phenomenon was supposed to involve the time span from 3000 s up to the transition from assisted to natural circulation (10730 s), when the LBE mass flow rate reduces considerably. The bypass mass flow rate fraction was indirectly estimated to be approximately 30% of the total value.
The LBE side of the HX is simulated by PIPE 170 (cold sink of the system) thermally coupled with the secondary side heat exchanger components (rising annular bayonet pipes). The cooled LBE exiting the heat exchanger outlet section, mixes in BRANCH 180 with the LBE slowly flowing downwards from the HX surrounding downcomer region. The cold LBE proceeds then through the 4.35 m lower downcomer zone (from BRANCH 180 to BRANCH 290) to reach the feeding conduit inlet.
Each internal loop component is thermally coupled with the associated external component along the entire surrounding downcomer zone (7.70 m height) to simulate radial heat transfer phenomena.
Heat transfer with the environment around the facility was taken into account imposing an equivalent convective heat transfer coefficient of 1 W/(m2 K) between the facility external structures (15 mm SS thickness and thermal insulation material) and air, supposed at a temperature of 288 K.
Concerning the heating source, the power provided by the 37 electrical pins has been simulated using the vertical bundle-without crossflow convection boundary type option, foreseen by the code with the implemented Ushakov correlation. A pin radius of 4.1 mm with a pitch to diameter ratio of 1.8 and an active length of 1 m have been specified.
The LBE region between the heat section hexagonal wrapper and the surrounding containment tube (presenting several holes for the instrumentation inlet) has been modelled by an annular equivalent LBE thickness (45 mm) in the thermal structures associated to the heat section components.
5
6
1.2 Secondary loop
The secondary loop nodalization, reported in Figure 2, simulates the water cooling circuit of the ICE section divided in three sectors. Each sector represents the external (30 tubes), central (54 tubes) and inner (7 tubes) compartment of the cooling bundle in which the 91 bayonet tubes are divided (see Ref [1]).
7
8
The TMDPJUN 801 provides the requested water mass flow rate, of about 0.5 kg/s, to three separated cooling loops (30 tubes, 54 tubes and 7 tubes), activated by motor valves MV 400, MV 500 and MV 600 (see Figure 2).
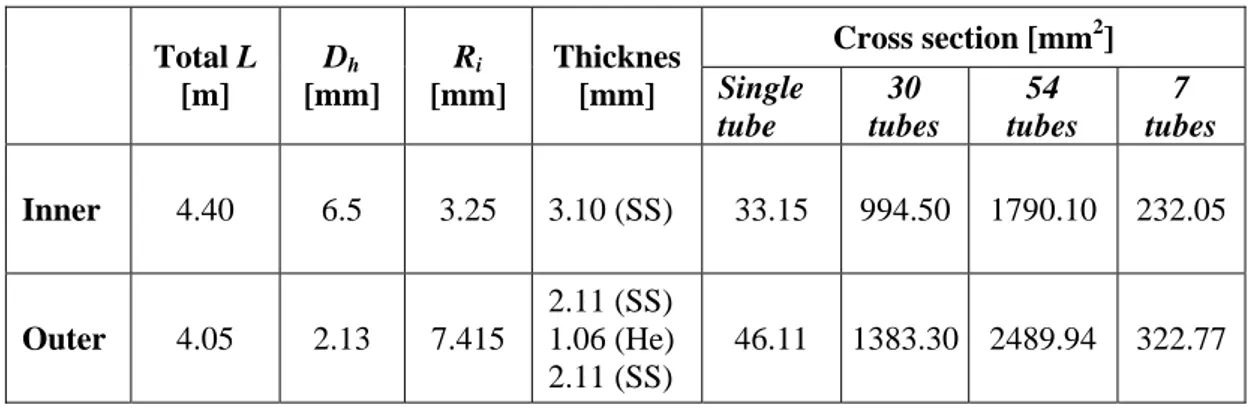
Each loop (see description in Table 2) follows the single bayonet tube flow path and is simulated by:
− inner cylindrical tube where water flows downwards;
− outer surrounding annular zone (simulated by annulus hydraulic components), between the inner tube and outer tube, where water-steam mixture flows upwards.
Cross section [mm2] Total L [m] Dh [mm] Ri [mm] Thicknes [mm] Single tube 30 tubes 54 tubes 7 tubes Inner 4.40 6.5 3.25 3.10 (SS) 33.15 994.50 1790.10 232.05 Outer 4.05 2.13 7.415 2.11 (SS) 1.06 (He) 2.11 (SS) 46.11 1383.30 2489.94 322.77
Table 2. Geometrical parameters of the HX bayonet tubes.
Cold water enters from the inner tube inlet (SNGLVOL 410, 510 and 610) and flows down through the upper part of the inner tubes (BRANCH 420, 520 and 620) crossing the steam plenum. These pipes are thermally coupled with the steam plenum (BRANCH 700), because in this section (about 0.3 m length) the external annular tubes are not present.
Water continues to flow downwards through the inner tube section crossing the facility gas plenum (PIPE 430, 530 and 630) characterized by a length of 0.5 m.
The next components section represents the inner region of the bayonet tubes (PIPE 440, 540, 640) that are plunged into the liquid metal inside the separator. The length of this section is 0.35 m (corresponding to the separator height).
Then water descends through the 3.2 m long section (PIPE 450, 550 and 650), corresponding to the heat exchanger shell length, to reach the bottom extremity of the bayonet tube (BRANCH 460, 560, 660) where it changes direction of flow (see Figure 3). Inner components thermal structures are thermally coupled with the corresponding outer (annular) components.
9
Figure 3. Coolant flow path inside the bayonet tube.
Following the bayonet tube path, the water rises up through the external annular zone, crossing the last three HX section previously described for the inner tube path: shell length section (ANNULUS 470, 570 and 670), separator length section (ANNULUS 480, 580 and 680) and gas plenum section (ANNULUS 490, 590 and 690), from which the water-steam mixture exits to be collected into the steam plenum (BRANCH 700). The steam plenum is connected to a time dependent volume (TMDPVOL 6) that sets the outlet loop pressure to 1 atm.
The heat transfer between primary and secondary loop is simulated by thermal coupling associated to the following sections:
− ANNULUS 470, 570 and 670 are thermally coupled with pipe 170 (which represents the primary side of LBE heat exchanger) for a total length of 3.2 m;
− ANNULUS 480, 580 and 680 are thermally coupled with BRANCH 132 and PIPE 135 (which represent the LBE in the separator) for a total length of 0.35 m.
As for the heat section, the 91 heat exchanger pipes have been modelled using the vertical
bundle without crossflow convection boundary type option (with p/D=1.22) and the Ushakov correlation was employed.
The gas gap presence is simulated defining helium as solid material (1.06 mm thickness) and interposing it between two thicknesses of stainless steel when creating the annular region thermal structures.
10
2. Boundary conditions
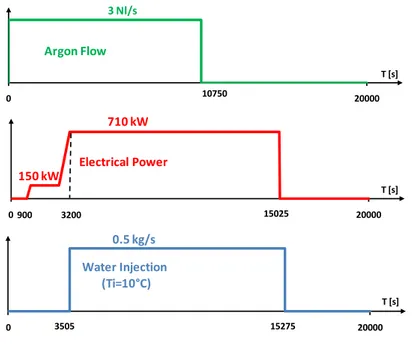
As previously mentioned, the RELAP5 simulation made in the present work refers to Test D of the DEMETRA experimental campaign. This test was aimed to assess the dynamic of CIRCE facility (with ICE test section) during an unprotected loss of flow (ULOF) scenario, focusing on the transition from forced to natural circulation in the primary loop. In Figure 4 the boundary conditions foreseen for test D are schematized. In the RELAP5 simulation the real post test data for argon flow, electrical power and water injection, have been imposed. In Table 3 the main events during the test are described with the associated RELAP5 actions.
0 20000 T [s] 3 Nl/s 10750 0 20000 T [s] 710 kW 15025 900 3200 150 kW 0 20000 T [s] 0.5 kg/s 3505 15275 Argon Flow Electrical Power Water Injection (Ti=10°C)
Figure 4. Test D boundary conditions.
Time [s] Event RELAP5 Actions Description
0 Gas flow injection system switched
on
− TDJ 4 activated injecting argon mass flow rate
900 Heat section switched on.
Pmax~710 kW reached at 3200 s
− Activation of Power Source in Pipe 60
3505 Heat exchanger starts to operate:
valves open − Valves MV 400, MV 500, MV 600 open − TDJ 801 is activated Conditioning phase: achieving the reference initial conditions
10750 Gas flow injection system switched
off − TDJ 4 argon deactivated
ULOF: Occurrence of initiating accidental event
15025 Heat section switched off − Power source deactivated
15275 Heat exchanger valves close − TDJ 801 deactivated Mitigation phase
11
As an initial condition, a uniform temperature of 566.15 K has been set for the whole system (LBE primary system, water-steam secondary system and thermal structures) with LBE being initially stagnant. The secondary side has been initialized with superheated steam at 566.15 K.
The test starts at time 0 with the beginning of gas flow injection and with the system being at zero power. The gas injection flow rate, regulated by TMDPJUN 801, follows the experimental trend (reaching an average flow rate of 3.0 Nl/s). The electrical power is turned on at 900 s and is set to the nominal value (~710 kW) with a two step procedure completed at 3200 s. Experimental data for the RELAP5 heat section power definition have been used as well. After 300 s from reaching the nominal heat source power, the feedwater system is activated by opening motor valves 400, 500 and 600, and subsequently activating the time dependent junction 801 which provides 0.5 kg/s of cold water (288 K) to the secondary system loop.
The initiating event (ULOF) is simulated, at 10750 s, by rapidly interrupting the argon injection, setting to zero the TMDPJUN 4 gas mass flow rate. During the following mitigation phase heat power is set to zero at 15025 s and water flow, provided by TMDPJUN 801, stops at 15295 s, simulating the closure of the feedwater secondary system. The simulation ends at 20000 s.
3. Obtained results
The LBE mass flow rate time trend along ICE test section, together with argon flow rate, obtained from RELAP5 simulation is reported in Figure 5 together with the experimental results. In the definition of the model, argon injection was described using the experimental data with an average flow rate of 3 Nl/s in stationary conditions. The induced LBE mass flow experimentally founded reports a value of approximately 68 kg/s in the stationary phase, while the value obtained from RELAP5 simulation is slightly lower (66 kg/s). After the argon injection shutdown the experimental LBE mass flow rate (caused by natural circulation) reduces to a value of about 25 kg/s. The corresponding RELAP5 simulations value is about 29 kg/s, that implies a slight overestimation in the natural circulation flow rate.
12 0 2000 4000 6000 8000 10000 12000 14000 16000 18000 20000 0 10 20 30 40 50 60 70 80 M a ss F low R a te [k g/ s] Time [s] LBE (Exp) LBE (RELAP) Argon (Exp) Argon (RELAP) 0 1 2 3 4 5 6 7 8 Argo n M a ss F low [ Nl/s ]
Figure 5. LBE and injected Argon mass flow rate.
At 15025 s the heat power is set immediately to zero after the closure of the heat exchanger valves. In this phase, natural circulation is no longer active, and LBE mass flow is gradually interrupted. The result from simulation shows a smoother decrease compared with experimental data.
LBE mass flow rate that passes through the separator, flowing directly into the downcomer, has been estimated from an energy balance with the available experimental data, obtaining a value of about 30% of the total. Figure 6 shows the bypass flow rate as a function of time, together with the HX and total mass flow rate. The bypass is imposed through the TMDPJUN 117 (see Figure 1): starting at 3000 s, it increases linearly up to 25 kg/s in 500 s, remains constant for 500 s and then linearly decreases in 500 s to a stationary value of 20 kg/s, which is held until the beginning of natural circulation regime (time 10750 s) when the bypass is stopped.
13 0 2000 4000 6000 8000 10000 12000 14000 16000 18000 20000 0 10 20 30 40 50 60 70 80 Mass Fl ow Rate [kg/ s] Time [s] Total (RELAP) HX (RELAP) Bypass (RELAP)
Figure 6. Total, HX and Bypass LBE mass flow rate.
LBE velocity and Reynolds number referred to heat exchanger (see Figure 7) have been obtained from RELAP5 and compared with those derived from experimental data. Those values are dependent on the heat exchanger mass flow rate trend, hence on the bypass flow. The experimental values plotted have been inferred from the experimental mass flow rate, assuming that the total LBE mass flow rate passes through the heat exchanger; that gives unreliable results for both velocity and Reynolds number when bypass phenomenon occurs. Simulated velocity during the gas assisted circulation (conditioning phase), ranges between 0.085 and 0.15 m/s, reducing to about 0.06 m/s in the following natural circulation regime and gradually going to zero in the last phase of the transient (after the natural circulation stops). During LBE circulation, Reynolds number ranges between 1.8·104 (assisted circulation) and 7·103 (natural circulation), which implies turbulent LBE flow conditions regime inside the HX. The corresponding Peclet number was estimated to be lower than 400 for the entire transient, thus in the range of validity of the Ushakov correlation.
14 0 2000 4000 6000 8000 10000 12000 14000 16000 18000 20000 0.00 0.02 0.04 0.06 0.08 0.10 0.12 0.14 0.16 Ve lo ci ty [m /s ] Time [s] Velocity HX (Exp) Velocity HX (RELAP) Reynolds HX (Exp) Reynolds HX (RELAP) 0.0 5.0x10³ 1.0x10⁴ 1.5x10⁴ 2.0x10⁴ 2.5x10⁴ 3.0x10⁴ 3.5x10⁴ 4.0x10⁴ Re yno lds
Figure 7. Heat Exchanger velocity and Reynolds number.
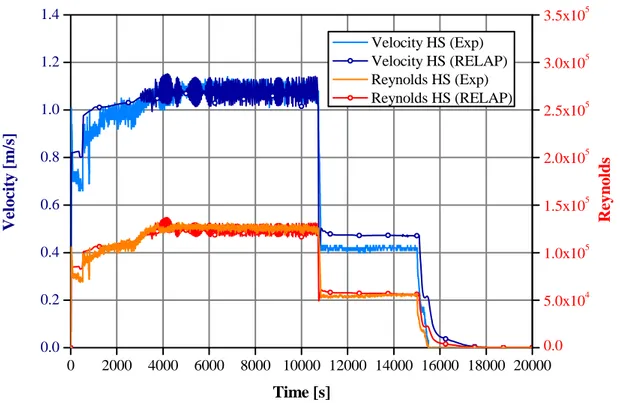
The LBE flow velocity and Reynolds number, related to the HS, have been evaluated from the simulation and compared with experimental values in Figure 8; a good agreement is observed. Experimental velocity results show a value of about 1.1 m/s in the steady state phase and, as for the mass flow rate, simulation data are slightly lower; furthermore, in the natural circulation phase, velocity magnitude reduces to about 40 % of the total, with a slight overestimation provided by calculated data. During the conditioning phase, Reynolds number value for the heat section, has an order of magnitude of 1.3·105, which reduces to about 5·104 in the following natural circulation phase (in both cases the LBE flow is turbulent). The corresponding Peclet number ranges between 2500 and 900 that allows once again the use of Ushakov correlation.
15 0 2000 4000 6000 8000 10000 12000 14000 16000 18000 20000 0.0 0.2 0.4 0.6 0.8 1.0 1.2 1.4 V el o c ity [m/ s] Time [s] Velocity HS (Exp) Velocity HS (RELAP) Reynolds HS (Exp) Reynolds HS (RELAP) 0.0 5.0x10⁴ 1.0x10⁵ 1.5x10⁵ 2.0x10⁵ 2.5x10⁵ 3.0x10⁵ 3.5x10⁵ Re yno lds
Figure 8. Heat Section velocity and Reynolds number.
Moreover, the calculated LBE velocity related with the downcomer region has been compared to the HS and HX velocities (see Figure 9).
Upper zone (surrounding the HX, PIPE 320) and lower downcomer section (from the HX outlet, BRANCH 180 to vessel bottom, PIPE 290) have been considered and the associated maximum velocity mean value results 3.2 mm/s and 6.2 mm/s for the conditioning phase (in presence of bypass phenomenon). In these conditions the time for LBE to cross the upper and lower downcomer is 1000 s and 700 s, respectively. In the natural circulation phase, the velocity is 2.7 mm/s for the “lower” downcomer and reduces the order of magnitude by two (7·10-2 mm/s) for the “upper” downcomer. For the latter zone, LBE can be assumed stagnant in this phase and in the one before the bypass (from 0 to 3000 s).
16 0 2000 4000 6000 8000 10000 12000 14000 16000 18000 20000 10-6 10-5 10-4 10-3 10-2 10-1 100 V elo cit y [ m /s] Time [s] HS HX DC (down) DC (up)
Figure 9. Downcomer velocities magnitude obtained using RELAP5.
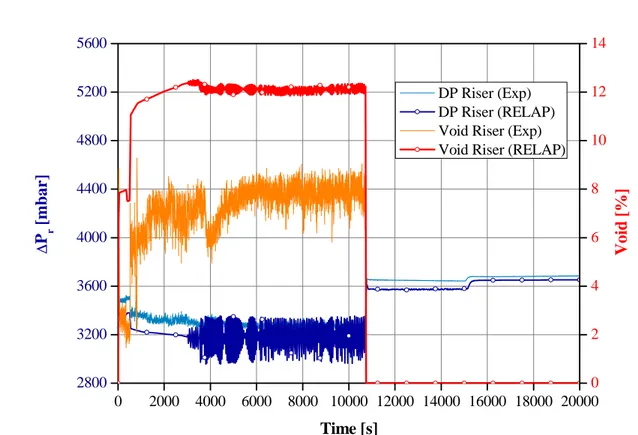
Figure 10 shows the riser pressure difference ∆Pr (dynamic head) and the corresponding mean riser void fraction (caused by gas injection) compared with experimental data. In the forced circulation phase, the experimental riser pressure difference has a value of about 3300 mbar, while the simulated results (with wide oscillation) presents a mean value of 3200 mbar. In the next natural circulation phase the experimental value reaches 3650 mbar, increasing to 3670 when natural circulation stops. The simulated values are slightly lower during those phases. The “experimental” void fraction value, obtained by an indirect derivation, is less than 8 % while the simulated value gives a value around 12 %.
17 0 2000 4000 6000 8000 10000 12000 14000 16000 18000 20000 2800 3200 3600 4000 4400 4800 5200 5600 ∆ P r [mbar ] Time [s] DP Riser (Exp) DP Riser (RELAP) Void Riser (Exp) Void Riser (RELAP)
0 2 4 6 8 10 12 14 Voi d [% ]
Figure 10. Pressure difference along the riser and average void fraction into the riser.
The driving force available for the test has been evaluated as follows:
DF r
P ρ g H
∆ = ∆ ⋅ ⋅ (3)
where Hr is the riser height, and:
,
LBE r TP
ρ ρ ρ
∆ = − (4)
The two phase flow mean density inside the riser, ρr TP, is evaluated from the void fraction α ; let be α the average void fraction along the riser:
, (1 ) r TP g LBE ρ = ⋅α ρ + −α ρ⋅ (5) and so: ( LBE g) LBE ρ α ρ ρ α ρ ∆ = ⋅ − ≅ ⋅ (6)
Using Eq. (6), the e Eq. (3) can be simplified as:
DF LBE r
P α ρ g H
∆ = ⋅ ⋅ ⋅ (7)
To calculate the driving force, the previous estimated value of mean void fraction was used, assuming Hr=3.7 m. The obtained results, showed in Figure 11, gives a value around
18
300 mbar and 450 mbar for experimental and RELAP5 derivation, respectively. The discrepancy is due to different values of mean void fraction previously discussed.
0 2000 4000 6000 8000 10000 12000 14000 16000 18000 20000 0 50 100 150 200 250 300 350 400 450 500 550 600 ∆ P DF [mbar ] Time [s] DF (Exp) DF (RELAP)
Figure 11. Available driving force for LBE circulation along ICE flow path.
The LBE temperature difference for the heat section (∆THS) and heat exchanger (∆THX) has been evaluated and compared with experimental data (see Figure 12). The simulated results for both the heat section and heat exchanger, present an adequate agreement during the conditioning phase: from test initiation until the loss of flow injection (t = 10750 s). Afterward, during the natural circulation phase, the simulation does not reproduce appropriately the experimental trend. Immediately after gas injection stops, experimental
∆THS increases to a value of 200 K and remains almost constant until heat source deactivation
(t = 15025 s), when it reduces to zero. Simulation results, after gas injection deactivation, show a sudden ∆THS increase up to 160 K, that remains almost constant until deactivation of the heat source, when temperature difference rapidly reduces to zero as for the experimental case.
19 0 2000 4000 6000 8000 10000 12000 14000 16000 18000 20000 0 50 100 150 200 250 300 Tem p era tu re d if feren ce [ K ] Time [s] ∆T HS (Exp) ∆T HS (RELAP) ∆T HX (Exp) ∆T HX (RELAP)
Figure 12. Temperature difference through the inlet and outlet of the Heat Section and Heat Exchanger.
For heat exchanger, it can be seen that, after gas injection deactivation, the experimental ∆THX goes promptly from 100 to 150 K. From this value a slight increase of about 10 K is experimentally observed for the whole natural circulation phase transient (from 10750 to 15025 s). Then a smoothly decreasing trend, after the deactivation of heat section and heat exchanger, follows. In fact, in this phase the liquid metal becomes stagnant (as the natural driving force is no more available) and, consequently, the LBE temperature inside the HX gradually homogenizes (tanks to axial conduction and radial conduction with external downcomer). RELAP5 results during natural circulation phase are characterized by an higher value of ∆THX (~160 K) compared with experiment. Then, it remains almost constant (overlapping the calculated ∆THS curve) during the “natural” transient. Afterwards the curve reaches zero with a trend very close to the experimental one. Discrepancies with experimental data, for both ∆THS and ∆THX, are related to the mass flow rate overestimation obtained by the code during the natural circulation phase.
Trend of HS inlet and outlet temperatures simulated with the use of RELAP5 is depicted in Figure 13 and compared with experimental data. Three experimental outlet temperature have been considered, corresponding to thermocouples TE004, TE005 and TE006, placed at different radial distances, to monitor the HS outlet temperature. The model simulates with
20
good agreement the conditioning phase, from zero to the activation of heat exchanger (3500 s). Afterwards, up to 10750 s, a slight increase (~ 10 K) of the HS inlet and outlet temperature is observed compared with experimental data. After gas flow deactivation, the following discrepancies are observed: immediately after the initiating event, the calculated outlet temperature jumps to a value of about 750 K and then slowly decreases, in contrast to the experimental data which shows an increased trend (inlet temperature shows the same reaction as the outlet temperature). After that, the inlet and outlet temperature equalize in the mitigation phase to a value of about 570 K (20 K less than experimental data).
0 2000 4000 6000 8000 10000 12000 14000 16000 18000 20000 450 500 550 600 650 700 750 800 850 Tempera ture [ K ] Time [s] HS In (Exp -TE001) HS In (RELAP) HS Out (Exp-TE004) HS Out (Exp-TE005) HS Out (Exp-TE006) HS Out (RELAP)
Figure 13. Heat Section inlet and outlet temperatures.
The HX inlet and outlet temperatures calculated by RELAP5 are shown in Figure 14 and compared with experimental data. As for the HS, agreement is observed during the conditioning phase although higher values (about 20 K) of both inlet and outlet temperatures at stationary conditions are observed. After the occurrence of the initiating event, simulated HX outlet temperature shows an increase to 715 K; a decreasing trend, both for inlet and outlet temperatures, (similar to the HS trend), follows. Then after the power source and HX deactivation (end of natural circulation), a smooth decrease of the HX inlet temperature is observed to gradually reach the outlet temperature (presumably at a value of 575 K). On the contrary, experimental trend shows a gradual increase of both inlet and outlet temperatures
21
after the gas flow shutdown; in the mitigation phase the two temperatures approach an equilibrium value of about 600 K, while for simulated results a 575 K equilibrium temperature is observed. 0 2000 4000 6000 8000 10000 12000 14000 16000 18000 20000 450 500 550 600 650 700 750 800 850 Te mp er a tu re [ K ] Time [s] HX In (Exp) HX In (RELAP) HX Out(Exp) HX Out (RELAP)
Figure 14. Heat Exchanger inlet and outlet temperatures.
As previously discussed, the discrepancies observed in the described temperature profile could be caused by temperature stratification along the downcomer, mainly after the argon shutdown. In fact after the ULOF event, the mass flow rate reduces and separator bypass does not occur anymore, causing the LBE surrounding the HX (PIPE 320) to became stagnant. When natural circulation mass flow rate reduces to zero (from 15300 s up to the end of the test) all the LBE inside the facility became stagnant. As RELAP5 does not manage axial conduction the model could introduce errors in stagnant LBE zones caused by non realistic thermal axial gradient. Furthermore, the convective heat coefficient computed using the Seban equation (3) may have some applicability limitation when used for stagnant fluid conditions. Power balance using the relation Q& = ⋅ ⋅ ∆m c& p T, applied to heat section and to heat exchanger has been computed. Results, compared with experimental data in Figure 15, show that the experimental results are adequately reproduced by the code with a maximum HS power around 700 kW). It must be noted that the outlet HS temperature has been computed as the arithmetic mean of the three radial thermocouples located at the HS outlet section.
22
Experimental power associated to HX shows an extremely elevated value (higher that the power supplied by HS) as it has been calculated assuming that the entire LBE mass flow rate passes through the heat exchanger, which is not true considering that a certain amount overpasses the separator barrier.
Observing the time when the HX power curve exceeds the HS power has provided a rough estimation of the beginning of bypass (around 3000 s) simulated in RELAP model. During next natural circulation phase the entire mass flow rate passes through the HX, as the overflow phenomenon does not occur anymore, and the plotted experimental power gives a realistic value. 0 2000 4000 6000 8000 10000 12000 14000 16000 18000 20000 0 200 400 600 800 1000 1200 1400 1600 1800 2000 Po w er [ k W ] Time [s] HS (Exp) HS (RELAP) HX (Exp) HX (RELAP)
Figure 15. Thermal power along the heat source and the heat exchanger.
Concerning the HX power obtained from RELAP5, it has been computed using the estimated LBE mass flow rate fraction showed in Figure 6. The calculated curve overlaps the experimental curve during the first 3000 s (see Figure 15), reaching a steady state value of about 630 kW during the remaining conditioning phase. During the next ULOF transient this value increases to 700 kW showing a discrepancy of about 100 kW with the experimental value (~600 kW). Again the discrepancy can be attributed to overestimation of LBE mass flow rate and to the absence of axial conduction in RELAP5 for the stagnant LBE in the surrounding downcomer together with a non applicability of the Seban correlation, which alters the real phenomenology.
23 0 2000 4000 6000 8000 10000 12000 14000 16000 18000 20000 0 10 20 30 40 50 60 70 80 HX Heat Fl ux [kW/ m 2 ] Time [s] HS Pins HX (Up) HX (Middle) HX (Bottom) 0 100 200 300 400 500 600 700 800 HS He at F lux [kW /m 2 ]
Figure 16. Thermal flux associated to heat section and heat exchanger.
The mean heat flux associated with the HS, the HX tubes and the HX shell have been requested from RELAP5 output data and plotted in Figure 16. The maximum heat flux for heating rods is about 750 kW/m2 (right scale). Concerning the HX, mean flux (left scale) it has been calculated for upper, middle and bottom section (~1 m length each) of the tubes HX bundle. Results show that heat flux highest value is associated to middle section bayonet tube: 32 kW/m2 for assisted circulation and ~ 40 kW/m2 in natural circulation. The middle section is characterized by a flux of 28 kW/m2 in assisted circulation and 31 kW/m2 in natural circulation. The less effective upper section gives a flux of approximately 23 kW/m2 in both assisted and natural circulation.
In Figure 17 the convective heat transfer coefficient, HTC, calculated by the Ushakov correlation, is plotted for heat section and heat exchanger tubes (LBE side). For heat section bundle, HTC reaches a value of 18 kW/m2K during the assisted circulation phase and 14 kW/(m2K) during the natural circulation phase. For the HX bundle HTC is almost constant to a value of 1.6 kW/(m2K) for assisted circulation phase, showing a slight decrease for natural circulation phase (1.35 kW/(m2K)). The HTC value after 15300 s (no LBE circulating), estimating the heat transfer coefficient for stagnant liquid metal conditions, gives a value of 8.7 kW/(m2K) and 0.7 kW/(m2K) for HS and HX, respectively.
24 0 2000 4000 6000 8000 10000 12000 14000 16000 18000 20000 0 2 4 6 8 10 12 14 16 18 20 22 24 HT C [kW /(m 2 K) ] Time [s] Fuel Pins HX Tubes
Figure 17. Convective heat transfer calculated by RELAP5, for heat section and heat exchanger.
0 2000 4000 6000 8000 10000 12000 14000 16000 18000 20000 0.0 0.1 0.2 0.3 0.4 0.5 0.6 0.7 0.8 0.9 1.0 Mass Fl o w Rate [kg /s] Time [s] Total (Exp) Total (RELAP) 30 Tubes (RELAP) 54 Tubes (RELAP) 7 Tubes (RELAP)
25
Figure 18 plots the RELAP5 total secondary mass flow rate (imposed by TMDPJUN 801 to a value of 0.5 kg/s) compared with experimental data and its repartition through the, 30, 54 and 7, sector tubes. 0 2000 4000 6000 8000 10000 12000 14000 16000 18000 20000 0 20 40 60 80 100 Liq u id V o id Fra ct io n [ %] Time [s] Steam Plenum
Figure19. Liquid void fraction inside the steam plenum.
The liquid void fraction in the Steam plenum volume (BRANCH 700) has been requested to RELAP5. Figure 19 shows a value around 20 % fraction of liquid during the HX water flowing phase, due to the condensation of water-steam mixture caused by the descending cold water penetration crossing the steam plenum.
26
4. Conclusions
The RELAP5 code adequately reproduces the total LBE mass flow rate during the forced circulation phase, while an overestimation of the simulated value is observed during the natural circulation phase; consequently the simulated heat section velocity trend shows analogous behaviour. Concerning riser mean void fraction obtained from RELAP5, a value of about 12 % is found, resulting higher than the experimental value of 8 % (obtained through an empirical method); hence from the comparison of the numerical and experimental driving force, a proportional discrepancy is found: 450 mbar and 280 mbar for RELAP5 and experimental data, respectively.
LBE bypass phenomenon crossing the separator barrier was simulated introducing a time dependent junction that forced a fraction of the mass flow rate, exceeding the separator level, directly into the downcomer. This quantity (20 kg/s) was estimated from experimental data power unbalance associated to HS and HX. Introducing the LBE bypass, the code reproduces suitably the HS and HX temperature profile in the assisted circulation phase, while some discrepancies are observed during the following ULOF transient. The same considerations are valid for the power balance.
The main discrepancies observed with experimental data may be imputed to RELAP5 inability to take into account the phenomenon of axial conduction. This phenomenon appears to be relevant in a vertical pool facility such CIRCE, where a huge amount of the total LBE (mainly within the downcomer zone) is in stagnant or very low velocity conditions (some mm/s). Furthermore, a possible inappropriate use of the heat coefficient correlations in LBE stagnant conditions may be an additional source of error. Therefore, an improved model able to overcome these code limitations must be used in future work in order to more accurately reproduce experimental thermal behaviour during the transient phase.
27
References
[1] G. Bandini, I. Di Piazza, P. Gaggini, A. Del Nevo, M. Tarantino, “CIRCE
experimental set-up design and test matrix definition”, ENEA UTIS-TIC Technical
Report, IT-F-S-001, 28/02/2011.
[2] M. Tarantino, G. Scaddozzo, Report ENEA ET-F-S-001, “Test specifications of the
Integral Circulation Experiments” Deliverable D. 4.15, DM4 DEMETRA,
IP-EUROTRANS, 2006.
[3] RELAP5/MOD3.3 Code Manual, “NUREG/CR-5535-Vol.I-VIII”, January 2002. [4] R. A. Seban and T. T. SHIMAZAKI, “Heat Transfer to a Fluid Flowing Turbulently
in a Smooth Pipe with Walls at Constant Temperature” Trans. ASME, Vol. 73, pp.
803-809 (1951)
[5] P.A. Ushakov, A. V. Zhukov, N. M. Matyukhin, “Heat transfer to liquid metals in