Candidato: Relatore:
Kevin Autelitano Prof. Ing. Enrico De Angelis
Matricola: Correlatori:
920780 Prof. Ing. Lorenzo Mario Fagiano
Prof. Ing. Marco Scaioni Dott. Michele Bolognini
School of Architecture Urban Planning Construction Engineering
MSc Building and Architectural Engineering
Accademic Year: 2020/2021
APPLICATION OF DRONE-MOUNTED VIDEO AND THERMAL
CAMERAS FOR BUILDING DIGITALIZATION AND DIAGNOSTICS
realized with very high energy performances; moreover, plans and incentives for a deep energy retrofit of the built assets have been set, to enable local and national communities reaching the energy efficiency and GHG emission reduction targets and, as additional benefits, to enhance their health (pollution reduction) and their energy security, and to minimize life cycle costs and environmental impact in general.
In both cases, despite we live in a world where it is possible to find a great multitude of data, there is a huge need for low-cost and reliable control methodologies and tools: to understand retrofit needs, to validate design choices and to test construction results, for an effective basic and condition-based maintenance and for a continuous commissioning of operating buildings. With these aims, in the last years, the use of Unmanned Aerial Vehicles (UAV) equipped with infrared cameras has been implemented, but the use of these tools among practitioners is still at a very qualitative level.
Starting from a literature review about this topic, the thesis presents a methodology to support the following steps: (1) the flight inspection planning; (2) the RGB and infrared pictures data gathering and post processing; (3) the analysis of the data to estimate the impact of thermal bridges and the heat flux correction; (4) the analysis of the data to estimate the conduction heat loss coefficient of a building and its uncertainty; (5) the identification of maintenance needs and building pathologies.
This thesis is based on a case study developed on a building in Italy (Spino d’Adda), hosting offices, a little data centre and telecommunication devices with no-fly zones. A commercial quadcopter equipped with a standard RGB camera has been used, to collect a first set of trial pictures.
Their results have been used to set a flight planning methodology, based on Ground Sampling Distance (GSD), topographical limitations, technical characteristics of the cameras and the detailing needs of the building.
Then, the model of the building is reconstructed through Structure from Motion technique using Agisoft Metashape. A sparse point cloud representing the building is realized calibrating all the images previously collected and, with an operation of feature detection using Scale-Invariant Feature Transform algorithm (SIFT), the interesting points are found and matched solving triangulation of homologous points problem. A 3D dense reconstruction of the building is then performed.
Colour information from thermal images, which are representing the temperature captured by the thermal camera implemented on the drone, are integrated on the model by the using known points identified as baseline.
A set of points with a known position is manually identified both in a set of RGB images and in thermal ones. The distance between them is measured so that the thermal images are scaled precisely and projected on the points composing the building.
In the end, the matrix of colour is converted into matrix of temperature and compared to a model of ideal temperature which is realized by making considerations about the package for opaque and transparent components of the envelope, air temperature registered during the phase of picture collection and internal temperature set inside the building.
This step provides a starting point for implementing an automated procedure that is able to identify from thermal anomalies a possible failure in a building envelope component and making some considerations about its possible repairing or substitution.
e realizzate con prestazioni energetiche molto elevate. Per un profondo risanamento energetico del patrimonio costruito, nonché permettere alle comunità locali e nazionali di raggiungere gli obiettivi di efficienza energetica, sono stati stabiliti piani di riduzione delle emissioni di gas serra al fine di migliorare la salute dei cittadini (riduzione dell'inquinamento) e la loro sicurezza energetica, nonché per minimizzare i costi del ciclo di vita e l'impatto ambientale in generale.
In entrambi i casi, c'è un enorme bisogno di metodologie e strumenti di controllo affidabili e a basso costo per capire le esigenze di retrofit, convalidare le scelte progettuali e testare i risultati di costruzione, per un'efficace manutenzione di base e basata sulle condizioni e per un continuo commissioning degli edifici operativi. Con questi obiettivi, negli ultimi anni, è stato implementato l'uso di Unmanned Aerial Vehicles (UAV) dotati di telecamere a infrarossi, ma l'uso di questi strumenti tra i professionisti è ancora a un livello molto qualitativo.
Partendo da una revisione della letteratura su questo argomento, la tesi presenta una metodologia per supportare le seguenti fasi: (1) la pianificazione dell'ispezione del volo; (2) la raccolta dei dati delle immagini RGB e infrarosse e il post processing; (3) l'analisi dei dati per stimare l'impatto dei ponti termici e la correzione del flusso di calore; (4) l'analisi dei dati per stimare il coefficiente di perdita di calore per conduzione di un edificio; (5) l'identificazione delle necessità di manutenzione e delle patologie dell'edificio.
Questa tesi si basa su un caso di studio sviluppato su un edificio in Italia (Spino d'Adda), che ospita uffici, un piccolo data center e dispositivi di telecomunicazione e no-fly zones. È stato utilizzato un drone commerciale dotato di una telecamera RGB standard, per raccogliere una prima serie di immagini di prova.
I loro risultati sono stati utilizzati per impostare una metodologia di pianificazione del volo, basata sulla distanza di campionamento a terra (GSD), i limiti topografici, le caratteristiche tecniche delle telecamere e le esigenze di dettaglio dell'edificio.
Poi, il modello dell'edificio viene ricostruito attraverso la tecnica Structure from Motion utilizzando Agisoft Metashape. Una nuvola di punti sparsa che rappresenta l'edificio viene realizzata calibrando tutte le immagini precedentemente raccolte e, con un'operazione di feature detection per mezzo dell'algoritmo Scale-Invariant Feature Transform (SIFT), i punti interessanti vengono trovati e abbinati risolvendo il problema della triangolazione dei punti omologhi. Viene quindi eseguita una ricostruzione 3D densa dell'edificio. Le informazioni di colore dalle immagini termiche, che rappresentano la temperatura catturata dalla telecamera termica implementata sul drone, sono integrate sul modello utilizzando punti noti identificati come linea di base.
l'edificio.
Il risultato è un modello di nuvola di punti 3D composto da una matrice che identifica, per ogni punto, un'informazione sulla sua posizione nello spazio e un colore sotto i parametri RGB provenienti dalla telecamera termica.
Alla fine, la matrice di colore viene convertita in matrice di temperatura e confrontata con un modello di temperatura ideale che viene realizzato facendo considerazioni sul pacchetto per i componenti opachi e trasparenti dell'involucro, la temperatura dell'aria registrata durante la fase di raccolta delle immagini e la temperatura interna impostata all'interno dell'edificio.
Questa fase fornisce un punto di partenza per l'implementazione di una procedura automatizzata che sia in grado di identificare dalle anomalie termiche un possibile guasto in un componente dell'involucro dell'edificio e fare alcune considerazioni sulla sua eventuale riparazione o sostituzione.
2- Work and case study presentation 6
2.1 - Main topic: PhD Thesis and MSc thesis contribution 6
2.2 - Case study: complex in Spino d’Adda (Italy) 9
3- Review about the drones used 11
3.1 - Review about drones: characteristics present on the market 11
3.2 - Case study: drone used for the test 15
4- Stage 1: flight path planning 17
4.1 - Literature review on flight path 17
4.2 - Case study: flight path planning description 20
5 - Stage 2: 3D model reconstruction 24
5.1 - State of the art 24
5.2 - Structure from Motion: how it works and examples 25
5.3 - SIFT 38
5.4 – Thermography and its integration into a 3D environment 44
5.5 - Case study: Structure from Motion application using Agisoft Metashape 49
6- Stage 3: Façade modelling 60
6.1 - Literature review: k-means 60
6.2 - K-Means: application and discussion 64
6.3 - Literature review: MSAC 72
6.4 - Case study: MSAC and its application on Matlab 74
7 - Stage 4: data analysis 80
7.1 - Goal and strategy 80
7.2 - Reconstruction of the external temperature from analysis 81
7.3 - Reconstruction of the external surface temperature of control 84
7.4 - Analysis of the result 94
8-Future update: real-time model and process automation 106
8.1 - Implementation of SLAM for 3D reconstruction 106
8.2 - Real-time model generation for time scheduling reduction 112
Bibliography 115
1
1 - Introduction
For satisfying its needs, mankind spontaneously tends to grow up by looking at many aspects: from a theoretical point of view to a technological one. Since its knowledge and its experience is increasing, the world around becomes more and more complex, while its requirements are becoming more ambitious and specific.
This natural tendency took the history of the industrial field to be divided into three periods.
The First Industrial Revolution, around the ‘700, introduced the concept of mechanical industry, while discoveries and inventions occurred during the Second Industrial Revolution (1870) showed in the period of mass consumes and modern factories. In the second half of the last century, the Cold War, with the competition between USA and URSS, was one of the causes of the Third Industrial Revolution. In this period, computer and automation industry were developed.
Nowadays we are looking at the development of what it was named “Industry 4.0” or “Fourth Industrial Revolution” in order to identify an era mainly trained by two concepts: Data Management, sharing and interconnection of information, and Cybernetic Industry, that is developing the previous concept of automation in order to produce everyday more modern, artificially intelligent and complex cybernetic devices.
Figure 1- Industrial Revolutions in the history (Source: https://www.allaboutlean.com/industry-4-0) Main topic of industry 4.0
Interconnection Collaborative, interconnected and programmable rovers Addictive manufacture 3D printers connected with updating software
Augmented reality Support to the production
Simulation Simulation between interconnected machines Internet of the things Connection between products and processes Cloud computing Management information on opened systems Cyber Security Analysis and protection during the phases Big data and analysis Data analysis for product optimization Table 1- Main topic of Industry 4.0 (Source: http://www.ingfrancescopavan.it/industria-4.0.html)
2 Consequently, robotics and artificial intelligence are used to substitute man’s effort working in more precise and safer conditions.
This methodology is affecting several industrial and commercial fields, with military and space exploring fields as pioneers. From an historical point of view, one of the first UAV (Unmanned Aerial Vehicle) consisted of a group of air balloon full of explosive and without pilot used by Austrians to defeat Venice during the battle of 22nd august 1849. Moreover, there are some reported cases in which the use of prototyped drones for inspection purposes were used in France at the end of the ‘700. (Robison, 2017).
Since this date, moved by historical reasons, the use of robotics in military industry has been growing and today national armies have many complex technologies available. Some examples could be tEODor, a remote-controlled rover used for defusing potential explosive devices providing also preliminary analysis of that, and MQ-9A Predator B, a UAV used for reconnaissance, surveillance and target acquisition operations.
Automation and cybernetic programs have also monopolized the space exploration field. Since the second half of last century, most of the missions were realized only by autonomous devices which were able to transfer data to a remote central directly placed on Earth or perform simple maintenance operations on space stations.
At the end of the century, researchers focused their efforts in implementing automation and its benefits also to civil field, creating a new business.
Different sectors have implemented the use of autonomous devices in their processes, like the automotive industry, and improved their business in terms of economic and technological growth.
Since many factors act in a work process influenced by a general concept of digitalization, the automation of different sectors is influenced by this phenomenon.
The gradual development and introduction of autonomous devices for civil operations has been studied also considering economic aspects, looking at their potential benefits for creating a new business. As a support, it is provided the chart below that shows the productivity growth trend of the most important economic areas related by the percentage of digitalized and automated work processes.
3 Figure 2 - Chart about productivity growth and digitalization index (Source: Building Process and Information Management by Prof. Francesco Pavan)
It is possible to notice that areas with higher percentage of digitalization index provided, during the period between 2005-2014, an increasing in their business. On the contrary, sectors like construction, that are represented by 6% of digitalization index only, have been invested by a reduction in terms of productivity growth. However, the economic crisis of 2008 did not help the situation.
If the situation looks dramatic, it is understandable how investing in digitalization, and so construction automation, could be interesting from a technological and economic point of view because of the unsaturated market.
Recently, the use of UAV (Unmanned Autonomous Vehicle) is becoming more and more frequent for operations that require the inspection of a civil construction or an infrastructure for the advantages that this technology can give.
A vehicle with a camera, RGB or infrared, and remotely-controlled by a licenced operator, can monitor the state of a civil construction, focusing the attention on potential defects without risks and using only non-destructive procedures.
Those kinds of operations are normally executed manually by a technician and all the considerations are obtained based on visual inspections, that considers the presence of a potential problem in a building after the failure has already occurred. A slow and risky operation could be the consequence of an increasing in maintenance costs.
In the following info-graphic it is shown how monitoring operations using drones are performed.
4 Figure 3 - Main steps for drone-based monitoring (Source: Weichenhain, Uwe in https://www.rolandberger.com/it/Insights/Publications/Drones-The-future-of-asset-inspection.html)
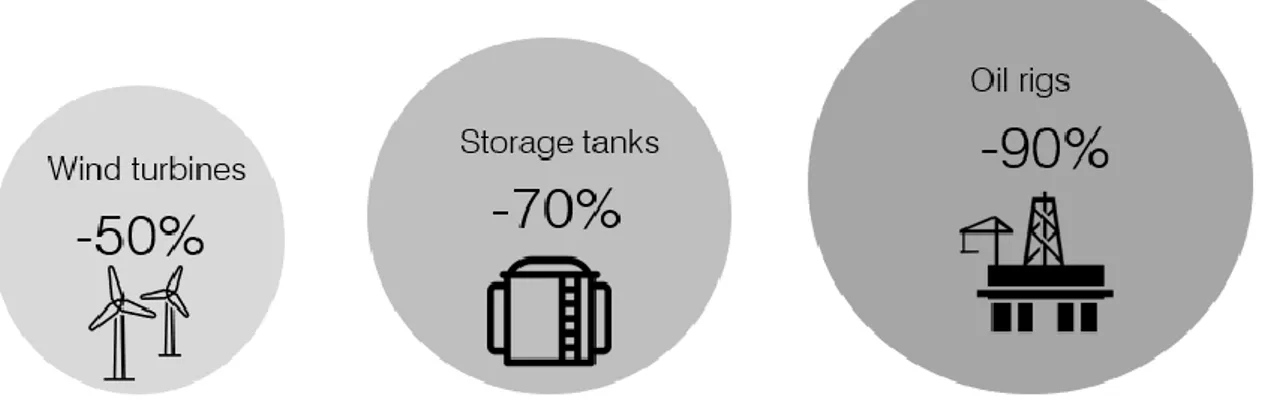
In a paper published by Roland Berger, Weichenhain presents the drone technology as the potential new standard in asset inspections, providing the results obtained in the oil and gas platform industry, where times required for inspection operations were reduced from 8 weeks to 5 days in average (Weichenhain, 2019).
In addition, since the use of drones was introduced recently, it is declared that it is not possible to estimate precisely how the decreasing in maintenance costs is, but the first projections are optimistic.
In fact, an estimated cost saving using drone-based assets was predicted in a range between 50% and 90% and the monitoring is going to be extended to other sectors, as it is shown in the chart below.
As it was said before, the growing trend is confirmed without the same velocity of other sectors, also for the construction sector (Weichenhain, 2019).
Figure 4- Economic savings in maintenance using drone-based monitoring
In conclusion, if only the construction sector is considered, it is important to notice where efforts to introduce automation inside construction places has been done.
5 Starting from the second half of 80s, especially in Japan, due to demographic factors, and the USA, where it was increasingly necessary to provide safer conditions to workers, robot was introduced. The development continued along the following decades.
According to a report provided by CNR in 2016, in Italy construction automation showed poor growth due to the setting of the economy mainly composed by Small to Medium-sized Enterprises with a low capitalization, low capability of investment and a natural tendency of surviving without risks.
The presence of a huge historical building heritage and the starting costs required by robotics are another cause of the contained growth of automation construction, mainly limited to supporting and monitoring operations (Canapini, Malaguti, & Ricchetti, 2010).
6
2- Work and case study presentation
2.1 - Main topic: PhD Thesis and MSc thesis contribution
The Thesis that is going to be presented is part of a main PhD research which is under development by DEIB and DABC of Politecnico di Milano and it is focused on the application of autonomous drone technology for building inspection.
As mentioned before, since a human inspection is considered risky, time consuming and expensive, the research aims to lay the groundwork for designing in future a fully autonomous hybrid multi-copter network which is able to map an area and planning periodic inspection of a building by acquiring and reading multi-spectral data from a variety of sensors such as Lidar and thermal sensors.
In order to reach the goal, the challenge to involve is realizing a robust system which is able to control simultaneously different actors taking into account a complex planning of flight path due to physical constraints.
The PhD Thesis is involved on exploring the field of tethered drones, which is actually, from a research point of view, a topic under open discussion.
The use of cable-connected drones would solve the problem of the autonomy of the system, performing even time-consuming inspections. On the other hand, automatically guiding the system through the space to a specific position avoiding obstacles is a challenging task.
Figure 5 - Cable connected drones and their movement (Source: Bolognini, Michele - PhD Thesis)
A further development of the topic is related to the optimization of the process in terms of time.
Even if working with cable-connected drones avoids the limitation caused by the autonomy of the battery, the less is the time required by the mission the low is the possibility of failure and reach out problems.
7 For this, working with the approach of the Travelling Salesman Problem on a sample-space composed by 6 potential obstacles zones, a test has been performed. The solution shows that the approach adopted is independent of the number of zones.
In addition, a test about 9000 points comparing the application of a simple TSP approach with a hierarchical one was tested. Considering an optimal flight time of 15’06’’ for the first and 15’36’’ for the second approach, the application of a hierarchical TSP for the guide of the drones guarantees a total coverage of the selected points in 6.29 minutes, resulting a rising and interesting solution for movement topics.
Figure 6 - Optimized movement through TSP approach (Source: Bolognini, Michele – PhD Thesis)
The second part of the PhD thesis is focused on the application on civil constructions in terms of surface defects detection.
8 To tackle the issue, a proper fusion of RGB and thermal sensors data is studied and developed.
This MSc Thesis aims to be a support on this last aspect, developing the conditions for the part concerning the reconstruction of the building in an IT environment and let the drone be able to read autonomously the results obtained.
The entire work has been divided into 4 main stages. Within the Stage 1, an analysis of flight paths optimization for collecting best data is performed considering the intrinsic characteristics of the UAV and the camera installed.
In Stage 2 the basis for the 3D reconstruction is studied analysing two of the main image-based computer vision techniques and applying the one that was considered the most adaptive for the purpose (structure from motion).
Some additional considerations about all the threads involved in the algorithm are also presented.
The stage is concluded applying an integrative technique able to adapt thermal sensors information in the proper part of the building by scaling them using some known points as baseline.
The result is a point cloud composed by those groups of information:
- Location (3 components that identifies the position of the point in the space); - RGB-colour (3 components that represent the RGB parameters of the measured
colour);
- colour (3 components in RGB parameters that represent the colour from IR-sensors properly scaled).
Within stage 3, the point cloud, through M-Estimator Sample Consensus, is divided for modelling the facades composing the building. The identification of vertical and horizontal façade, in particular between opaque and transparent parts, is necessary for writing a proper thermal balance based on the characteristics adapted for that part. This thread is propaedeutic to the last one: in fact, IR-colour information is collected in 10x10 cm areas and converted into a value of temperature.
At the end, localized variations of different areas are studied through proper algorithms. Values measured are compared with the ones calculated considering a heat balance problem solved at the same climatic and geometrical conditions, so as the variation between the two samples can be only caused by failures into the stratigraphy of the envelope.
9 It is important to mention that the main goal of this Thesis is to look at a multidisciplinary approach and try to implement concepts and applications of the energy modelling field into a different sector.
Figure 7- MSc contributions
2.2 - Case study: complex in Spino d’Adda (Italy)
In order to apply and verify all the threads involved, a complex based in Spino d’Adda was selected as case study.
The area, located outside the town, on the main street that connects Spino d’Adda and Rivolta d’Adda, is about 3000 mq and it is used mainly as office by the telecommunication department of Politecnico di Milano for research purposes.
The entire complex is composed by 4 buildings, which are used by the users in a non-continuous way.
The main one, called Block A, characterized by a squared plant of 8.5 m and three floors, is connected to Block B by a covered passage, characterized by regular plant and only one floor.
Both parts are composed by a system of reinforced concrete columns and beams, while slabs, included the roofs, are realized with traditional techniques.
Considering Block A, a system of 100x140 openable aluminium windows on every façade is installed. Image acquisition by drone RGB and thermal sensors data 3D point cloud reconstruction Integration of data from thermal sensors
Matrix n-by-4 Façade modelling (MSAC)
10 In the area two more buildings are present: Block C and Block D. Due to their low dimensions compared to Block A and their destination of use, it was decided not to consider them in the tests.
So, only Block A and B are considered in the reconstruction of the model as interesting parts, while the others are just mentioned and taken into account as obstruction for the flight planning phase.
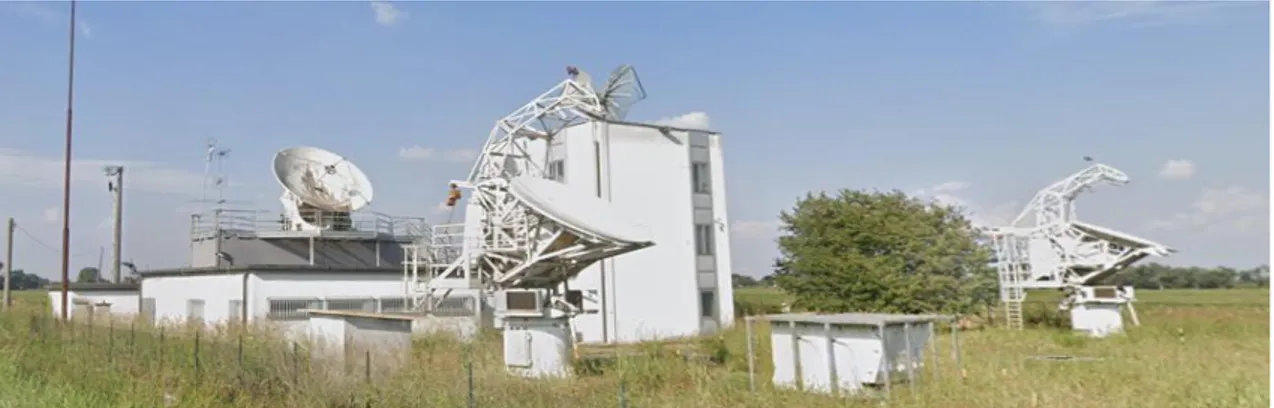
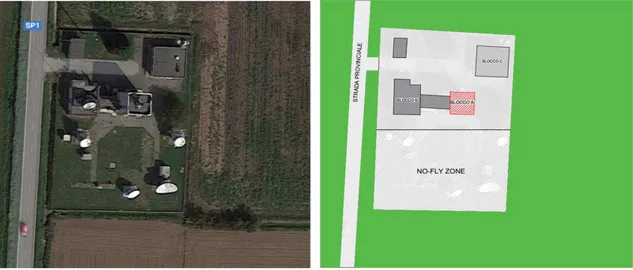
It is also important to take into account the presence of 6 antennas, 5 on ground and 1 on the top of Block A actually turned off, which are property of ASI (Agenzia Spaziale Italiana) that are constantly acquiring and registering data for research purposes. The presence of these devices influenced fly path decisions: in fact, in order not to disturb their work, they had to be treated not only as simple obstacles during flight path planning. For this aspect, a no-fly zone had been arranged in advance.
In general, the site has been chosen between all the buildings assigned to Politecnico di Milano because there is a higher possibility of flying respecting the restrictions of the national code delivered by ENAC and the absence of frequented public spaces that could have been probable obstacles.
Despite of the obstacles given by adjacent buildings and the presence of antennas, Block A and the site was particularly suitable for the tests.
In the following pictures, it is shown the site and its integration with the context.
11
3- Review about the drones used
3.1 - Review about drones: characteristics present on the market
Before focusing the attention on the main topic of the research, it is important to illustrate a brief summary about the different type of drones that are present on the market.
UAV characteristics are suitable for the different needs required that make them optimal for specific operations. Thanks to that, it is possible to make some distinctions between drones according to their mechanical characteristics.
First of all, drones can be classified looking the way how the wings move: fixed or rotative. The first one is composed by a rigid wing and equipped with an electric or combustion engine that is able to let the system having the proper thrust to fly.
The flight control is possible thanks to the presence of:
- Ailerons: on the bottom and on the wings, avoiding rotations caused by rolling; - Elevator, that is controlling the pitch, the rotation of the front respect of the axis
formed by the wings;
- rudder, that is controlling the yaw, specifically the rotation around the vertical axis.
Figure 9 – Airplane parts and functions (Source: NASA - https://www.grc.nasa.gov/WWW/k-12/airplane/airplane.html) Moreover, the aerodynamic of the system is able to stand high velocity wind up to 45 km/h. When a rotor gets damaged, due to its conformation, a fixed wing UAV can land safely reducing the impact on the soil.
12 UAS at fixed wings are characterized by a high flight autonomy, in average around 45 minutes, and they can cover high areas, around 10 kmq, with one operation, collecting reliable pictures of the site.
On the contrary, fixed wing UAVs are characterized by higher costs and lower applications in case of building inspections due to their capacity of movement.
In fact, this system needs to move air for its displacement. Due to its conformation, the hoovering is impossible.
Another issue is related to the place required for taking on and landing operations, in which a specific track is always necessary.
Actually, it is under development a fixed wing UAV model capable of working in VTOL (Vertical Take Off and Landing) and STOL (Short Take Off and Landing) but complexity and cost are still prohibitive.
Figure 10 - Examples of fixed wings drone (Source: Parrot – www.datamanager.it)
For rotative wing drones, stability and movement are obtained with couples of coaxial contra-rotating propellers, instead of two different rotors, that guarantee a relatively simple driving of the system also where the meteorological conditions are dangerous. For this reason, the possibility of hovering is the main advantage of a rotative wing drone and this condition can help the users to perform analysis also where a stationary position of the camera is requested, for example for buildings or punctual infrastructures. Rotative-wing drones can be differentiated within sub-groups depending on the number of propellers. The most diffused are the quadcopters, the exa-copters and the octocopters, with 4, 6 or 8 propellers each.
The differences between the three systems are in movements and autonomy. At the same conditions, a quadcopter is slower than an octocopter due to the lower number of propellers, but it can have higher autonomy because the system requires less power for the propellers.
In addition, in case of the failure of one of the propellers during flying operations the lack of propulsion is counterbalanced by the other rotors.
13 For this reason, in an octocopter the incidence of repartition due to the failure of a propeller is about 12.5% so as the supplier redundancy requested to all the others increases up to 1.79%.
In a quadcopter, the same failure affects the flight about 25%, with an increasing in the supplier redundancy up to 6.25%.
Chart 1 - Comparison between different drones in relation to the number of the blades
For a rotary-wing UAV, due to their variability, making comparisons about speed, maximum high reachable by a drone and autonomy of the battery requires to consider several aspects such as the weight of the system and of the instruments carried on the drone.
The maximum load capacity of a drone is affected by several aspects like the number of rotors or the length of a singular propeller. The power and the type of the engine installed plays an important role in this aspect.
Another important key is the condition of the site where drones are tested by the producers, the standard conditions applied and declared. For this reason, on the market they are present quadcopters which are able to sustain higher loads than an octocopter. The same behaviour is encountered also for speed and autonomy.
In order to give an analytical and reliable comparison between different rotative-wing drones, a market research is obtained in order to find testers with the same boundary conditions that could have figured out reliable results for a comment.
With the support of an online market research instrument Aeroexpo, it was possible to focus the research on professional rotative-wing drones with 4, 6 or 8 rotors and an electric engine. 0% 5% 10% 15% 20% 25% 30%
Quadcopter Exacopter Octacopter Incidence of repartition Supplier redundancy
14 Then, in order to narrow down the list obtained, a model realized by one producer and so tested in the same standard conditions is found. The purpose was to compare three different models with the same propulsion (it only changes the number of propulsors installed) and type of battery in terms of autonomy.
Finally, the producer was found, Challengers Aerospace systems and the models come from Hercules Series, and the results were compared (ChallengeAerospace, 2020).
Data input H4 (quadcopter) H6 (Exacopter) H8 (Octocopter)
Empty weight 10.12 Kg 12.15 Kg 16.15 Kg
Max Take-off weight (MTOW)
21.46 Kg 30.29 Kg 52.43 Kg
Propulsion 4xCA-KU 200 6xCA-KU 200 8xCA-KU 200
Battery 2x2200 mAh 2x2200 mAh 4x2200 mAh
Performance H4 (quadcopter) H6 (Exacopter) H8 (Octocopter)
Flight autonomy 60 min 75 min 120 min
Cruise speed 64.8 Km/h 72 Km/h 86.4 Km/h
Payload 11.34 Kg 18.14 Kg 36.3 Kg
Table 2 - Technical characteristics of the analysed drones
Chart 2 - Comparison between drones H4 H6 H8
0 20 40 60 80 100 120 140
Flight autonomy [min] Cruise speed [Km/h] Payload [Kg] H4 (quadcopter) H6 (Exacopter) H8 (Octocopter)
15 In terms of performances, an octocopter is able to provide better results in speed and payload. Also, the autonomy is higher than exa-rotors, but in this case a most performed battery is installed.
The main disadvantage is the cost of the system, higher than the other two.
In conclusion, it is possible to affirm that each type of drone is suitable for particular operations. However, another main distinction between customized and commercial drones could be considered.
The first category mentioned tends to include drones which are realized in lab by assembling different parts, so as costs and stability can be variable for the driver. The second category is the most accessible to the stakeholders, both amateurs and professionals, and the costs are known and fixed. In addition, since the product can be sold to everyone, stability in flight is tested by the engineers during previous phases in order to avoid possible accidents.
3.2 - Case study: drone used for the test
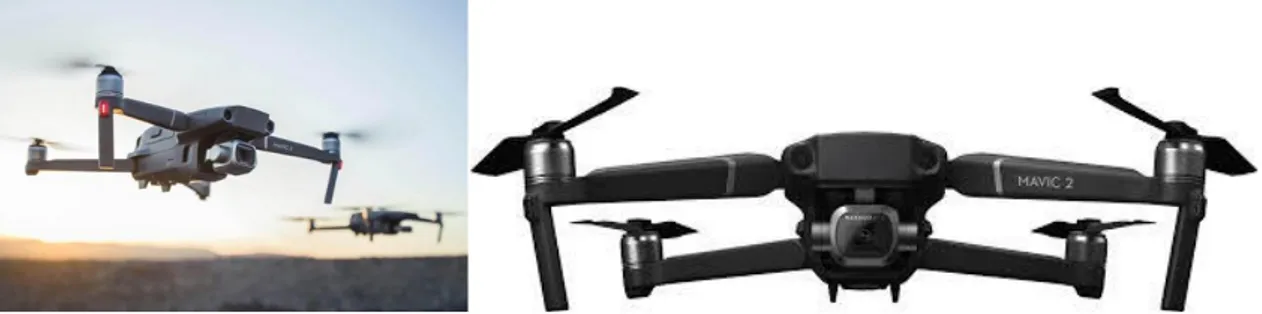
For linking the PhD and MSc Thesis, a commercial quadcopter by DJI and named DJI Mavic 2 Enterprise Dual is selected for the phase of data acquisition.
As mentioned before, Mavic 2 Enterprise Dual is a rotational wings quadcopter that is particularly suitable for many operations due to the possibility of installing several additional components.
The drone is characterized by a 743 g of payload, included propellers and gimbal, that is the load capability that an aircraft can lift without compromising stability.
Since it is a rotational wings drone, Mavic 2 can perform all its movement in all the directions and remain in hoovering, particularly suitable for taking pictures. Under absence of wind, the drone can reach a maximum velocity of 65 km/h while the autonomy, under favourable conditions, is around 25 minutes.
This characteristic is extremely important because it requires that all the operations have to be planned considering the battery capability both of the drone and of the radio control. So, for long operations it is important to have more than one battery and manage their recharge.
The camera is installed on a 3-axis gimbal, so as the movements of roll, pitch and yaw are compensated and do not affect the precision of the picture. The device can control and stabilize all the inclinations between -90° and 30°, included horizontal and vertical roll between 0° and 90°.
Mavic Pro is equipped with an RGB camera M2E of 1/2.3” CMOS (complementary metal-oxide semiconductor), characterized by 12.35 Megapixels as sensor and a focal lens of 26 mm with a distortion lower than 1.5%.
16 Opening of the focal lens is assumed to be between 24 mm and 48 mm, while pixel format of the images in 4:3 option is equal to 4056x3040 pixels.
The thermal camera of Mavic 2 Enterprise used is part of the optional included in the drone and it is interchangeable.
For obtaining a good result and avoid the influence of the external temperature or wind velocity, an uncooled VOx microbolometer is installed.
Due to its characteristics, the thermal camera can collect false colour pictures working between 800 nm and 1400 nm spectral band, catching the heat coming from the object. The dimension of the images is 4:3 is 640x480 pixels.
The drone is also implemented with proper sensors for obstacles detection in all the four sides. Characteristics are variables, passing from detection capabilities of the front and rear sensors which are able to detect an obstacle until 40 m in a fast way, while lateral ones reach 22 m detection.
17
4- Stage 1: flight path planning
4.1 - Literature review on flight path
In this chapter, a general presentation of the basic and general rules for planning a flight path is presented. Since this Thesis work is focused on the fusion and analysis of data collected from pictures, the topic about the autonomous flight of a drone is secondary, even if it is studied by the main PhD research.
For this reason, the flight path studied and planned actually considers the presence of a user that pilot the drone according to national standards and all the possible obstacles in the aerial space.
This is an important operation that must regard several factors, from the geometric elements of the building analysed to the national, regional and local regulations. An approach consists in realizing the flight path considering the intrinsic characteristics of the drone used, in particular taking into account the resolution of the camera installed and other limits of the device such as the resolution of the image, focal length depth and the objective of the camera.
For a complete data acquisition, a flight path able to cover all the building is required. Despite the research, where it is possible to find papers presenting special algorithms as universal solutions for finding the best flight planning, it is not possible to apply them completely to all the case studies because of the presence of many variables.
On the market many app launched with the scope of calculating the best trajectory are only limited at cases where the object to be focused is completely in plane.
However, when a 3D object like a building has to be reconstructed, the use of the devices descripted before is not so effective.
In any case, some good rules can be extracted in order to perform a good flight and obtain a good result.
The most diffused and efficient when a study of a single plane part is requested is the strip-method, where the drone is conducted by the pilot in a zig-zag movement, either vertical or horizontal, in relation of the façade (Rakha & Gorodetsky, Review of Unmanned Aerial System (UAS) applications in the built environment: Towards automated building inspection procedures using drones, 2018).
In particular, the first one is indicated for collecting information by buildings where high is much more developed than width and vice versa for an horizontal flight.
It is also demonstrated that a vertical flight tends to reduce the clarity and the quality of the images due to the unfavourable movement of the lens, while the strip horizontal method is most efficient when the speed of the drone is low.
18 Another type of flight path is the spiral movement, that forecasts spiral movements around the building. It is particularly indicated for preliminary recognitions and 3D model reconstruction.
Both the models consider all the device limitation and geometrical obstructions given by the external context.
Figure 12 - Comparison between the two main flight procedures (Source: Rakha et Al. (2019) - Review of Unmanned Aerial System (UAS) applications in the built environment: Towards automated building inspection procedures using drones)
The inclination of the thermal camera during flight operations is another important aspect to be taken into account because, since all the system works analysing irradiation emissions of the objects, this output varies by changing the position of the drone (Rakha, Gorodetsky, & Kakillioglu, Campus as a Lab for Computer Vision-based Heat Mapping Drones: A Case Study for Multiple Building Envelope Inspection using Unmanned Aerial Systems (UAS), 2018).
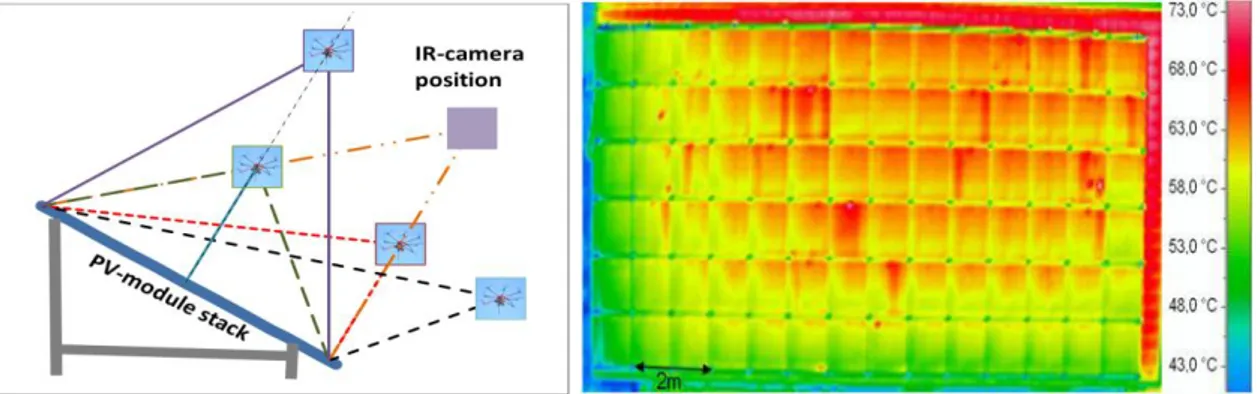
For the acquisition of thermal images, it is important to regard at the position of the drone in terms of angle formed with the object. In fact, by an analysis of a photovoltaic field performed by positioning the drone in different places, different results up to 30% between them are obtained (Buerop-Lutz & H., 2015).
19 Figure 13 - Test on thermal results in relation of drone positions (Source: Buerop-Lutz H. - inspecting pv-plants using aerial, drone-mounted infrared thermography system)
Finally, forecast weather and adapting the operations in relation to them is important for conducting everything in safe conditions.
Wind speed and optimal visual has to be considered for conducting all the operations in a safe way.
If the first aspect can affect the stability of the drone and its driving, the second aspect can affect in some cases the visual requested by the pilot to avoid issues or dangerous situations.
For this last aspect, the Italian national standard prescribes that it is mandatory the constant monitoring and responsibility of the drone by a recognized and licenced pilot and the operations can be summarized into three categories:
- VLOS (Visual-Line Of Sight): operations conducted inside a proper distance, both vertical and horizontal, in which the remote pilot is able to maintain constantly the visual contact with the drone, driving all of its movements and avoiding collisions;
- EVLOS (Extended Visual-Line Of Sight): operations conducted over the limits required by VLOS in which the visual contact can be maintained thanks to alternative instruments;
- BVLOS (Beyond-Visual-Line Of Sight): Operations conducted over the maximum distance in which the operator is not able to maintain a constant direct contact with the UAV. It is not possible to manage its movement and avoid collisions (ENAC, 2020).
In addition, if the flight path is realized with the purpose of performing a 3D image-based reconstruction, the trajectory to be considered is strongly affected by the triangulation matching between the points of each single picture collected (Boller, Kuo, & Echsmann, 2012).
20
4.2 - Case study: flight path planning description
The following subchapter introduces how the drone flight has been planned for our data acquisition.
As mentioned before, a complex of four buildings located in the suburbs of Spino d’Adda, that is used as office and data monitoring station by Politecnico di Milano and Agenzia Spaziale Italiana, has been selected as case study.
This phase has been conducted thinking about two missions: collecting proper pictures for the 3D model reconstruction and provide a preliminary feedback for a future automation of the entire procedure.
As preliminary step, a map identifying the possible places to perform all the operations without disturbing the normal activities has been set.
As it was mentioned before, there are two institutions working in the site monitoring the data collected by a set of antennas that are constantly active. Due to the possible interferences caused by the drone with the installations, it was strictly forbidden to fly around them. For this reason, a no-fly zone in the south of the area is set in order to perform all the operations without asking an interruption of the other activities.
Figure 14 - Panoramic view of the site and no-fly zone identified
The flight planning is made for collecting proper pictures to reconstruct a reliable 3D model using photogrammetry knowledge. For this reason, considerations about the distance between camera and object, position and distance of the camera points has to be known by the analysis of GSD (Ground Sampling Distance, that is the distance between two consecutive pixels centres), calculated in the following way:
𝐺𝑆𝐷 = 𝑆𝑊 ∗ 𝐻 ∗ 100 𝐹𝑅∗ 𝑖𝑚𝑊
21 For qualitative reasons, in order to obtain a proper result in the 3D modelling, a maximum GSD equal to 1 cm/pixel has been set, so that a maximum distance between camera and object has to be taken into account.
In this case, due to the proximity of different buildings to Block A, object of studies, a maximum distance object-camera equal to 5 m during the movements parallel to the façade has been considered, while H equal to 6 m has been regarded for collecting pictures at the angles.
The other two important parameters are the following ones: 1- Dw (width of the single image footprint
on the ground):
𝐷𝑊 = 𝐺𝑆𝐷 ∗ 𝑖𝑚𝑊 100
2- Dh (high of the single image footprint on the ground):
𝐷𝐻 = 𝐺𝑆𝐷 ∗ 𝑖𝑚𝐻 100
In the next table, the technical data of the camera used for the planning:
Parameter Definition Value
Sw Sensor width of the camera 28 mm
H Distance object-camera 5 m
Fr Camera focal distance 24 mm
imW (RGB) RGB image width 4056 pixels
imW (Thermal) Thermal image width 640 pixels
imH (RGB) RGB image high 3024 pixels
imH (Thermal) Thermal image high 480 pixels
Table 3 - Parameters used for the planning
Camera GSD [cm/pixel] Dw [m] Hw [m] Lf [m] Hf [m]
RGB 0.14 6.00 4.00 1.17 0.87
Thermo 0.91 6.00 4.00 1.17 0.88
Table 4 - Results obtained for flight path planning
The 3D model reconstruction of the building is based on an image-based technique called Structure from Motion, where every single point of the object is identified by analysing
22 its position in the space from different pictures. The more the point is represented in different pictures, the more its identification through triangulation is reliable.
For this reason, the overlapping of the pictures is fundamental and a proper parameter requires to be regarded in the preliminary stage before the flight.
For Structure from Motion, an optimal overlapping can vary from 66% to 85%; lower values can help at having a fast flight phase, but the resolution of the model can be problematic and the presence of holes caused missing triangulations can be frequent. On the contrary, high values of overlapping ensure great redundancy and a reliable 3D reconstruction but the flight phase will be slower and problematic in terms of battery autonomy.
For this data acquisition, an overlapping equal to 80% is considered, so that images are taken every 1.20 m in horizontal and 1 m in vertical both for RGB and for thermal acquisition.
Another important aspect for the image-based 3D model reconstruction is the connection between the points of two non-planar objects such as two consecutive façades.
Nowadays, there are no algorithms that are able to automatically calculate a flight path considering this aspect, so it is important to connect the two consecutive sides of the building taking some angular pictures showing the two objects.
In this case, considering a 90° angle between the two facades, 4 pictures every 22.5° at 6m from the object are collected. This passage is repeated also when the drone is sent to take pictures of the roof.
Another important aspect to study is the starting point of the flight path. Since it is important to have a proper coincidence between the first and the last photo collected at the same level, the point 0 has to be set in a way that the photo taken can include part of the landscape.
The following images show the flight planning preliminary considered for Block A. A “chain movement” is repeated every 1 m for taking the building in a best way and avoid lack of information caused by the possible reflectance of metallic elements.
In yellow it is represented the position 0, while in blue we have angular positions. During the acquisition of the pictures, it has been noticed that on the south-west side of the building, the 6-meters-distance preliminary set as optimal distance between the building and the camera for sides connection was not possible to be satisfied.
For this reason, just for that side, the acquisition of the photos was made at a distance of 5 m.
23 However, the correction performed on site did not affected the result reported in the following chapters.
24
5 - Stage 2: 3D model reconstruction
5.1 - State of the art
The discussion presented in this chapter is a propaedeutic introduction about the main computer-based techniques used for the 3D model reconstruction, starting from a 2D image information.
Computer vision 3D reconstruction is mainly diffused in medical fields for the analysis of human body, but also in the archaeological field, for the localization and mapping of the sites and cultural artifacts both on ground and undersea.
The application of 3D reconstruction techniques apport benefits in different aspects, such as limiting the destructive nature of excavating to the possibility of enriching the archaeological research (Ham, Wesley, & M., 2019).
From a research point of view, the first paper published was released in 1981 with an introduction of the possible problems to solve for meeting the target.
During the years, several approaches were presented and nowadays it is possible to declare that the result obtained is acceptable and satisfying.
By analysing the papers published in recent years, it is possible to notice an “horizontal” development of the topic: since all the main issues have now a solution, all the publications recently released present algorithm with alternative passages as hypothetical optimization.
However different sources such as the possibility of using electromagnetic waves scanners, the realization of the 3D model is possible using two main different ways: by laser scanning or using an image-based procedure. Comparing the two options, the difference between them is linked to efficiency and economic issues: while the first guarantees good results in terms of precision and efficiency, the second one is more economic and well-integrable to commercial drones (Inzerillo, Di Mino, & Roberts, 2018). In any case, the output provided by each algorithm is a 3D point cloud representing the building as object of the reconstruction. Nowadays, on the market IT companies released specific products that are able to measure and rebuild the point clouds into a virtual environment like Agisoft Metashape or Pix4D.
The research is performed considering only image-based reconstructions mainly for its benefits.
25
5.2 - Structure from Motion: how it works and examples
Structure from Motion is a reconstruction technique based on computer vision algorithms that allows to build an object into a virtual 3D environment starting from the definition and automatic collimation of a series of fundamental points that are measured from a group of 2D pictures, usually taken by a camera or a drone.
The procedure takes a leaf from biology and human anatomy: in fact, human binocular vision catch the image in 2D that is elaborated by the brain into a 3D perception.
There are many methods for obtaining the result: from stereo methods to considerations about the motion.
Applications in Structure from Motion are various and different. In fact, it can be used for object recognition and in computer graphic also.
In addition, concept related to Structure from Motion are the basis for robotics application and automation motion. As mention, a huge number of SLAM (Simultaneous and Localization Mapping) development integrates SfM for their targets.
However, Structure from Motion needs complex geometric theories and algorithms to support it, and it needs to be improved in terms of speed.
Pinhole camera model
For understanding the logic behind Structure from Motion, it is necessary to start from the pinhole camera model, that is a simplified scheme where the light travels in a straight line. The light reflected by the object passes through the pinhole to form an inverted image on the imaging surface.
In general, theory considers that the light striking an object is reflected back in random directions in the scene but only a bundle of these rays traveling along the same direction enters the camera and strike the film in one single point.
However, the ideal model already presented is founded on the following rule: to every point in the scene corresponds a single point on the film.
The distance between the pinhole and the imaging surface is called focal length. Making a brief introduction: the smaller the pinhole, the smaller is the cone and the clearer the image. However, if the pinhole is too small, the image can be affected by blurring.
26 Figure 16 - Pinhole camera model (Source: Matlab - https://it.mathworks.com/help/vision/ug/camera-calibration.html) In addition, a too small pinhole requires a longer exposure time because the amount of light passing through the hole and striking the surface of the film decreases.
As a general rule, the shorter the exposure time the better. There is a limit though to the size of the pinhole: when the size of the hole is about the same as the light's wavelength, light rays are diffracted.
Figure 17 - Refraction based on exposure (Source: Madali – www.towardsdatascience.com) Camera calibration
For studying Structure from Motion mathematically, it is important to introduce the concept of camera calibration in order to find a value for camera parameters and, consequently, a unique coordinate system. There are mainly two types of coordinate systems in SFM:
- the camera coordinate system: where the optical centre of the camera is taken as the origin. The x-axis is the horizontal direction, the y-axis is the vertical direction and the z-axis points to the direction viewed by the camera.
- the world coordinate system: where the origin can be selected arbitrarily, regardless of the specific location of the camera.
27 Figure 18 - Camera coordinates (Source: Madali – www.towardsdatascience.com)
In addition, two more coordinate systems are often involved in camera models:
- image pixel coordinate system: where the origin is at the upper left of the image, the u axis is right, and the v axis is down. The unit of the pixel coordinate system is the pixel, which is also the unit of measure for the resolution, as it is shown in the following image;
- imaging plane coordinate system, that are coplanar with the image pixel coordinate system. The origin is the intersection of the camera’s optical axis and the imaging plane, which is usually the midpoint or principal point of the imaging plane.
28 Figure 19 - Image coordinates (Source: Madali – www.towardsdatascience.com)
The unit is a physical unit, such as millimetres. Therefore, the imaging plane coordinate system and the pixel coordinate system are only different in the origin and measurement unit and the two coordinate systems differ by a zoom ratio and a translation of the origin. Given P (x,y) as the coordinates of the imaging plane, the following equation shows the conversion between the pixel coordinate system and the imaging plane coordinate system: { 𝑢 = 𝑥 𝑑𝑥+ 𝑢𝑜 𝑣 = 𝑦 𝑑𝑦+ 𝑣0 → ⌈ 𝑢 𝑣 1 ⌉ = [ 1 𝑑𝑥 0 𝑢0 0 1 𝑑𝑦 𝑣0 0 0 1 ] [ 𝑥 𝑦 1 ] Where:
- dx and dy represent the physical size of each pixel in the image in the imaging plane, specifically the zoom ratio previously mentioned;
- u0 and v0 are the coordinates of the origin of the imaging plane in the pixel coordinate system;
29 Camera coordinate system
The camera coordinate system is shown in the following scheme. It is possible to see from the figure that there is a perspective projection relationship between the points on the camera coordinate system and the points on the imaging plane coordinate system.
Figure 20 - Camera coordinates system (Source: Madali – www.towardsdatascience.com)
Assuming that the coordinate of the point P in the camera coordinate system corresponding to P is (Xc, Yc, Zc), the following equation shows the conversion relationship between the imaging plane coordinate system and the camera coordinate system. { 𝑥 = 𝑓𝑋𝐶 𝑍𝐶 𝑦 = 𝑓𝑌𝐶 𝑍𝐶 ⇒ 𝑍𝐶[ 𝑥 𝑦 1 ]= [ 𝑓 0 0 0 0 𝑓 0 0 0 0 1 0 ] [ 𝑋𝐶 𝑌𝐶 𝑍𝐶 1 ] Where:
30 - Oc is the origin of the camera coordinate system, assumed in the optical centre; - Xc-axis, Yc-axis and Zc-axis are the optical axis of the camera, that are assumed to
be parallel with the u-axis and the v-axis of the pixel coordinate system; - f is the focal length
World coordinate system
It is now introduced the passage that shows the relationship between the camera coordinate system and the world coordinate system, that it can be described by the rotation matrix R and the translation vector t of the camera motion. A reference coordinate system is chosen in the environment to describe the position of the camera and objects.
Assuming that the coordinates of P in the world coordinate system are (Xw, Yw, Zw), it is possible to represent the conversion relationship between the camera coordinate system and the world coordinate system with the following equation:
[ 𝑋𝐶 𝑌𝐶 𝑍𝐶 1 ] = [𝑅 𝑡 0 1] [ 𝑋𝑤 𝑌𝑤 𝑍𝑤 1 ]
Coordinate system conversion
The conversion between the world coordinate system and the pixel coordinate system can be realized through the above four coordinate systems, as shown below:
𝑍𝐶[ 𝑢 𝑣 1 ] = [ 1 𝑑𝑥 0 𝑢0 0 1 𝑑𝑦 𝑣0 0 0 1 ] [ 𝑓 0 0 0 0 𝑓 0 0 0 0 1 0 ] [𝑅 𝑡 0 1] [ 𝑋𝑤 𝑌𝑤 𝑍𝑤 1 ] = [ 𝑓𝑥 0 𝑢0 0 0 𝑓𝑦 𝑣0 0 0 0 1 0 ] [𝑅 𝑡 0 1] [ 𝑋𝑤 𝑌𝑤 𝑍𝑤 1 ] Where:
- 𝑍𝐶 can be considered a scale factor of the system;
- [ 𝑢 𝑣 1
] represent the matrix including all the image points;
- [ 𝑋𝑤
𝑌𝑤
𝑍𝑤 1
31 - [
𝑓𝑥 0 𝑢0 0 0 𝑓𝑦 𝑣0 0
0 0 1 0
] is the matrix including the intrinsic parameters of the camera (focal length and pixels dimension);
- [𝑅 𝑡
0 1] is the matrix that includes the extrinsic parameters (translation and rotation); [ 𝑓𝑥 0 𝑢0 0 0 𝑓𝑦 𝑣0 0 0 0 1 0 ] [𝑅 𝑡
0 1] is also defined as camera or fundamental matrix
The internal parameter matrix of the camera is often known and fixed, while the external parameter matrix often needs to be figured out.
Calculation of the Epipolar constraint and essential matrix
Another important passage is to apply the equation that, starting from the Epipolar Constraint, calculate the matrix E, that is called Essential matrix.
The following scheme shows the relationship between two images collected by two different stages of the same point. The purpose of the essential matrix is to find a way to link the information for the 3D reconstruction.
It is possible to declare that space coordinates of the point and the distance from the point to the camera are not essential for the reconstruction. However, it can be seen from the following analysis that the relative relationship between the two cameras is required and the corresponding points evaluation in the two images also. So, as preliminary step, a problem of feature point extraction and matching has to be solved. Given a Pw point in the world coordinate system. Considering the coordinate is Xw, its image in camera 1 is x1 and its image in camera 2 is x2, as it follows:
Figure 21 - Epipolar constraint scheme and reference adopted (Source: Madali – www.towardsdatascience.com) It is also supposed that:
32 - the vertical distances from X to the image planes of the two cameras are s1 and
s2 respectively;
- the two cameras have the same internal parameter matrix K (which is admissible, because it is supposed that the images are collected by the same camera), - the transformation relationship with the world coordinate system is [R1, T1] and
[R2, T2];
It is possible to get the following two equations, Since K is an invertible matrix, it is calculated the K inverse matrix to obtain:
𝑠1𝑥1 = 𝐾(𝑅1𝑋 + 𝑇1) 𝑠2𝑥2 = 𝐾(𝑅2𝑋 + 𝑇2)⇒ 𝑠1𝐾−1𝑥 1 = 𝑅1𝑋 + 𝑇1 𝑠2𝐾−1𝑥 2 = 𝑅2𝑋 + 𝑇2
Then, it is possible to assume:
𝑥1′ = 𝐾−1𝑥 1 𝑥2′ = 𝐾−1𝑥 2 ⇒𝑠1𝑥1 ′ = 𝑅 1𝑋 + 𝑇1 𝑠2𝑥2′ = 𝑅 2𝑋 + 𝑇2 Where:
- 𝑥1′ and 𝑥2′ are the normalized image coordinates.
Since the world coordinate system can be selected arbitrarily, it is chosen the world coordinate system coincident to the camera coordinate system of the first camera in order to write the second component in function of the first one. The following equation becomes:
𝑠1𝑥1′ = 𝑋
𝑠2𝑥2′ = 𝑅2𝑋 + 𝑇2 ⇒ 𝑠2𝑥2
′ = 𝑠
1𝑅2𝑥1′ + 𝑇2
In order to introduce the Essential matrix, it is important to illustrate the three-dimensional vector of the T matrix. By chance, it is started considering the perpendicular relationship between 𝑇̂ and 𝑥2 2′:
𝑇̂ 𝑥2 2′ = [
0 −𝑡3 𝑡2 𝑡3 0 −𝑡1 −𝑡2 𝑡1 0
] 𝑥2′
Then the inner product of both sides of the equation is calculated to obtain: 0 = 𝑠1(𝑇̂ 𝑥2 2′)𝑇𝑅
2𝑥1′ ⇒ 𝑥2′𝑇̂ 𝑅2 2𝑥1′ = 0
If the Essential matrix is considered as the product of T2 and R2, so: 𝐸 = 𝑇̂ 𝑅2 2 ⇒ 𝑥2′𝐸𝑥1′ = 0
33 This equation is called Epipolar Constraint and the matrix E is called Essential matrix. Derive essential matrix
It is important to understand how many point-correspondences are necessary for calculating the essential matrix and the research has looked into this problem for many years.
The first popular solution method uses 8 points to get a unique solution. It is popular due to its relative easy implementation. This algorithm is called 8-point algorithm or Longuet-Higgins algorithm.
There are many algorithm to solve this problem, both iterative and non-iterative, that were implemented in 2004, but the last mentioned is still the most popular.
Considering two points and applying the epipolar constraint to a pair of correspondence, the following equation based on the elements of matrix E is obtained:
𝐸 = [ 𝑒11 𝑒12 𝑒13 𝑒21 𝑒22 𝑒23 𝑒31 𝑒32 𝑒33 ] 𝑢2𝑢1𝑒11+ 𝑢2𝑣1𝑒12+ 𝑢2𝑒13 + 𝑣2𝑢1𝑒21+ 𝑣2𝑣1𝑒22𝑣2𝑒23+ 𝑢1𝑒31+ 𝑣1𝑒32+ 𝑒33 = 0
The equation can be repeated for many points and the following structure is extracted:
Once the essential matrix E is known, it is possible to decompose it into the rotation R and translation T for this we can use the SVD.
𝐸 = 𝑈𝑆𝑉𝑇
34 - U and V are matrixes linked with the image;
- 𝑆 = [𝜎01 𝜎02 00
0 0 0
] is a 3x3 diagonal matrix with the eigenvalues as diagonal elements;
On the other hand, it is possible to calculate T and R in function of the known matrix S: - 𝑇̂ = 𝑈 [±10 ±10 00 0 0 0 ] 𝑆𝑉𝑇 - 𝑅̂ = 𝑈 [±10 ±1 00 0 0 0 1 ] 𝑉𝑇
It is possible to calculate 4 possible solution each one, but only one of them has the points in front of both cameras.
3D Reconstruction
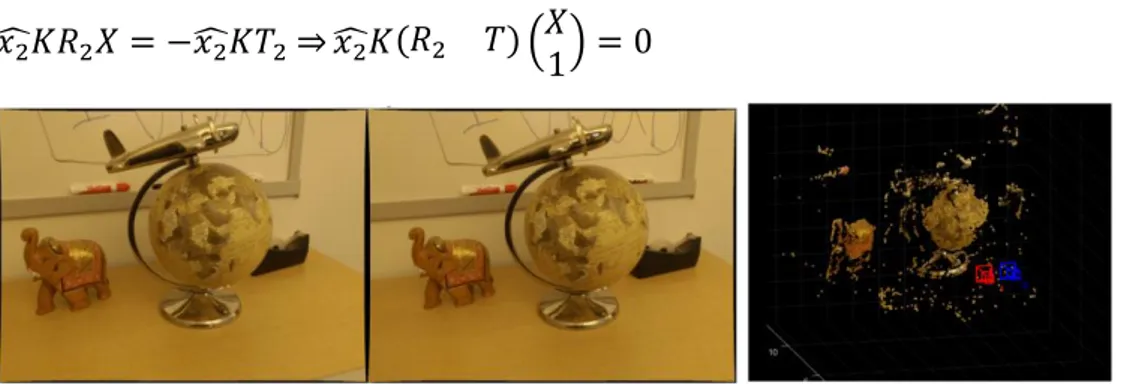
Once the transformation matrix between the two cameras is known, as well as the coordinates of each pair of matching points, a passage of triangulation of the matched points is started by restoring the coordinates of the matching points in space through this known information, and a 3D reconstruction of the captured space is generated. In the previous derivation, it is possible to obtain:
𝑠2𝑥2 = 𝐾(𝑅2𝑋 + 𝑇2)⇒ 𝑥̂𝐾(𝑅2 2𝑋 + 𝑇2) = 0
Then, it is possible to write linearly the equation. The following equation cannot be solved directly by inverse, so it is transformed into a sub-equation and solved using SVD. The geometric meaning is equivalent to drawing the extension lines of x1 and x2 from the optical centres of the two cameras.
𝑥̂𝐾𝑅2 2𝑋 = −𝑥̂𝐾𝑇2 2⇒ 𝑥̂𝐾(𝑅2 2 𝑇) (𝑋
1) = 0
Figure 22 - Example of 3D reconstruction by Matlab (Source: Matlab – Structure from Motion from multiple views - https://it.mathworks.com/help/vision/ug/structure-from-motion-from-two-views.html)
35 Multi-View SFM
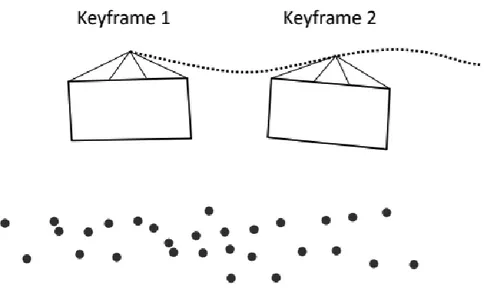
It is now introduced the 3D reconstruction integration operated in Structure from Motion with more than 2 images. As the number of images increases, the difference between the newly added image and the first image may increase and the extraction of feature points becomes extremely difficult.
After the binocular reconstruction method to reconstruct the first two images, so that some points in the space are obtained and consequently the point cloud, it is calculated the pose for every subsequent frame using the P3P or DLT algorithm considering the point correspondences of the other keyframes.
Figure 23 - Keyframe positioning (Source: Madali – www.towardsdatascience.com)
When there is not enough correspondence anymore, a new keyframe is set and it is matched with the previous keyframe. Among these matching points, the spatial coordinates of some of these matching points are known. In this way, new points are added at the point cloud by triangulation.
36 Figure 24 - Keyframe matching (Source: Madali – www.towardsdatascience.com)
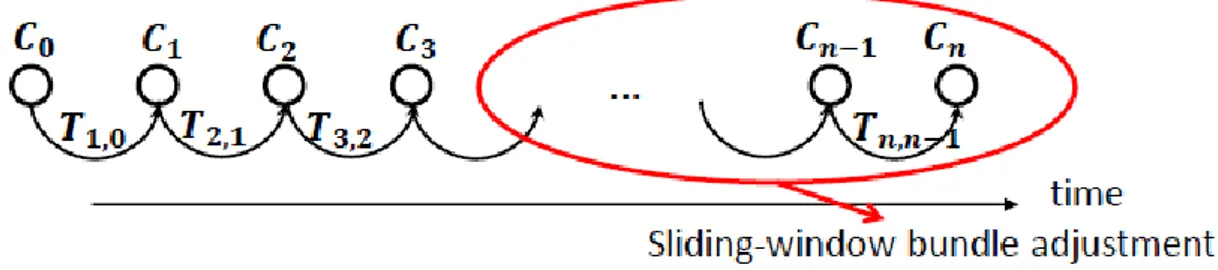
Once the motion estimation is known, the structure can be refined optimizing the calculated trajectory. For doing that, a sliding window-method is used and a bundle adjustment is applied for it.
Bundle Adjustment (BA) is essentially a nonlinear optimization algorithm. It is usually used after the estimation of the transformation (R and T). BA refines motion and points at the same time the by minimizing the Sum of Squared Reprojection Errors:
(𝑝𝑖, 𝐶 2) = 𝑎𝑟𝑔𝑚𝑖𝑛𝑝𝑖,𝐶𝑖∑ ∑ ‖𝑝𝑘𝑖 − 𝜋𝑘(𝑝𝑖, 𝐶𝑘)‖ 2 𝑁 𝑖=1 𝐾 𝑘=1 Where:
- Ci is the position of the camera in the world frame. For the actual minimization we can use the Levenberg-Marquadt algorithm.
Sometimes large reprojection errors have a bad influence for the optimization algorithm therefore the squared error is not advisable since the error increase.
Figure 25 - Bundle adjustment correction after matching operations in Structure from Motion (Source: Madali – www.towardsdatascience.com)
37 SfM application: Pavement management
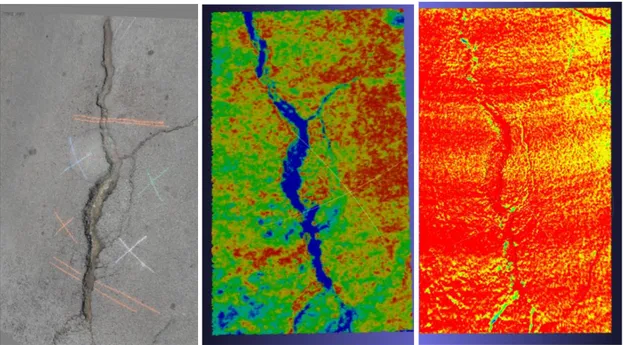
It is reported a test conducted by the University of Palermo with the purpose to build a 3D virtual model of cracks present in a street through PhotoScan for preventive maintenance considerations. The test is integrated in a more complex and general concept called Pavement Management, related to the possibility of operating in preventive maintenance, guaranteeing much more efficiency and money saving in a long period of the ways (Inzerillo, Di Mino, & Roberts, 2018).
The test was conducted by collecting photos in a street both with a drone equipped with a 12 megapixel photocamera and a Nikon equipped with an objective 34 megapixel. Then, after the creation of the 3D model through PhotoScan, its accuracy was tested first on MeshLab and then on Rhino considering the Haustroff histogram. The images show the results. Where there is red, it means that the alignment is perfect.
In this case, this condition is obtained more with the Nikon-Realized model, but this happens because of the dimensions of the object. It is important to remark that the targets were the potential cracks, but for an object of greater dimensions the result could have been different.
Figure 26 - Example of positioning for Structure from Motion reconstruction (Source: Inzerillo et Al. (2015) - Image-based 3D reconstruction using traditional and UAV datasets for analysis of road pavement distress)
38 Figure 27 - Haulstroff diagram: Results from Drone-Model and Nikon-model (Source: Inzerillo et Al. (2015) - Image-based 3D reconstruction using traditional and UAV datasets for analysis of road pavement distress)
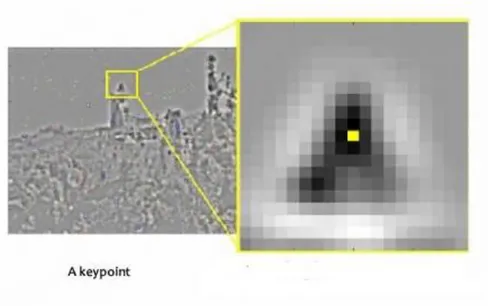
5.3 - SIFT
SIFT stands for Scale-Invariant Feature Transform and was first presented in 2004, by D.Lowe. SIFT is invariance to image scale and rotation and it is an algorithm useful for collecting the interesting points that are matched in the following 3D reconstruction.
Figure 28 - Example of feature collection (Source: Tyagi - Introduction to SIFT( Scale Invariant Feature Transform) – www.towardsdatascience.com)