ALMA MATER STUDIORUM - UNIVERSITA’ DI BOLOGNA
FACOLTA’ DI SCIENZE MATEMATICHE, FISICHE E NATURALI
CORSO DI LAUREA MAGISTRALE IN BIOLOGIA MARINA
S
PECIES IDENTIFICATION,
DISTRIBUTION AND REPRODUCTIVE INTERACTIONS OFCOMMON SMOOTH
-
HOUND AND BLACKSPOTTED SMOOTH-
HOUND SHARK(G
ENUSM
USTELUS)
IN THEA
DRIATICS
EACandidato : Relatore:
Nicola Di Francesco Prof. Fausto Tinti
Correlatore:
Dott. ssa Alessia Cariani
Sessione III
CONTENTS
ABSTRACT... 3
1. INTRODUCTION ... 5
1.1. CHONDRICHTHYANS IN THE MEDITERRANEAN SEA... 5
1.2. CONSERVATION OF CHONDRICHTHYANS ... 7
1.3. SYSTEMATICS OF SHARKS ... 8
1.4. THE GENUS MUSTELUS IN THE ADRIATIC SEA ... 9
1.5. TARGET SPECIES ... 11
1.5.1. Taxonomy of M. mustelus and M. punctulatus ... 11
1.5.2. Mustelus mustelus... 12
1.5.3. Mustelus punctulatus... 15
1.6. MOLECULAR MARKERS ... 18
1.6.1. Cytochrome c Oxidase subunit 1... 19
1.6.2. Internal Transcribed Spacer 2 ... 20
2. AIM ... 22
3. MATERIAL AND METHODS ... 24
3.1. SAMPLING ... 24
3.2. LAB METHODS ... 25
3.2.1. DNA extraction ... 25
3.2.2. Polymerase Chain Reaction (PCR) ... 25
3.2.3. Gel and capillary electrophoresis... 26
3.3. MOLECULAR MARKERS AND PCR CONDITIONS... 27
3.3.1. COI ... 28
3.3.2. ITS2... 28
4. RESULTS... 31
4.1. MOLECULAR SPECIES IDENTIFICATION (BARCODE ID) ... 31
4.1.1 – Species taxonomy ... 31
4.1.2 - Individual taxonomy... 34
4.2. SURVEY DATA ANALYSIS ... 42
4.3. ITS2 ASSAY ... 45
5. DISCUSSION ... 50
ABSTRACT
Longstanding taxonomic ambiguity and uncertainty exist in the identification of the common (M. mustelus) and blackspotted (M. punctulatus) smooth-hound in the Adriatic Sea. The lack of a clear and accurate method of morphological identification, leading to frequent misidentification, prevents the collation of species-specific landings and survey data for these fishes and hampers the delineation of the distribution ranges and stock boundaries of the species. In this context, adequate species-specific conservation and management strategies can not be applied without risks of population declining and local extinction.
In this thesis work I investigated the molecular ecology of the two smooth-hound sharks which are abundant in the demersal trawl surveys carried out in the NC Adriatic Sea to monitor and assess the fishery resources. Ecological and evolutionary relationships were assessed by two molecular tests: a DNA barcoding analysis to improve species identification (and consequently the knowledge of their spatial ecology and taxonomy) and a hybridization assay based on the nuclear codominant marker ITS2 to evaluate reproductive interactions (hybridization or gene introgression).
The smooth-hound sharks (N=208) were collected during the MEDITS 2008 and 2010 campaigns along the Italian and Croatian coasts of the Adriatic Sea, in the Sicilian Channel and in the Algerian fisheries. Since the identification based on morphological characters is not strongly reliable, I performed a molecular identification of the specimens producing for each one the cytochrome oxidase subunit 1 (COI) gene sequence (ca. 640 bp long) and compared them with reference sequences from different databases (GenBank and BOLD).
From these molecular ID data I inferred the distribution of the two target species in the NC Adriatic Sea. In almost the totality of the MEDITS hauls I found no evidence of
different distribution of M. mustelus (confined along the Italian coasts) and M.
punctulatus (confined along the Croatian coasts); just one sample (Gulf of Venice,
where probably the ranges of the species overlap) was found to have catches of both the species.
Despite these data results suggested no interaction occurred between my two target species at least during the summertime (the period in which MEDITS survey is carried out), I still wanted to know if there were inter-species reproductive interactions so I developed a simple molecular genetic method to detect hybridization.
This method is based on DNA sequence polymorphism among species in the nuclear ribosomal Internal Transcribed Spacer 2 locus (ITS2).
Its application to the 208 specimens collected raised important questions regarding the ecology of this two species in the Adriatic Sea. In fact results showed signs of hybridization and/or gene introgression in two sharks collected during the trawl survey of 2008 and one collected during the 2010 one along the Italian and Croatian coasts. In the case that it will be confirmed the hybrid nature of these individuals, a spatiotemporal overlapping of the mating behaviour and ecology must occur. At the spatial level, the northern part of the Adriatic Sea (an area where the two species occur with high frequency of immature individuals) could likely play the role of a common nursery area for both species.
1. INTRODUCTION
1.1. CHONDRICHTHYANS IN THE MEDITERRANEAN SEA
The Mediterranean Sea covers an area of approximately 2.5 million km2 (about 0.7% of the world’s ocean surface area) and has an average depth of 1,500m (reaching 5,200m at its deepest point in the Ionian Sea). The coastline extends for 46,000km and is bordered by 21 countries (Zenetos et al. 2002).
In spite of the Mediterranean is a semi-enclosed sea, the chondrichthyan fish fauna is relatively diverse with approximately 80 species (7% of the total living chondrichthyans), including 45 species of sharks from 17 families, 34 batoids from nine families and one species of chimaera (Compagno 2001; Serena 2005).
Although considerable variation occurs, chondrichthyans exhibit strongly K-selected life history strategies especially when compared with teleost fishes (Cailliet et al. 2005). They are generally slow growing, late to mature, have low fecundity and productivity, long gestation periods, high natural survivorship of all age classes and long life. These biological traits result in low reproductive potential and low capacity to increase population size. Such characteristics have serious implications for chondrichthyan populations, limiting their capacity to sustain fisheries and recover from declines (Cailliet
et al. 2005; Camhi et al. 1998).
Fishery. In the Mediterranean, the commercial value of chondrichthyans is low compared to that of teleost fishes and shellfishes and currently chondrichthyans represent barely 0.78% of the total landings (FAO 2006). Cartilaginous fish stocks are declining worldwide because of fishing (Myers and Worm, 2003). In many parts of the world, even with relatively short periods of exploitation, elasmobranch populations have been greatly reduced. This is especially true for multi-species fisheries, were sharks (refers to sharks, rays and chimeras) are usually a minor part of fishery landings. In
overexploitation may continue for many years, as the fishery is sustained by the more productive target fishes.
From 1970 to 1985, landings of chondrichthyan fishes in the Mediterranean, as reported by the Fisheries and Agriculture Organization of the United Nations (FAO), increased from 10,000t to 25,000t. In 2004, however, reported landings declined to 1,000t (FAO 2006; SGRST 2003). Demersal trawl effort has increased in the shelf and upper part of the slope of the Mediterranean over the past 50 years (Aldebert 1997). Increased fishing intensity and technological advancement of fishing gear led to a decline in many chondrichthyan species commercially captured by trawls in the north-western Mediterranean (Walker et al. 2005).
Several demersal elasmobranch species have commercial value, while only a few pelagic species are marketed. The major chondrichthyan fishing countries within the Mediterranean are Turkey, Tunisia, Greece, Italy and Spain and the species most commonly exploited in coastal fisheries are the smooth-hounds Mustelus spp., skates
Rajids, catsharks Scyliorhinus spp., dogfish Squalus spp., eagle rays Myliobatids and
whiptail stingrays Dasyatids (Walker et al. 2005).
Long term sources of information to assess shark removals are scant in the Mediterranean Sea and actually time series obtained from international and national scientific trawl surveys, as MEDITS and GRUND respectively, have been often disregarded because of the relatively short period compared to the mean generation time of elasmobranches (MEDITS) and the heterogeneity of the sampling methods (GRUND).
Fishery catch rates are unavailable since shark landings are rarely reported adequately (ICES, 2005). Furthermore, given the mainly artisanal aspect of the Mediterranean fisheries (Farrugio et al., 1993) and the scarce economic interest in shark species, most landings have never been reported, or if reported, records are hard to find (ICES, 2005).
1.2. CONSERVATION OF CHONDRICHTHYANS
Conservation and effective management of the world exploited sharks populations have become issues of considerable concern on an international scale as a result of greatly expanded commercial fishing efforts over the past two decades [Bonfil, 2004; Weber & Fordham, 1997; Food and Agriculture Organization (FAO), 1998, 2000]. The status of many of the world’s shark populations is poorly known, hampering the development and implementation of appropriate conservation measures aimed at sustaining populations over the long term (Shivji et al., 2002).
The recent international attention being directed to shark conservation and management stems from the realization that sharks, with life-history characteristics more similar to those of mammals (e.g. slow growth, late reproductive maturity, relatively few young) than of teleost fishes, are unlikely to respond well to the increased fishing pressure they are experiencing (FAO 1998, 2000). In response to concerns for conservation of shark populations on a global scale, since 1998 the United Nations Food and Agriculture Organization has developed an International Plan of Action for the Conservation and Management of Sharks and Rays (IPOA-Sharks) that calls for all member nations participating in shark fisheries to develop and implement their own national plans of action aimed at ensuring the conservation and management of shark stocks (FAO 1998).
In agreement with the IPOA-Shark guidelines the EC in date 5 February 2009 launched the Community Action Plan (CAP) that involves the EU Mediterranean States. The goal of the CAP is to contribute to the renewal of the stocks that are in danger of collapse due to overfishing and to define, in the mean time, a serious and sustainable policy for the management and conservation of the sharks within and outside the EU waters.
1.3. SYSTEMATICS OF SHARKS
Sharks are divided into eight orders. The largest and the most important order is the Carcharhiniformes. Carcharhiniform sharks include about 200 species, which corresponds to about 55% of all species (Naylor, 1992). This order includes eight families: Sphyrnidae, Triakidae, Leptochariidae, Hemigaleidae, Scyliorhinidae, Proscylliidae, Pseudotriakidae, Carcharhinidae (Dosay 2008).
Triakids are generally small- to medium-sized sharks that most frequently inhabit coastal regions in tropical and temperate seas throughout the world and feed primarily on benthic crustaceans, cephalopods and bony fish. Many triakids species (e.g.
Mustelus spp.) are target of commercial fisheries of local significance (e.g. Conrath et
al., 2002; Simpfendorfer et al., 2002). Triakids exhibit placental viviparity and limited-histotroph viviparity (aplacental viviparity). As currently defined, the Triakidae is thought to include the living representatives of an “intermediate evolutionary phase” between the basal carcharhiniforms (e.g. Scyliorhinidae and Proscyllidae) and the so-called “higher carcharhinids” (e.g. Carcharhinidae and Sphyrnidae) (Compagno, 1988). The variation pattern of reproductive modes among carcharhiniforms seems to reflect this putative evolutionary trend. Oviparity and yolk-sac viviparity are the prevailing reproductive modes among basal carcharhiniforms (e.g. Scyliorhinidae and Proscyllidae) and the “higher carcharhinids” (e.g. Carcharhinidae and Sphyrnidae) are almost invariably placental viviparous. Among triakids there are species with limited histotrophy and species with placental viviparity (Musick and Ellis, 2005).
1.4. THE GENUS MUSTELUS IN THE ADRIATIC SEA
In the Adriatic Sea the genus Mustelus (Chondrichthyes, Triakidae) is represented by three species: the common smooth-hound M. mustelus Linnaeus, 1758; the blackspotted smooth-hound, M. punctulatus Risso, 1826 and the starry smooth-hound,
M. asterias Cloquet, 1821 (Jardas 2007).
In the recent IUCN Red List assessment of Mediterranean chondrichthyans, the M.
mustelus was listed as vulnerable (VU) and the population trend considered decreasing,
the status of M. punctulatus and its population trend were not assessed because the available information were deficient (Data Deficient, DD) and M. asterias was listed as Least Concern (LC) with unknown population trend (Serena et al. 2003, 2004, 2006) The data deficiency could be related to the longstanding uncertainty in the identification and taxonomy of Mustelus species (Hubbs, 1938; Lopez et al., 2006). Based on DNA sequences and reproductive modes, the genus is not monophyletic and can be divided into two main clades: the unspotted placental viviparous species including M. mustelus and the spotted aplacental viviparous species including M. asterias (Lopez et al., 2006). The presence/absence of black spots on dorsal side has been used since long time ago as distinctive feature with taxonomic value. Nevertheless, it is highly variable and spots may be vivid and well defined, faint or even absent in some cases (Heemstra, 1973). The lack of a clear and accurate phenotypic-based identification method prevents the collation of reliable species-specific landings and survey data for Mustelus species.
Mustelus species are ovoviviparous (aplacental viviparous) or viviparous (placental
viviparous or placentoviviparous), but it is not known if placental species have evolved more that once within the genus or if the aplacental species have secondarily evolved from placental species. If ovoviviparity is primitive within Mustelus, viviparity in the genus has evolved separately from that in other carcharhinoids.
Members of the genus Mustelus are unusually difficult to be discriminated, particularly without the use of internal anatomic characters. Most of the morphological, morphometric and meristic characters that distinguish species partially overlap and considerable variation occurs within species (Compagno 1984).
Ecology - An assessment of the diet between different size classes of M. mustelus and
M. punctulatus exhibits ontogenetic changes in diet, with crustaceans decreasing and
molluscs and teleosts increasing in importance with shark size (Jardas et al., 2007). Differences in the diet due to size may be the results of different life-history stages using different habitats as a strategy to minimise competition between them: many elasmobranch species tend to segregate by sex and life-history stage such that larger individuals do not compete directly with smaller for food resources or habitat (Simpfendorfer et al. 2001; Ebert, 2002).
The wide dietary diversity in larger sharks could also reflect the ability of large individuals to use a wider range of habitat resources, both on the trophic level due to their increased morphological adaptations, and on the spatial level due to their greater mobility and hence dispersal rate (Saidi et al., 2009)..
Fishery in the Mediterranean - Mustelus spp are exploited in the Mediterranean Sea, where they are regularly sold for human consumption in many areas (Fischer et al., 1987). In the Mediterranean Mustelus species are caught by demersal trawls, trammel nets, gillnets and longlines (Bauchot 1987, STECF 2003). Semi-industrial fisheries in the Adriatic Sea, off Sicily, Spain and Cyprus are known to target these species, and also artisanal fisheries elsewhere. Time series catch data from comparable trawl surveys and landings in the Gulf of Lions, Ligurian Sea, showed a clear decrease in abundance of Mustelus spp from 1970 onwards, although data from the Adriatic Sea suggest that abundance of M. mustelus did not change from 1948 to 1998 (Jukic-Peladic et al., 2001).
Landings data reported to FAO show that landings of Mustelus spp (probably including
M. mustelus, M. asterias and M. punctulatus, of which M. mustelus is the most common
in this region) steadily increased between 1950 and 1978 to 14,000 t, after which they fluctuated between ~6,500 t and 14,000 t from 1978 to 1994 (FAO 2008). After 1994, landings dropped significantly, decreasing to 2,980 t in 1997 and did not exceed 2,200 t from 2001 to 2006 (FAO 2008). Although these landings are not species-specific, combined with the results of fishery-independent trawl surveys described above, they also suggest that this species has declined in abundance in the Mediterranean Sea.
1.5. TARGET SPECIES
1.5.1. Taxonomy of M. mustelus and M. punctulatus
The two species show a body fairly slender, short head, prepectoral length about 20% of total length, snout moderately long and bluntly angular in the lateral view (Fig.1.1). In
and the distal cusplets are absent except in very young sharks; buccopharyngeal denticles are confined to tongue and anterior third of palate. Some differences are reported for colour, shape and colour of the dorsal fin edge and shape of caudal fin and denticles. The common smooth-hound colour is uniform grey or grey-brown above, light below, with no white spots or dark bars, even if some specimens can show dark spots. The blackspotted smooth-hound colour is uniform grey or grey-brown above, light below, often with small black spots, but without white or dark bars. In M. mustelus the trailing edges of dorsal fins are denticulate (without bare ceratotrichia) while in M.
punctulatus are naked, with a prominent band of dark bare ceratotrichia.
The common smooth-hound presents a falcate first dorsal fin, with the posterior margin almost vertical and the midbase closer to pectoral bases than pelvics; pectoral and pelvic fins are moderately large; the ventral lobe of the caudal fin is more or less falcate in the adults. The crowns of lateral trunk denticles are lanceolate or weakly tricuspidate, with longitudinal ridges extending their entire length. The blackspotted smooth-hound presents a broadly triangular first dorsal fin, with a posteroventrally sloping posterior margin and the midbase closer to pelvic bases than to pectorals; pectoral and pelvic fin are fairly small; the ventral lobe of the caudal fin is falcate in the adults. The crowns of lateral trunks denticles are lanceolate, with or without weak ridges that, when present, extend at most only half their length (ftp://ftp.fao.org/docrep/fao/009/ad123e/ad123e21.pdf).
1.5.2. Mustelus mustelus
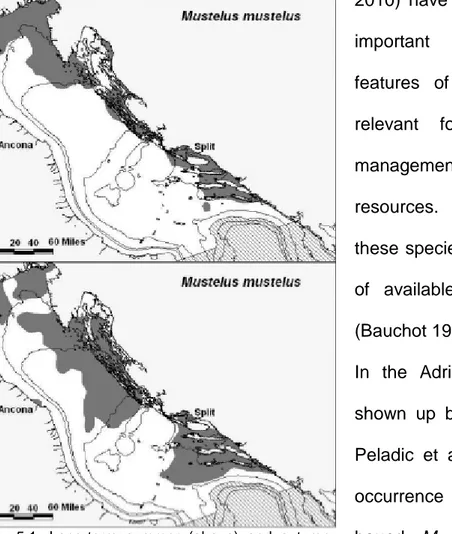
Species distribution - The common smooth-hound is found from France and British Isles to Mediterranean, Morocco, Canary Islands, Madeira, Angola, South Africa (Fig. 1.2 and 1.3). This shark is abundant in the continental shelves and uppermost slopes,
from the intertidal to at least 350 m depth, but usually in shallow waters from 5 to 50 m on sandy and muddy substrates (Bauchot 1987; Serena 2005; Notarbartolo and Bianchi 1998; Compagno et al. 2005).
Biology and ecology- Males mature at 70-112 cm total length (TL) and females at 107.5-124 cm TL (Saïdi et al. 2008); 80cm TL was reported in the Mediterranean Sea (Bauchot 1987, Whitehead et al. 1984, Serena 2005). Mustelus mustelus is viviparous with yolk-sac placenta. The reproduction is annual with parturition taking place during late April and early May and mating during May and early June off Tunisia and the gestation period is 9-11 months (Saïdi et al. 2008; Smale and Compagno 1997; Notarbartolo and Bianchi 1998). Females give birth to 4-18 pups per litter and larger females have significantly larger litters (Fischer et al. 1987, Saïdi et al. 2008, Smale and Compagno 1997).
Size at birth is 34-42 cm TL (Saïdi et al. 2008, Bauchot 1987, Serena 2005,
Fig.1.2: Distribution of Mustelus mustelus
(http://www.iucnredlist.org/apps/redlist/details/39358/0)
Fig.1.3: Distribution of Mustelus mustelus (Compagno, 1984)
crustaceans (Squilla mantis) and mollusks bivalve (Ensis spp.) and cephalopods (Eledone moscata) (Costantini et al. 2000).
Species assessment- No species-specific fisheries catch data are available for M.
mustelus because landings data often refer to all Mustelus species combined. Both
catch and fishery-independent scientific survey data available from the Mediterranean Sea and Western Africa suggests that significant declines have occurred in these regions.
Exploitation of this species is increasing off South Africa and stock assessment indicates that current catch levels are unsustainable. According to the IUCN Red List of Threatened Species the common smooth-hound is considered to meet the criteria for Vulnerable (VU) (Fig.1.4.) globally based on observed and inferred continuing declines over three generations (>50 years) and may prove to meet the criteria for a higher category in the future. Aldebert (1997) reports a clear decrease in abundance of
Mustelus species in comparable surveys in the Gulf of Lions, southern France, from
1970 onwards whereas the occurrence of M. mustelus in comparable trawl surveys
Fig.1.4: Species information on IUCN Red List of Threatened Species web site (http://www.iucnredlist.org/apps/redlist/details/39358/0)
conducted on the shelf of the Adriatic Sea in 1948 and 1998 remained approximately the same (Jukic-Peladic et al. 2001).
In GRUND surveys carried out in Italian seas between 1985 and 1998, relative abundance of M. mustelus was 21.9% and most of the catches were in the Adriatic Sea and Sicilian Channel (the species was absent from the Ligurian Sea and Sardinian waters) (Relini et al. 2000). The MEDITS scientific survey carried out in the northern Mediterranean Sea from 1994 to 1999 at 10 to 800 m depth recorded this species in 111 (2%) of 6,336 hauls (Baino et al. 2001). There are no specific management measures in place for M. mustelus throughout the majority of its range: catches and population trends need to be carefully monitored and management intervention is required.
Interest to fisheries - The species is of interest for fisheries in the European waters, the Mediterranean, and off-West Africa. This shark is taken in bottom trawls, fixed bottom nets, with line gear, and occasionally even in pelagic trawls. It is utilized fresh and fresh-frozen fro human consumption (France, Federal Republic of Germany, Italy), also dried salted and smoked; its liver is used for oil and carcasses for fishmeal. In South Africa, it is commonly taken by recreational fishery from shore and sandy beaches.
1.5.3. Mustelus punctulatus
Species distribution - The blackspotted smooth-hound is an inshore, continental bottom-dwelling shark; it is found on sandy and gravelly substrates and among sea grass beds (to 200 m depth) in the Mediterranean Sea and off Western Sahara in the eastern central Atlantic (Serena 2005).
M. punctulatus is very common in
the Adriatic Sea, mostly in the channel area and open sea above sand and muddy bottoms up to 200m depth (Jardas, 1996).
It is common also along the Tunisian coasts, in the Gulf of Gabès and along the coast of Libya (Bradai et al. 2002).
Biology and ecology- The biology of this demersal, coastal shark is poorly known because of confusion with the more common M. mustelus . Reproduction is presumably viviparous and the gestation period is about a year. The maximum size is at least 95 cm total length (TL) (Compagno et al. 2005). Males M .punctulatus mature at a smaller size than females do and reach a smaller maximum size, which confirms the sexual dimorphism in sharks (Taniuchi et al., 1993). Males mature at 50-55 cm TL and females at ~60 cm TL (Compagno et al. 2005). Size at birth is about 31 cm TL (Compagno et al. 2005). The number of pups per litter of the blackspotted smooth-hound is from 12 to 27 (Saidi et al., 2009).
Species assessment- M. punctulatus was recorded in only one of 6,336 hauls during northern Mediterranean scientific trawl (MEDITS) surveys (at depths of 50-800 m) from 1994 to 1999 (Baino et al. 2001). Jukic-Peladic (2001) compared data from the Adriatic Sea collected during the MEDITS survey (1998) with that from the Hvar survey (1948).
M. punctulatus was not reported from either survey, although M. mustelus and M. asterias were present in both surveys. This species was also absent from bottom trawl
Fig.1.5: Distribution of M. punctulatus
surveys conducted off the Balearic Islands between 1998 and 2001 (at depths of 40-1,800 m) (Massutí and Moranta 2003). The relative abundance of this species estimated from the GRUND scientific surveys carried out from 1985 to 1998 in Italian waters was very low (2.48%) and very few specimens of this species were reported in
the hauls from Northern Tyrrhenian Sea, Northern-Central Adriatic and Sicilian Channel (Relini et al. 2000). This low percentage is likely due to frequent misidentification of this species with the common smooth-hound. According to the IUCN Red List of Threatened Species there is lack of information about M. punctulatus, considered as Data Deficient (DD) (Fig.1.6.). There are no conservation actions in place for the blackspotted smooth-hound and more research is needed on this species abundance, life-history and the effect of fisheries throughout its range, particularly from the southern Mediterranean and western coast of Africa.
Interest to fisheries- Like other Mustelus species in the Mediterranean Sea, the blackspotted smooth-hound is taken as bycatch in trawls and other demersal fisheries.
Fig.1.6: Species information on IUCN Red List of Threatened Species web site (http://www.iucnredlist.org/apps/redlist/details/161485/0)
Landings data are often grouped and therefore species-specific information is not currently available on landings, although Mustelus species are retained and utilised for human consumption in many areas. As a result of confusion with its congeners and a lack of data on catches and abundance, this species is currently assessed as Data Deficient by the IUCN. However, given that it is apparently rare, may be fished throughout its range and evidence that other Mustelus species have declined, further investigation is a priority.
1.6. MOLECULAR MARKERS
By detecting genetic variations, molecular markers may provide useful information at different levels: population structure, levels of gene flow, phylogenetic relationships, patterns of historical biogeography and the analysis of parentage and relatedness (Avise 1994). The genetic markers are important tools also for ecologists to define the appropriate geographic scale for monitoring and management, to identify the geographical origin of individuals (a challenge at sea, i.e. a dispersive milieu containing indirect developing species [larval stage] and migratory species) and to detect changes in population size and connectivity.
The nuclear DNA genes are particularly useful in detecting functional polymorphisms and population structure. Some nuclear genes have multiple copies in the genome. Among them, the nuclear ribosomal DNA (rDNA) multigene family has been used extensively for systematic studies (Hillis and Dixon, 1991). In the nuclear rDNA clusters, coding gene regions are conserved but flanked by nonconserved spacer regions. Conserved regions allow for reliable amplification of the gene region over a broad taxonomic range. The spacers often show variation at the individual and population levels offering information on population structure and levels of gene flow.
Over the last three decades the mitochondrial DNA (mtDNA) has been widely used as molecular marker. Experimentally, mtDNA is relatively easy to amplify because it appears in multiple copies in the cell and is highly variable in natural populations because of its elevated mutation rate, which can generate some signal about population history over short time frames. Variable regions (e.g. the control region) are typically flanked by highly conserved ones (e.g. ribosomal DNA), in which PCR primers can be designed (Galtier et al., 2009). Mitochondrial gene content is strongly conserved across animals, with very few duplications, no intron, and very short intergenic regions (Gissi et al. 2008).
Mitochondrial DNA has a number of specific biological properties, which make it an appropriate marker of molecular biodiversity:
1) it is inherited hemiclonally (maternally), which means that the whole genome behaves as a single, nonrecombining locus: this considerably simplifies the representation and analysis of within-species variation data;
2) mtDNA has been supposed to evolve in a nearly neutral fashion. Being involved in basic metabolic functions (respiration), mitochondrial-encoded genes have been considered as less likely than other genes to be involved in adaptive processes;
3) the evolutionary rate of mtDNA has been frequently assumed to be clock-like – in the absence of any mutations spreading through positive selection, only neutral (and slightly deleterious) mutations accumulate in time, so that mtDNA divergence levels should roughly reflect divergence times (Galtier et al., 2009).
1.6.1. Cytochrome c Oxidase subunit 1
With millions of species and their life-stage transformations, the animal kingdom provides a challenging target for taxonomy. Recent work has suggested that a DNA-based identification system, founded on the mitochondrial gene, cytochrome c oxidase
subunit 1 (COI), can help to the resolution of this diversity (Hebert et al., 2003). The sequence divergences at COI regularly enable the discrimination of closely allied species in all animal phyla except the Cnidaria: these organisms show low rate of mitochondrial evolution (France & Hoover 2002; Shearer et al. 2002) and their stasis seems linked, at least in part, to the presence of an excision repair system absent in other animal mitochondria (Hebert at al., 2003). The success in species diagnosis reflects the high rates of sequence change at COI in most animal groups. In fact, more than 98% of species pairs showed greater than 2% sequence divergence. Hebert et al. (2003) proposed that a DNA barcoding system for animal life could be based upon sequence diversity in COI. They established that diversity in the amino acid sequences coded by the 5’ half of this mitochondrial gene was sufficient to reliably place species into higher taxonomic categories (from phyla to orders) and permit the discrimination of closely allied species. In 2005, as a consequence of the increasing use of DNA barcoding approach in the identification of fish species (Ward et al., 2005), a new research project was launched under the auspices of the Consortium for the Barcoding of Life (http://www.barcoding.si.edu/): the Fish Barcode of Life initiative (FISHBOL; http://www.fishbol.org), which data are included into a main unique database called BOLD (Barcode of Life Data System, http://www.barcodingoflife.org/views/login.php; Ratnasingham & Hebert, 2007). The BOLD is an informatics workbench aiding the acquisition, storage, analysis and publication of DNA barcode records (Ratnasingham & Hebert, 2007).
1.6.2. Internal Transcribed Spacer 2
Each nuclear rDNA unit consists of the three ribosomal genes (18S, 5.8S and
28S), separated by two Internal Fig.1.7: Diagram illustrating the organization of the
Transcribed Spacer regions (ITS1 and ITS2), and flanked by an External Transcribed Spacer (ETS) at each end (see Fig.1.7.). These units are repeated in a tandem arrangement to form long arrays comprising several hundred cistrons, interspersed with the intergenic spacer (IGS), and are located in the nucleolar organizing region or regions (NORs) of the chromosomes. The tandem arrangement results in repeat units evolving in concert with one another such that they will tend to homogenize within and between arrays through concerted evolution (Dover, 1986). Especially, ITS1-2 regions offer a great opportunity for determining the phylogenetic relationship among closely related species (Soltis, 1995).
The ITS1-2 regions are used in many research works, not only in sharks, and they are ideal candidates for molecular evolutionary and systematic studies, and are recently getting more attention. For instance Shivji et al. 2002 developed a highly streamlined molecular genetic approach based on DNA sequence differences among species of the Carcharhiniformes order in the nuclear ribosomal internal spacer 2 locus. ITS regions evolve fast, and there might be a variation between species within the genus or among the populations. By using the ITS regions, it is possible to determine the nature of the potential variation (Wesson & Porter 1992). The multicopy nature of rDNA makes that marker highly sensitive to hybridization because of the accumulation of evidence of past hybridization events (Wyatt et al., 2006) and hence useful in hybridization studies (Odorico & Miller, 1997).
2. AIM
Several evidences indicate that chondrichthyans in the Mediterranean are generally declining in abundance, diversity and range and are possibly facing a worse scenario than chondrichthyan populations elsewhere in the world (Walker et al. 2005). These declines can be attributed to a number of factors, including the life history characteristics of chondrichthyans in combination with the semi-enclosed nature of the Mediterranean Sea and intense fishing activity throughout its coastal and pelagic waters; effects of habitat loss; environmental degradation; and pollution (Dulvy et al. 2003; Walker et al. 2005).
Although the members of the Mustelus genus are common throughout the Mediterranean, little is known about the biology and ecology of these sharks and there is a lack of a clear method to discriminate M. mustelus (common smooth-hound) and M.
punctulatus (blackspotted smooth-hound) (misidentification occurs often, at least in the
Adriatic Sea).
This study targets to improve species ecology and systematics of the two target smooth-hounds by 1) assessing their ecological relationships in the Adriatic Sea and 2) investigating whether reproductive interactions occur among them.
I addressed these two goals using molecular markers. With the mitochondrial gene cytochrome oxidase subunit 1 (COI) it was possible a reliable identification of the common and blackspotted smooth-hound and so get a clear idea of species-distribution based on the catches reported during the 2008 and 2010 MEDITS trawl survey. Since the assessment of these species currently use aggregated data under the generic heading Mustelus spp (ICES, 2007), it is difficult to delineate the distribution of species or stock boundaries accurately and this prevents the application of conservation and management strategies of these sharks (Farrell, 2009). I also developed an assay for hybrid and/or gene introgressed individuals detection based on the sequence variation
of a nuclear marker, the internal transcribed spacer 2 (ITS2) to find out if inter-species mating occurs. From the extensive comparative work I carried out some issues on the reliability of the used morphological identification keys and features can be obtained in order to improve the collation of reliable species-specific data also in fisheries and areas where juvenile and immature individuals are abundant as the NC Adriatic Sea.
3. MATERIAL AND METHODS
3.1. SAMPLING
I have analysed 208 smooth-hound sharks that have been putatively assigned to the M.
mustelus (N = 52) and M. punctulatus (N = 156) based on the morphological diagnostic
features. Individuals apparently exhibiting a morphology of the starry smooth-hound M.
asterias were not collected. All individuals were collected from the MEDITS survey
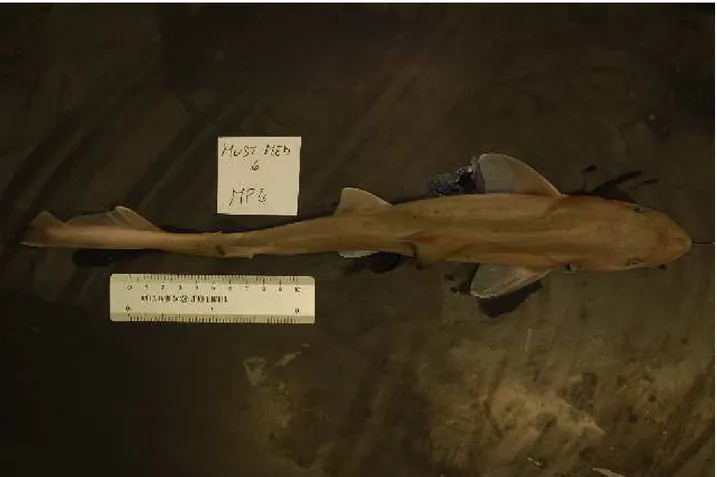
carried out in 2008 (N=103) and 2010 (N=105) in the Northern-Central Adriatic Sea (FAO fishery sub-area 37.2.1; N = 187) and Sicilian Channel (FAO fishery sub-area 37.2.2; N = 15) with the exception of a group of individuals collected at the Fishery market of Algiers from FAO fishery sub-area 37.1.1 (N = 6). All individuals and data were recorded in the ELASMOMED project within the BOLD system (http://www.boldsystems.org/views/login.php). The figure 3.1 showed the geographic and abundance distribution of the collected Mustelus individuals.
Most of the individuals collected in the NC Adriatic Sea were of small size and sexually immature. These individuals were characterized by the lack or weak presence of the black dorsal spots. However, most of the individuals showed the dark band in the posterior edges of the dorsal fins, and were hence assigned putatively to the blackspotted smooth-hound M. punctulatus.
For the individual collected in the MEDITS campaigns, collecting data as date, coordinates, depth, sex and maturity stage were recorded. I have assigned to the Algerian specimens artificial coordinates to locate them in the BOLD geographic information systems in the Algerian coasts. Most of the Adriatic and Sicilian individuals have also a scaled digital picture from the dorsal, lateral or ventral view. Digital picture recording was carried out systematically for the Adriatic individuals collected in the MEDITS 2010.
In the lab, individual finclips were collected and stored in 96% ethanol in a -25̊ C freezer for the molecular analyses.
3.2. LAB METHODS
3.2.1. DNA extraction
DNA was extracted from about 20 mg of white muscle tissues and finclips using a CTAB cetyltrimethylammonium bromide/ proteinase k-based method (Winnepenninckx et al., 1993) and then kept in a freezer at -25̊C. A 3µL-aliquot of the DNA solution was then electrophoresed on a 0.8% agarose gel to determine the success of the procedure.
3.2.2. Polymerase Chain Reaction (PCR)
The polymerase chain reaction (Mullis et al., 1987) technique is basically a primer
thermostable polymerase referred to as Taq (first isolated from the Yellowstone National Park hot springs bacteria Thermus aquaticus) allows a short stretch of DNA (usually fewer than 3000 bp) to be amplified to about a million fold so that one can determine its size, nucleotide sequence, etc. (Féral, 2002).
The method is based on thermal cycling, consisting of cycles of repeated heating and cooling of the reaction for DNA melting (denaturation step, 90-96°C), primer annealing step (50-60°C) and enzymatic replication of the DNA (elongation step, 72°C).
3.2.3. Gel and capillary electrophoresis
The gel electrophoresis is used for the separation of DNA, RNA and proteins. These macromolecules are separated by migration on a gel matrix under a directional electromagnetic field. Since the DNA molecules are negatively charged, they migrate to the anode and separate depending on their size. The DNA and RNA fragments of the same size can be visualized as bands (Fig.3.2.) on a UV source by adding Gel Red™ Nucleic Acid Stain (Biotium) to the agarose gel (3 µL/100mL gel).
Capillary electrophoresis (CE) encompasses a family of related techniques that use narrow-bore (20-200 µm i.d.) fused-silica capillaries to perform high efficiency separations of both large and small molecules. The Capillary Gel Electrophoresis (CGE) is the adaptation of traditional gel electrophoresis into the capillary using polymers in
Fig.3.2: Example of 1.5% agarose gel showing the PCR amplification of the ITS2 gene fragment for Mustelus spp. (160 bp and 184 bp). In the right lane a DNA ladder (GeneRuler™, Express DNA Ladder, Fermentas).
DNA ladder
500 bp 300 bp 100 bp
solution to create a molecular sieve also known as replaceable physical gel. This allows analytes having similar charge-to-mass ratios to be resolved by size and detected near the outlet end of the capillary thanks to their fluorescent activity. The output of the detector is sent to a data output and handling device such as an integrator or computer; the data is then displayed as an electropherogram (Fig.3.3). Separated chemical compounds appear as peaks with different retention times in the electropherogram (www.beckmancoulter.com). This technique is commonly employed in SDS-Gel molecular weight analysis of proteins and the sizing of applications of DNA sequencing and genotyping (www.CELeader.com).
3.3. MOLECULAR MARKERS AND PCR CONDITIONS
In my thesis work, I used two molecular markers: the cytochrome c oxidase subunit 1 (COI) and the Internal Transcribed Spacer 2 of the rDNA ribosomal genes (ITS2). The searching for developed smooth-hound microsatellite loci in the genetic and primer data base and in the literature gave negative results. I tested some exon-primed
Fig.3.3: Example of electropherograms of ITS2 fragment amplified in Mustelus spp. obtained with capillary electrophoresis.
3.3.1. COI
The COI gene amplification was obtained using the primer pair Fish F2 (5′ -TCGACTAATCATAAAGATATCGGCAC-3′) and Fish R2 (5′ -ACTTCAGGGTGACCGAAG AATCAGAA-3′) (Ward et al., 2005).
PCR was performed in a volume of 30 µL under the following final conditions: -0.175µM of each primer (Sigma);
-1X reaction buffer (Invitrogen); -5mM MgCl2 (Invitrogen);
-0.2 mM dNTPs (Promega);
-1 U/µL of Taq DNA polymerase (Invitrogen); -3 µL of template DNA (1:10 diluted solution).
A negative control without the template DNA was included in all PCR reactions.
Amplifications were performed in a Biometra Tgradient ThermoCycler using a thermal cycling profile of initial heating of 94̊ C for 2 minutes, followed by 35 cycles of 94̊ C for 30 seconds, 54̊ C for 30 seconds, 72̊ C for 1 minute, and a 10-minutes final extension step at 72̊ C. After that reactions were kept at 4̊ C before running gel electrophoresis on 1.5% agarose gel. The amplicons obtained were about 650bp long. The DNA sequencing was performed by the MACROGEN Inc. The sequences were checked and edited, and then aligned using the MEGA 4.0 software (Kumar et al., 2008). BOLD and NCBI sequences were used as reference sequences.
3.3.2. ITS2
The ITS2 (Internal Transcribed Spacer 2) was amplified employing the shark universal primers Fish 5.8S F (5′ACTTCAGGGTGACCGAAGAATCAGAA3′) and Fish 28S R (5′ACTTCAGGGTGACCGAAGAATCAGAA3′) (Shivji et al., 2002).
Total amplification-reaction volume was 30 µL and contained: -0.5 µM of each primer (Sigma);
-1X reaction buffer (Invitrogen); -2.5 mM MgCl2 (Invitrogen);
-0.2 mM dNTPs (Promega); -2% formamide;
-1 U/µL of Taq DNA polymerase (Invitrogen); -3 µL of template DNA (1:5 diluted solution).
A negative control containing no template DNA was included in all PCR reactions. Amplifications were performed in a Biometra Tgradient ThermoCycler .
The thermal cycling profile was 94̊ C initial heating for 5 minutes, followed by 35 cycles of 94̊ C for 45 seconds, 57,6 C for 30 seconds, 72 C for 1,30 minutes, and a 10-minutes final extension step at 72̊ C and kept at 4̊ C until checked by gel electrophoresis on 1,5% agarose gel. The amplicons obtained were about 1,4 Kb long. The DNA sequencing was performed by the MACROGEN Inc. The DNA sequences were editedù and then aligned using the MEGA 4.0 software (Kumar et al., 2008). Homologous sequences retrieved form the GenBank of NCBI were used as reference sequences (shortfin mako, AF515442; longfin mako, AF515443).
The primer pair developed to amplify the ITS2 region of Mustelus mustelus and
Mustelus punctulatus were designed based on the sequence alignment using the web
free biotool Primer 3. The ITS2 sequences I obtained from the two species were unusually similar in sequence
and length and differed from each other just in a short region, so I designed two
Tab.3.1: Primer sequences
Primer 5’→3’ sequence
Mus-F (forward) GTGAAAGGTGCTGTCCTG Mus-R (reverse) CTCCAACGGTAACGGAAA
primers flanking this polymorphic region (Tab.3.1.).
The amplification was performed in a total volume of 10 µL with the following final concentration:
-1X reaction buffer (Invitrogen); -6 mM MgCl2 (Invitrogen);
-0.2 mM dNTPs (Promega); -2% formamide;
-0.5 µM each primer (Sigma);
-1 U/µL Taq DNA polymerase (Invitrogen); -2 µL of template DNA (1:5 diluted solution).
A negative control containing no template DNA was included in all PCR reactions. I expected the common smooth-hound amplicon to be about 24 bp longer than the blackspotted smooth-hound’s one (Tab.3.2.).
Since I wasn’t sure this subtle length difference could be detected by the agarose gel electrophoresis, I 5’-labelled the the Mus-F primer with the fluorescent HEX dye . The fluorescent-labelled PCR amplicons were resolved by capillary electrophoresis on an ABI310 Genetic Analyser. Allele sizing was carried using the LIZ 500 internal size standard (Applied Biosystem) with the GeneScan® Analysis Software (Applied Biosystem).
Tab.3.2: Expected size of the amplicons for the two Mustelus species
Mustelus mustelus Mustelus punctulatus
4.
RESULTS
A total number of 208 smooth-hound sharks (52 common smooth-hounds and 156 blackspotted smooth-hounds) have been analysed for genetic variation at the two molecular markers developed for species identification (barcode ID, COI) and for the detection of hybrid and/or gene introgressed individuals (ITS2 assay).
4.1. MOLECULAR SPECIES IDENTIFICATION (BARCODE ID)
4.1.1 – Species taxonomy
Once all the Mustelus COI sequences were uploaded on the BOLD website, I performed preliminary and descriptive taxonomic analyses with tools available on the website to check the reliability and quality of the barcode sequences. Using the web tool
“Taxon ID Tree̎ I built up a Neighbor-Joining phylogenetic tree using only the Mustelus COI sequences. This tree showed two greatly differentiated clusters of sequences, each including individual putatively assigned to both species. This results clearly revealed for several individuals the discordance between the morphological (carried out at the sampling) and the barcode ID (see the subparagraph 4.1.2).
The taxonomy of the misidentified individuals was updated in the BOLD database according to the barcode ID. However, the taxonomic changes were recorded in the BOLD data base to identify individuals with concordance between barcode and morphological ID. Using the same web tool, I have then compared the Mustelus COI sequences with the shark COI sequences available in the ELASMOMED project database to address the taxonomic position at higher taxonomic levels. The phylogenetic tree (Fig.4.1) highlighted a close phylogenetic relationship of Mustelus sequences with those of Galeorhinus galeus, a shark species of the family Triakidae.
The sequence divergence among sequences between and within-species of Mustelus was estimated using the “Distance Summary̎” BOLD web tool (Fig.4.2).
Fig.4.1: Neighbor Joining tree of individual COI sequences of Mustelus built with the BOLD tool Taxon ID Tree. The bar represents an interval of
Kimura-2-parameters genetic distance (Kimura 1980). Only a subset of the Mustelus sequences have been included in the tree.
The mean percentage of sequence divergence between the two species (Within Genus) was 7.65% (7.02 – 8.51%). Within Species, COI sequences diverged much less and differently in the two groups of sequences. In M. punctulatus, sequence divergence was null and all individual displayed an unique haplotype, while within M. mustelus sequence divergence ranged from 0.16 to 0.47%. However, such sequence variation was not correlated to the geographical origin of individuals because specimens collected from three different areas (Algerian Coasts, Adriatic Sea and Sicilian Channel) intermingled. These results were shown by the phylogenetic tree of Fig.4.3.
The great COI sequence divergence between the two putative species and the low or null variation observed within species allowed the barcode ID greatly reliable to assess species taxonomy.
4.1.2 - Individual taxonomy
Fifty-one individuals identified morphologically as M. mustelus in the MEDITS 2008 survey showed a barcode ID of M. punctulatus. These individuals were collected mainly
M.mustelus ELAME232-09(Veneto) M.mustelus ELAME324-09(Marche) M.mustelus ELAME215-09(Veneto) M.mustelus ELAME213-09(Veneto) M.mustelus ELAME219-09(Veneto) M.mustelus ELAME246-09(Veneto) M.mustelus ELAME247-09(Veneto) M.mustelus ELAME330-09(Marche) M.mustelus ELAME227-09(Veneto) M.mustelus ELAME220-09(Veneto) M.mustelus ELAME229-09(Veneto) M.mustelus ELAME481-09(Sicilian Channel) M.mustelus ELAME230-09(Veneto) M.mustelus ELAME245-09(Veneto) M.mustelus ELAME250-09(Veneto) M.mustelus ELAME217-09(Veneto) M.mustelus ELAME329-09(Marche) M.mustelus ELAME231-09(Veneto) M.mustelus ELAME223-09(Veneto) M.mustelus ELAME243-09(Veneto) M.mustelus ELAME248-09(Veneto) M.mustelus ELAME244-09(Veneto) M.mustelus ELAME224-09(Veneto) M.mustelus ELAME221-09(Veneto) M.mustelus ELAME233-09(Veneto) M.mustelus ELAME536-09(Sicilian Channel) M.mustelus ELAME1054-11(Veneto) M.mustelus ELAME478-09(Sicilian Channel) M.mustelus ELAME327-09(Marche) M.mustelus ELAME250-09 Veneto) M.mustelus ELAME537-09(Sicilian Channel) M.mustelus ELAME222-09(Veneto) M.mustelus ELAME225-09(Veneto) M.mustelus ELAME218-09(Veneto) M.mustelus ELAME538-09(Sicilian Channel) M.mustelus ELAME226-09(Veneto) M.mustelus ELAME249-09(Veneto) M.mustelus ELAME212-09(Veneto) M.mustelus ELAME480-09(Sicilian Channel) M.mustelus ELAME216-09(Veneto) M.mustelus ELAME214-09(Veneto) M.mustelus ELAME479-09(Sicilian channel) M.mustelus ELAME323-09(Marche)
M.mustelus ELAME482-09(Sicilian Channel) M.mustelus ELAME539-09(Sicilian Channel) M.punctulatus ELAME950(Veneto)
OUTGROUP G.galeus ELAME541-09(Sicilian Channel)
87 100
87
0.01
Fig.4.3: Neighbor Joining phyloegentic tree of the COI sequences of Mustelus individuals with details of the collecting geographical area. The bar represents an interval of Kimura-2-parameters genetic distance (Kimura 1980). Only one sequence of M. punctulatus has been included in the tree because the null sequence variation within the species
in the North-central Adriatic Sea (either in the Italian or Croatian hauls) and in the Algerian Coasts (Tab.4.1.).
Tab.4.1: Number and collecting data of M. punctulatus individuals collected in the MEDITS 2008 campaign and morphologically misidentified as M. mustelus (N=51)
On the contrary, all the individuals collected in the Sicilian Channel (N=15) showed consistency of morphological and barcode ID. Although a great number of barcode ID and individual biological data (size, maturity stage) were uncoupled, most of the misidentified individuals were reproductively immature and therefore likely under the size of first maturity: ca. 80 cm TL for M. mustelus in the Mediterranean (Bauchot 1987, Whitehead et al. 1984, Serena 2005) and 50-60 cm for M. punctulatus (Compagno et al. 2005). Among the 15 specimens collected in the Sicilian Channel, nine (4 M. mustelus; 5 M. punctulatus) were sexually mature but with a TL ranging from 40 to 60 cm. In these specimens, species-specific taxonomic features were shown up. The blackspotted smooth-hound large specimens well and constantly showed black spots in the dorsal part and trailing edges of the first dorsal fin naked, with a prominent band of dark bare ceratotrichia (Fig.4.4; Fig.4.5).
REGION FAO FISHING AREA COORDINATES (Lat-Lon) Misidentified M. punctulatus
Adriatic Sea (Veneto, Italy) 37.2.1-Adriatic 45.3118-13.1058 15 Adriatic Sea (Veneto, Italy) 37.2.1-Adriatic 45.3073-12.6638 1 Adriatic Sea (Veneto, Italy) 37.2.1-Adriatic 43.9-13.769 1 Adriatic Sea (Veneto, Italy) 37.2.1-Adriatic 43.3833-16.7 2 Adriatic Sea (Veneto, Italy) 37.2.1-Adriatic 43.4167-16.2333 1 Adriatic Sea (Croatia) 37.2.1-Adriatic 45.4667-13.3667 21 Adriatic Sea (Croatia) 37.2.1-Adriatic 42.7833-17.5333 1 Adriatic Sea (Croatia) 37.2.1-Adriatic 44.9667-13.5555 1 Adriatic Sea (Croatia) 37.2.1-Adriatic 45.2833-13.4167 1 Adriatic Sea (Croatia) 37.2.1-Adriatic 44.1833-15.0667 1 Adriatic Sea (Croatia) 37.2.1-Adriatic 43.8167-15.4667 1
Fig.4.4: Dorsal view of the individual ELAME534-09 of M. punctulatus collected from the Sicilian Channel (LT 50-60 cm). The dorsal black spots and a prominent band of dark bare ceratotrichia in the first dorsal fin are clearly evident.
On the other side, in the large-sized common smooth-hound sharks the dorsal black spots were always absent, the trailing edges of the first dorsal fins were denticulate but without the bare ceratotrichia with a prominent dark band (Fig.4.6 and 4.6 bis).
Fig. 4.5 Dorsal view of the individual ELAME533-09 of M. punctulatus collected from the Sicilian Channel (LT 40-50 cm). The dorsal black spots and a prominent band of dark bare ceratotrichia in both dorsal fins are clearly evident.
Fig.4.6 bis : Dorsal view of the individual ELAME537-09 of M. mustelus collected from the Sicilian Channel (LT 40-50 cm). The dorsal black spots and a prominent band of dark bare ceratotrichia in both dorsal fins are absent.
Fig.4.6: Dorsal view of the individual ELAME536-09 of M. mustelus collected from the Sicilian Channel (LT 40-50 cm). The dorsal black spots and a prominent band of dark bare ceratotrichia in both dorsal fins are absent.
The Mustelus specimens collected in the Adriatic Sea are smaller in size than those collected form the Sicilian Channel (mostly juveniles and sub-adults). The M.
punctulatus specimens didn’t show up the dorsal black spots (condition probably due to
the small size of the animals); most of them showed few, barely visible or absent spots (Fig.4.7; Fig.4.8). On the contrary, the dark band in the trailing edge of the first dorsal fin was always present. The M. mustelus specimens showed the typical species-specific diagnostic features, i.e. no spots and no dark band in the dorsal fin (Fig.4.9).
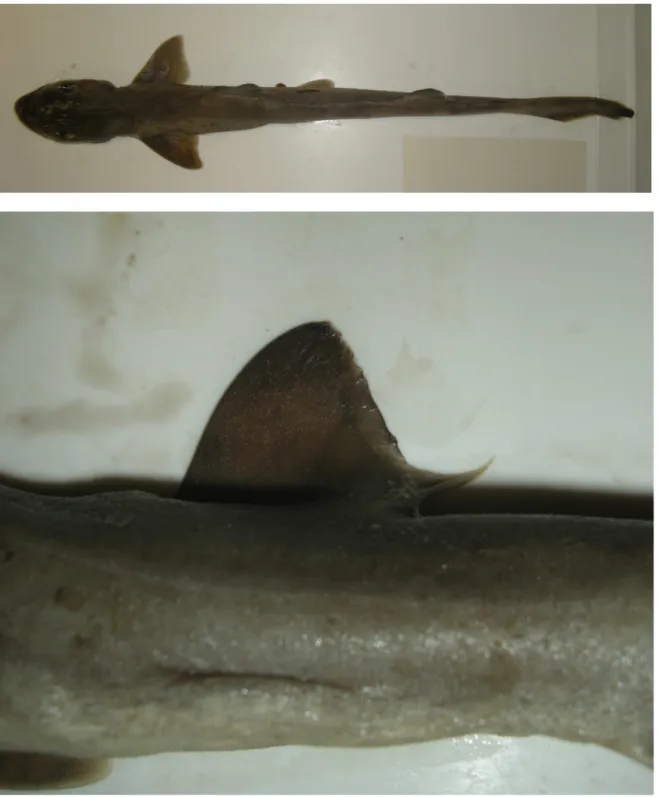
Fig.4.7: Dorsal view (above) and dorsal fin detail (below) of the ELAME1015-11 juvenile specimen (27.5 cm LT) of blackspotted smooth-hound Mustelus punctulatus collected from the NC Adriatic Sea. There are no visible black spots, while the dorsal fin presents a clear dark band
Fig.4.8: Dorsal view (above) and dorsal fin detail (below) of the ELAME990-10 juvenile specimen (33 cm LT) of blackspotted smooth-hound Mustelus punctulatus collected from the NC Adriatic Sea. The black spots are lacking while the dorsal fin has a dark band in the posterior edge of the dorsal fin
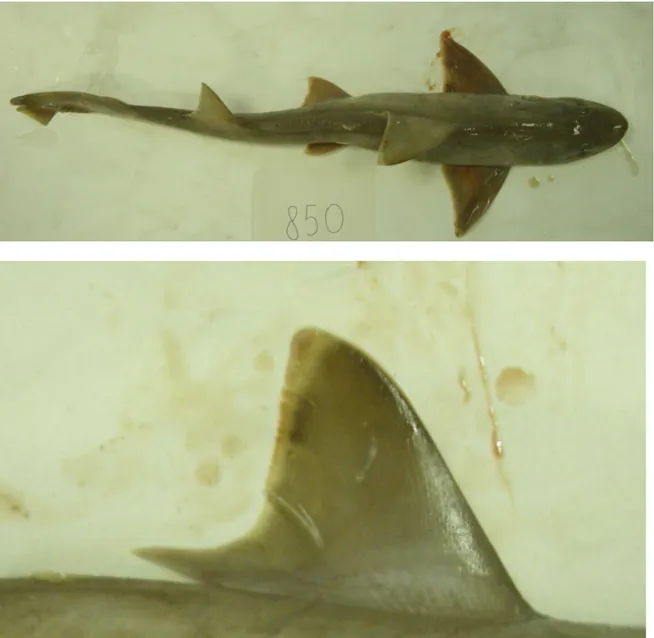
Fig.4.9: Dorsal view (above) and dorsal fin detail (below) of the ELAME1054-11 juvenile specimen (57 cm LT) of common smooth-hound Mustelus mustelus collected from the NC Adriatic Sea. The colouration of the dorsal fin edge clearly indicates the lack of dark band.
4.2. SURVEY DATA ANALYSIS
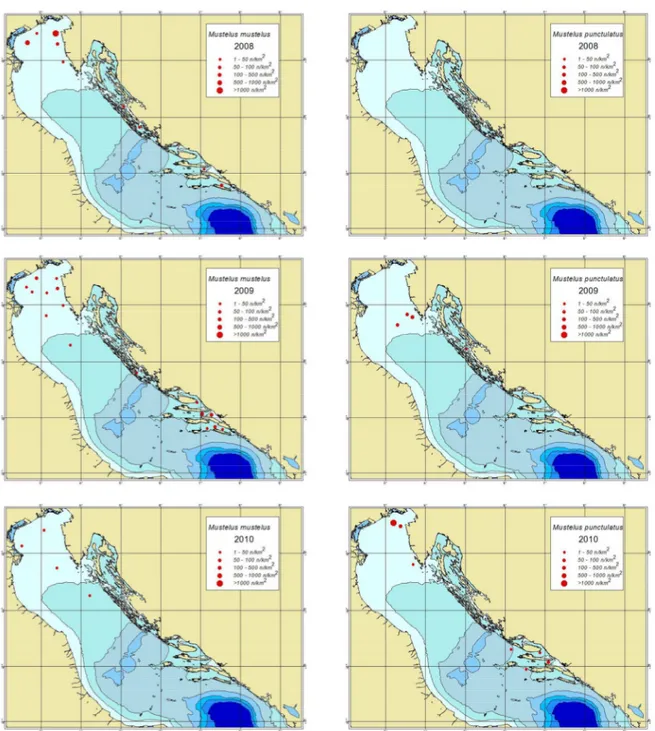
A total number of 208 specimens of the genus Mustelus were collected from the MEDITS survey of the years 2008 (N=103) and 2010 (N=105) distributed in 13 hauls in the North-Central Adriatic Sea (N=187; along the Italian and Balkan Peninsula coasts), in the Sicilian Channel (N=15) and Algerian coasts (N=6).
Using the individual barcode ID, I verified the survey data to assess the individual distribution in the collecting areas by plotting the haul coordinates in the BOLD Geographic Information System. From this analysis it appears that the two smooth-hound shark species in the NC Adriatic were never collected in the same haul except in one case in front of the Gulf of Venice (Lat 45.3973; Lon 12.6638) where their distributions partially overlap. This evidence is strongly supported by the barcode ID of the individuals collected in the numerous hauls of the MEDITS 2008. However, the barcode ID of the individuals collected in the less numerous hauls positive to the
Tab.4.2: Details (number of specimens, geographical area and coordinates) of the common and blackspotted smooth-hound sharks collected during the MEDITS 2008 (N=103). [*=hybrid individual finding]. Since the Algerian specimens have been collected at Algiers fish market, they are not to be considered caught in the same haul.
REGION FAO FISHING AREA COORDINATES (Lat-Lon) M. mustelus (n) M. punctulatus (n)
Adriatic Sea (Marches, Italy) 37.2.1-Adriatic 43.8995-13.1328 3 Adriatic Sea (Marches, Italy) 37.2.1-Adriatic 43.9253-13.1915 1 Adriatic Sea (Marches, Italy) 37.2.1-Adriatic 44.098-12.7368 1
Adriatic Sea (Veneto, Italy) 37.2.1-Adriatic 45.3073-12.6638 30* 1 Adriatic Sea (Veneto, Italy) 37.2.1-Adriatic 45.3118-13.1058 15 Adriatic Sea (Veneto, Italy) 37.2.1-Adriatic 43.9-13.769 1
Adriatic Sea (Croatia) 37.2.1-Adriatic 45.4667-13.3667 22 Adriatic Sea (Croatia) 37.2.1-Adriatic 45.2833-13.4167 1 Adriatic Sea (Croatia) 37.2.1-Adriatic 44.1833-15.0667 1 Adriatic Sea (Croatia) 37.2.1-Adriatic 43.8167-15.4667 1 Adriatic Sea (Croatia) 37.2.1-Adriatic 42.7833-17.5333 1* Adriatic Sea (Croatia) 37.2.1-Adriatic 44.9667-13.5555 1 Adriatic Sea (Croatia) 37.2.1-Adriatic 43.3833-16.7 2 Adriatic Sea (Croatia) 37.2.1-Adriatic 43.4167-16.2333 1
Sicilian Channel 37.2.2-Ionian 37.477-11.895 10
Sicilian Channel 37.2.2-Ionian 37.576-12.326 1 Sicilian Channel 37.2.2-Ionian 37.292-12.067 4 Algeria 37.1.1-Balearic 37.564-3.555 1 5
Tab.4.3:Details (number of specimens, geographical area and coordinates) of the common and blackspotted smooth-hound sharks collected during the MEDITS 2010 (N=105). [*=hybrid individual finding].
Fig.4.11: BOLD distribution maps of M. mustelus (left) and M. punctulatus (right) specimens collected during the MEDITS 2010
Fig.4.10: BOLD distribution maps of M.mustelus (left) and M. punctulatus (right) specimens collected during the MEDITS 2008
s
REGION FAO FISHING AREA COORDINATES (L at-Lon) M. mustelus (n) M. punctulatus (n)
Adriatic Sea (Veneto, Italy) 37.2.1-Adriatic 44.1515-14.1330 1
Adriatic Sea (Veneto, Italy) 37.2.1-Adriatic 44.410-23.580 1
Adriatic Sea (Veneto, Italy) 37.2.1-Adriatic 31.630-12.110 98*
Adriatic Sea (Veneto, Italy) 37.2.1-Adriatic 45.2361-13.0412 1 Adriatic Sea (Veneto, Italy) 37.2.1-Adriatic 45.0725-12.3083 2 Adriatic Sea (Veneto, Italy) 37.2.1-Adriatic 45.3733-12.5883 1 Adriatic Sea (Veneto, Italy) 37.2.1-Adriatic 45.6605-12.4516 1
4.3. ITS2 ASSAY
To preliminary test the ITS2 assay, I genotyped via PCR amplification few individuals of M.
mustelus and of M. punctulatus (N = 5 for each species, individuals were selected based
on the barcode ID) using the ITS2 primer pairs. The PCR fluorescent–labelled amplicons of these individuals were resolved by capillary electrophoresis and, as expected, they sized at 184 bp and at 160 bp for M. mustelus and for M. punctulatus, respectively. In addition, I have also prepared few samples each obtained by mixing a M. mustelus and a
M. punctulatus DNA in order to have an artificial hybrid ITS2 160/184 bp genotype.
The electropherograms of these assays are reported in Fig.4.12. This results speak in favour of a good reliability of this assay for species-specific identification of parental
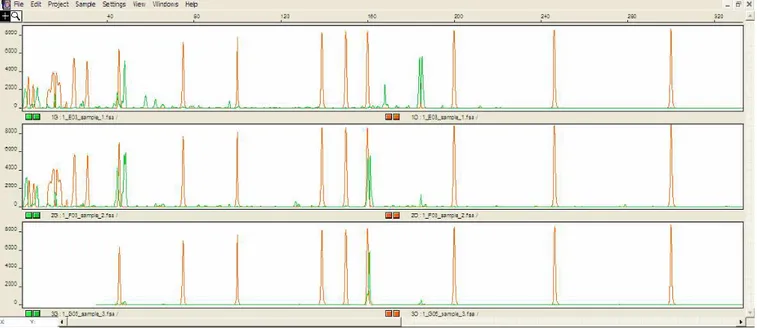
Fig.4.12: From the top to the bottom: capillary electrophoresis electropherograms showing the ITS2 genotypes (green peaks detected between 100 and 200 bp) of a M. mustelus (band sized at 184bp; 184/184), of an artificial hybrid with two bands sized at 160bp and 184bp (160/184) and of the M. punctulatus (band sized at 160bp; 160/160). The individual electropherograms are aligned in peak size of the LIZ internal standard (orange peaks). The double-peak pattern shown by most of the ITS2 bands is caused by the out of scale of the fluorescence intensity.
species (one band phenotypes, with M. mustelus genotype at ca. 184 bp and M.
punctulatus genotype at 160 bp) and of hybrid or gene introgressed individuals (two bands
phenotypes, with a 160/184 bp genotype). This assay was then used to genotype the 208
Mustelus individuals collected and barcoded.
From this analysis, 205 specimens showed the one-band phenotype and precisely 51 individuals that at 184bp (M. mustelus) and 154 at 160bp (M. punctulatus). In all these individuals, the ITS2 genotype was consistent with the barcode ID (see for some examples Fig.4.12bis).
Three specimens showed a two bands ITS2 phenotype (Fig.4.13.) suggesting a putative hybrid or gene introgressed nature of these individuals.
The first specimen (ELAME245-09) was an immature M. mustelus female collected along the Veneto coasts (Fig.4.14) during the MEDITS 2008 and exhibiting consistency between morphological and barcode ID. The second specimen (ELAME331-09) was identified morphologically as M. mustelus and then barcoded as M. punctulatus. This individual was collected near the Croatian coast (Fig.4.14.) during MEDITS 2008. For both individuals the picture was not available.
The third specimen (ELAME2016-11) was an immature male, identified as M. punctulatus either by morphological characters or by barcode. This individual was caught in the North Adriatic Sea during the MEDITS 2010 (Fig.4.14.) and the body appearance and the details of the dorsal fin colouration are reported in Fig.4.15.
A detailed analysis of the ITS2 phenotypes provided evidence for the consistency between the species ID obtained by barcode and the greater intensity of the ITS2 band. The individual ELAME245-09 (with barcode M. mustelus) showed a ITS2 phenotype in which the intensity of the M. mustelus band (184bp) was greater than that of the M. punctulatus band (this band was not sized at 160 bp but at 168 bp). On the other side, the two individuals ELAME331-09 and ELAME2016-11 (both barcoded as M. punctulatus) showed the higher band at 160 bp (i.e. the M. punctulatus band).
Fig.4.14: Collecting sites of the putatively hybrid or gene introgressed M. mustelus/punctulatus individuals
Fig.4.15: From the top to the bottom: Dorsal (above), ventral (below) and dorsal fin detail (right) of the specimen ELAME2016-11 exhibiting a two-band ITS2 phenotype.
5. DISCUSSION
Taxonomy and systematics in marine realm: near-extinct disciplines for preventing marine extinctions
There are currently no known global marine fish extinctions which perhaps surprising given the long history and large scale of fisheries exploitation (Pauly et al. 2002). Indeed, more than half of the world’s human population lives within the coastal zone and depends for their bulk protein intake and this proportion could increase in the next decades because of desertification (Roberts and Hawkins 1999). Human impacts on the world's oceans have been substantial, leading to concerns about the population decline and extinction of marine taxa. Based on a review of data on 133 extinction cases of marine organisms and populations, Dulvy et al. (2003) estimated that 1) there is typically a 53-year lag between the last sighting of an organism and the reported date of the extinction; 2) most disappearances (80%) were detected using indirect historical comparative methods (because of their low-detection power, these methods may lead to an underestimation of marine extinctions); 3) most of the marine species losses were caused by exploitation (55%), habitat loss (37%), while the remaining cases were linked to invasive species, climate change, pollution and disease. Marine species cannot be considered less vulnerable on the basis of biological attributes such as high fecundity or large-scale dispersal characteristics. For commercially exploited species, it is often argued that economic extinction of exploited populations will occur before biological extinction, but this is not the case for non-target species caught in multispecies fisheries (such as sharks in the demersal fishery) or species with high commercial value, especially if this value increases as species become rare.
One of the primary objectives of fisheries managers is to ensure sustainability in harvesting fish stocks and to avoid a depletion of these stocks. The severe decline of many commercial fish stocks in the last decades, however, and the slow or even failed