POLITECNICO DI MILANO
Scuola di Ingegneria Industriale e dell’Informazione Corso di Laurea Magistrale in Ingegneria Biomedica
A microstructural dosimetry model for the investigation
of SIRT treatment
Supervisor: Prof. Gabriele Angelo DUBINI Co-Supervisor: Ass. Prof. Johanne BEZY
Co-Supervisor: Ph.D. Elena CUTRI Co-Supervisor: Ph.D Monica PIERGIOVANNI
Authors:
Federico BUDELLI Matr. N. 900387 Veronica CARCERERI Matr. N. 877078
II
LIST OF CONTENTS
SUMMARY 1
CHAPTER 1 8
1. Introduction 8
1.1 Liver anatomy and functionalities 8
1.2 Hepatocellular carcinoma 15
2. State of the art 16
2.1 Treatments of hepatocellular carcinoma 16
2.2 Selective Internal Radiation Therapy (SIRT) 18
2.3 Current limitations to SIRT 23
2.4 State of the art about SIRT modelling 25
2.5 Dose absorption models 29
2.5.1 Partition model 31
2.5.2 BSA method 32
2.5.3 MIRD mono-compartment 33
2.5.4 Voxel based method 34
2.5.5 Dose-Voxel-Kernel (DVK)/ Dose-Point-Kernel (DPK) 35
2.5.6 Local deposition method (LDM) 36
2.6 The Monte Carlo method 39
2.6.1 Photon interaction processes 43
2.6.2 Electron interaction processes 47
2.6.3 Monte Carlo methods 49
2.6.4 Geant4 Application for Tomographic Emission (GATE) 50
CHAPTER 2 54
Material and methods 54
1. Lobule geometry 54
2. GATE 56
2.1 Set the visualization 58
2.2 World definition 58
2.3 Geometry definition 60
2.4 Physical processes setting 61
2.6 Source(s) definition 63
III
4. Simulation settings 67
4.1 Single lobule simulations 67
4.2 Single tumoral lobule simulation 71
4.3 Multi-lobule simulations 72
5. Output analysis 75
CHAPTER 3 78
Results and discussion 78
1. Single lobule simulations 78
1.1 Single lobule, SL-UNIF: one radioactive source in the middle of the hepatic
arterioles. 78
1.2 Single lobule, simulation SL-3M: three equidistant radioactive sources in
three hepatic arterioles 81
1.3 Single lobule, simulation SL-5M: five equidistant radioactive sources in
two hepatic arterioles 83
2. Single tumoral lobule simulation 88
3. Multi lobule simulations 91
3.1 Multi-lobule, simulation ML-UNIF uniform distribution of sources in
normal liver tissue 91
3.2 Multi-lobule, simulation ML-NOUNIF: non uniform distribution of
sources in normal liver tissue 94
3.3 Multi-lobule, simulation ML-MIX1: Tumor tissue and normal liver tissue
with sources mainly in the tumor tissue 96
3.4 Multi-lobule ML-MIX2: Tumor tissue and normal liver tissue with sources
mainly in the normal liver 98
CHAPTER 4 100
Conclusions 101
IV
LIST
OF
FIGURES
FIGURE PAGE
1Workflow of the project presented in this dissertation ………..4
1 Views of front and back surfaces of the liver ………... 9
2 Liver division into eight segments by the hepatic veins ……….………. 10
3 Human circulatory system with focus on the liver .….………... 11
4 Left: Major arteries sprouting from the celiac trunk. Right: Branching pattern of the por- tal vein ………..…………... 12
5 The liver lobule with central vein, portal triads and sinusoids ……….…... 13
6 Simplified model of the lobule………..……….…... 14
7 Injection of radioactive microspheres into the hepatic artery ..……….…... 18
8 Schematic representation of an arteriovenous shunt induced by the presence of an HCC ……….………... 22
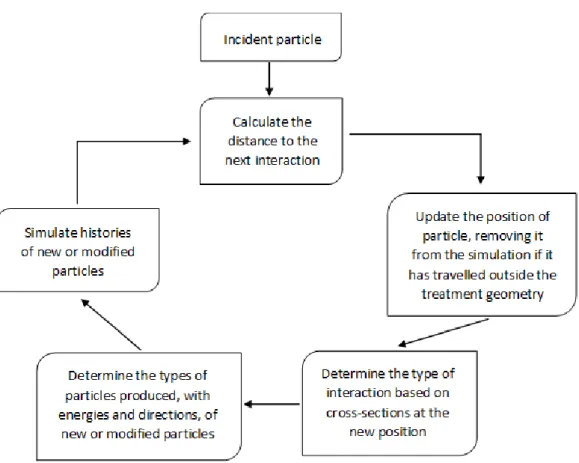
9 Flowchart describing the basic elements of a Monte Carlo simulation of charged particle transport ………...……….. 42
10 Relative importance of the three major types of photon interactions with photon energy and the atomic number of the attenuating material as parameters ……….. 43
11 Schematic representation of photoelectric effect ………... 44
12 Schematic representation of Compton scattering ………..…… 44
13 Schematic representation of Pair production effect ………..…… 45
14 Interaction of an electron with an atom, where a is the atomic radius and b is the impact parameter ……….…………..………. 47
15 A sketch of the hypothetical paths of an electron using single scattering and a condensed history approach ……….……….………... 49
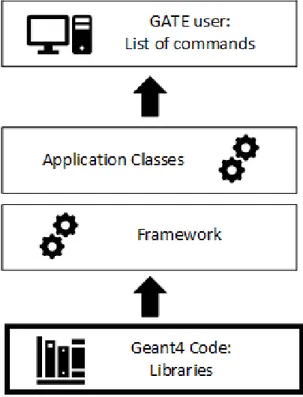
16 Structure of GATE ……….………...……… 51
17 Schematic representation of the lobule model with its geometric parameters ….……. 55
18 Layer Structure of GATE……….. 56
19 GATE visualization commands ….….………... 58
20 Description of liver material in GATE database .……….. 59
21 Front view of lobule model created in GATE...………. 67
V
LIST
OF
FIGURES
(
CONTINUED
)
FIGURE PAGE
23 SL-UNIF sphere configuration...……….. 68
24 SL-3M sphere configuration ……….……… 69
25 SL-5M sphere configuration ………..……….……….. 70
26 Description of the material implemented in the simulation, as well as described in GATE ……….………... 71
27 ML-UNIF, schematic representation of the 289 lobules obtained with GATE code... 72
28 ML-NOUNIF, schematic representation of the 289 lobules obtained with GATE code 73 29 ML-MIX 1, schematic representation of the 81 tumoral lobules ………... 74
30 ML-MIX 2, schematic representation of the 81 tumoral lobules ……..………... 75
31 Schematic representation of the 3D matrix output by GATE …..………..……. 76
32 Colormap of the dose distribution in the simulation UNIF ………... 80
33 Dose distribution trend through the slices in SL-UNIF simulation ..………..…... 81
34 Output colormaps for the SL-3M configuration..…..………... 82
35 Dose distribution trend through the slices in Simulation SL-3M ....………..…… 83
36 Output colormaps for the SL-5M configuration ……….... 84
37 : Dose distribution trend through the slices in Simulation SL-5M……….... 85
38 Ratio of the absorbed dose over the administered activity for the different simulations(namely SL-UNIF, SL-3M, SL-5M)………..………....………... 87
39 Colormap of dose distribution from region with higher initial activity to the center of the lobule of simulation SL-UNIF ...………...………... 88
40 Graph of dose profile highlights in Fig 39 ……….………..……….. 88
41 Colormaps of the dose distribution in pathological lobule case simulation ……….………...……… 90
42 Colormaps of the dose distribution in simulation ML-UNIF ...…………... 93
43 Dose distribution trend through the slices in simulation ML-UNIF ..……..………….. 93
44 Colormaps of the dose distribution in simulation ML-NOUNIF ...………. 94
VI
LIST
OF
FIGURES
(
CONTINUED
)
FIGURE PAGE
46 Colormaps of the dose distribution in simulation ML-MIX1 ..………..…… 96
47 Dose distribution trend through the slices in simulation ML-MIX1. ……….…. 97
48 Colormaps of the dose distribution in simulation ML-MIX2 …...………... 98
VII
LIST
OF
TABLES
TABLES PAGE
1 Properties of glass and resin 90Y microspheres ………...………. 20 2 Dimensions for each components of the lobule model ………. 55 3 90Y characteristics used in order to implement it as a source in GATE ……..………... 64 4 Comparison between the obtained total absorbed dose in UNIF and the results in the
literature ..………..………... 81
5 Comparison between the different obtained total absorbed dose for each simulation ... 86 6 Comparison between the absorbed dose values obtained in UNIF (healthy lobule ) and
with a lobule in pathological case ( tumor tissue ) ………...………...………... 90
7 Comparison between the absorbed dose values obtained in UNIF and in ML-UNIF
.………….………... 94
8 Comparison between the absorbed dose values obtained in ML-UNIF and in ML-NOUNIF
………..……….. 95
9 Comparison between the absorbed dose values obtained in ML-MIX1 and in ML-MIX2
VIII
LIST
OF
EQUATIONS
EQUATIONS PAGE
1 Definition of Biologically Effective Dose (BED)..…………..………. 29
2 Surviving fraction………...……….…………. 29
3 Equivalent dose at 2Gy/fraction………...….………... 30
4 Definition of Equivalent Uniform Biologically Effective Dose (EUBED)……..…... 30
5 Definition of Tumor to Normal liver ratio (TN) ………..…..…... 31
6 Definition of Activity through the partition model…………....……….……….. 31
7 Definition of Lung Shunt Fraction (LSF)...……….……...………... 32
8 Definition of Activity through the BSA method……….……….. 32
9 Definition of Body Surface Area (BSA)……….……….. 33
10 Adjusted activity for lobar treatment when calculated with BSA method...……...….... 33
11 Definition of Activity inside MIRD model………...……… 33
12 Dose delivered to the liver through MIRD method ……… 34
13 Definition of dose inside a voxel………..………..……. 35
14 Initial activity inside a voxel………….….………..…... 35
15 Activity inside a voxel derived from total liver counts……….………..…… 35
16 Convolution integral for dose calculation for Dose Voxel Kernel Method... ….…..…. 36
17 Definition of dose through the Local Deposition Model (LDM)..……….…. 37
18 Russell’s dose distribution kernel…...……….... 37
19 Linear Congruential Generator function………. .……….. 40
20 Probability distribution function .……….. 46
21 Photon path length………... 46
22 Attenuation coefficient for each voxel……...……….……… 46
23 Initial averaged absorbed dose……… 76
24 Total absorbed dose integrated over all time.……… 77
25 Simplification of the total absorbed dose over all time………...……… 77
26 Decay constant…….. ……….……… 77
27 Definition of absorbed dose as a function of energy and mass..……… 90
28 Definition of mass ………...…….. ……… 90
1
SUMMARY
The hepatocellular carcinoma (HCC) is the second (men) and sixth (women) most common cause of cancer-related death, due to its high incidence in developing countries and low curability. More than 700000 new cases appear every year and contributing factors to HCC are, mainly, chronic hepatitis (type B and C), in developing countries. In developed countries, the causes are more related to alcohol-related cirrhosis and obesity-related fatty livers.
Surgery is possible only for a small minority of all primary and metastatic intrahepatic tumors. The options for prolonged survival are chemotherapy, external beam radiation therapy (EBRT) transarterial chemoembolization (TACE) andradioembolization (RE), also referred to as Selective Internal Radiation Therapy (SIRT).
SIRT is a recently developed local treatment of intermediate and late stage HCC, which limits side effects and efficiently increases patients overall survival.
Specifically, such treatment consists in inter-arterial administering of radioactive microspheres, typically Yttrium-90 (90Y), via catheter directly into the hepatic artery upstream from the tumor which then are, ideally, captured by the denser and more consuming vessels arterial network of the tumor.
The activity can be delivered through two different kinds of microspheres, namely resin (SIR-Spheres®), or glass (Therasphere®) spheres.
The work presented in this dissertation is part of a larger project, led by the “Laboratoire Traitement du Signal et de l'Image” (LTSI) of the University of Rennes 1 (France). The overall aim of this project is to optimize the SIRT through the developing of a full, patient-specific simulation of the treatment.
The treatment protocol presents numerous steps that have not been optimized yet, and still depend on the radiologist’s decisions. The tools available for the radiologist with the aim of tumor targeting are indeed limited, and the treatment is not currently planned in a full patient-specific way. To this aim, accounting for the different parts involved in this multidisciplinary process is mandatory. Specifically, image processing and protocol optimization for the
2
extraction of patients data, simulation of the patients vasculature, simulation of blood flow and of microspheres transport, simulation of microspheres distribution at liver’s microscale and dose absorption will be taken into account. All the approved methods regarding the calculation of an absorbed dose assume that the distribution of microspheres is uniform. Based on recent observation it is not the case. The distribution of 90Y microspheres is never
uniform and the absorbed dose varies drastically on a microscopic scale. In the radioembolization treatment millions of individual sources are deposited inside the tissue. The deposition depends highly on numerous variables, like the blood flow and the catheter placement. This also impact on the release of the dose to the immediately adjacent tissues. The absorbed dose is therefore very heterogeneous when viewed on a microscopic scale and the non-uniformity at the microscale can lead to poor results of the treatment
In this context, the work here presented is devoted at the development of a microscale model of the liver based on a simplification of the hepatic lobule to investigate the dose delivered to the liver, analyzing then different scenarios (namely healthy and tumor liver), as well as different distributions of radioactive spheres in the lobules.
To this aim, an open source software, GATE, based on Monte Carlo method was used. The Monte Carlo method is a statistical approach of deriving a macroscopic solution to a problem by the use of random numbers. It involves the random sampling of probability distribution functions (PDFs) that describe the problem of interest. GATE offers well-validated physics models, geometry modeling tools, and visualization of
the simulated doses by a three-dimensional rendering.
Different simulations of the hepatic lobules were performed. First, single-lobule simulations were performed to account for different microspheres configurations (in terms of amount of initial activity and spatial distribution) and different materials (normal liver tissue / tumor liver tissue). Specifically, four scenarios were taken into account: 1) one radioactive source placed in the middle of each hepatic arterioles (SL-UNIF); 2) three equidistant radioactive sources placed in three hepatic arterioles (SL-3M); 3) five equidistant radioactive sources in two hepatic arterioles (SL-5M); 4) one radioactive source placed in the middle of each hepatic arterioles of a pathological lobule (SL-Tumoral). Subsequently, a multi-lobule geometry was used to evaluate the effect of sources placed in a bigger portion of tissue and how they affect the total absorbed dose. Also in this context, different microspheres scenarios and materials were analyzed: 1) one radioactive source placed in the middle of
3
each hepatic arterioles of every single lobule (ML-UNIF); 2) one radioactive source placed in the middle of each hepatic arterioles of 81 lobules, collocated in the upper right corner (ML-NOUNIF); 3) one radioactive source placed in the middle of each hepatic arterioles of 81 tumoral lobules and of 9 healthy lobules adjacent to the pathological ones (ML-MIX); 4) one radioactive source is placed in the middle of each hepatic arterioles of 81 healthy lobules and of 9 tumoral lobules adjacent to the normal ones (ML-MIX 2). For each simulation, the absorbed dose was evaluated to assess the local effects of the “injected” microspheres. Furthermore, the results obtained allowed to study the relationship between the initial administered activity and the related absorbed dose (Fig. I). When simulating the single lobule with different amounts of injected activity, a proportional relationship between the initial activity and the final absorbed dose was found. Then a single tumoral lobule was studied. Although with a not high discrepancy, the comparison of the results with respect to the ones regarding the healthy lobule showed a lower absorption of dose by the tumor tissue with respect to the healthy one. This behavior was expected due to the fact that the tumoral tissues are described as a denser tissue, as reported in literature. From the analysis of the multi-lobule simulations, new considerations were arrived at. The results indeed showed values of absorbed dose not proportionally related to the amount of initial activity set. This highlights the importance of the effect of the adjacent spheres placed in the surrounding lobules. In fact, considering a single lobule, this kind of effect is obviously neglected. On the contrary, in a multi-lobule configuration, the radiation from other sources placed in the lobules spread isotropically around each source, affecting and increasing the absorbed dose in all the others.
The investigation of the scenarios with the coexistence of healthy and tumoral lobules highlighted once again the difference in absorbed dose due to the presence of materials with different density.
On the basis of the results obtained, the models implemented in GATE proved to be valid and flexible, making especially the multi-lobule simulations an improvement to the current state-of-the-art regarding patient-specific models of SIRT treatment.
4
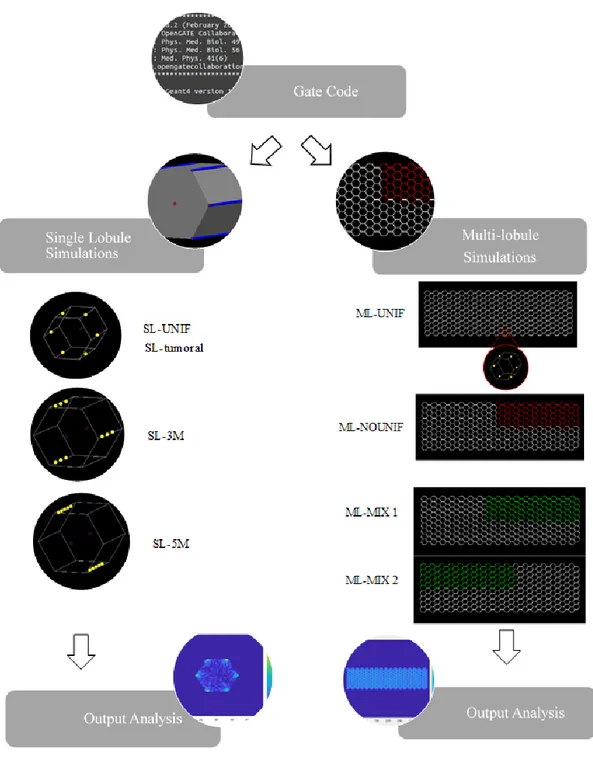
Figure I: Workflow of the project presented in this dissertation. First, the creation of the GATE code, in order to implement a microscale model of the liver based on a simplification of the hepatic lobule. Then, it
was applied for single lobule simulations generating the relative outputs. Finally, it was applied to multi-lobule simulations with the respective outputs.
5
SOMMARIO
Il carcinoma epatico primario, principalmente denominato carcinoma epatocellulare (HCC), è la seconda (uomo) e la sesta (donna) causa più comune di morte per cancro, a causa della sua elevata incidenza nei paesi in via di sviluppo e della sua bassa curabilità. Più di 700000 nuovi casi compaiono ogni anno e i fattori che contribuiscono all'HCC sono, principalmente, l'epatite cronica (tipo B e C), nei paesi in via di sviluppo. Nei paesi sviluppati invece le cause
sono maggiormente legate alla cirrosi ed all'obesità.
La chirurgia è possibile solo per una piccola minoranza di tumori intraepatici primari e metastatici. Le opzioni per una sopravvivenza prolungata sono la chemioterapia, la chemioembolizzazione transarteriale (TACE), la radioterapia a raggi esterni (EBRT) e la radioembolizzazione (RE), nota anche come SIRT (Selective Internal Radiation Therapy). Il SIRT è un trattamento locale recentemente sviluppato per la cura dell’HCC intermedio e in fase avanzata, che limita gli effetti collaterali e aumenta efficacemente la sopravvivenza
globale dei pazienti.
In particolare, tale trattamento consiste nella somministrazione inter-arteriosa di microsfere radioattive, tipicamente ittrio-90, attraverso un catetere posizionato direttamente nell'arteria epatica a monte del tumore. Queste ultime vengono quindi, idealmente, catturate dalla rete
più fitta di vasi che irrora la parte di tessuto tumorale.
L'attività può essere somministrata attraverso due diversi tipi di microsfere: sfere di resina
(SIR-Spheres®) o di vetro (Therasphere®).
Il lavoro presentato in questa tesi è incluso in un più ampio progetto, guidato dal "Laboratoire Traitement du Signal et de l'Image" (LTSI) dell’Università 1 di Rennes (Francia). Lo scopo di questo progetto è quello di sviluppare una simulazione completa e paziente-specifica del trattamento SIRT. Il protocollo per il trattamento presenta numerosi passaggi che non sono tuttavia stati ottimizzati e dipendono ancora dalle decisioni del radiologo. Gli strumenti a disposizione del radiologo con l'obiettivo del targeting specifico del solo tumore sono davvero limitati e il trattamento non è attualmente pianificato in modo tale da essere paziente-specifico.
Per questo obbiettivo è necessario prendere in considerazione tutti i suoi passaggi multidisciplinari: elaborazione delle immagini e ottimizzazione del protocollo per l'estrazione dei dati del paziente, simulazione del sistema vascolare del paziente, simulazione
6
del flusso sanguigno e conseguente trasporto nei vasi delle microsfere, simulazione della distribuzione delle microsfere a livello microscopico all’interno del fegato e assorbimento della dose.
Tutti i metodi approvati riguardanti il calcolo della dose assorbita assumono una distribuzione uniforme di microsfere. Tuttavia, da recenti osservazioni, la distribuzione di microsfere non si presenta mai uniforme e la dose assorbita varia drasticamente in scala microscopica.
In tale contesto, il lavoro qui presentato si concentra sullo sviluppo di un modello alla micro-scala del fegato basato su una semplificazione del lobulo epatico, con l'intento di studiare le radiazioni assorbite dal fegato.
Al fine di raggiugere questo obbiettivo, è stato utilizzato un software basato su un codice
Monte Carlo.
Il metodo Monte Carlo è un approccio statistico per derivare una soluzione macroscopica ad un problema mediante l'uso di numeri casuali. Esso implica il campionamento casuale di funzioni di distribuzione di probabilità (PDF) che descrivono il problema di interesse. GATE offre modelli fisici ben validati, strumenti di modellazione geometrica e di visualizzazione della dose simulata tramite rendering tridimensionale.
Sono state quindi effettuate diverse simulazioni. Innanzitutto, sono state prese in considerazione le simulazioni su un singolo lobulo con diverse configurazioni di microsfere (in termini di quantità di attività iniziale e distribuzione spaziale) e diversi materiali (tessuto epatico normale / tessuto epatico tumorale). Nello specifico, sono stati indagati quattro scenari: 1) disposizione di una sfera radioattiva in ogni arteriola del lobulo (SL-UNIF); 2) disposizione di tre sfere equidistanti in tre arteriole epatiche (SL-3M); 3) disposizione di 5 sfere radioattive in due arteriole epatiche (SL-5M); 4) disposizione di una sfera radioattiva in ogni arteriola di un lobulo tumorale (SL-Tumoral).
Successivamente, differenti configurazioni sono state eseguite su di una geometria multi-lobulo, in modo da valutare l’effetto delle microsfere radioattive su di una superficie epatica maggiore. Anche in questo caso sono stati analizzati scenari differenti: 1) disposizione di una sfera radioattiva nel mezzo di ogni arteriola di ogni singolo lobulo (ML-UNIF); 2) disposizione di una sfera radioattiva nel mezzo di ogni arteriola di 81 lobuli (ML-NOUNIF); 3) disposizione di una sfera radioattiva nel mezzo di ogni arteriola di 81 lobuli tumorali e 9
7
lobuli sani adiacenti a questi (ML-MIX 1); 4) disposizione di una sfera radioattiva nel mezzo di ogni arteriola di 81 lobuli sani e 9 lobuli tumorali, adiacenti a questi (ML-MIX 2). Per ciascuna simulazione sono stati quindi studiati i valori della dose assorbita nelle geometrie al fine di quantificare gli effetti locali delle microsfere "iniettate". Inoltre, i risultati ottenuti hanno permesso di studiare la relazione tra l'attività iniziale somministrata e la relativa dose assorbita.
Facendo riferimento alle simulazioni in un singolo lobulo, variando la quantità di attività inziale, è stata riscontrata una relazione proporzionale tra questa e la dose finale assorbita. Successivamente, è stato preso in considerazione il caso di un singolo lobulo in condizione patologica (tessuto tumorale). Il confronto dei risultati tra la suddetta simulazione e quelle precedentemente effettuate (lobulo composto da tessuto sano) hanno mostrato un valore di dose assorbita finale inferiore. Questo comportamento trova spiegazione nel fatto che, come riportato in letteratura, il tessuto tumorale è descritto come materiale con una più alta densità. Dall’analisi dei risultati ottenuti dalle simulazioni multi-lobulo, si è giunti invece a nuove considerazioni.
I valori di dose assorbita ottenuti mostrano infatti una non più lineare relazione tra il dosaggio e la dose totale assorbita. A differenza del caso del singolo lobulo, le microsfere infatti emettono radiazioni in modo omogeneo in tutto lo spazio, influenzando ed aumentando in tal modo la dose assorbita totale nei lobuli attigui.
Dall’analisi delle simulazioni multi-lobulo con la compresenza di tessuto sano e tessuto tumorale, è stata nuovamente dimostrata una differenza di dose assorbita causata dalla presenza di materiali con diversa densità.
Sulla base dei risultati ottenuti, i modelli implementati in GATE dimostrano di essere validi e facilmente modificabili in relazione alle configurazioni desiderate, rendendo specialmente le simulazioni multi-lobulo un miglioramento all’attuale stato dell’arte riguardante i modelli paziente-specifico di SIRT.
8
CHAPTER 1
1. Introduction
1.1 Liver anatomy and functionalities
Liver is the largest internal organ of the human body, accounting for approximately 2% to 3% (1,5 kg) of the total body weight of an adult, and is located in the upper right corner of the abdomen, below the lungs and the heart, and to the right of the stomach, intestine and spleen. In addition or because of its specific location and anatomy, the liver is one of the organs that handle the highest number of functions. The liver has indeed three main types of roles for synthesis, breakdown of molecules and storage. Firstly, the liver handles the synthesis of many molecules either by the metabolism of some or by the secretion of others (carbohydrates, proteins, fats). Secondly, the liver handles the breakdown of some molecules, in particular some drugs, hormones and toxins. Finally, the liver has also a storage role for many vitamins, glucose and iron [1][2].
9
It is divided into four lobes. On the anterior surface, the falciform ligament marks the boundary between the left lobe and the right lobe. Then, the groove of the vena cava allows to divide the right lobe from the small caudate lobe; inferiorly to the latter there is the square lobe, between the left lobe and the gall bladder [3] (Fig 1).
10
As shown in Fig. 2, liver is often divided in eight anatomical segments that amount to independent vascular regions. These anatomical segments are especially relevant for surgical resection in case of tumoral lesions.
The liver is a very vascularised organ and its vasculature is peculiar, due to its double blood supply. Indeed, it is uniquely divided between the hepatic artery, which contributes for the 25% to 30% of the blood supply, and the portal vein, which is responsible for the remaining 70% to 75% (Fig. 3). The former provides the liver with the oxygen, and the latter supplies the liver with the nutrients coming from the intestine. The portal vein brings about 1050 milliliters per minute, while additional 300 milliliters flow through the hepatic artery, for a total amount of about 1350 ml/min, which makes approximately 27% of the total cardiac output [3].
11
Hepatic artery takes origin from the celiac trunk, an artery bifurcating from the descending aorta before the renal arteries (Fig. 4). Before the bifurcation leading to the proper hepatic artery, the celiac trunk divides into the left gastric artery and next to the splenic artery. The section after this bifurcation is called the common hepatic artery. From the latter the gastroduodenal, the supraduodenal and the right gastric arteries sprout. Next, this same vessel is called the proper hepatic artery, and it further divides into left and right hepatic arteries, the latter being usually larger than the former, due to the volume proportion between the two lobes [4].
As illustrated in Fig. 4, the portal vein forms from the confluence of the superior mesenteric vein and splenic vein behind the neck of the pancreas. At the porta hepatis, the portal vein bifurcates into right and left branches before entering the liver. Then they branch and
12
rebranch within the liver to form a system that travels together in a conduit structure, the portal canal. From this portal canal, after numerous branching, the portal vein finally drains into the sinusoids, which is the capillary system of the liver. Here, in the sinusoids, blood from the portal vein joins with blood flow from end-arterial branches of the hepatic artery. Once passed through the sinusoids, blood enters the collecting branch of the central vein, and finally leaves the liver via the hepatic vein.
13
The structure with portal canals draining into one central vein, is defined as a lobule (Fig. 5). It is the functional units of the liver and each lobe contains 100000 of them.
In general, each lobule contains one hepatic centrilobular vein and a number of portal tracts. A portal tract is composed of a hepatic artery, a portal vein and a bile duct. Both hepatic artery and portal vein distribute blood to the liver lobule via an irregular capillary network (sinusoids). Each sinusoid is lined with fenestrated endothelial cells that allow exchange of fluid and some metabolic substances between the sinusoids and the liver cells, called hepatocytes. Blood flow from the portal tract and through the sinusoids into the hepatic centrilobular vein undergoes repeated anastomoses with other hepatic centrilobular veins from different lobules to form a sublobular vein, and these veins merge together to form the hepatic vein, draining blood back to the heart via the inferior vena cava.
The number and the arrangement of the lobular vessels (centrilobular veins and portal tracts) in the histological sections are often irregular, and so over time a simplified model of the lobule has been proposed [1][2][3].
14
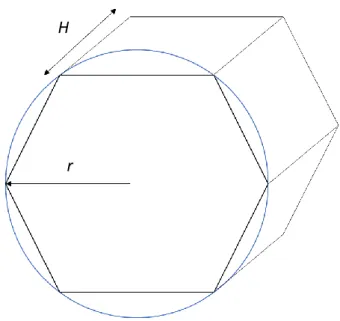
It is usually described as a classic 3D hexagon, with radius (r) of 0.6 mm and height (H) of 1.5 mm (Fig. 6). The centrilobular vein, set in the middle of the hexagon, has a diameter of 0.66 mm and the portal tracts are composed by the portal vein and the hepatic artery (with a diameter of 0.05 mm) [1][6].
It should be noted that the anatomy described above represents the standard pattern, but many kind of anomalies exist in number, size or position of this structure.
r H
15
1.2 Hepatocellular carcinoma
HCC represents approximately 90% of all cases of primary liver cancer and it the fifth most common malignant tumor in men, the eight in women, with more than 800000 new cases worldwide per year [14]. Incidence rates vary widely between geographical regions and are highest in East Asia and Sub-Saharan Africa, where approximately 85% of all cases occur and the major contributor is the presence of hepatitis B. Nevertheless, also in Western countries with relatively low incidence rates, such as United States and Europe, incidence has increased in the last decade. In such countries the development of an HCC is mainly related to alcoholism, hepatitis C and non-alcoholic fatty liver disease [12].
Even if the portal vein contributes to 80% of the hepatic blood supply, a peculiarity of HCC is that it is mainly vascularized by the hepatic artery. Indeed, like most common cancers, HCC is a highly vascularized tumor. Neoplastic tissue requires a supply of oxygen and nutrients. Thus, avascular solid tumors only grow to a certain size and then undergo regression, if their metabolic demands are not met. For continued growth, it is necessary for a tumor to orchestrate the formation of a functioning system of blood vessels, which allows the delivery of metabolites (including growth factors) and cells (immunological cells and other cellular precursors) to the tumor environment. This arterial hypervascularization of HCC is the reason why the arterial supply of blood flow within the tumor is 3 to 7 times greater than in the surrounding noncancerous tissue [14].
According to the American Join Committee on Cancer, the classification of different stages of the tumor is based on microvascular invasion and tumor size. Four principal stages exist
[19]:
• T1: the tumor is isolated and does not present any microvascular invasion.
• T2: multiple lesions smaller than 5 cm appear, or the tumor presents some microvascular invasion.
• T3a: multiple lesions bigger than 5 cm appear.
• T3b: invasion of a major branch of the portal vein or hepatic vein. • T4: direct invasion of adjacent organs or perforation of the peritoneum.
16
2. State of the art
2.1 Treatments of hepatocellular carcinoma
Unfortunately, the diagnosis of HCC is too often made with advanced disease when patients have become symptomatic and have some degree of liver impairment. At this late stage, there is no effective treatment that would improve survival. But, with proper screening and vigilance, many patients can be diagnosed with early disease and preserved liver function. Currently, there are several treatment options, both surgical and nonsurgical, that can have a positive impact on survival [1]. For a tumor in an early stage the possibilities are liver
transplantation, resection or percutaneous ablation by radiofrequency or microwave. Intermediate or advanced stage HCC can be treated with chemotherapy or the administration of chemoembolization through the vascular path. Radiotherapy can be administered (also as
adjuvant to other treatments) at any stage of an HCC.
Surgical resection is the accepted treatment of choice for noncirrhotic patients and offers the best curative rate with a 5-year survival of 41%–74%. The resect ability of the tumor is dependent on the tumor size, location, underlying liver function, and whether or not the remaining liver volume will allow for resection without drastically increasing postresection morbidity and mortality. The candidates for this therapy are patients with a solitary tumor confined to the liver, no radiologic evidence of vascular invasion, and well-maintained liver function.
Liver transplantation is the treatment of choice in cases of HCC limited to the liver that cannot be submitted to surgical resection due to poor hepatic function or to technical impossibility. Liver transplantation not only eliminates the neoplasia but can also cure the base liver disease. Nevertheless, based on surgical data, the ideal candidate for liver transplantation is a patient with a single HCC smaller than 5 cm or with up to 3 nodules, none of them larger than 3 cm, without signs of neoplastic invasion of the portal system or of distant metastases. Despite its advantages, the procedure also involves some disadvantages. The lack of donors with a consequent increase in the time on the waiting list, the high cost of the procedure, the possibility of tumor recurrence and the frequent postoperative infections. With regards to the radiotherapy, the major limitation is the risk of causing radiation-induced liver disease. Therefore, it is important to develop local and
17
regional treatments. The peculiar vascularization of the liver has allowed the development of intra-arterial type therapies which allow the drugs to be administered selectively within the tumor via the hepatic artery system, minimizing the effects on the healthy parenchyma which is instead vascularized mainly by the portal system. These techniques include: intra-arterial injection of chemotherapeutic agents, radio-labeled particles, or non-reactive particles, with the only aim of embolization, i.e. of preventing the blood from delivering nutrients to the cancerous cells. Trans Arterial Chemo Embolization (TACE) is thus considered as the gold standard for treating intermediate stage HCC. It consists in the infusion of chemotherapeutic agents via the hepatic arterial blood supply, through a percutaneously placed trans-arterial catheter. Usually, it is then followed by a selective arterial embolization of the tumor vascular supply. Despite its advantages (decrease in tumor size between 10% and 60% of the original volume), complications in postembolization syndrome are present and severe and they include abdominal pain, nausea, ileus, and fever. A valid alternative is represented by Trans-Arterial Radio Embolization (TARE): it consists of the selective intra-arterial administration of microspheres loaded with a radioactive compound such as 90Y or Lipiodol labeled with iodine by means of a percutaneous access. The latter is strong limited by the emission of high energy gamma radiation. On the other hand, 90Y is mostly used. Indeed, it is a pure β rays’ emitter with a maximum energy of 2.27 MeV and a mean of 0.9367 MeV [22][26]. It has been shown that TARE techniques have a far less embolizing characteristics than TACE and globally it gives equivalent results for early and intermediate stage HCC, with moreover fewer side effects [22].
18
2.2 Selective Internal Radiation Therapy (SIRT)
Selective Internal Radiation Therapy (SIRT) falls within the TARE framework. It is a radioembolization therapy during which microspheres containing radioactive 90Yare
administered through a microcatheter placed in the hepatic arterial vasculature to irradiate liver tumors from within. This therapy exploits the peculiar vascularization of the HCC: liver tumors are almost exclusively vascularized by the hepatic artery, whereas the healthy liver tissue receives most of its blood supply from the portal vein. Therefore, following the administration in the hepatic artery, microspheres will be carried preferentially toward distal arterioles in and around tumors (Fig. 7).
Clusters of microspheres are formed inside and in the periphery of the tumors, where they emit high energy β-radiation to induce cell death, while relatively sparing the healthy liver tissue [27].
19
Microspheres continue to emit radiations during several weeks after injection, but radiation intensity decreases quickly to insignificant levels. The half-life of 90Y is 64.1 hours, and 94% of the dose is emitted in 11 days while it decays to stable Zirconium-90 [28]. 90Y is produced by bombardment of Yttrium-89 (89Y) with neutrons in a nuclear reactor. Indeed, 90Y is a pure (99.99%) β-emitter, with maximum and mean beta particle energy of 2.28 MeV and 0.934 MeV, respectively. It also produces 0.01% of 1.7 MeV photons along the way [12]. Beta decay (β-decay), otherwise called beta-minus decay happens in the nucleus of an atom. During β-decay, one of the neutrons in the nucleus turns into a proton and produces an electron. The electron that is created is a fast-moving electron that is released from the atom. These fast-moving electrons are called β-particles.
Atoms experience radioactive decay on the grounds that they are unstable. In particular, an atom that undergoes β-decay often has more neutrons in the nucleus than protons, making it unstable. By β-decaying, the atom can achieve a more stable arrangement of its protons and neutrons. This process gives off radiation in the form of β-particles or high-energy β-rays. In the case of 90Y, the β-decay is described in this way:
𝑌90 → 𝑍90 + β−
The maximum and mean penetration ranges of the β-particles are 11 mm and 2.5 mm, respectively, in water or soft tissue [28].
In patients with HCC, SIRT is generally reserved for patients with intermediate and early advanced diseases stages [27]. These are patients with large multinodular tumors, with or without macrovascular invasion or sufficient liver function.
Radioembolization is a minimally invasive, image-guided, locoregional alternative, or adjunct to more conventional therapies such as surgery, chemotherapy and external beam radiation therapy (EBRT). The advantages of this treatment are the targeted delivery of a very high radiation-absorbed dose to tumors, with limited systemic side effects and hepatotoxicity [26][29].
SIRT can be delivered through two different kinds of microspheres: glass 90
Y-microspheres (Theraspheres®, Nordion Inc. for BTG International, Ottawa, ON, Canada) and resin 90Y-microspheres (SIR-Spheres®, Sirtex Medical Limited, North Sydney,
20
Glass microspheres are produced by incorporating 89Y into the glass matrix of the microsphere and subsequent activation by neutron bombardment in a nuclear reactor facility. Compared to the others, Theraspheres® have a relatively high density and a high activity per sphere, such as 2500 Bq. Therefore, 10-20 times less particles need to be injected than with resin one to administer the same treatment activity. Consequently, the embolic effect is much smaller during the injection and the duration of the intervention lasts 2 – 5 minutes. On the other hand, the production process of resin microspheres is different. Indeed, 90Y
cations in solution are chemically incorporated onto the bland microsphere surface. Because of this process, resin particles have a much lower density than glass one and lower activity per sphere, 50 Bq (Table 1).
Furthermore, the relatively low specific activity requires injection of a higher number of microspheres. Since this involves a greater embolic effect, stasis of blood flow may occur during administration. Hence, resin 90Y-microspheres must be administered carefully by hand injection in smaller aliquots and the duration of the intervention can take up to 30 – 35 minutes in total [26][30].
Characteristics Glass Microspheres Resin Microspheres
Trade Name Theraspheres® SIR-Spheres®
Diameter (µm) 20 – 30 20 – 60
Specific gravity (g dl-1) 3.6 1.6
Specific activity (Bq/sphere) 2500 50
Material Glass with 90Y in matrix Resin bound with 90Y
21
SIRT delivery requires truly multidisciplinary team approach involving nuclear medicine, interventional radiology and oncology. Radiologists assess liver tumor and extra-hepatic disease using computerized tomography (CT) or magnetic resonance imaging and interventional radiologists performed the required angiographies. Nuclear medicine and medical physics assist in SIRT dosimetry, delivery and radiation protection, while oncologist provide ongoing patient care [31].
The current protocol for the treatment of HCC involves different steps.
First, a cross-sectional pretreatment imaging is used for the evaluation of the liver parenchyma, vasculature and localization of liver tumors, their dimension and their relationship with surrounding vessels. CT and magnetic resonance imaging (MRI) play an important role. CT is faster, cheaper and higher in spatial resolution but nowadays the use of MRI is also increasing thanks to its less invasive nature and superiority in terms of soft-tissue contrast.
Subsequently, a preparatory angiography is performed through the injection in the liver arteries of an iodine-based contrast media and the consecutive acquisition of a 3D rotational Cone Beam CT-scan. The aim is to map the arterial anatomy and to determine the optimal injection point in the arteries.
The choice of this point is currently validated by the injection of a particular kind of human proteins, which are likely to imitate the behavior of the microspheres in its transport by blood
[32]. Such protein is Technetium 99mTc albumin macroaggregate (99mTc-MAA). Furthermore,
through a SPECT-CT, is estimated hepato-pulmonary shunt (Fig. 8) and an unintentional extrahepatic deposition.
22
This diagnostic angiography also permits to determine the dosimetry. Indeed, the intrahepatic scout dose distribution should ideally be a good predictor for the treatment distribution, since determining the particle distribution in tumorous and nontumorous tissue (T/N ratio) would enable a patient-tailored treatment strategy [33]. The pretreatment activity/dosimetry calculations will be detailed in paragraph 2.6 then considered in detail. Following this pretreatment workup, the intervention procedure is typically scheduled in 1-2 weeks. During treatment, radioactive microspheres should be administered at the same catheter position as during the preparatory angiography unless contraindications were discovered from the scout dose simulation.
Another SPECT/CT is then acquired to observe microspheres distribution and finally the SIRT efficacy is assessed by morphologic and functional imaging (MRI, CT) performed every 2 or 3 months.
23
2.3 Current limitations to SIRT
When performing the SIRT, the physicians have to face multiple clinical difficulties. Firstly, the choice of the injection point is of utmost importance to target the tumor and to avoid the delivery of the dose to healthy tissue. To this aim, the injection point is currently validated by the injection of a 99mTc-MAA. The choice of injection point is performed by the radiologist without any technological help, making it difficult to be reproducible and subject to human error.
Secondly, the potential extra-hepatic uptake, namely to the lungs or the digestive tract must be assessed. Indeed, it is essential that the lungs don’t receive more than 50 Gy as cumulated radiation dose. A planar scintigraphy after the administration of 99mTc-MAA is also used to calculate the risk of extra-hepatic uptake of radioactive microspheres. Nevertheless, in patients with relatively hypovascular liver tumors, it has been demonstrated that the use of
99mTc-MAA itself leads to an overestimation of the true liver-to-lung shunting, probably due
to the differences in particle characteristics, the broad range of 99mTc-MAA size and circulating free pertechnetate [37] [38].
In this context, it has also been noticed that difference in particle characteristics between
99mTc-MAA and 90Y-microspheres, including different particle size, density, shape and
number, strongly affects the particle distribution and consequently the calculation of the activity to be injected. [37][38].
Nevertheless, on the other hand, many authors have recently evaluated the validity of the administration of 99mTc-MAA in patients with markedly hypervascular HCCs. Indeed, in
these cases the preferential tumoral blood flow is so strong that the differences in particle characteristics have less influence, making the 99mTc-MAA distribution a more reliable
predictor [106][107][108][109].
However, in spite of variable correlation between 99mTc-MAA and 90Y microspheres in the literature, the majority of authors agree that 99mTc-MAA is a good option for treatment planning and predictive dosimetry.
Lastly, the evaluation of the exact activity (or dosage) to be injected. This point plays an important role, since the dosage of 90Y has a weak correlation to the absorbed dose that will be received by the patient’s tumor, normal hepatic parenchyma, or extra hepatic tissues. Factors such as liver and tumor volume, lung shunt fraction (LSF) and catheter position form the complex relationship relating dosage to absorbed dose in a particular tissue. Commonly
24
accepted methods calculating average absorbed dose, some of which described later in chapter 2.6, assume uniform distribution of microspheres. In reality, the distribution of 90Y microspheres is never uniform and the absorbed dose varies drastically on a microscopic scale. Radioembolization therapy indeed involves deposition of millions of individual sources, each capable of widely variable dose deposition to the immediately adjacent tissue. The absorbed dose is therefore very heterogeneous when viewed on a microscopic scale. There is potential for variable local dose deposition at different points within the tumor. Another limitation to SIRT is its high cost compared to chemoembolization or to radiofrequency ablation [39].
Globally, SIRT is more efficient than other HCC therapies, but it still to be optimized in terms of time, cost, prevision and modeling. A numerical model of liver tissue, that involved blood and microspheres flow, microsphere distribution up to the microscale and the expected absorbed dose, would help the physician in the optimization of the treatment.
25
2.4 State of the art about SIRT modelling
A wide range of mathematical methods for the simulation of SIRT have been proposed in the literature. Indeed, a numerical model of the treatment would open the way to the possibility of numerically test different scenarios, analyze different results and automatically identify the optimal conditions for tumor targeting, predicting also the distribution of the microspheres and the amount of dosage to be injected.
As mentioned before, numerous steps are needed to achieve a complete simulation.
Concerning the vascular tree modeling, it has been highlighted that in vivo imaging does not provide sufficient details. Hence, an algorithmic concept for extending imaged vascular tree data is needed such that geometrically realistic structures can be generated. Significant improvements were obtained this last decade in the mathematical modeling of the hepatic vascular tree. Three different approaches are competing: constrained constructive optimization (CCO), deterministic geometric construction, and angiogenesis-based construction. Currently, CCO, introduced by Schreiner and Buxbaum in 1993[114], is among them the most promising approach. The basic principle of CCO is to construct a strictly binary tree by adding one leaf node at a time to an initial tree, each time introducing an optimal bifurcation. Thus, CCO can be seen to be driven by the assumption of equal in- or outflow at all leaf nodes representing constant supply/drainage for each lobule. Moreover, at bifurcations the radii are balanced such that the flow resistance according to the Hagen-Poiseuille law is equal for both subtrees. This finally results in equal exit pressures at the leaf nodes [40]. The initial tree consists of a major hepatic vessel network obtained from CT angiography. Recently, Schwen et al. (2014) [41] proposed a simplified simulation of vascular
tree. The model considers firstly the simulation of vasculature and tissue of the mouse liver, considering only two vascular trees, the one supplying blood, the other one draining it, and the parenchyma, represented at the length scale of lobules (~ 2 mm). The algorithm is initialized with two vascular trees segmented from in vivo micro-CT imaging, skeletonized and converted to a binary graph.
A similar method for the simulation of representative dog hepatic vasculature and tissue is proposed by White et al. (2016) [42]. The vascular model is developed starting from a 2D initial tree, then transformed into a pseudo 3D model in order to avoid vessels overlap between the two trees. Another method presented in literature is the one of Kretowski et al.
26
[115], in which the generation of growing three-dimensional vascular structures perfusing the
tissue is described and applied to simulate the growth of liver vascular structures. The model is designed to simulate the development of a given extensive organ (starting with a small fraction of it), in which all cells are able to divide all along their life. The change in size and structure of the organ and the corresponding vascular trees operate at discrete time instants called cycles. The literature also proposes models specifically more linked to the simulation of SIRT treatment, namely including also the blood flow and microspheres distribution. In this context, using the same CCO scheme, Walrand et al.(2014a) (2014b) [43][44] proposed
a similar hepatic arterial tree growth model as the one described by Schwen et al for the SIRT simulation. [41]. Walrand et al.built indeed a full 3D hepatic arterial tree, optimizing though the total vessel length rather than the total vessel volume. When the arterial tree is built, the blood flow of all vessels is computed to ensure an equal blood flow to all the terminal triad arteries. Furthermore, microspheres distribution from larger arteries until portal triads is simulated by taking into account a constant symmetric or asymmetric probability at every bifurcation. The probability of each terminal triad artery trapping a microsphere was computed by following, in reverse, the artery path from the triad to the injection point. This model showed good results and it was able to well predict microspheres cluster size distribution, then better investigated by the works of Högberg et al. (2014) [111], (2015a) [112], (2015b) [113]. Indeed, Högberg et al. conducted a first real three-dimensional scanning of the microspheres clusters of a normal liver tissue explained 9 days after radioembolization, identifying two different types of clusters: linear clusters, described by a sequential of trapped microspheres in a terminal triad artery, and globular clusters that correspond to microspheres trapped in larger arteries. Although, linear clusters are well modeled by Walrand et al., globular ones are no present. In order to also simulate them, Högberg et al. developed another arterial tree model including an exponentially decreasing diameter of arterial branches from the main trunk up to the terminal triad arteries. A good agreement was obtained for the cumulated cluster size distribution and for the cluster frequency in the different artery generations as well.
In addition to the simulation of SIRT treatment, Basciano et al. (2010) [45], Kennedy et al.
(2010) [46] modeled fluid dynamics and glass and resin 90Y-microspheres transport in the four major branches of hepatic arterial tree, solving the blood governing equations through a CFD software. The computations were performed in steady flow and transient dynamics
27
and under the hypothesis that the presence of microspheres does not impact the fluid dynamics and the interaction between them can be neglected. The simulations showed that the microspheres partition at an arterial node does not follow that of the blood. In addition, it depends on the microsphere position in the vessel lumen prior to the node, the flow acceleration, the bifurcation angles of the daughter vessels and the catheter tip radial position.
The influence of such catheter presence on the flow is likewise a field of study. The most relevant works in this area are proposed by Kleinstreuer et al. (2012) [47], Childress et al.
(2012) [48] and Kleinstreuer and Childress (2014a) [49].
Recent improvements in the context of CFD simulations were made. Through the Ansys-Fluent software, patient-specific simulations have in fact been proposed by Xu et al. (2016) and Aramburu et al. (2016a). The former research team proposes a simulation domain containing on a 3D but planar representative hepatic arterial system. Instead, the work proposed by Aramburu et al. proposed a CFD blood flow simulation using a patient-specific hepatic artery, made of circular vessels reconstructed form the clinical image.
Nevertheless, no methodology aiming to extract patient-specific vessels geometries in clinical routine is illustrated, and the proposed geometries are limited in number of bifurcations and affinity to reality.
Recently, some computer models have been developed also for microsphere absorbed dose distributions. Concerning it, Gulec et al. (2010) [34] performed the first simulation of cell-scale dosimetry applied to compare the effects of hepatic radioembolization using 90Y-resin and 90Y-glass microspheres. Gulec et al. (2010) used electron Monte Carlo tracking (MCNP software), proposing a model of lobular micro-anatomy based on simple geometrical shapes. It is assumed that all the hepatic lobules shared the same microsphere trapping pattern and different microstructural dosimetry model are compared. Through this model, the much higher radiations concentration at the portal tracts are compared to the surrounding parenchyma and central veins. Indeed, detailed specifics of the radiation dose deposition of
90Y microspheres demonstrated a rapid decrease in absorbed dose in and around the portal
tracts where the microspheres are deposited.
Another important work that describes the radiations distribution in the tissue is the one of Petitguillaume [110]. It is mainly focused on three steps: the simulation of a patient specific numerical 3D voxelised phantom, the mathematical estimation of the curve of the activity
28
distribution over time and finally a Monte Carlo (MC) patient specific simulation of the energy in every organ/tissue.
Yet with respect to the others, in this works, hepatic vasculature model and simulation of the injection of radionuclides in the arterial tree are not considered.
29
2.5 Dose absorption models
In radiation therapy the calculation of the absorbed dose represents a crucial point. In the case of radioembolization, the goal is to obtain a sufficient and effective dose absorbed by the tumor tissue, while limiting the absorbed dose by the normal liver tissue in order to prevent toxicity or undesired collateral effect. The uncertainty in dose is certainly far less than that in the biological effect on the tumor and normal tissues, particularly when the dose distribution is non-uniform. During the years many efforts have been made to create radiobiological models that aim to quantify the biological effect of any treatment plans and
to compare their results [118][65].
The linear quadratic model (LQM) has been used to describe the radiobiological effects in several radionuclide therapies. Firstly, developed to analyze the effect during the electron beam radiation therapy (EBRT), the LQM has been reformulated to model therapies with continuously variable dose rate, and possible non-uniform absorbed dose distribution like radioembolization [52].
The principal quantity analyzed is the biologically effective dose (𝐵𝐸𝐷) [61][62]. The 𝐵𝐸𝐷 is
defined in terms of both physical and radiobiological parameters and it is a measure of the total amount of lethal damage sustained by a specific tissue. The 𝐵𝐸𝐷 is obtained by multiplying the total physical dose with a modifying factor which takes into account the physical aspects of dose delivery:
𝐵𝐸𝐷𝑖 = 𝐷𝑖 (1 +
𝐷𝑖 𝑇𝑟𝑒𝑝
(𝑇𝑟𝑒𝑝+ 𝑇𝑝ℎ𝑦𝑠) 𝛼 𝛽⁄ ) (1)
Being 𝐷𝑖 the locally absorbed dose, 𝑇𝑟𝑒𝑝 and 𝑇𝑝ℎ𝑦𝑠 the halftimes for cell repair after damage and the physical halftime of 90Y, respectively. α and β denote the so-called intrinsic radio
sensitivity and potential sparing capacity[59. ]BED is here expressed for a single unit volume
i like the voxel, a compartment or a specific region over which it is calculated. 𝐵𝐸𝐷 can relate also with the surviving fraction (SF) of a population of cells after irradiation following:
30
To apply the same model in case of theoretical uniform irradiation, the 𝐵𝐸𝐷 values are converted in the equivalent dose at 2Gy/fraction (EQD2):
𝐸𝑄𝐷2 = 𝐵𝐸𝐷𝑥𝛼/𝛽
2+𝛼/𝛽 (3)
Furthermore, spatial non-uniformities can be normalized to a single number, called equivalent uniform biologically effective dose (EUBED) [63]. This number is the same for
different absorbed dose distributions that have the same biological effect. EUBED can be defined as:
𝐸𝑈𝐵𝐸𝐷 = − 1
𝛼 𝑙𝑛 (
∑ 𝑒𝑖 −𝛼𝐵𝐸𝐷𝑖
𝑛𝑣𝑜𝑥𝑒𝑙 ) (4)
Where 𝑛𝑣𝑜𝑥𝑒𝑙 is the number of voxels in the volume of interest under study.
This approach will help in evaluating risks and benefits of an individual absorbed dose distribution, as clinical outcome can be linked to a single number like 𝐵𝐸𝐷 or 𝐸𝑈𝐵𝐸𝐷. The main goal of radioembolization remains the evaluation of the absorbed dose for the planning of the radiotherapy treatment. The absorbed dose is a physical dose quantity representing the mean energy imparted to matter per unit mass by ionizing radiation. The SI unit for the absorbed dose is Gray [Gy], equivalent to J/kg. In the literature, different methods for the dose calculation, based on different parameters, has been developed during the years
[51]. The recent studies are focusing on patient specific methods that take into account the
specificity of the tumor treated, to better predict biological effect of dose distribution and reducing the side effects of the treatment.
31
2.5.1 Partition model
The partition model is a model that allows to estimate the activity of an administered dose of 90Y microsphere partitioned into three compartments: tumor, normal liver and lung
tissue[65]. The activity in each compartment is firstly verified by the distribution of
99mTc-MAA , then the tumor to normal liver ratio is calculate as follow:
𝑇𝑁 = 𝐴𝑇 [𝑀𝑏𝑞] 𝑀𝑡 [𝐾𝑔] ⁄ 𝐴𝑁𝐿[𝑀𝑏𝑞] 𝑀𝑁𝑙[𝐾𝑔] ⁄ (5)
where 𝐴 and 𝑀 indicate the activity and the mass of the tumor (𝑇) and normal liver tissue (𝑁𝐿) compartments. The estimated TN liver ration not always match the true TN ratio due to differences between the 99mTc-MAA particle and the microsphere used in the treatment. They in fact can differ in size, weight, administration (microcatheter placement, local change in the blood flow).
The intrahepatic activity to be administered in each compartment is chosen with the evaluation of the TN value and the segmentation of the compartments. Each compartment can be segmented with two different technique: segmentation on an anatomical image (contrast enhanced CT) or with a functional modality (SPECT thresholding) [59]. These compartments are matched with the distribution of 99mTc-MAA in order to quantify the dose to each compartment. The goal is to maximize the dose injected to the tumor while reducing the dose that reach the normal liver and the lung tissue.
The prescribed activity is then computed:
𝐴 [𝐺𝐵𝑞] = 𝐷𝑁𝐿[𝐺𝑦]
𝑇𝑁 𝑀𝑇 [𝑘𝑔]+ 𝑀𝑁𝐿[𝑘𝑔]
50 [𝐺𝐵𝑞𝐽 ] (1−𝐿𝑆𝐹) (6)
where 𝐷𝑁𝐿 indicates the absorbed dose to the parenchyma, LSF the lung shunt fraction, MNL,
MT are respectively the mass of the normal liver and the tumor compartment. With this calculation the dose is supposed to be deposited just in the compartment in which the activity is administered neglecting the effect and the activity coming from other compartments, therefore this is a simplification.
32
This method accounts for tumor avidity and liver involvement, it is based on whole liver infusion, and it considers the lung safety through the use of 𝐿𝑆𝐹 parameters for activity calculation.
Lung shunt fraction is defined as:
𝐿𝑆𝐹 = 𝐶𝑙𝑢𝑛𝑔𝑠
𝐶𝑙𝑢𝑛𝑔𝑠+𝐶𝑙𝑖𝑣𝑒𝑟
(7)
Where 𝐶𝑙𝑢𝑛𝑔𝑠 indicates the total counts in the lungs, and 𝐶𝑙𝑖𝑣𝑒𝑟 the total counts in the liver.
Lung shunting could potentially result in radiation pneumonitis after radioembolization. At higher shunt fraction, it may be necessary to reduce the prescribed activity of microspheres so that the know upper radiation dose limit recommended of 25 Gy for Y90 is not exceeded. The highest tolerable lung shunt absorbed dose was defined as 30 Gy after a single treatment and up to 50 Gy after repeated treatments [66]. Patients who have considerable shunting of the activity to the lungs, typically greater than 20% shunt value or 16.2 mCi (600 MBq) delivered lung activity, should be disqualified from the use of microsphere brachytherapy
[60].
However, the partition model does not consider the activity nonuniformity within each partition. Furthermore, the partition model cannot be accurately used for diffused tumors where tumor extent cannot be determined with confidence. A typical dose between 100 and 120 Gy is selected for Therasphere® treatments involving patients with HCC [53].
2.5.2 BSA method
The 𝐵𝑆𝐴-based method is the most commonly used method in radioembolization with resin microspheres, partly because of the large embolic load that such low-activity microspheres require to deliver adequate radiation. It is based on the observation that 𝐵𝑆𝐴 correlates with liver volume in the healthy population. Thanks to this evaluation, the activity is administered based on the specific liver volume for each patients, derived directly from the weight and height of the patient. The activity is calculated according to the following relationship:
𝐴 [𝐺𝐵𝑞] = (𝐵𝑆𝐴 [𝑚2] − 0.2) + 𝑉𝑡𝑢𝑚𝑜𝑟
𝑉𝑡𝑢𝑚𝑜𝑟+ 𝑉𝑛𝑜𝑟𝑚𝑎𝑙 𝑙𝑖𝑣𝑒𝑟
33
where 𝑉𝑡𝑢𝑚𝑜𝑟and 𝑉𝑛𝑜𝑟𝑚𝑎𝑙 𝑙𝑖𝑣𝑒𝑟 liver indicate the volumes of the tumor and the healthy
parenchyma, respectively.[59] And the 𝐵𝑆𝐴 is calculated as:
𝐵𝑆𝐴 [𝑚2] = 0.20247 𝑥 ℎ𝑒𝑖𝑔ℎ𝑡 [𝑚2]0.725 𝑥 𝑤𝑒𝑖𝑔ℎ𝑡[𝑘𝑔]0.425 (9)
This method is strongly dependent on the patient’s height and weight and not that much dependent on the tumor infiltration. It assumes a relationship between the size of the patient and the ability to tolerate the dose. This method takes into account a radioembolization to the whole liver, so when considering a lobar or more selective treatment, the activity is reduced in proportion to the size of the liver volume being treated and the formula needs to be adjusted as:
𝐴 [𝐺𝐵𝑞] = 𝐴𝐵𝑆𝐴 [𝐺𝐵𝑞] [ 𝑉𝑡𝑟𝑒𝑎𝑡𝑒𝑑
𝑉𝑤ℎ𝑜𝑙𝑒 𝑙𝑖𝑣𝑒𝑟] (10)
However, there is experimental evidence that the 𝐵𝑆𝐴 method does not correlate with the liver mass or with the tumor involvement [66]. It should not be misconstrued in terms of tailored evaluation, as it neglects the individual 𝑇/𝑁𝐿 avidity ratio, which is patient specific. Furthermore, the interindividual differences in microsphere distribution are not covered, limiting the use in patient-specific treatments.
2.5.3 MIRD mono-compartment
This method relies on a simplified dosimetry equation of the multi-compartmental model, here an absorbed dose, to the whole liver or lobe is empirically prescribed [52][50].
For glass microspheres, the activity calculation is based on the desired mean absorbed dose to the target liver mass (independent of tumor burden), following:
𝐴 [𝐺𝐵𝑞] = 𝐷𝑒𝑠𝑖𝑟𝑒𝑑 𝑑𝑜𝑠𝑒 [𝐺𝑦] 𝑥 𝑀𝑡𝑎𝑟𝑔𝑒𝑡 [𝑘𝑔]
50 [ 𝐽
𝐺𝐵𝑞]
(11)
The recommended absorbed dose can vary in an interval between 80 to 150 Gy, depending on the case for every patients, and their specific tumor. When setting the desired absorbed
![Figure 2: Liver division into eight segments by the hepatic veins [8]](https://thumb-eu.123doks.com/thumbv2/123dokorg/7499057.104360/18.892.210.685.282.647/figure-liver-division-segments-hepatic-veins.webp)
![Figure 5: The liver lobule with central vein, portal tracts and sinusoids [11] .](https://thumb-eu.123doks.com/thumbv2/123dokorg/7499057.104360/21.892.127.788.524.886/figure-liver-lobule-central-vein-portal-tracts-sinusoids.webp)

![Figure 8: Schematic representation of an arteriovenous shunt induced by the presence of an HCC [5]](https://thumb-eu.123doks.com/thumbv2/123dokorg/7499057.104360/30.892.178.737.129.472/figure-schematic-representation-arteriovenous-shunt-induced-presence-hcc.webp)
![Figure 14: Interaction of an electron with an atom, where a is the atomic radius and b is the impact parameter [79]](https://thumb-eu.123doks.com/thumbv2/123dokorg/7499057.104360/55.892.277.679.708.969/figure-interaction-electron-atom-atomic-radius-impact-parameter.webp)
![Figure 15: A sketch of the hypothetical paths of an electron using single scattering and a condensed history approach [84]](https://thumb-eu.123doks.com/thumbv2/123dokorg/7499057.104360/57.892.235.666.132.428/figure-sketch-hypothetical-electron-scattering-condensed-history-approach.webp)