POLITECNICO DI MILANO
Facoltà di Ingegneria IndustrialeDipartimento di Energetica
Corso di Laurea Magistrale in Ingegneria Energetica
Analysis and optimization of an industrial-scale
pre-combustion CO
2capture unit of an IGCC power plant
Relatore: Prof. Giampaolo MANZOLINI Correlatore: Prof. Dr. Piero COLONNA Correlatore: Dipl.-Ing. Carsten TRAPP
Tesi di Laurea di:
Timon THOMASER Matr. 783083
Acknowledgements
First of all, I would like to sincerely thank my daily supervisor Carsten Trapp for his out-standing support in the development of this thesis. My sincere thanks also to my supervisor Prof. Dr. Piero Colonna, Kay Damen, Eric van Dijk, and Lukas Valenz who guided the work in the right direction.
I am grateful to my supervisor at the home university, Giampaolo Manzolini, for his support in the correction of the thesis and his patience.
My sincere thanks to my girlfriend Cristel Valzer who supported me when I saw no way out and helped me whenever possible.
Finally, I want to thank my family for their love and financial support throughout the entire university studies.
Bressanone (Italy) Timon Thomaser
“Habe nun, ach! Philosophie, Juristerei und Medizin, Und leider auch Theologie
Durchaus studiert, mit heißem Bemühn. Da steh ich nun, ich armer Tor!
Und bin so klug als wie zuvor;”
Table of Contents
Acknowledgements iii 1 Introduction 1 1-1 Relevance of CCS . . . 1 1-2 Overview of CCS technologies . . . 4 1-2-1 CO2 capture . . . 4 1-2-2 CO2 transport . . . 8 1-2-3 CO2 storage . . . 81-3 Integrated Gasification Combined Cycle . . . 9
1-4 Literature review (recent process design and optimization studies) . . . 10
1-5 Research questions . . . 12
2 Process description 15 2-1 Water-Gas Shift Section . . . 16
2-2 Absorption Section . . . 19
2-2-1 Ambient temperature configuration (ATC) . . . 19
2-2-2 Below ambient temperature configuration (BATC) . . . 20
2-3 CO2 Compression Section . . . 22
2-4 CO2 Capture Unit Process Flow Diagram . . . 23
2-5 Definitions . . . 23
3 Steady-State Modeling and Methodology 27 3-1 Modeling tools . . . 27
3-2 PC-SAFT EoS . . . 29
3-3 Model assumptions and development . . . 30
4-1 Comparison between the ATC and the BATC . . . 51
4-1-1 Thermodynamic optimization . . . 51
4-1-2 Evaluation equipment cost . . . 55
4-2 Overall capture unit optimization of the BATC . . . 56
4-2-1 Optimization capture unit . . . 57
4-2-2 Performance comparison for different operating conditions of the WGS re-actors . . . 61
4-3 Performance H2S removal section when no CO2 is captured . . . 66
4-4 Future improvement and recommendations . . . 69
5 Conclusion 73 A Matlab code 77 A-1 Matlab code - optimization absorption and CO2 compression section . . . 77
A-1-1 Optimization script . . . 77
A-1-2 Optimization function . . . 78
A-2 Matlab code - overall capture unit optimization . . . 81
Glossary 85 List of Symbols . . . 86
List of Figures
1-1 Global-energy-related CO2 emissions for different scenarios, adapted from [4] . . 2
1-2 Global-energy-related CO2emissions abatement in the 450 Scenario relative to the New Policies Scenario [4] . . . 3
1-3 Power generation with CCS by region [5] . . . 3
1-4 The CCS process [7] . . . 5
1-5 Pre-combustion process flowsheet [5] . . . 6
1-6 Post-combustion process flowsheet [5] . . . 7
1-7 Oxy-combustion process flowsheet [5] . . . 7
1-8 Block flow diagram of IGCC plant with CO2 capture, adapted from [13] . . . 10
1-9 Optimized novel WGS configuration studied from Martelli et al., adapted from [15] 11 1-10 Nuon Magnum power plant in Eemshaven, Netherlands [20] . . . 12
2-1 Layout of the studied capture unit . . . 16
2-2 Simplified process flow diagram of the shifting section, based on CB&I Lummus design . . . 17
2-3 Simplified process flow diagram of the absorption section (ambient temperature configuration) . . . 19
2-4 Simplified process flow diagram of the absorption section (below-ambient temper-ature configuration) . . . 21
2-5 Simplified process flow diagram of the compression section, based on CB&I Lummus 22 2-6 CO2 phase diagram, adapted from [11] . . . 23
2-7 Simplified process flow diagram of the capture unit (below-ambient temperature configuration) . . . 24
2-8 Simplified process flow diagram of the capture unit (ambient temperature config-uration) . . . 24
4-1 Power consumption due to heating, cooling, compressors and pumps of the ATC and the BATC, with NCA = 13, NSA = 10 and NSS = 6 . . . 54
4-2 Equipment cost and power consumption of the ATC and BATC for different num-bers of equilibrium stages in the CO2 Absorber, H2S Absorber, and H2S Stripper,
respectively (indicated in brackets) . . . 55 4-3 NPV for the BATC and the ATC with NCA = 13, NSA= 10 and NSS = 6 . . . 56
4-4 Total power consumption (a) and specific energy requirement (b) of the capture unit as a function of the CO2 capture rate . . . 58
4-5 The CO conversion and CO2 recovery as a function of the CO2 capture rate . . . 59
4-6 The power consumption in each section of the capture unit as a function of the CO2 capture rate . . . 60
4-7 Specific energy consumption for SOR conservative, SOR limit and EOR conditions (a) with magnifications at 75.5% and 88% of carbon removal, respectively (b) . 62 4-8 Optimized CO conversion (a) and CO2 recovery (b) for SOR convservative, SOR
limit and EOR as a function of the capture rate . . . 64 4-9 Specific energy consumption for the SOR limit case with a new design of the third
reactor compared to SOR conservative and SOR limit conditions . . . 66 4-10 Operating temperature across the H2S Absorber with and without CO2 capture . 67
4-11 Power consumption of the H2S absorption section with and without CO2 capture 68
List of Tables
1-1 Advantages and disadvantages of capture options, adapted from [8] . . . 6 3-1 Untreated Syngas feed stream to the capture unit . . . 31 3-2 Sulphur Free Shifted Syngas stream; for the H2S and COS content see Shifted
Sulphur stream . . . 33 3-3 Overview of component models and model parameters used for the absorption
section model . . . 34 3-4 Component models and model parameters for the ATC and BATC Aspen Plus model 34 3-5 Overview of component models and model parameters used for the shifting section
Aspen Plus model, based on CB&I Lummus . . . 36 3-6 Comparison of the constraints on the minimum steam/CO ratio, inlet temperature
of the WGS reactors and ATE for all three analyzed cases of the capture unit optimization . . . 49 4-1 Comparison of performance and other relevant system parameters of the ATC and
BATC for different numbers of equilibrium stages (N) in the CO2 Absorber (CA),
H2S Absorber (SA) and H2S Stripper (SS) for a CO2 recovery of 92.5%. . . 53
4-2 Comparison of performance and other relevant system parameters of the optimized capture unit for different CO2 capture rates . . . 57
4-3 Comparison of performance and other relevant system parameters of the chilled H2S absorption section with and without CO2 capture . . . 67
Abstract
The incorporation of a carbon dioxide (CO2) capture unit into an Integrated Gasification
Combined Cycle (IGCC) power plant is a promising technology to achieve a significant re-duction of CO2 emissions in the near future and to limit the climate change. This work presents an analysis and optimization of a pre-combustion CO2 capture unit of an IGCC
power plant in a process simulator environment. The focus is on the capture unit, which comprises an integrated CO2 and H2S removal unit, a sweet water-gas shift (WGS) unit, and a five-stage intercooled CO2 compression. The main objective of the work is to reduce the
energy penalty related to the introduction of the CO2capture unit into the IGCC power plant.
Different operating temperatures in the absorption section are compared showing that it is thermodynamically and economically more convenient to operate at low temperatures. Sub-sequently, a thermodynamic optimization of the operating parameters of the capture unit is performed. The optimization is performed within the range 75 to 91% of CO2 capture rate.
The analysis shows that the power consumption increases with the CO2 capture rate, while
the specific energy consumption (per captured amount of CO2) has a minimum within the analyzed range of capture rates. Different operating conditions for fresh and partially deac-tivated WGS catalysts are compared. For the latter case, the inlet temperature of the WGS reactors has to be increased and causes a rise of the power consumption at high capture rates. At lower capture rates, no significant impact on the power consumption was observed due to the deactivated catalysts. For fresh catalysts, a reference case with a minimum steam/CO ra-tio of 2.65 mol/mol and a reactor inlet temperature of 340◦C is defined; but a study performed by Nuon estimated that the minimum steam/CO ratio can be reduced to 1.5 mol/mol and the minimum inlet temperature of the reactors can be reduced to 315◦C. It is calculated that the specific energy requirement per captured amount of CO2 can be reduced up to 10%, when operating at these more severe conditions for the WGS reactors. Finally, the performance of the H2S absorption section is evaluated with and without CO2 capture. This is of interest,
because the H2S absorption section has to be sized to guarantee an effective operation also when no CO2 is captured. In this way, the IGCC power plant can be operated without CO2 capture if the CO2 market price does not pay-back the additional cost connected to the CO2
Sommario
Secondo l’International Energy Agency (IEA), carbon capture and storage (CCS) é una soluzione promettente per ridurre le emissioni di anidride carbonica (CO2) nei prossimi de-cenni. Oggetto di questo lavoro é lo studio di una delle tecnologie CCS che prevede la cattura di anidride carbonica in un impianto di produzione di energia elettrica IGCC (Integrated Gasification Combined Cycle). La tesi si colloca all’interno di un progetto che studia la cat-tura pre-combustione di anidride carbonica di un impianto IGCC ed é stata sviluppata in collaborazione con la Delft University of Technology, il fornitore di energia elettrica olandese Nuon e l’Energy Research Centre of the Netherlands. L’obiettivo principale dell’analisi svolta é la riduzione del consumo di energia elettrica nella sezione dell’impianto dedicata alla cattura dell’anidride carbonica. L’impianto di cattura é stato simulato in Aspen Plus e comprende una sezione per la rimozione di CO2 e di H2S, una sezione di sweet water-gas shift (WGS) e
una sezione di compressione della CO2. Il presente lavoro si focalizza su tre analisi.
Nella prima parte si confronta la fattibilità tecnico-economica relativa a diverse temperature operative della sezione di absorbimento della CO2e dell’H2S. Sarà dimostrato che in una prima approssimazione é più vantaggioso operare a temperature più basse. Nella seconda parte, é effettuata un’ottimizzazione termodinamica delle condizioni operative dell’intero impianto di cattura. L’ottimizzazione é stata eseguita in un range di efficienza di cattura dell’anidride carbonica tra il 75% e il 91%. L’analisi effettuata mostra che il consumo di potenza elet-trica dell’impianto di cattura é strettamente crescente con l’efficienza di cattura, mentre il consumo specifico (per massa di CO2 catturata) presenta un minimo. Inoltre vengono con-frontati differenti vincoli per le condizioni operative dei reattori di shift. Una prima analisi simula catalizzatori di shift parzialmente deattivati, per i quali le temperature d’ingresso dei reattori di shift devono essere aumentate. Questo causa un incremento del consumo di potenza elettrica dell’impianto di cattura per alte efficienze di cattura, mentre per efficienze di cattura più basse il consumo elettrico non ne risulta influenzato significativamente. Una seconda analisi simula le condizioni operative di catalizzatori nuovi. Per quest’ultima si con-frontano le prestazioni dovute a un minimo rapporto di steam/CO di 2.65 mol/mol e una temperatura d’ingresso nei reattori di 340◦C con condizioni operative più estreme. Infatti, uno studio eseguito da Nuon ha dimostrato che le temperature d’ingresso nei reattori
pos-e dal massimo contpos-enuto di zolfo conspos-entito npos-el syngas all’uscita dpos-ella spos-ezionpos-e di rimozionpos-e dello zolfo.
Parole chiave: IGCC, CCS, cattura pre-combustione di anidride carbonica, ottimizzazione,
Chapter 1
Introduction
1-1
Relevance of CCS
‘Climate change is happening’ [1] states the United States Environmental Protection Agency. The global mean temperature is already 0.8◦C above pre-industrial levels and is expected to rise further [2]. The cause is anthropogenic emissions of CO2 and other Greenhouse Gases
(GHG) which increase the average global temperature. At the United Nations Climate Change Conferences in 2009 and 2010 it was agreed that this increase should be kept under 2◦C compared to the start of the industrial era [3]. Although no binding agreement was signed, the International Energy Agency (IEA) analyzed this objective in the ‘World Energy Outlook 2012’ [4]. Three different scenarios which predict the energy trends until 2035 were developed:
• Current Policies Scenario (CPS) • New Policies Scenario (NPS) • 450 Scenario (450)
The CPS illustrates the impact of the current energy policies on the world energy outlook, which means that only the governmental policies enacted or adopted by mid-2012 are applied unchanged. The IEA predicted that this scenario leads to a long-term temperature increase of 5.3◦C compared to pre-industrial temperatures and implies drastic effects on the climate. In fact, there is a broad political consensus that more effort needs to be put into new energy policies. This idea is summarized in the NPS, which assumes that ‘[e]xisting energy policies are maintained and recently announced commitments and plans, including those yet to be formally adopted, are implemented in a cautious manner’ [4]. Despite the efforts, there is a 50% probability that the global temperature increases of 3.6◦C, which is above the objective of 2◦C. Thus the IEA developed the 450 scenario which assumes that ‘[p]olicies are adopted that put the world on a pathway that is consistent with having around a 50% chance of limiting the global increase in average temperature to 2◦C in the long term, compared with
Figure 1-1: Global-energy-related CO2 emissions for different scenarios, adapted from [4]
pre-industrial levels’ [4]. The name of this scenario has origin in the fact that a 450 ppm CO2-equivalent long-term concentration of greenhouse gases in the atmosphere leads to a
2◦C temperature increase.
In 2011 around 60% of the total anthropogenic CO2-equivalent emissions were energy-related. Therefore, the energy sector has a key influence. The global energy-related CO2 emissions
for the different scenarios are shown in Figure 1-1. From this figure it can be inferred that the CPS and NPS incline towards a consistent increase in the CO2 emissions. The increase is mainly attributable to Non-OECD countries, because they are expected to undergo a large increase of the population and economy, which influences directly the total primary energy consumption. Furthermore, this increase is related to a consistently high coal demand (coal emits much more CO2 than other fuels) of these regions, which is expected to increase from
3,411 Mtoe (Million Tonnes of Oil Equivalent) in 2010 to 4845 Mtoe and 6,311 Mtoe in 2035 for the NPS and CPS, respectively [4]. To limit the long-term temperature increase to only 2◦C above pre-industrial levels the much more severe 450 Scenario is necessary (a 50% likelihood of success was estimated). In this scenario the CO2 emission level has a peak of
32.4 Gt before 2020 which declines to 22.1 Gt in 2035. The steps which have to be taken to achieve the 450 scenario compared to the NPS are illustrated in Figure 1-2 (a reduction of 15Gt CO2 emissions is necessary). The most important mitigation measures by 2035 are:
end-use efficiency, electricity savings, renewable energy sources, nuclear power and carbon capture and storage (CCS). Electricity savings is expected to have the biggest impact on the reduction of the carbon dioxide emissions. Next to them the renewable energy sources are becoming a significant source of mitigation. Scientists agree that renewables are one the few sustainable long-term energy production sources, but it is technically not possible and eco-nomically not sustainable to switch in the near-term to a fully renewable-energy production. Thus, their influence on the global energy mix in the next decades is important, but limited. Carbon capture and storage plays therefore an crucial role and will become the third most important abatement measure. The IEA expects in the 450 scenario that 17% of the total CO2 abatement by 2035 should be achieved by CCS, in total terms this is equal to 2.5 Gt
1-1 Relevance of CCS 3 © OECD/IEA, 2012 253
2
8
5
11
16
1
7
3
9
14
6
12
17
4
10
15
13
18
Chapter 8 | Climate change mitigation and the 450 ScenarioFigure 8.7 ⊳ Global energy-related CO2 emissions abatement in the
450 Scenario relative to the New Policies Scenario
CO2 abatement 2020 2035
Ac vity 2% 2%
End-use efficiency 18% 13% Power plant efficiency 3% 2% Electricity savings 50% 27% Fuel and technology
switching in end-uses 2% 3% Renewables 15% 23% Biofuels 2% 4% Nuclear 5% 8% CCS 4% 17% Total (Gt CO2) 3.1 15.0 20 22 24 26 28 30 32 34 36 38 2010 2015 2020 2025 2030 2035 Gt 450 Scenario
New Policies Scenario
Notes: Activity describes changes in the demand for energy services, such as lighting or transport services, due to price responses. Power plant efficiency includes emissions savings from coal-to-gas switching. For more detail on the decomposition technique used, see Box 9.4 in Chapter 9.
The second most important abatement measure are renewables (excluding biofuels), with increased use not only in power generation but also in buildings (for space and water heating) and in industry (as an alternative fuel source). Among renewables in the power
sector, wind, hydro, and biomass are the most important sources of CO2 abatement. Next
to renewables, CCS saves 2.5 Gt CO2 in 2035, becoming a significant source of mitigation from 2020 onwards. In several countries, such as China and the United States, very efficient coal-fired power stations are built up to 2020 and are retrofitted with carbon capture and storage in the following years as a consequence of a rising CO2 price.
Transport is the end-use sector that has seen – by far – the most rapid increase in emissions over the last twenty years. CO2 emissions in the sector increased by 2.2 Gt CO2 from 1991 to 2011, or by almost 50%. Reducing emissions in transport thus forms a crucial element
for any comprehensive strategy to reduce global CO2 emissions. Road transport accounts
for about three-quarters of global transport emissions and a diverse set of mitigation measures will be required in this sub-sector (Figure 8.8). Up to 2020, lower vehicle usage, fuel efficiency gains and an increase in the use of biofuels dominate abatement. Over the longer term, improvements in vehicle fuel economy represent the most important abatement measures, accounting for 51% of cumulative savings in the transport sector from 2011 to 2035.
Higher fuel prices lead to a lower vehicle usage in the 450 Scenario. The increase in the 450 Scenario is due to the assumed removal of subsidies in developing countries and an increase in fuel duty in OECD countries, which increases end-use prices and limits the rebound effect from more efficient vehicles. The tax level corresponds to an increase in the fuel duty for gasoline of $0.43 per litre (l) in the European Union and $0.34/l ($1.29 per gallon) in the United States.
Figure 1-2: Global-energy-related CO2 emissions abatement in the 450 Scenario relative to the
New Policies Scenario [4]
Figure 1-3: Power generation with CCS by region [5]
CO2 emissions. The share of CO2 emissions abatement reached from CCS will increase sig-nificantly after 2020, because many coal-fired power stations constructed to 2020 are going to be retrofitted with carbon capture and storage when the CO2market price is going to increase. Figure 1-3 shows that CCS will also play a crucial role in the lowest-cost greenhouse gas mitigation portfolio after 2035. This graphic was published in the ‘Energy Technology Per-spective 2012’ from the IEA under the hypothesis of an energy policy that ensures a 80% chance of limiting the global temperature increase to 2◦C [5]. In 2050 960 GW of the total power generation will be equipped with CCS. The majority will be located in China (over one third) and other non-OECD countries. The reason is that by that time probably the majority of CO2 emissions are given by non-OECD countries and therefore they have to contribute significantly to the global aim of limiting the temperature increase. In the near term instead, most CCS will be installed in OECD countries, mainly in the United States.
The data from the IEA shows that to limit the average global temperature increase, carbon capture and storage will become an important mitigation measure. A temporary solution
option [6].
CO2 capture technology is already commercially available, even if some important steps have still to be taken [7]. In fact, the storage in geological formations has to be studied accurately, a sufficient value for CO2has to be created, a legal and regulatory framework must be developed
and suitable geological formations for a secure and environmentally sustainable storage have to be found. An analysis of these challenges, even if quite important for the implementation of CCS, are beyond the scope of this work. Another challenge of CCS is that the introduction of the sequestration section to power plants ends up in significant additional costs and a considerable energy efficiency penalty. The objective of this work is to minimize this energy penalty for a pre-combustion CO2 -capture unit in an Integrated Gasification Combined Cycle
(IGCC) power plant.
1-2
Overview of CCS technologies
Carbon capture and storage consists in capturing, transporting and storing carbon dioxide (Figure 1-4). CO2 produced from power generation, cement production, steel mills and other
large point sources does not anymore enter the atmosphere, but it is withdrawn before. All three stages of the process (CO2 capture, CO2 transport and CO2 storage) are technically feasible and have already been used commercially for several decades in other industries [7].
1-2-1 CO2 capture
For the removal of CO2 different technologies are currently available or under development. In a short-term view particular attention should be paid to CO2 capture from power plants,
which account for almost 50% of the total CO2 emissions from fossil fuel combustion [8].
Therefore, this introduction will focus on the following three CO2 capture methods suitable for power plants:
• Post-combustion - CO2 is removed from the flue gas after the combustion
• Pre-combustion - CO2 is removed from the synthetic gas (syngas) obtained through
1-2 Overview of CCS technologies 5
8 Technology Roadmaps Carbon capture and storage
This section provides a brief overview of the current situation in CCS technology, financing, regulation and public engagement, to provide a baseline for this roadmap’s milestones and actions for the coming decades.
CCS Status Today
Technology development and demonstration
For this roadmap, CCS is defined as a system of technologies that integrates three stages: CO2
capture, transport and geologic storage (see Figure 2). Each stage of CCS is technically available and has been used commercially for many years
(IEA, 2008b). However, various technologies with different degrees of maturity are currently competing to be the low-cost solution for each stage of the CCS value chain.
CO2 storage
CO2 injection
CO2 transport
CO2 source (eg. power plant)
Source: Bellona Foundation.
Figure 2: The CCS process
Figure 1-4: The CCS process [7]
• Oxy-combustion - CO2 can easily be removed from the flue gas by condensation, as the fuel is combusted using pure oxygen instead of air
The advantages and disadvantages of each technology are summarized in Table 1-1.
Independent of the applied capture process, the removal of CO2 requires a significant amount of energy. Subsequently, the efficiency of the power plant decreases. The efficiency loss is in a range of 6 to 11% depending on the technology and the type of fuel used [9]. For coal fired power plants the energy penalty is higher than for gas fired power plants, because a higher amount of CO2 has to be captured per unit of electricity produced. A detailed analysis of the three capture methods is presented in the following paragraphs.
Pre-combustion As shown in Figure 1-5 the primary fuel, usually coal or biomass, is gasified
to a syngas, which contains mainly H2, CO2 and CO. Steam is added and in apposite reactors
the CO is converted into CO2 and H2. Finally, the CO2 is separated from the rest of the syngas, compressed and stored. The syngas is then used as a fuel in a combustion process. For pre-combustion CO2 capture the current development focuses on IGCC power plants, which
use carbon as primary fuel and the most efficient thermodynamic cycle for power production, the combined cycle. Different technologies are available for the CO2 separation. They can be distinguished by the technology of separation. The most mature is separation based on physical absorption with solvents as Selexol, Rectisol, Purisol and Fluor Solvent. Chemical solvents as MDEA are considered for pre-combustion CO2 sequestration when the partial pressure of carbon dioxide is very low. Other separation technologies under development are adsorption, membrane separation and cryogenic separation.
Post-combustion commercially deployed tech-nology at the required scale in other industrial sectors
High parasitic power require-ment for solvent regeneration Opportunity for retrofit to
ex-isting plant
High capital and operating costs for current absorption systems
Oxy-combustion Mature air separation tech-nologies available
Significant plant impact makes retrofit less attractive
1-2 Overview of CCS technologies 7
Figure 1-6: Post-combustion process flowsheet [5]
Figure 1-7: Oxy-combustion process flowsheet [5]
An important technological challenge of pre-combustion CO2 capture has still to be cleared
by R&D. It is related to the combustion of hydrogen-rich syngas as fuel in the gas turbine. The hydrogen has a higher explosion risk, the adiabatic flame temperature increases and the higher heat transfer with the turbine blades leads to critical blade temperatures.
Post-combustion Post-combustion capture describes the removal of CO2 from the flue gas
treatment (Figure 1-6) and can be considered as an extension of the flue gas treatment. It consists in the removal of CO2 from the exhaust gases of the combustion process. Among
the different techniques used for post-combustion capture, such as absorption, adsorption, membrane separation and cryogenic separation the use of chemical solvents like ethanolamine (MEA) is the most mature treatment technology [9]. The chemical solvent is particularly adapted to absorb CO2 with a concentration of 4-14% by volume from the flue gas [9]. The
disadvantage is that chemical solvents require a lot of energy in regeneration (to break the chemical link between CO2 and the solvent), which results in a high energy penalty for the
power plant. On the other hand, post combustion has already been used in the 1980s in the United States in order to produce CO2 for Enhanced Oil Recovery and is therefore a fully developed technology [10].
Oxy-combustion Oxy-combustion is based on the concept that fossil fuels when combusted
with pure oxygen and recycled flue gases produce a flue gas containing only CO2 and water, and not a considerable amount of N2 as in air combustion. Therefore, for oxy-combustion the CO2 can easily be separated by condensation of steam. Typically, the oxygen is obtained
by separation from air by cryogenic distillation. This process is shown in Figure 1-7; note that the oxygen is not 100% pure, as some Ar and N2 are separated together with O2. Other researchers proposed that the pure oxygen may be delivered as a solid oxide. The CO2
concentration in the separated carbon dioxide stream is 95% mole based or higher and is therefore competitive with pre- and post-combustion capture. However, oxy-combustion is the least studied capture technology. Pilot and large-scale plants are at an advanced stage, but the IEA expects that the potential for further development is big [9].
of 2005. The results of the analysis show that in 2050 the total length of the CO2 pipeline
network is estimated from 200,000 km to 360,000 km, with a necessary total investment of $ 0.55 trillion to $ 1 trillion. However, health and safety regulations are still missing and techniques for leak remediation and managing of different CO2 stream impurities must be
improved. A potential pipeline leakage can cause respiratory diseases and other fatal health risks. CO2 cannot explode or take fire when it is transported in a supercritical state, but it is heavier than air and in case of a leakage it is accumulated in low-lying areas. In the presence of H2S and SO2 the health risk even increases [12]. Furthermore, the impurities alter the thermodynamic behaviour of the CO2 and could pose a threat to the integrity of the transmission system and cause other health, safety and environmental problems [11].
1-2-3 CO2 storage
Various storage options have been proposed. Oceans are prime candidates. Their carbon inventory is 50 times greater than the one of the atmosphere. Although the surface of the oceans exchanges CO2 with the atmosphere, if CO2 is injected in higher depth a rapid release
can be avoided (the critical pressure depth is 800 m under the sea level) [8]. Therefore, ocean storage was expected to have a large potential, but because of a severe environmental opposition it so no longer considered feasible.
Another storage opportunity is mineral storage. CO2 reacts with minerals such as iron,
cal-cium or silicates of magnesium to form stable carbonates. A so called chemical trapping occurs, because chemical reactions are the basis of this technology. The chemical reaction would consume about 2 tons of silicate mineral per ton of CO2. Therefore, large-scale mining
would be necessary if mineral storage would become a main storage site; but there are also other ideas for small-scale applications. For instance, mineral storage in wastes from inciner-ators, steel and cement industries [8].
Injecting carbon dioxide directly into underground geological formations is the idea of the geological storage. There are three different options for geological storage: saline formations, oil and gas reservoirs and deep coal seams [7]. Saline formations are the most promising long-term option, because they have the greatest storage quantities and are geographically more accessible. Oil and gas reservoirs on the other hand have already been utilized in the oil and gas sector on a commercial scale and the technology is ready. Furthermore, this technology brings the advantage of enhancing hydrocarbon recovery (Enhanced Oil Recovery) and could
1-3 Integrated Gasification Combined Cycle 9
also reduce the risks of oil and gas reservoirs [8].
CO2 storage exploration is a pressing priority, because suitable storage sites need to be
lo-cated and further knowledge on costs and security is necessary if CCS should represent a main mitigation measure in the global energy mix. The uncertainty is reflected in the expected cost of storing CO2, which is estimated around $ 0.6 to $ 4.5 per tonne of CO2 stored [7].
1-3
Integrated Gasification Combined Cycle
In order to achieve a significant reduction of CO2 emissions in the near future, CCS should be applied to various large point sources of carbon dioxide [5]. The world’s largest CO2
emit-ters are power plants. Therefore, the IEA expects that the highest deployment of CCS until 2050 will be in the power sector [5]. One of the applications of CCS in the power sector is the incorporation of capture units into IGCC power plants. An IGCC power plant gasifies carbon based fuels into a syngas, cleans the latter one from impurities and burns it in a gas turbine. The exhaust gases are then routed to the Heat Recovery Steam Generator (HRSG). The generated vapor is then fed to a steam turbine to produce energy.
The advantage of IGCC systems is that the combustion process is cleaner than for traditional carbon based systems. The GHG-emissions are lower. In fact, the gas turbines demand deep gas cleaning, and therefore impurities are removed before routing the syngas to the gas turbine [13]. If the plant is coupled to a capture system, also the CO2 emission can be significantly reduced. Different capture technologies can be applied. This work will focus on the integration of a pre-combustion CO2 capture unit into an IGCC power plant.
Figure 1-8 presents a detailed process description of a possible IGCC plant configuration with a pre-combustion CO2 capture unit. Coal, after an appropriate preparation depending on the type of gasifier, is fed to the gasifier together with pure oxygen from the air separation unit (note that also other carbon based fuels as biomass could be used). A synthetic gas containing mainly H2 and CO is produced at high temperature and pressure. The high temperatures lead to a high sensible heat content, but most of it is recovered producing steam which is send to the steam turbine. The syngas then enters cyclones & filters and the water scrubber, where the HCl and the remaining fly ash is removed. In the next step, called COS Hydrolysis, COS is converted to H2S (note that also HCN reacts to NH3). This is necessary in order to recover most of the sulphur in the downstream H2S removal section. The sulphur at the outlet is
sent to the Claus plant, where pure sulphur is produced as a by-product. Following this, the fuel gas is transferred to the sweet shift reactors, where the so called water-gas shift (WGS) reaction takes place. The reactors convert most of the carbon monoxide to carbon dioxide and hydrogen. After this, a washing column removes the carbon dioxide from the gasified fuel. The CO2 is recovered and compressed in an intercooled multistage compressor. The clean fuel, which contains mainly H2, is mixed with nitrogen and/or water and fed to the
gas turbine. The exhaust gases from the turbine are cooled down in the HRSG to evaporate water for the steam turbine. Both gas and steam turbine, produce electricity.
This process is a simplification of the real process and is only one of the many possible configurations, which depend, e.g., on the type of gasifier and the degree of process integration.
Figure 1-8: Block flow diagram of IGCC plant with CO2capture, adapted from [13]
Another distinction between the different processes is the location of the shifting section. If the shifting section is located before the H2S removal section one deals with a ‘sour shift’, otherwise with a ‘sweet shift’. Sweet shift reactors are less expensive as the catalyst is not required to be sulphur resistant. In contrast, the attractiveness of sour shift is given from higher process efficiencies. However, the choice depends also on the degree of CO conversion, the durability of the catalyst and the possibility to by-pass the shifting and CO2 absorption section. An accurate description of the process and the different configurations is beyond the scope of this work. Useful information can be found on the website of the U.S. Energy Department [14].
1-4
Literature review (recent process design and optimization
stud-ies)
This literature review focuses on IGCC power plants with pre-combustion CO2 capture units. Several studies have been performed. An extensive techno-economic analysis of different IGCC configurations was done by Huang et al. [13] in 2008. The authors compared the Shell dry feed and General Electric (GE) wet feed entrained flow gasifier with and without CO2 capture, for both a sweet and sour shift configuration. The GE IGCC power plant was slightly less expensive and produced more electricity. Nonetheless, the much lower efficiency led to a higher breakeven electricity selling price (the hypothetical electricity price for which the net present value would be zero). For both gasifier types, the sour shift configuration had higher efficiencies and lower electricity generation costs than the sweet shift option. The overall efficiency losses, due to the introduction of the capture unit, were between 8 and 11%.
1-4 Literature review (recent process design and optimization studies) 11
Figure 1-9: Optimized novel WGS configuration studied from Martelli et al., adapted from [15]
The efficiency loss represents the major drawback of the integration of a capture unit into IGCC power plants. Therefore, the success of CCS technologies will depend among others on the ability to reduce this energy penalty. How to reduce this energy penalty was inves-tigated by Kunze, Riedl and Spliethoff in 2011 [16]. The paper shows that the gas turbine, the gasifier and the capture unit (shifting, H2S removal and CO2 removal section) cause the highest exergy losses in the IGCC plant. Thus, the improvement and optimization of these units could lead to high efficiency gains. Therefore various studies focused on the capture unit, especially on the shifting section.
Martelli et al. studied novel WGS configurations, which require less steam for the same degree of CO conversion. This increases the plant efficiency [15]. They proposed a new configuration for approximately 93% of overall carbon capture, which uses a steam injection before the first reactor and a single syngas quench between the first and second reactor (see Figure 1-9). It was shown that the new configuration reduces significantly the levelized cost of energy. This was already expected from Carbo et al. in 2009. In fact, Carbo already expected that the gain in efficiency of novel WGS configuration would overcompensate the higher capital ex-penses. The capital costs are higher than in traditional configurations, because of the bigger catalyst volume and the higher number of reactors used [17]. In addition, Carbo proved that the attractiveness of these novel configurations is independent from the choice between sour and sweet shift, and the choice between slurry- and dry-fed gasification. In this study it was also observed that there is an optimum CO2 capture ratio between 80 and 90%, calculated as the specific lost work per captured amount of CO2.
A more extensive optimization of a sour shift capture unit of an IGCC plant with precom-bustion CO2capture was performed in 2010 [18]. In the absorption section (H2S removal and CO2 removal unit) the physical solvent Selexol was used to absorb H2S and CO2. In order to
regenerate the two gases from the solvent, a flash vessel in the CO2 absorption section and a stripper in the H2S absorption section were used. The authors, Bhattacharyya, Turton and Zitney performed an optimization including design decisions and operating conditions. The trade-off between CO conversion (in the shifting section) and CO2 recovery (in the CO2 ab-sorption section) to achieve a fixed overall capture rate of 90% was analyzed. An optimization of the pressures of the flash vessels in the absorption section was also included. The results show that with the optimization of the above described variables, a considerable gain in the
Figure 1-10: Nuon Magnum power plant in Eemshaven, Netherlands [20]
net plant efficiency and the power output is achievable.
A few pre-combustion IGCC capture pilot plant are in operation for experimentation and acquisition of operating experience. One of these is the CO2 capture pilot plant which has been build at the site of the Buggenum IGCC power station (253 M We) [19]. The pilot plant
uses uses approximately 0.8% of the total syngas stream of the power plant. The capture unit is based on a pre-combustion sweet-shift capture technology, which uses dimethyl-ether of poly-ethylene-glycol (DEPG) as physical solvent in the absorption section. The decision between sweet and sour shift fell on sweet shift, as sweet shift is more adequate to by-pass the CO2 capture unit if the CO2 market price does not justify the additional cost of CCS. This could become relevant for an eventual fluctuating carbon price in the future. The drawback of sweet shift is that the efficiency loss is higher. Therefore, most research work till now focused on sour shift and less literature is available on sweet shift.
1-5
Research questions
This work deals with the analysis and optimization of the pre-combustion CO2 capture unit which should be integrated into the IGCC power plant Nuon Magnum in Eemshaven (see Figure 1-10). The capture unit includes a shifting, CO2 removal, H2S removal and CO2
compression section. With respect to most other research works, the present work focuses on a sweet shift capture unit and is based on experimental results. In fact, results from test runs at the pilot plant in Buggenum (see section 1-4) and the obtained operating experience is used throughout the model development and analysis. The primary objective is to reduce the energy penalty related to the introduction of CO2 capture to an IGCC power plant. The
following research questions have been addressed in this project and are treated in the thesis: • Comparison of the thermodynamic and economic convenience between chilling (down
1-5 Research questions 13
• Development of a suitable optimization framework for the optimization of the capture unit, and analysis of the influence of the minimum steam/CO ratio and the minimum inlet temperature of the WGS reactors on the energy consumption of the capture unit • Impact on the performance of the sulphur absorption section in case the CO2absorption
section is by-passed (no capture)
The outcome of previous studies has been used as a starting point, e.g., the design of the shifting section (see Chapter 2) recalls the novel WGS configuration proposed by Martelli [15]. A detailed sensitivity analysis and optimization of the operating variables of the cap-ture unit was performed. Configuration changes are not taken into consideration. However, different column heights and different solvent cooling systems for the absorption section were investigated.
Chapter 2
Process description
In 2005, Nuon, a Dutch utility company, started the development of a multi-fuel Inte-grated Gasification Combined Cycle (IGCC) power plant, the so-called Nuon Magnum, in Eemshaven, the Netherlands [21]. They decided to build a pre-combustion IGCC pilot plant at the site of the Buggenum power station (see Sec. 1-4) with the aim to use the knowledge for the scaled-up Magnum power plant. The Magnum IGCC power plant was planned to be built in two phases. First, a natural gas combined-cycle power plant would be realized, and afterwards it would be converted into an IGCC power plant with an integrated capture unit. The first phase was launched in 2007 and was concluded in 2012, while phase two was postponed, due to the rise in raw material costs and in general the unanticipated magnitude of the investment [22]. In any case, it was decided to proceed with detailed studies about the design of a large-scale IGCC power plant integrating CO2 capture technology. The plant consists of three combined cycles with a net power output of 438 MW each, for a total electri-cal output of approximately 1,300 MW [22]. For each gas turbine a separate capture unit is planned, which treats more than 70 kg/s of syngas coming from a dry-feed gasifier by means of a sweet-shift and bulk CO2 removal. Almost 80 kg/s of CO2 should be captured for each
capture unit, which is equivalent to an overall capture rate of approximately 85%.
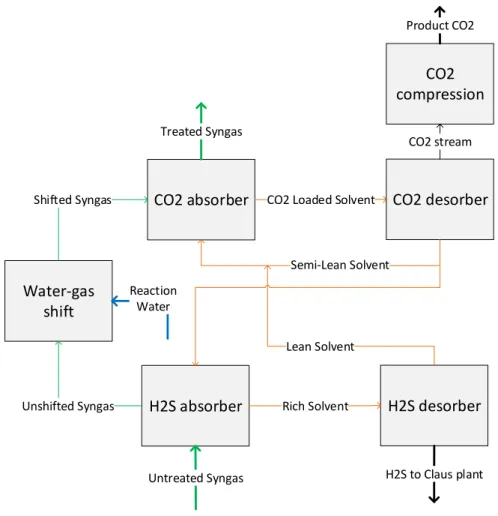
In this work a fixed design for the capture unit is used. This has already been developed pre-viously. The planned capture unit is made of the following four main sections: H2S removal,
water-gas shift, CO2 removal and CO2 compression. Figure 2-1 shows the integration of the sections. The syngas from the downstream gasifier is fed to the H2S Absorber. The physical solvent DEPG extracts the hydrogen sulfide (H2S) from the main stream. After that the
solvent is regenerated in a desorber, and the H2S is sent to a Claus plant where pure sulphur is produced as a by-product. The poisonous, corrosive, flammable and explosive hydrogen sulfide has to be removed from the syngas upstream the shifting unit in order to protect the catalyst of the shift-reactors. By adding Reaction Water to the Unshifted Syngas the desired steam/CO ratio for the water-gas shift is obtained. The operating temperature of the reactors is around 300◦C to 500◦C and thus the syngas has to be heated after the H2S absorption,
Water-gas shift
H2S desorber H2S absorber Rich Solvent
Lean Solvent H2S to Claus plant Untreated Syngas Unshifted Syngas Reaction Water
Figure 2-1: Layout of the studied capture unit
into CO2 in order to facilitate the carbon dioxide absorption process in the downstream CO2
Absorber column. Like in the H2S Absorber, DEPG is used to remove the CO2 from the main process stream. Afterwards the CO2 is recovered by means of a three stage-flash, which
in Figure 2-1 is for simplicity indicated as the CO2 desorber. Almost pure CO2 exits the CO2
desorption unit and is sent to the storage site after a multi-stage intercooled compression. The syngas at the outlet of the CO2 Absorber is fed to the combined cycle. The
particu-larity of this design is that the two absorption sections are integrated into each other. In other words, the same solvent passes first through the CO2 Absorber and then through the H2S Absorber. A detailed description of the individual sections follows in the next paragraphs.
2-1
Water-Gas Shift Section
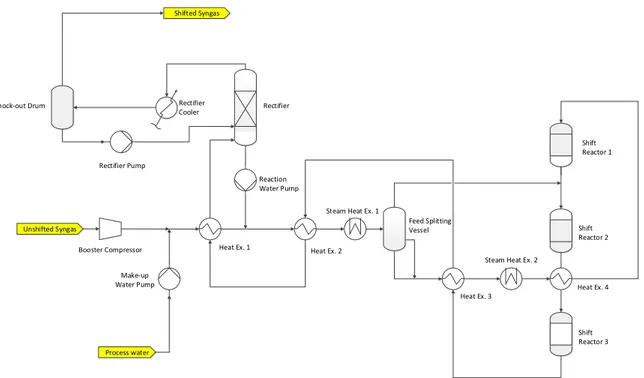
The purpose of the CO shifting section is an efficient conversion from carbon monoxide to carbon dioxide. Figure 2-2 shows a simplified process flow diagram of the water-gas shift section. The Unshifted Syngas coming from the upstream Sulphur Absorber is fed to the Syngas Booster Compressor. The compressor has to overcome the pressure drop of the capture
2-1 Water-Gas Shift Section 17 Unshifted Syngas Shift Reactor 1 Shift Reactor 2 Shift Reactor 3 Shifted Syngas Process water Feed Splitting Vessel Heat Ex. 4 Steam Heat Ex. 2
Heat Ex. 3 Steam Heat Ex. 1
Heat Ex. 2 Heat Ex. 1 Make-up Water Pump Booster Compressor Rectifier Reaction Water Pump Rectifier Pump
Knock-out Drum Rectifier Cooler
Figure 2-2: Simplified process flow diagram of the shifting section, based on CB&I Lummus design
unit, because a minimum pressure at the inlet of the Combined Cycle is required. It is located upstream the CO2 absorption section, because higher pressures favour the absorption process. Furthermore, a study which was performed by CB&I Lummus before this project, but within the same larger research project focused on CCS, shows that locating the compressor upstream the shifting section is more beneficial than locating it downstream. The energy consumption of the entire shifting section is reduced. This is partly caused by a lower energy consumption of the compressor, due to lower pressure ratios for the same pressure increase and lower volumetric flow rates. The rest is caused by less required steam for the Steam Heat Exchangers. In fact, for higher condensing pressures more heat can be regenerated from the vapor effluent of the reactors. Therefore, less steam is needed for the feed preheat [21]. An alternative to the Syngas Booster Compressor is to use a higher gasifier pressure. Although this option can also guarantee a minimum inlet pressure to the combined cycle without using any compressor, it was not studied during the research project, because a detailed input from the gasifier licensor was missing.
The compressed syngas is then mixed with make-up water at the same pressure. How much make-up water is necessary is mainly determined by the water consumption in the water-gas shift reactors. Reaction water coming from the Rectifier is then added to the outlet stream of the mixer. The aim is to a achieve a sufficient steam/CO ratio for the WGS reactors. A series of heat exchangers heat up and partially evaporate the combined feed by recovering the sensible and latent heat from the reactor effluent. To achieve the requested shift reaction temperature, additional heat has to be provided by intermediate pressure steam (IP steam) coming from the gasifier syngas cooler and used in the two steam heat exchangers. Between the heat exchanger train a Feed Splitting Vessel is located. It separates the reactor feed in two
ture. Consequently, the inlet temperature to the reactors is a trade-off between the reactor size and the operating costs. If the inlet temperature is low, the reaction is slow and the reac-tor dimensions have to increase causing higher investment costs. For high inlet temperature the reaction is faster. The reactors can be smaller, but the thermodynamic equilibrium of the reaction is disadvantaged. Therefore, the steam/CO has to be pushed higher in order to obtain the same CO conversion. This leads to a higher energy consumption causing higher operating costs. The trade-off between the reaction equilibrium and the reaction velocity influences also the shifting section configuration. In fact, the shifting section is often divided into two parts: a high temperature stage for an initial fast conversion, due to high reaction velocities, and a downstream low temperature stage. In the second stage the reaction velocity is low, but the equilibrium is favoured and deeper conversions can be achieved [17].
Another factor which influences the WGS reaction is the steam/CO ratio. The higher the steam/CO ratio, the more the reaction proceeds to the right and more CO is converted to CO2. Therefore, steam is always added in excess, so that the overall steam/CO ratio is above
stoichiometric ratios. This drives the equilibrium of the shift reaction further to the right, limits the temperature increase in the reactors and protects the catalyst from undesired iron carbide formation. On the other hand too high steam/CO ratios influence negatively the energy consumption. Accordingly, also the steam/CO ratio has to be chosen accurately to perform an optimal shift reaction in terms of energy consumption; but the optimal choice de-pends, e.g., also on maximum adiabatic temperature rise in the WGS reactors. Throughout the reactors the temperature always increases, because the water-gas shift reaction is exother-mic (∆H298◦ = −41.1kJ/mol). This temperature increase has to be controlled, because there is a limit on the highest outlet temperature of the reactors (about 520◦C) in order to avoid irreversible deactivation of the catalyst by sintering [23]. A higher steam/CO ratio reduces the adiabatic temperature increase. Nevertheless, the WGS reactors have to be intercooled in order to avoid sintering and to favour the equilibrium of the WGS reaction. The first reactor effluent is cooled by the quench stream coming from the Feed Splitting Vessel. The hot effluent of the second and third reactor is instead cooled in the heat exchanger train. The cooled shifted syngas is then sent to the Condensate Recovery Section.
In the Condensate Recovery Section as much water as possible should be recovered from the shifted syngas. In this way, the make-up water stream can be limited and less heat is wasted. Some of the excess vapor from the shift reactor effluent has already been partially condensed in the heat exchanger train. The Rectifier favours further the condensation and strips off the condensed water. The rectifier bottom (mainly water) is sent back to the syngas upstream the
2-2 Absorption Section 19
reactors. The overhead stream is sent to the Rectifier Cooler, where most of the remaining water in the H2 rich syngas is condensed and thereafter separated in the Knock-out Drum
and fed to the Rectifier. The Shifted Syngas at the top of the Knock-out Drum is sent to the CO2 Absorber.
2-2
Absorption Section
The absorption section is a dual-stage DEPG unit. It removes H2S and CO2 from the syngas
by selective absorption with a DEPG-type commercial blend, composed of polyethylene glycol dimethylethers (glymes). The absorber and desorber columns are packed with structured packing. The aim of this section is to separate the syngas into a hydrogen rich gas, a CO2
stream and an acid gas stream. In this work two different configurations are analyzed: an ambient temperature configuration (ATC) (also called unchilled configuration) which uses only water coolers to cool down the solvent, and a below-ambient temperature configuration (BATC) (also called chilled configuration) which makes use of chillers in order to cool down the solvent to lower temperatures. The two configurations will be explained in the following two subsections.
2-2-1 Ambient temperature configuration (ATC)
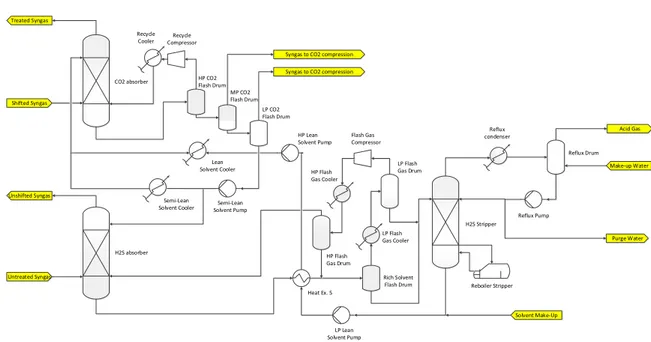
Lean Solvent Cooler Shifted Syngas
CO2 absorber HP CO2 Flash Drum MP CO2 Flash Drum LP CO2 Flash Drum Recycle Compressor Semi-Lean Solvent Pump H2S absorber Untreated Syngas Unshifted Syngas Treated Syngas H2S Stripper Heat Ex. 5 LP Lean Solvent Pump LP Flash Gas Drum Rich Solvent Flash Drum Flash Gas Compressor HP Flash Gas Drum Reflux Drum Reflux Pump Purge Water Make-up Water Acid Gas Syngas to CO2 compression
Syngas to CO2 compression Recycle Cooler Semi-Lean Solvent Cooler Reflux condenser HP Lean Solvent Pump LP Flash Gas Cooler HP Flash Gas Cooler Reboiler Stripper Solvent Make-Up
Figure 2-3: Simplified process flow diagram of the absorption section (ambient temperature configuration)
Figure 2-3 shows a simplified process flow diagram for the ambient temperature configuration. The untreated syngas coming from the gasifier passes through the H2S Absorber, where most of the hydrogen sulfide is removed. The off-gas from the H2S Absorber leaves the absorption unit as Unshifted Syngas and is fed to the shifting section. The H2S is absorbed into the
from the solvent to the vapor. Consequently, the steam at the top of the column is rich in H2S. In order to recover the hydrogen sulfide, the steam is condensed in a Reflux Condenser.
A simple Reflux Drum then separates the condensed liquid from the vapor phase. The latter one is called Acid Gas stream and is sent to the Claus plant. At the bottom of the Reflux drum a Make-up water stream is added for purification issues. To compensate the Make-up water the same amount of water has to be removed with the Reflux stream. Furthermore, some water is co-absorbed together with CO2 and H2S in the absorber columns and has to be extracted in order to maintain a fixed water content in the solvent. The two withdrawn water streams together form the Purge Water stream. Finally, the rest of the Reflux stream is sent back to the regenerator column.
The Lean Solvent at the bottom of the H2S Stripper is mixed with make-up solvent and
after the Heat Ex. 1 and an apposite pressure increase the solvent is sent back to the CO2
Absorber. In the CO2Absorber carbon dioxide is removed from the Shifted Syngas and passes into the solvent. The Treated Syngas is sent to the combined cycle, while the liquid solvent at the bottom is routed to the CO2 Flash Drums. In contrast to the H2S Stripper, the CO2
is recovered by simple depressurization in three flash drums. No stripping column and no temperature increase is necessary, since the desorption of the carbon dioxide is much easier and a less deep removal is required. The first flash drum recovers H2 and CO. These burnable
components have a high heating value and are sent back to the absorber after compression and cooling. The loaded solvent at the bottom outlet of the flash drum is sent to the MP and LP CO2 Flash Drum. Almost pure CO2 gas is recovered from the off gases of the flash
drums and sent to the CO2 compression section. The solvent at the bottom outlet of the last flash drum is sent to the Semi-Lean Solvent Pump. A minor fraction of the pressurized Semi-Lean Solvent is sent to the H2S Absorber, while the rest is cooled and fed again to the
CO2 Absorber.
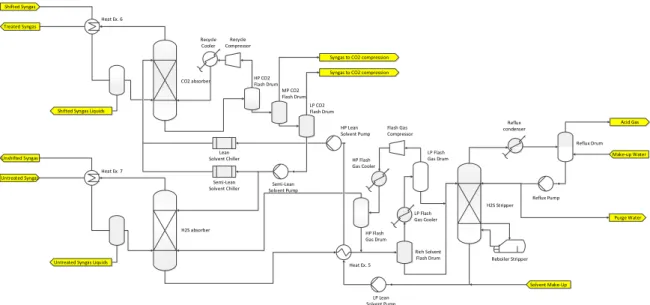
2-2-2 Below ambient temperature configuration (BATC)
The attractiveness of a below-ambient temperature configuration is that the absorption pro-cess is favoured at low temperatures. Hence, chilling the solvent instead of only cooling it is advantageous for the absorber columns. In a first approximation, the phenomenon is explained by the laws which are followed by a physical absorption process, namely:
2-2 Absorption Section 21
Lean Solvent Chiller Shifted Syngas
CO2 absorber HP CO2 Flash Drum
MP CO2 Flash Drum LP CO2 Flash Drum Recycle Compressor Semi-Lean Solvent Pump H2S absorber Untreated Syngas Unshifted Syngas Treated Syngas H2S Stripper Heat Ex. 5 LP Lean Solvent Pump LP Flash Gas Drum Rich Solvent Flash Drum Flash Gas Compressor HP Flash Gas Drum Reflux Drum Reflux Pump Purge Water Make-up Water Acid Gas Syngas to CO2 compression
Syngas to CO2 compression Recycle Cooler Semi-Lean Solvent Chiller Reflux condenser HP Lean Solvent Pump LP Flash Gas Cooler HP Flash Gas Cooler Reboiler Stripper Solvent Make-Up Heat Ex. 6
Shifted Syngas Liquids
Heat Ex. 7
Untreated Syngas Liquids
Figure 2-4: Simplified process flow diagram of the absorption section (below-ambient tempera-ture configuration)
yi = Hi· xi (2-2)
The equation governs the distribution of a single component between the vapor and the liquid phase once equilibrium is reached. The mole fraction in the vapor phase of the component i is the product of the equilibrium constant Hi and the mole fraction of the component i in
the liquid phase. The equilibrium constant Hi depends on the pressure, temperature and composition. For highly diluted solutions the equilibrium constant follows the Henry’s law, while for less diluted solutions, as in the CO2 and the H2S absorbers, the Raoult’s law is the better approximation of reality. Under the hypothesis of an ideal solution and an ideal gas for the Raoult’s law the equilibrium constant Hi can be written as:
Hi = Pivap(T )/P (2-3)
Combining the two equations the mole fraction in the vapor phase of the component i can be expressed as:
yi = Pivap(T ) · xi/P (2-4)
The equation Eq. (2-4) [24] shows how the mole fraction of CO2and H2S in the syngas can be
reduced in the absorber columns. The vapor pressure should be as low as possible, while the total pressure as high as possible. Since the vapor pressure increases with the temperature, higher total pressures and lower temperatures favour the absorption process. Note that the above equations should give a general explanation of the influence of the temperature and pressure on the absorption process. In fact, note that the mixtures present in the CO2 and H2S absorber are no ideal solutions and gases.
2-3
CO
2Compression Section
1° CO2 Knock-out Drum Syngas from LP CO2 flash-drum
Product CO2
1° CO2 Compressor 2° CO2 Compressor
Syngas from MP CO2 flash-drum
1° CO2 Cooler 2° CO2 Knock-out Drum 3° CO2 Compressor 2° CO2 Cooler 3° CO2 Knock-out Drum 4° CO2 Compressor 3° CO2 Cooler 4° CO2 Knock-out Drum 5° CO2 Compressor 4° CO2 Cooler 5° CO2 Cooler
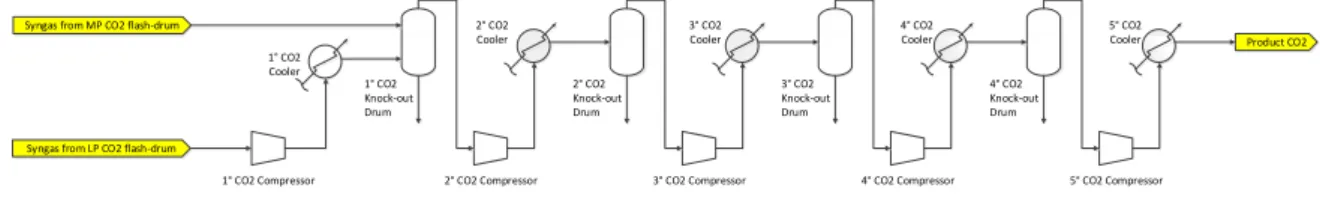
Figure 2-5: Simplified process flow diagram of the compression section, based on CB&I Lummus
The CO2 compression section is made of a five-stage intercooled compressor with discharge
Knock-out Drums. The aim of this section is to supply the almost pure CO2 stream at an
adequate pressure and temperature to the pipeline which transports the carbon dioxide to a storage site.
Figure 2-5 shows a simplified process flow diagram of the compression section. The CO2
stream separated from the medium pressure (MP) and low pressure (LP) CO2 Flash Drum enters the CO2 compression section. The low pressure stream is compressed in the first CO2
Compressor and intercooled in the following CO2 Cooler. The outlet pressure is equal to
the pressure of the medium pressure stream and so the two streams can be mixed in the first Knock-out Drum. The condensed liquid is removed in order to protect the following compressors and to obtain a purer CO2 stream. The overhead stream is fed to the second
CO2 Compressor which is followed by the second CO2 Cooler and the second CO2 Knock-out Drum. The same combination of components is repeated also for the last three stages of the compression section. The only exception is the outlet of the last stage. The difference is that here no Knock-out Drum is used after the CO2 Cooler, since no condensed water is present at the outlet of the compression section. In fact, the temperature and pressure at the outlet of the last compressor are above the critical point conditions. The CO2 becomes supercritical
and a compression will not produce any liquid. For a better understanding of the transition from the liquid to the supercritical phase, consult the PT diagram in Figure 2-6. This indi-cates the CO2 phases.
2-4 CO2 Capture Unit Process Flow Diagram 23
Figure 2-6: CO2 phase diagram, adapted from [11]
This configuration is a simplification of the actual design. The condensed liquid is normally sent back to the CO2 absorption section; but the mass flows of these knock-out streams are very small and have a limited impact on the performance of the absorption section. For simplicity these tear streams were left out. Furthermore, no drier was considered in the compression section. In an actual compression section a drier is used to extract the remaining water from the CO2 stream before the fluid is compressed and becomes supercritical.
2-4
CO
2Capture Unit Process Flow Diagram
The process flow diagrams of the entire capture unit for the ambient and below-ambient tem-perature configuration are represented in Figure 2-7 and Figure 2-8, respectively.
2-5
Definitions
In this section some important definitions to measure the efficiency of the capture unit are given.
The efficiency of the water-gas shift section is called CO conversion efficiency. It represents a measure of the fraction of CO converted in the shift reactors:
ηCO=
˙
mCO_U nshif ted− ˙mCO_Shif ted
˙
mCO_U nshif ted
(2-5) The Shifted Syngas at the outlet of the WGS section is then fed to the absorption section and compression section, where CO2 is removed from the main syngas stream. The efficiency
of this process is called CO2 recovery or CO2 absorption efficiency:
ηCO2 = ˙ mCO2_P roduct_CO2 ˙ mCO2_Shif ted (2-6)
CO 2 ab so rb er HP C O 2 Fl as h D ru m M P C O 2 Fl as h D ru m LP C O 2 Fl as h D ru m H 2 S ab so rb er U n tr e a ted Sy n g as H 2 S St rip p er Pu rg e W ater M ak e-u p W at er A cid G as Reb o iler St rip p er P ro d u ct C O 2 ift cto r 1 ift cto r 2 ift cto r 3 So lv en t M ak e -Up Tr ea te d Sy n ga s Sh ift ed S yn ga s L iq uid s U n tr ea ted Sy ng as L iq u id s p ro cess flo w diagram of the cap ture unit (b elo w-ambient temp erature configuration) CO 2 ab so rb er HP C O 2 Fl as h D ru m M P C O 2 Fl as h D ru m LP C O 2 Fl as h D ru m H 2 S ab so rb er U n tr ea ted Sy ng as Tr ea te d Sy n ga s H 2 S St rip p er Pu rg e W ater M ak e-u p W at er A cid G as Reb oiler St rip per Pr od u ct C O 2 Sh ift Rea cto r 1 Sh ift Re ac to r 2 Sh ift Rea cto r 3 p ro cess flo w diagram of the ca pture unit (ambient temp erature configuration)
2-5 Definitions 25
To measure the efficiency of the entire capture unit the overall carbon removal (also called CO2capture rate) is used. It is calculated as the total mole flow of carbon in the CO2Product
stream over the total carbon mole flow in the Untreated feed stream:
ηC =
( ˙nCO2 + ˙nCO+ ˙nCOS+ ˙nCH4)P roduct_CO2
( ˙nCO2 + ˙nCO+ ˙nCOS+ ˙nCH4)U ntreated (2-7) It should be noted that a fixed capture rate can be achieved with various combinations of CO2 recovery and CO conversion. If the CO conversion is increased, the CO2 recovery can be decreased and the opposite. An analytical explanation follows from Eq. (2-7). For a fixed CO2 recovery ˙mCO2_P roduct_CO2 is constant. If the CO conversion augments, more CO is shifted to CO2, and the CO2 flow rate in the Shifted Syngas ( ˙mCO2_Shif ted) augments. Con-sequently, the CO2 recovery decreases.
The energy consumption of the capture unit is significantly influenced by this trade-off. To increase the CO conversion typically more process water is added in order to augment the steam/CO ratio in front of the reactors. This augments the steam consumption in the Steam Heat Ex., and consequently the energy consumption of the water-gas shift section augments. On the other hand, if the CO conversion is increased the CO2 recovery can be reduced. This can be achieved by changes in different process variables: decreasing the solvent/gas ratio in the CO2 Absorber, increasing the temperature of the solvent, decreasing the number of
stages in the CO2 Absorber column, or lowering the extent of CO2 desorption by varying the pressures in the CO2 flash drums. All lead to a lower energy consumption of the absorption
section [18]. The physical reason why the energy consumption is reduced is the following: if more CO is shifted to CO2, the partial pressure of the CO2 in the Shifted Syngas augments. A higher partial pressure is beneficial for the CO2 absorption process, which consequently
consumes less energy. The optimization of the entire capture unit will take into consideration this trade-off.
Chapter 3
Steady-State Modeling and
Methodology
3-1
Modeling tools (Process software, thermodynamic model,
op-timization framework)
For the process modeling of the CO2capture unit the commercial software Aspen Plus Version
7.3 was chosen. The cost estimation and some optimization problems were also performed in Aspen. For the more complex optimizations the process simulator was interfaced with Matlab, and an available optimization algorithm was used.
Aspen Plus Aspen is a commercial software developed by AspenTech. It is a useful tool
to model, optimize and monitor different processes, in particular chemical ones. Reaction kinetics, mass and energy balances, phase and chemical equilibrium are implemented in order to predict the process behaviour. The flowsheet is commonly solved in Sequential Modular (SM) mode. The outlet stream of each block is used as an inlet stream for the next block. If recycles are present, tear streams and process loops are identified, which are solved in an iterative manner. Therefore, for very complex flowsheets, as the case of the capture unit, the equation-oriented mode (EO) is more suitable. It solves all model equations simultaneously avoiding iterations and is computationally very efficient. Furthermore, in EO mode process optimizations can be performed. This functionality was used to optimize the overall capture unit. The drawback of the EO strategy is the complexity of the model development, because very good estimates for all the variables have to be given before solving the flowsheet [25]. This made the process development of the capture unit particularly difficult, since the model is very complex and has umpteen tear streams.
Aspen Plus also offers an integrated economic analyzer (Aspen Process Economic Analyzer), which can evaluate capital and operating costs. This enables the comparison of different pro-cess from an economic point of view. The cost estimation is performed after the flowsheet has
![Figure 1-1: Global-energy-related CO 2 emissions for different scenarios, adapted from [4]](https://thumb-eu.123doks.com/thumbv2/123dokorg/7508613.105006/18.892.200.715.162.470/figure-global-energy-related-emissions-different-scenarios-adapted.webp)
![Figure 1-2: Global-energy-related CO 2 emissions abatement in the 450 Scenario relative to the New Policies Scenario [4]](https://thumb-eu.123doks.com/thumbv2/123dokorg/7508613.105006/19.892.138.770.508.740/figure-global-emissions-abatement-scenario-relative-policies-scenario.webp)
![Figure 1-8: Block flow diagram of IGCC plant with CO 2 capture, adapted from [13]](https://thumb-eu.123doks.com/thumbv2/123dokorg/7508613.105006/26.892.191.714.155.540/figure-block-flow-diagram-igcc-plant-capture-adapted.webp)
![Figure 1-9: Optimized novel WGS configuration studied from Martelli et al., adapted from [15]](https://thumb-eu.123doks.com/thumbv2/123dokorg/7508613.105006/27.892.195.712.159.365/figure-optimized-novel-wgs-configuration-studied-martelli-adapted.webp)