Alma Mater Studiorum · Universit`
a di Bologna
Scuola di Scienze
Dipartimento di Fisica e Astronomia Corso di Laurea in Fisica
Decay of the excited
16
O quasi-projectile in
the
16
O +
12
C reaction at 130 MeV
Relatore:
Prof. Mauro Bruno
Correlatore:
Dott. Catalin Frosin
Presentata da:
Maria Vittoria Managlia
Contents
Abstract 1
Introduction 2
1 The physical context 3
1.1 Introduction to reaction mechanisms . . . 3
1.2 QP excitation in peripheral collisions . . . 7
1.3 Clustering effects in nuclei . . . 9
1.3.1 The 16O Nucleus . . . . 12
2 The experimental apparatus and the measurements 14 2.1 G.A.R.F.I.E.L.D. apparatus . . . 14
2.1.1 MSGC microstrip detectors . . . 16
2.1.2 CsI(Tl) crystals scintillators . . . 17
2.2 Ring Counter . . . 19
2.2.1 Ionization chamber (IC) . . . 20
2.2.2 The silicon detectors . . . 21
2.2.3 CsI(Tl) scintillators . . . 21
2.2.4 Monitor detector . . . 22
2.3 Electronics and acquisition . . . 22
2.3.1 Trigger system . . . 23
2.4 The measurement . . . 25
3 Data analysis and results 27 3.1 Energy calibration . . . 27
3.2 Identification of detected ions . . . 30
3.2.1 ∆E − E technique . . . 30
3.2.2 Fast-slow PSA in CsI(Tl) . . . 32
3.3 Data structure and observables . . . 34
3.4 Data selection . . . 36
3.4.2 Energy balance of the decay . . . 36
3.5 Target excitation . . . 39
3.6 Projectile excitation . . . 42
3.6.1 QP decay with QT in ground state . . . 45
3.6.2 QP decay with QT in excited state . . . 49
3.6.3 QP decay with QT in ground or excited state . . . 50
Conclusion and perspectives 52
Abstract
Questo lavoro di tesi `e stato svolto all’interno del gruppo NUCL-EX dell’INFN. L’argomento della tesi `e quello del decadimento di un nucleo eccitato 16O∗, ottenuto
come Quasi-Proiettile in una reazione semi-periferica 16O + 12C a 130 MeV di energia
del fascio incidente. `E stata effettuata una selezione dei dati che ha consentito di definire una reazione nella quale il nucleo incidente 16O, dopo aver interagito con il bersaglio 12C, si eccita ad energie nell’intervallo 17 ÷ 22 MeV, mentre il bersaglio acquista energia
cinetica rimanendo nello stato fondamentale oppure si eccita, ma sotto la soglia di energia utile per decadere in particelle. Sono quindi stati considerati i diversi possibili canali di decadimento dell’16O∗ e cio`e
16
O → 8Begs+8Begs → α + α + α + α (1) 16O → α +12C∗ → α + α +8Be → α + α + α + α (2)
Nel secondo canale sono stati distinti i due casi in cui il12C∗`e eccitato nello stato di Hoyle
(7.65 MeV) o nello stato 3−a 9.64 MeV. Per questi canali sono stati considerati, sia sepa-ratamente che congiuntamente, i casi in cui il bersaglio rimanga nello stato fondamentale o nel primo stato eccitato γ. Sono state calcolate le probabilit`a di decadimento nei di-versi canali e le energie di eccitazione dell’16O∗, che presenta un elevato numero di livelli.
I valori ottenuti sono stati confrontati con quelli presenti nei database ufficiali, trovando numerose conferme. Tuttavia, alcuni picchi nell’energia di eccitazione non corrispondono a livelli noti. Ci`o pu`o essere dovuto alle indeterminazioni sperimentali, all’interferenza fra livelli diversi o a livelli non ancora determinati sperimentalmente. I dati ottenuti saranno confrontati con programmi di decadimento statistico per poter definire accordi e/o discrepanze per individuare eventuali effetti di clustering, cio`e indicazioni di struttura di livelli del 16O∗ formati da insiemi di 4 particelle α.
Introduction
The decay of light nuclei is one of the active area of research in nuclear physics. In particular, the comparison of experimental data with models, based on the statistical decay, is useful to refine models to reproduce data. On the other side, it is possible to underline discrepancies which cannot be reproduced by models. Indeed, one of the most challenging argument is to understand the importance of clustering effects also in excited state of nuclei. It has been suggested that even-even nuclei can show a structure made of α-particles which manifests in rotational bands at different excitation energies. This has been stated, for instance, for 12C∗, starting from the first excited state above
the threshold for particle emission with rotational bands at higher energies, partially highlighted with experiments. The same should hold for the 16O∗, but it is not yet experimentally found. In this line, the INFN NUCL-EX collaboration has started a systematic measurements of the reaction 16O +12C at three different beam energies, i.e.
90, 110 and 130 MeV. This thesis deals with part of the collected data, which correspond to the decay of the Quasi-Projectile16O∗ in a final state of 4 α-particles. The number of
events available at the two lower energies are not enough to allow for detailed analysis. Therefore, only data at 130 MeV have been analyzed in this thesis. In particular it has been investigated the decay of 16O∗ in different decay channels, with the Quasi-Target 12C in the ground or in the first excited state. The decay can proceed through the
formation of two 8Begs which both decay in two 4 α-particles, or through one α-particle
and a 12C∗, which can be in the Hoyle state (0+
2, 7.25 MeV) or in a 3
− excited state
at 9.64 MeV. In the different decay channels the excitation energy of the16O∗ has been
calculated. At variance with 12C∗, which present the two single levels indicated above, the 16O∗ presents a huge number of levels in the region available at this beam energy.
Some of them are visible in the experimental data and different levels are present in the different decay channels.
In this thesis the first chapter describes the physical context of the work, the second deals with the experimental apparatus and the measurements. The calibration of the data and the analysis are described in the third chapter, together with the obtained results. Finally, some conclusions are drawn together with some perspectives.
Chapter 1
The physical context
The basis of most studies devoted to the understanding of structure and dynamical properties of nuclei is the assumption that nuclei are sets of interacting nucleons. In fact, although nucleons are compounds of quarks and gluons, these remain bound in nucleons and, thus, it makes sense to consider nucleons as the effective elementary constituents of nuclei as long as the considered beam energies are not large enough to excite sub-nucleonic degrees of freedom. From this point of view, the quantum chromo dynamics (QCD), which describes the strong interactions between quarks and gluons, can thus also be safely hidden, outside nucleons, in an effective interaction between the nucleons. For this reason, physics of nuclei in the vicinity of their ground state or at low excitation energies is a physics of nucleons interacting via the nucleon-nucleon interaction. This is the case of the present study.
1.1
Introduction to reaction mechanisms
In nuclear physics a nuclear reaction is a type of transformation of matter that involves the nucleus of a specific chemical element which is converted into another with a different atomic number, thanks to the so-called nuclear forces. This conversion can include spontaneous changes occurring in the nuclei, known as radioactive decays, but also those induced by external means, i.e. through nuclear collisions. These interaction phenomena are due to the impact, also known as scattering, between an energetic projectile nucleus (beam) and a target nucleus (target ), generally at rest in the laboratory reference frame. Depending on the purpose and how much one wants to excite the nuclei, the incident beam can be chosen more or less energetic. This way of proceeding allows to access and to study several nuclear properties.
One of the most effective ways to investigate the behaviour of nuclear matter in conditions of extreme density and temperature is the study of the heavy-ion collisions in which other nuclei or nuclear composites, possibly short-lived, are produced.
CHAPTER 1. THE PHYSICAL CONTEXT
A collision can be classified according to several parameters. First of all there is the relative speed between the two particles before the impact, given by:
vrel =
h mλr
(1.1)
where m is the nucleon mass, vrel is the relative velocity between the projectile and the
target and λr is the reduced wavelength related to the nucleon-nucleon interaction. This
relative velocity is an index of the available centre-of-mass kinetic energy that can be partially or entirely transformed into excitation energy during the interaction between the two colliding nuclei. Comparing λr with the mean nucleon-nucleon distance in a
nucleus dn−n, which is ∼ 1.2 f m, two cases can be distinguished:
• If λr exceeds dn−n, it can be assumed that the collision process is of a collective
nature, since a single nucleon is affected by the average interaction due to the presence of all the other nucleons and not by the single collisions between nucleons. For this reason, the interaction between nucleons inside two colliding nuclei can be explained through the mean field theory.
• If λr is smaller than dn−n, the binding energy of the nucleons becomes negligible
and a two-body interaction is used to explain the process. In this case the target can not be treated as a collective entity.
Generally, the effects of mean field and nucleon-nucleon collisions are always present, but in different proportions according to the case that is being studied.
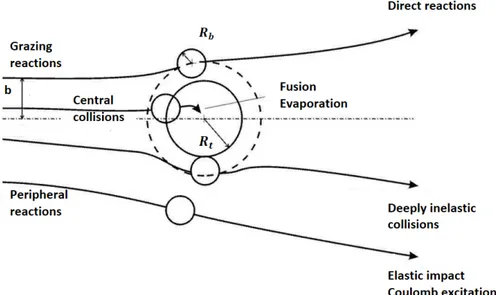
Another important factor for the classification of a collision is the impact parameter which represents the distance between the asymptotic trajectory of the projectile and the parallel line passing through the centre of the target, as shown in figure 1.1.
Figure 1.1: Schematic representation of a nuclear collision, specifically an elastic one, between a beam of alpha particles and a target nucleus. b denotes the impact parameter while θ stands for the laboratory scattering angle of the incident particle.
CHAPTER 1. THE PHYSICAL CONTEXT
The value of the impact parameter provides information on which interaction mech-anisms can occur, as it determines the overlap of the density distributions of the nuclei during the collision.
Let Rb be the average radius of the incident nucleus and Rt the average radius of the
target nucleus. Different cases can occur:
• Electromagnetic elastic diffusion. In this case b Rb + Rt, which means that
the strong nuclear force can be neglected since projectile and target are at a large distance. The impact process is therefore governed by the Coulomb field.
• Grazing condition where b ∼ Rb + Rt. The two nuclei come into contact. The
most superficial nucleons of the projectile and the target start to feel the strong force while the inner ones do not interact. This kind of reactions are called direct reactions. Small amounts of energy can be exchanged by the most peripheral nucleons. There may also be phenomena of excitation of energy levels and elastic reactions. In this case the reaction products have a ”memory” of the starting conditions and their identity. For this reason, in the output channel, there is a fragment similar to the projectile, called quasi-projectile (QP), and one to the target, the quasi-target (QT).
• Deep Inelastic Scattering occurs when b < Rb + Rt. The nucleons, as a whole,
begin to feel the strong force. This case is characterized by strong transfers of energy, angular momentum and nucleons. This significant dissipation of energy also contributes to excite the QP and the QT.
• Compound Nucleus Production occurs in the case where b is small approaching 0. As the impact parameter is so small, the impact is defined as central and it can lead to the fusion of the two starting elements. The reaction product is a compound nucleus (CN), a metastable system with a mean life of about 10−19 ÷ 10−18 s
[1]. The evolution of this system no longer depends on how it was produced. Once equilibrium in the distribution of energy and angular momentum is established, the CN decays in two different ways, depending on the type of nucleus, its excitation energy and its spin. On one hand there is fission in which the compound is divided into two fragments because of the strong nuclear force and the Coulomb repulsion. On the other hand, there is evaporation in which the CN loses its excitation energy by emitting light particles and gamma radiation. The resulting nuclear fragment is referred to as evaporation residue (ER).
Figure 1.2 shows the above-described mechanisms schematically, as a function of the impact parameter b.
CHAPTER 1. THE PHYSICAL CONTEXT
Figure 1.2: Classification scheme of heavy-ion collisions according to the impact parameter.
The impact parameter b is related, in a semiclassical approach, to the angular mo-mentum l of the system by:
b = lλ (1.2)
Hence, the previous subdivision just listed could be done in terms of this quantity. There is an important value of b called the ”grazing” impact parameter bgr, which is the
min-imum value at which nuclear forces are negligible with respect to Coulomb interaction, and there is also a critical angular moment lcrit. It separates the processes of inelastic
dissipation from those of fusion.
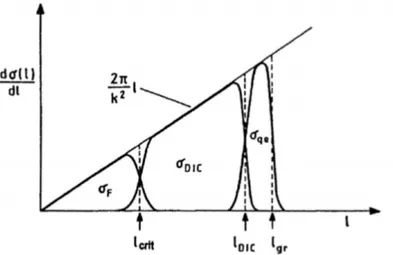
In turn, the angular momentum l is related to the differential cross section for angular momentum units dσ(l)dl by a linear dependence relation, since the geometrical cross section for a given interval l+dl (or b+db) is given by 2πbdb. The reaction mechanisms associated with the different values of the angular momentum are shown in 1.3. For example, at low energies, l values lower than lcrit form the region of central collisions where a compound
nucleus (CN) is formed with the complete fusion of the reaction reagents (σF). The
angular momentum values between lcrit and lDIC individuate the region of Deep inelastic
collisions (σDIC) and for higher values of l the cross section is dominated by direct
CHAPTER 1. THE PHYSICAL CONTEXT
Figure 1.3: Schematic representation, at low energies, of the progress of the contributions to the differential cross section per unit of angular momentum when the angular momentum l varies.
In conclusion, there are two important quantities from a statistical point of view. These are the total cross section
σ = R nb· Φ
(1.3)
and the differential cross section with respect to the solid angle
dσ dΩ = 1 nb· Φ dR(Ω) dΩ (1.4)
where R is the number of particles per unit of volume that have interacted in the unit of time, i.e. the reaction rate per unit of volume, Φ is the ion flow of the beam and nb
is the density of the target nuclei.
1.2
QP excitation in peripheral collisions
In the previous paragraph a classification of the various types of reactions was made according to the values assumed by specific parameters. However, reactions can also be classified by the mechanism that governs the process. As mentioned before, in direct reactions only very few nucleons are involved in the interaction. Specifically, the most superficial nucleons of the projectile interact primarily at the surface of the target nucleus, with the remaining nucleons of both partners serving as passive spectators (figure 1.4).
Such reactions may put or remove a single nucleon from a shell-model state and therefore serve as a way to explore the shell structure of nuclei. These collisions exhaust a large amount of the total reaction cross-section and are thus easily recognized. Among
CHAPTER 1. THE PHYSICAL CONTEXT
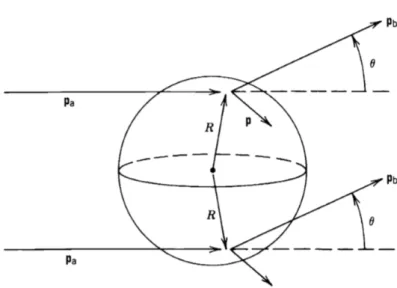
Figure 1.4: Geometry for direct reactions occuring primarly on the nuclear surface. An incident particle with momentum pa gives an outgoing particle with momentum pb, while
the residual nucleus (target nucelus plus transferred nucleon) must recoil with momentum p = pa− pb.
them, scattering processes are also included in which the incident and outgoing particles are the same. If the reaction products are in their ground state, the process is called elastic scattering, whereas if they are in an excited state we call it inelastic scattering.
It is well known that in peripheral collisions the two large final products are referred to as project-like (QP) and target-like fragments (QT) and are easily recognized in the detectors only if the QP and QT excitation energies are moderate. Several cases can occur due to this interaction between projectile and target. One of the possibilities arises when the QT is not excited, while receiving part of the incident energy by transforming it into recoil kinetic energy. Hence, it remains in its ground state. Another possibility occurs, on the other hand, when the QT takes energy from the projectile and reaches excited states. In both cases QP is in an excited state. Peripheral collisions are, thus, associated with the decay of the excited source QP and/or with the one of QT. Therefore, one can study the decay of the excited QP in reactions in which the QT is in its fundamental or in its first excited states. If the decay chain is complex or long, the final products are quite different from the original QP and QT nuclei. Conversely, if it is simple or short, the QP and QT residues still resemble the initial projectile and target nuclei. As the impact parameter decreases, the relative velocity between QP and QT drops as well as their respective atomic numbers. Finally, for the most dissipative collisions, the notion of QP and QT becomes questionable because most of the emitted matter is in the form of light particles and intermediate mass fragments (IMF) [2].
CHAPTER 1. THE PHYSICAL CONTEXT
1.3
Clustering effects in nuclei
Even though the shell model, based on a simple independent particle assumption, has been very successful to explain many of the nuclear properties, it was soon clear that not all experimental features could be theoretically predicted . This is also true for the light nuclei which generally represent the benchmark for theoretical models. Contrary to the standard view of a static collection of neutrons and protons in a spherical nuclear droplet, the nucleus is rather a highly dynamic ensemble of nucleons which feature velocities that can reach a significant fraction of the speed of light. In order to minimize the repulsion originating from the Pauli exclusion principle, identical nucleons pair with spins anti-aligned and in orbitals with maximal overlap, leaving a spin-zero entity. This is possible for both pairs of protons and neutrons resulting in a maximally correlated quartet, 2p +2n, known as the α particle. This tendency of protons and neutrons to aggregate into discrete structures, called clusters, inside the nucleus is referred to as clustering effect. These structures have been interpreted in terms of ”nuclear molecules”. Specifically, this phenomenon can be observed in light nuclei with equal number of protons and neutrons (N=Z). In order to understand these properties, a new viewpoint, other than the independent-particle one, was needed. Starting form the 60’s, the prospect that the molecule-like structure can appear in wide region of nuclei both in mass number and in excitation energy has promoted an extensive development of theoretical and experimental studies on cluster structure in light nuclei, through several research campaigns.
Clustering behaviour has been seen in a wide variety of ways, including:
• Magic core plus orbiting cluster. The valence nucleons, outside a closed shell, can behave like an orbiting cluster, giving characteristic rotational spectra, like those observed for 16O, 40Ca, 90Zn and208Pb.
• Very light nuclei. This case is characterized by small subsystems of the nucleus tightly bound with a tendency for this structure to develop and to be competitive in energy with a mean field configuration. Examples are8Be (α + α) and12C (3α).
• Normal core plus nucleon halo. The final neutron is extremely weakly bound within the mean field of the nucleus, and its wavefunction tends to extend substantially beyond the edges of the nuclear potential into the classically forbidden region.
• Large-scale clustering in low-lying levels. A successful modelling of complex nuclei has been achieved by assuming that they are made up of two mutually orbiting nuclei of comparable masses.
• Large-scale clustering at high excitation. The resonances observed at energies close to the Coulomb barrier in heavy ion scattering, particularly between α−conjugate nuclei, seem to indicate molecular-like states in which the component nuclei orbit at a distance where they just graze against each other.
CHAPTER 1. THE PHYSICAL CONTEXT
• Complete α-particle condensation. An extreme form of clustering behaviour is predicted in some models for A multiple of 4 nucleons, wherein the entire nucleus behaves not as one liquid drop but as a condensation into n separate α-like droplets [3]. When extra excitation energy is added to these nuclei the configuration of the mass centres can unwrap and become spatially extended.
In figure 1.5 the wide variety of different types of clustering behaviour is shown.
Figure 1.5: Variety of types of nuclear clustering from small clusters outside closed shells, to complete condensation into α-particles, to halo nucleons outside of normal core [4].
The formation of cluster inside the nucleus must be allowed from an energetic point of view. In fact, when the nucleus is separated into its cluster components an energy equiv-alent to the mass difference between the nucleus and the clusters must be provided. The cluster structure would be expected to be manifest close to the cluster decay threshold and not in the ground state [5].
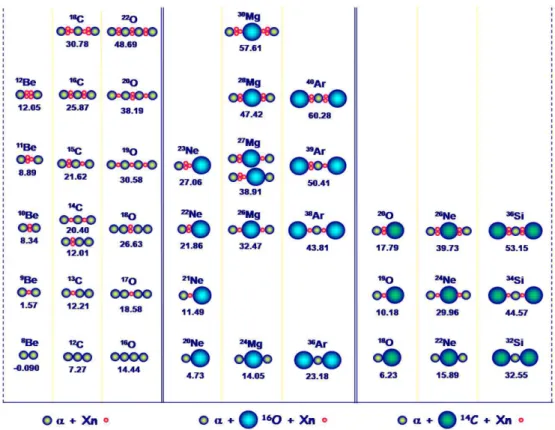
In order to show the possibility of various kind of nuclear clustering, a diagram was presented for α-nuclei where the molecule-like structure appears prominately. This diagram, referred to as ”Ikeda diagram”, displays, as a function of energy and mass number, patterns of all kinds of dissociations of α-nuclei at their respective threshold energies. In the original diagram only N=Z were included. In figure 1.6 also neutron-rich nuclei has been included and the diagram extended [5], [6].
The most simple and convincing example of α clustering in light nuclei is the 8Be
system. Its ground state is unstable and the nucleus decays into two α-particles with a half-life of 2.6 · 10−6 s. The 12C element, instead, presents another interesting cluster structure in one of its excited levels. The latter can be thought of as the one obtained by adding another α particle to the 8Be. In 1953, Fred Hoyle postulated the existence
CHAPTER 1. THE PHYSICAL CONTEXT
of this excited state of 12C at 7.65 MeV in the attempt to explain the abundance of
synthesized carbon in the stars via the triple-α process:
α + α + α →8 Be + α →12C∗ [7.65 M eV ] (1.5) In the boxes on the right and in the center of the diagram in figure 1.6 are shown respectively bound systems with16O or12C as a core with bound α particles and neutrons.
For example the 24Mg over 14.05 MeV can be described as an 16O core plus two α
particles. As for the latter alpha structure, a good example is represented by the nucleus of our interest, namely 16O. This can be pictured above 14.4 MeV as four α particles
bound together as one can notice in figure 1.6.
Figure 1.6: The Ikeda diagram which shows the subunits of the possibile molecule-like struc-ture expected to appear next the respective threshold energies for the break-up into subunit nuclei. The threshold energies are written under each structure.
CHAPTER 1. THE PHYSICAL CONTEXT
1.3.1
The
16O Nucleus
The aim of the present thesis is the study of the decay of the excited16O quasi-projectile following a nuclear reaction in which it interacts with a12C target leaving it in the ground
or in the first excited states. For this reason, it is clear that the structure of16O plays a
vital role in this study and it is therefore necessary to spend a few words on it.
The search for clusters-structures, outlined in the previous paragraph, was also aimed at heavier nuclei, such as16O. For this element several cluster structures have been
pre-dicted: at an energy of 7.16 MeV the 12C + α cluster structure and at 14.44 MeV a 4α-structure should be manifest [3]. The latter was suggested by Chevallier et al. in 1967 [7]. The study of the 12C(4He,8Be)8Be reaction, carried out by them, suggested the
existence of one highly deformed structure whose moment of inertia is approximately four times larger than that calculated for the spherical 16O ground state [8]. In this
pa-per, they have proposed that a structure corresponding to a rigidly rotating arrangement of four α particles may exist in 16O. The 8Be +8Be decay of 16O has also been studied in a measurement of the 12C(16O, 4α)12C reaction by Freer et al. [9]. Although there
is a correspondence between some of the observed states by Freer et al., in the recon-structed16O excitation energy spectrum, and those seen in the work of Chevallier, these last results provide no evidence to support the previously proposed rotational structure consisting of a rigid, linear, arrangement of four α particles in 16O.
Considerable experimental and theoretical effort has been devoted also to the under-standing of the mechanism for the disassembly of the excited 16O projectiles into four α
particles. For this purpose, over the last few years, several studies were carried out on the possibility of highly excited nuclear matter promptly being fragmented into many pieces. One of the problems affecting the experimental observation of these decay processes was the difficulty of distinguishing prompt decay from sequential decay. Specifically, in the case of 16O, the four α particle exit channels have been investigated. The prompt decay channel of 16O features the immediate disintegration of the nucleus into 4 α-particles,
whereas the sequential decay of an 16O projectile into 4 α-particles can take place in
two possible ways. The first one, which is the most important one, is the fission of the incident nucleus into two 8Be fragments, each of which later decays into two α-particles.
16
O∗ → 8Be +8Be → α + α + α + α (1.6) The second one shows an α decay to two different 12C excited states, which then
decay to 8Be + α. More precisely, these two excited states are, in energetic order,
12C(7.65 M eV, 0+
2), which is the famous Hoyle state mentioned in section 1.3, and a 3 −
state at 9.64 MeV excitation energy [9]. Therefore, this exit channel turns out to be the following:
16O∗ → 12C∗+ α → 8Be + α + α → α + α + α + α (1.7)
CHAPTER 1. THE PHYSICAL CONTEXT
cases, it might be convenient to use an alternative and compact notation to indicate a nuclear reaction
X(a, b)Y (1.8)
because it provides information on the common properties of a general class of reactions [2]. This is formally equivalent to the typical notation normally used:
a + X → Y + b (1.9)
where a is the incident projectile, X is the target and Y and b are the reaction products. Usually the heaviest reaction product is indicated with the capital letter. As a consequence, the various decay channels are:
12C[16O,8Be +8Be]12C (1.10) 12C[16O,12C(0+ 2) + α] 12C (1.11) 12C[16O,12C(3− ) + α]12C (1.12) It is important to highlight that in all the decay channels, either going through the
12C + α or two 8Be, the QT can be in its ground state (12C
gs) or in its first excited state
Chapter 2
The experimental apparatus and the
measurements
In this chapter the main features and working principles of the experimental apparatus, used to perform the experiment, will be briefly described. The first section is devoted to the description of the G.A.R.F.I.E.L.D. apparatus, only a part of the overall instrumen-tation, and it is followed by two more detailed subsections about microstrip gas chamber and CsI(Tl) crystals detectors composing G.A.R.F.I.E.L.D. apparatus. Next comes a second section in which, together with the subsections, the Ring Counter (RCo) and all its components will be described. The third part of this chapter is focused on the electronics of the whole apparatus and on the data acquisition. A short description of the measurement is done in the last section.
2.1
G.A.R.F.I.E.L.D. apparatus
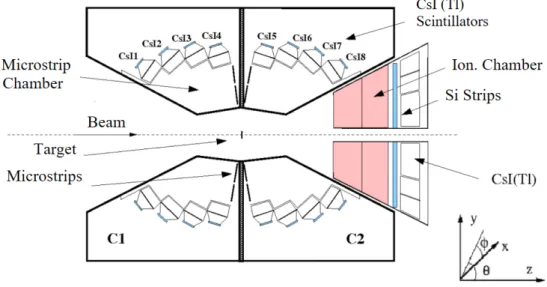
G.A.R.F.I.E.L.D. is an acronym, which stands for General ARray for Fragment Iden-tification and for Emitted Light particles in Dissipative Collisions, for a multi-detector located inside a large scattering chamber at INFN Legnaro National Laboratories (LNL). The G.A.R.F.I.E.L.D. apparatus consists of two large cylindrical shaped drift chambers, one backward, named C1, and one forward, named C2, (Figure 2.1), filled at low pressure
with CF4 gas. The two chambers are placed back to back with respect to the target and
with the axis in the same direction as the incident beam. An uniform electric field for the drift of electrons and ions, formed along the scattered particle ionization track, is obtained by drift electrodes and a partition cage within the chambers. Each of them has two different types of detectors: microstrip gas chamber pads (MSGC) and CsI(Tl) crystals scintillators.
The forward chamber C2 is divided into 24 azimuthal sectors, each of which has a
CHAPTER 2. THE EXPERIMENTAL APPARATUS AND THE MEASUREMENTS
ionization of the gas, on the energy loss ∆E by the reaction products, and four CsI(Tl). These last constitute the second stage of detection since they provide information on the residual energy Er of the particles. The C1 chamber covers the polar angular region
between 29.5◦ and 82.5◦.
The backward chamber C1 has a similar structure to the C2 with the exception of
3 sectors missing and covers the angular region 97.5◦ < θ < 150.4◦. The 45◦ azimuthal aperture can be used for ancillary detectors
With the combination of these two chambers almost the whole solid angle between 30◦ < θ < 150◦, with respect to the beam axis is covered. Considering that every MSGC pad is azimuthally divided in two sub-pads and at the end of each sector four scintillators are placed, there are totally 168 and 192 detection modules, respectively in C1 and C2.
Figure 2.1: Cross section of the G.A.R.F.I.E.L.D. appartus coupled with the RCo. The beam is sent from left to right against the target in the center, between the two chambers C1 and C2.
In the bottom right-hand corner there is the frame of reference used to pinpoint the different detectors.
Indeed, one of the most important parameters for a detector is the granularity, a characteristic which affects the angular resolution and which is related to the probability that two different particles hit the same detector, resulting indistinguishable. This case is known as a double hit. In order to reduce the uncertainty on particle trajectories, it is necessary to have a high value of the granularity. This is possible when a large number of detectors is available. As described before, the G.A.R.F.I.E.L.D. apparatus includes 360 detector elements each of which covers an angular range of about ∆φ = 7.5◦ and ∆θ = 14◦ if the chambers are used as ionization chambers. The azimuthal resolution can reach about 1◦ in combination with the drift time measurement. This consists in
CHAPTER 2. THE EXPERIMENTAL APPARATUS AND THE MEASUREMENTS
the measurement of the collection time by the microstrip of the produced ionization. In this way, one can have a more precise position measurement.
The whole system is contained in a scattering chamber which is 6 m long and features a diameter of 3.2 m in which high vacuum, of 10−5÷ 10−6P a, is created. The emptying
process takes place in several phases controlled by instruments placed in different posi-tions and with different measuring ranges. This high-vacuum condition is fundamental in order to avoid dissipation of energy in residual gases inside the chamber by the beam. The charge preamplifiers are assembled within the chamber with the aim of reducing the noise from signals, minimizing the cable length and capacity.
Finally, the target, a thin sheet of some material, is placed on an orthogonal mechan-ical guide with respect to the beam. With a motor system it is possible to change the target and 12 positions are present. At the entrance of the apparatus there are three magnetic focusers that allow the collimation of the beam, coming from the accelerator, on the target.
2.1.1
MSGC microstrip detectors
The operation of the gas chambers is based on the process of gas ionization by a charged particle passing through the gas. Indeed, the particles produced in a reaction, once entered in the drift chambers through the entrance window, interact with the gas. This interaction can lead to either excitation or ionization of the gas molecules. It is in the second process that the electron-ion pairs, which represent the charge carriers, are generated. The number of ionizations (or the number of the pairs electron-ion) depends on the energy needed to extract a single electron and on the energy loss by the charged particle or fragment. The number of the produced electrons is proportional to the energy loss ∆E.
As already mentioned, inside the chambers an electrical field is generated thanks to a drift cathode at around -1000 V, a Frisch grid at 60 V and a field cage. The electric field is oriented in such a way that the electrons, formed along the trajectory of the particles, are forced to drift toward the microstrip pads. It is very important that the electric field is as homogeneous as possible in order to have a constant drift velocity for the electrons, obtaining straight trajectories, so that from the drift time one can deduce the flight path of electrons knowing a reference time, for istance the time the particle reaches the scintillator. Typical values of electric field inside the G.A.R.F.I.E.L.D. chamber are of the order of 104V /m. The Frisch grid, which is placed at 3 mm from the microstrip plane, delimits the region in which the drift field is very intense, about 107V /m [10], from
the one in which the electrons simply drift towards the electrodes, since the electric field is weaker. Near the microstrips, electrons undergo a sudden acceleration, thus starting the multiplication effect, know as avalanche effect. The final number of electrons is proportional to the number of electrons generated by the ionization, in this allowing to measure the energy of the particles weakly ionizing the gas. This reduces the minimum
CHAPTER 2. THE EXPERIMENTAL APPARATUS AND THE MEASUREMENTS
detected energy to less than 1 MeV/u.
The microstrip pads (Figure 2.2) have a particular trapezoidal shape, specially de-signed, and they are arranged almost perpendicular to the beam axis (85◦ in θ) and they are equipped with alternated metal cathodic and anodic electrodes. Each pad is divided both longitudinally and transversely, thus identifying four charge collection ar-eas, named conventionally 1A, 1B, 2A and 2B. Looking at the glass pads with the small base downward, the letters A and B indicate respectively the left and right sides, while the numbers 1 and 2 refer to the nearest and furthest halves from the beam.
Figure 2.2: Schematic representation of a microstrip pad belonging to the G.A.R.F.I.E.L.D. apparatus. The division in the four charge collection areas is clear.
All the cathodes are grounded, whereas the anodes are electrically connected to the four zones and biased at 430V [10]. The division into two longitudinal sections helps to get a higher precision on the azimuth angle, while cross-sectionalization provides an additional stage of detection. This system, together with the scintillators, allows the realization of a ∆E − E correlation for the identification of particles.
The choice of using microstrip gas as detectors is convenient for several reason. The request of energy threshold as low as possible is satisfied with the capability of detecting particles with very low energies. Furthermore, MSGC have the advantage of maintaining a wide dynamic identification range and, at the same time, of having a high signal-to-noise ratio for low ionization ions. Microstrip chamber, in fact, allow high counting rate and high gains. Moreover, the drift chambers make it possible the measurement of the direction of the particle track.
2.1.2
CsI(Tl) crystals scintillators
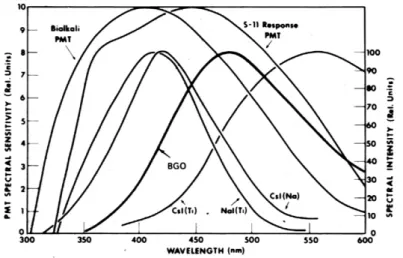
A scintillator is a material that is able to emit light as a result of the excitation of their atoms due to the crossing of a charged particle. The crystals are doped in order to increase the light emission efficiency of the scintillator, to reduce the self-absorption
CHAPTER 2. THE EXPERIMENTAL APPARATUS AND THE MEASUREMENTS
and to have the desired wavelength of the output light for an optimal matching with a photodiode (Figure 2.3).
Figure 2.3: Emission spectra of different scintillators and absorption spectra of photodiodes. For the proper functioning the superimposition has to cover all the emission spectra of the scintillator.
In this case a thallium doping, of about 1200 ppm, is employed [10]. To avoid possible loss of the produced light and in order to shield them from the outside, the crystals are wrapped in a white diffusive paper and covered by a layer of aluminated mylar. With the chosen diffusive wrapping, this doping contributes to maximize the light collection.
As already mentioned, each G.A.R.F.I.E.L.D. sector contains four CsI(Tl) scintilla-tors, the shape of which has been designed in order to optimize the geometrical efficiency. 96 crystals are present in the forward chamber and 84 in the backward. Each detector covers ∆φ = 15◦ and ∆θ ' 15◦. The crystal thickness is 4 cm in order to stop the charged products expected in the energy range of interest. The CsI(Tl) crystals are op-tically coupled to Hamamatsu S3204-05 photodiodes which are in turn connected to the pre-amplifiers. The energy resolution of CsI(Tl) is about 3% for 5 MeV α particles and 2 − 3% for 8 MeV/u Li and C elastically scattered beams on Au target [10].
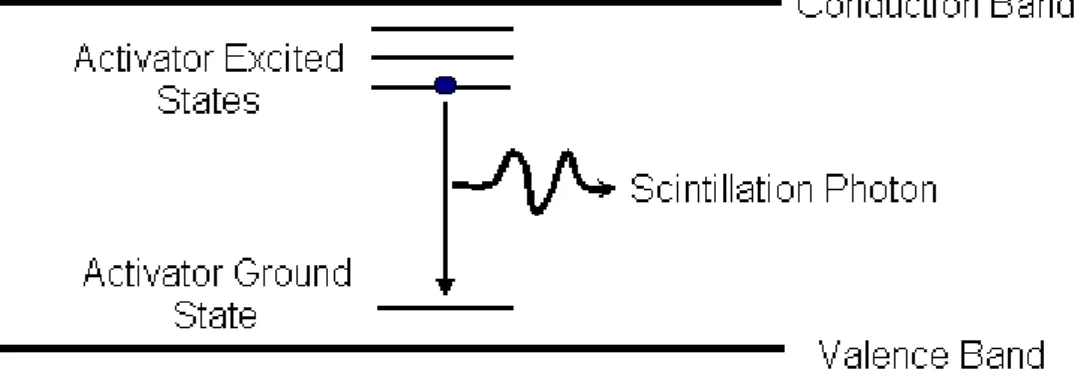
The operation of scintillators (Figure 2.4) is based on the fact that one of its atoms can be ionized or excited due to the interaction with a charged particle. The conduction band of the scintillator is composed by electrons free to move and the valence band consists of the less bound electrons of the atomic shell. If the electrons acquire enough energy, one has two possibilities: they pass in the conduction band forming electron-hole couples or they do not reach the conduction band creating holes with excitons, a state in which the electron is electrostatically bound to the hole. In both cases, the de-excitation of the electron occurs when this last recombines with the hole.
CHAPTER 2. THE EXPERIMENTAL APPARATUS AND THE MEASUREMENTS
Figure 2.4: Scheme of the scintillation process in an inorganic scintillator, such as CsI(Tl) crystals.
terms with different decay times: a short one (τs ∼ 0.75 µs) and a long one (τl ∼ 5 µs),
generally called fast and slow components. As a result, the current pulse produced in the photodiode by the scintillation light can be described by:
il(t) = dQL(t) dt = Qs τs e−τst + Ql τl e−τlt (2.1)
where QL(t) is the whole collected charge at time t; Qs and Ql are the charges produced
respectively by short and long components of scintillation. QL is thus given by:
QL=
Z ∞
0
dQL(t)
dt dt = Qs+ Ql (2.2) The fast and slow components depend differently on ionization density, therefore on the mass, energy and charge of the incident particle. This property allows to distinguish the mass of the ions from an analysis of the impulse form, a technique called pulse shape analysis (PSA) [10], [11].
2.2
Ring Counter
The Ring Counter (RCo) is a three-stage annular detector with a truncated cone geom-etry. It has the function of identifying and detecting particles by means of PSA and the ∆E − E telescope techniques. It is placed at the exit of the forward chamber, as shown in Figure 2.1, and it is designed to be centred at 0◦ with respect to the beam direction. It covers the polar angle in the range 5◦ < θ < 17.0◦. The Ring Counter has a cylindrical symmetry along the beam axis and it is divided into 8 azimuthal sectors each one with ∆φ = 45◦ angular coverage.
CHAPTER 2. THE EXPERIMENTAL APPARATUS AND THE MEASUREMENTS
The first stage is an ionization chamber (IC), followed by a strip silicon detector (Si) while the last stage is formed by CsI(Tl) scintillators. In particular, each sector of the Ring Counter is composed by one IC, one silicon pad segmented in eight strip and six 4.5 cm thick CsI(Tl) crystals. So altogether, there are 48 Cesium Iodide crystals, each one covering half sector in the azimuthal coordinate (Figure 2.5).
Figure 2.5: The Ring Counters silicon strips (left) and the superposition (right) with the corrisponding Cesium crystals. It can be seen that at least two silicon strips correspond to each crystal.
As a result of the mentioned division in sectors, an accuracy of 22.5◦ is obtained in the azimuthal angle of the particles impinging on the scintillators. These CsI(Tl) crystals can also reach an overall 2 − 3% energy resolution.
A remotely controlled collimator system has been implemented in order to apply different screens in front of the RCo under vacuum and, therefore, while running the experiment. The screens are used for focusing, shielding or collimation purposes. The RCo is installed on a sliding aluminum support and can be remotely moved back and forth in order to replace the front collimator.
2.2.1
Ionization chamber (IC)
The IC is designed with the aim of optimizing the geometric efficiency, minimizing the active losses of the area. For this reason, its dead zone coincides with the one of the silicon detector of the second stage. It is 6 cm long and contains three electrodes of aluminized mylar : an intermediate 1.5 µm thick anode and two grounded entrance and exit cathodes of thickness of 3 µm . The ionization chamber of the RCo does not contain
CHAPTER 2. THE EXPERIMENTAL APPARATUS AND THE MEASUREMENTS
any Frisch grids and the drift field has axial direction. This configuration has been chosen in order to obtain the same reduced electric field by applying half the voltage that would be needed in the absence of the intermediate anode. Furthermore, the high voltage electrode is completely inside the gas volume, whilst the others are grounded, minimizing, in this way, discharges to surrounding materials. As already stated, this chamber is filled with CF4 since this gas has a high density (0.19 mg/cm3 at a 50 mbar
pressure and at a temperature of 20◦ [10]) and, therefore, an high stopping power. Thanks to this property, the gas can be kept at a relatively low pressure, while having a sufficient energy loss for identification. The gas is continuously cleaned flowing inside the chamber maintaining the pressure constant through a remote control valve; before entering, the gas is filtered to remove residual oxygen and water vapor.
2.2.2
The silicon detectors
The silicon detectors used for the RCo are made using nTD (neutron Trasmutation Doped ) silicon type which has a better doping uniformity compared to the silicon nor-mally used. An uniform doping allows to reduce the dependence of the induced signal shape by the ion incidence point. In this way, better identification performance from signal pulse shape analysis can be achieved. The silicon detectors have been reverse mounted [12], so that the particle enters through the low field side in order to enhance the pulse shape discrimination capability [13].
Each of the 8 sectors contains a 300 µm thick silicon pad segmented into 8 strips, as shown in Figure 2.5. In this figure one can also see the dotted lines corresponding approximately to the overlap with the different CsI(Tl) crystals behind the strips. Each pad covers a solid angle of 2 ÷ 6 msr and is completed by a guard ring, mounted all around the strips and properly biased, which is needed to minimize the field distortion effects in the inter-strip regions (220 µm wide). The active area of these detectors constitutes 90% of the total area. The inactive area corresponds to the space for the support of each detector and the space between the strips, containing the guard rings. In this way, the charge carriers splitting and cross- talk, the signal coming from contiguous strips, are almost negligible. Regarding technical characteristics of the detectors, the bulk resistivity of the detector is of the order of 3400Ω · cm, and the full depletion voltage is 100 V with recommended bias of 120 V. The reverse current of each strip is about 30 nA [10].
2.2.3
CsI(Tl) scintillators
The third and last stage of each sector, in which the RCo is divided, consists of 6 CsI(Tl) scintillators. The 4 Si inner strip polar angular region is azimuthally covered by 2 of these crystals with ∆φ = 22.5◦ each, whilst, the 4 outer strip region is covered by 4 scintillators, each covering half of the polar and half of the azimuthal range defined by the strips (Figure 2.5). The small size of the crystals allows a more uniform doping and, therefore,
CHAPTER 2. THE EXPERIMENTAL APPARATUS AND THE MEASUREMENTS
better scintillation response and collection of light of the single detector. As a result, there are altogether 48 scintillators, 45 mm thick, which have been optically coupled with Hamamatsu S2744-08 photodiodes with active area 10 × 20 mm2. The present CsI(Tl) crystals have been chosen with a Tl doping in the range of 1500−2000 ppm as to enhance their light output and therefore they can reach an overall 2 − 3% energy resolution [10]. The pre-amplifiers are the same used in G.A.R.F.I.E.L.D.
2.2.4
Monitor detector
At a very small angle (∼ 1◦), a plastic scintillator is positioned inside the scattering chamber to allow the counting of elastic scattering events by Coulomb potential, known as Rutherford collisions. The exact location of the plastic detector in the chamber is of great importance since there is a strong dependency of the cross section from the angle
σRuth ∝
1 sin4(θ
2)
(2.3)
These counts are used to normalize the measurements of the other detectors, namely to obtain an absolute cross section once the Rutherford cross section at that angle θ is known.
2.3
Electronics and acquisition
The electronics of the G.A.R.F.I.E.L.D. and RCo apparatus is used to collect the signals coming from the detectors, through pre-amplifiers with different gains, and to reprocess stored information. For all the detectors used, the deposited energy by the particle in the active volume produces a current pulse in the reading circuit. The charge associated with this pulse is proportional to the incident energy itself and it is obtained integrating the pulse into the charge preamplifier. The output signal is then processed by an appropriate electronic chain. In order to minimize noise influence upon the small signals generated, the preamplifiers are located inside the scattering chamber.
The signals of the whole RCo and CsI(Tl) crystals of G.A.R.F.I.E.L.D. are digitized by means of an Fast Sampling Analog-to-Digital Converter (ADC). Subsequently, they are analyzed by the Digital Signal Processor (DSP) which is programmable and it allows to carry out an advanced on-line data reduction and elaboration. This means that only filtered data, by applying shaping algorithms, are considered instead of sending all the digitized samples to the acquisition. The DSP is useful because relevant physical quanti-ties can be derived, such as amplitude and rise time of the charge signal. However, so as to check the behaviour of the cards, every 1000 events the DSP sends a complete wave-form to acquisition for further off-line checks and debugging analysis. The inwave-formation extracted, expressed in numerical form, are stored into files for the analysis.
CHAPTER 2. THE EXPERIMENTAL APPARATUS AND THE MEASUREMENTS
The output values of the ADC are continuously recorded in an internal FIFO (First In First Out ) memory that stores up to 8192 samples, that is approximately ∼ 64 µs at 125 MSPS (125 · 106 samples/s) [12]. This kind of memory acts as a circular buffer and the first locations are continuously rewritten in the meantime that a trigger signal arrives which entails the beginning of the process of data recording.
On the other hand, the microstrips signals of the drift chambers are treated with analog electronics which is composed of a charge amplifier followed by a peak sensing ADC.
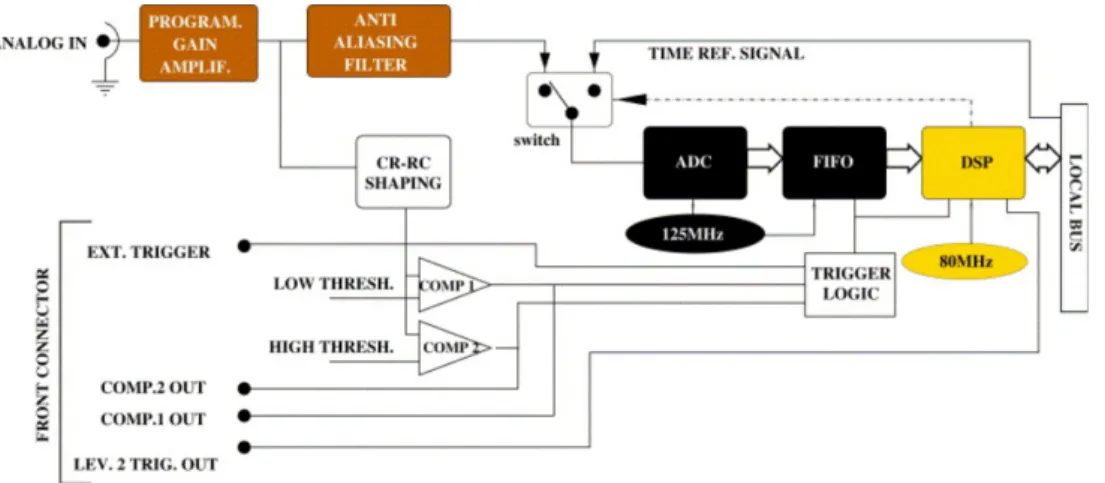
In figure 2.6 the structure diagram of an acquisition channel is shown. Observing the scheme, the input stage of the analog signal, the digitization section (ADC), the temporary FIFO memory, the trigger section and the DSP are distinguishable.
Figure 2.6: Main components of a digital acquisition channel.
2.3.1
Trigger system
In the schematic diagram of figure 2.6 a section called ”trigger logic” is present. Basi-cally, the experiment trigger is a logical signal produced when an event of interest occurs. Therefore, the choice of the particular trigger logic to be used is crucial for each exper-iment as this is closely related to reaction mechanisms to be studied. In other words, the trigger represents a direct connection with the physics of the reaction. In this way, particular physical conditions are imposed using logical combinations of trigger signals. If everything coming from the detectors was acquired most of the data would be useless because they represent events mostly dominated by the elastic and quasi-elastic rates.
There are two different kinds of triggers used for these selection: the local triggers and validation signals. The former are generated from a detector signal that has exceeded its acquisition threshold by means of a Constant Fraction Discrimination (CFD). So
CHAPTER 2. THE EXPERIMENTAL APPARATUS AND THE MEASUREMENTS
that, it is possible to obtain local triggers from the CsI(Tl) crystals of G.A.R.F.I.E.L.D. or from the RCo silicon detectors. The latter are generated by sending the elementary signals, necessary to produce the trigger, to a card VME (CAEN V1495), referred to as trigger box, which by the means of a Field Programmable logic array (FPGA) produces not just one, but several experiment triggers. When one of the experiment triggers is accepted, the trigger box produces a validation signal that enables the acquisition and the memorization of the signals of all the hit detectors.
During the experiment, it is possible to enable all or part of these triggers, and for each of them to set a reduction factor or exclude it completely. The electronics of the apparatus is equipped with 8 different possibilities of triggers, each associated with a different logic as shown in the table below (table 2.1).
Bit Trigger Reduction Description
0 OR CsI GARF 2 OR of the GARFIELD scintillators 1 OR IC RCo 1 OR of the different parts of IC 2 OR Si RCo 1 OR among the RCo strips 3 OR GARF AND OR Si RCo 1 AND of trigger 0 and trigger 2 4 OR GARF AND OR IC RCo 1 AND of trigger 0 and trigger 1 5 OR Si AND OR IC 1 AND of trigger 2 and trigger 1 6 Plastic Monitor 100 Plastic Scintillator
7 Pulser 1 Pulse Generator
Table 2.1: The available triggers with their mostly used reduction factors.
The trigger output is a bitmask that indicates which trigger is activated. The re-duction factor ”X” is useful because it activates the data acquisition once every ”X” occurrences. The OR signal is activated when at least one detector has produced a sig-nal; the AND signal only when at least two different detectors have produced a signal at the same time. In this way, the OR of a class of detectors allows to analyse the events in which at least one particle has been detected. On the other hand, the AND triggers allow to study events in which there are at least one particle in one set of detectors and one in another. Finally, the multiplicity triggers n allow to study events in which n particles have been detected by a type of detector. Throughout this experiment, the triggers selected are trigger 0, OR of triggers coming from the G.A.R.F.I.E.L.D. signals, and trigger 2, OR of trigger signals from the RCo (table 2.1). More specifically, trigger 0 is the logic OR of all CsI(Tl) signals while trigger 2 is obtained from the logic OR of Si strip signals. These triggers are determined based on the two types of reactions. We are interested in studying mainly fusion-evaporation or projectile decay mechanisms. Both are characterized by having to detect light particles or heavier fragments with similar kinematics. In addition to the measurement triggers mentioned above, two other triggers are used. The first is trigger 7, a pulser trigger, which control the stability of the whole
CHAPTER 2. THE EXPERIMENTAL APPARATUS AND THE MEASUREMENTS
electronic chain. This is especially useful when interested to sum data from several runs of measurement. The last is trigger 6 which is referred to the plastic scintillator.
In figure 2.7 the logic array of the trigger box is shown as displayed on the acquisition program screen.
Figure 2.7: The logic array of the trigger box
The rows indicate the 8 different triggers, while the columns represent the detectors. The green boxes show the logical connections made. Note that in this figure the CsI(Tl) sectors of G.A.R.F.I.E.L.D. and Si strips of RCo are marked respectively in the first and third raw. Indeed, they correspond with the triggers used during the measurement. The blue boxes represent the NOT logic operation of two OR links used for the construction of the AND.
2.4
The measurement
The measurements were performed at the INFN laboratories in Legnaro using a pulsed beam of 16O with an energy of 90, 110 and 130 MeV available using the Tandem XTU
accelerator. The 16O produced beam, in this acquisition session, features a maximum
intensity of about 0.1 pnA and impinges on a 12C target which is 85 cmµg2
1 thick.
If the same target is subjected to continuous collisions it may wear out or degrade, leading to a variation of the cross section and of the possibility that the reaction takes place. It follows that a target replacement is necessary, from time to time, in order to maintain the reaction parameters unchanged. For this reason, it is possible to change the target through an automated system which avoids opening the chamber and wasting time in the emptying and filling processes. During the measurements, a set of triggers was used in order to select, already in the acquisition phase, the events of interest. As mentioned in section 2.3.1, the triggers used throughout this experiment were the
1Making the ratio between the unit of measurement used and the volumetric density of the element the thickness of the lamina expressed in cm is obtained.
CHAPTER 2. THE EXPERIMENTAL APPARATUS AND THE MEASUREMENTS
signals coming from the logic OR of all CsI(Tl) and of all Si strips of the RCo. In order to provide a reference point for the energy calibration also the16O +197Au elastic
scattering reaction has been performed.
Before starting the experiment it is important to check if the beam is centred with respect to the position of the target to which the detectors are referred. For this purpose, an additional AlO2 target is present in the target holder. This material has the property
of emitting light when it is hit by the beam and the target features a centred little hole, corresponding to the calibrated position of the origin. This system, with two other AlO2
foils placed at the beginning and at the end of the scattering chamber, allows to check the beam alignment and to control its size to about 1 mm in diameter.
An online control of the functioning of the overall apparatus and of the acquired data during the measurement sessions is possible thanks to a graphical interface pro-gram named G.A.R.F.I.E.L.D. Monitor [14]. This software enables to visualize several defined 1D and 2D histograms filled either with raw experimental data or with pre-processed variables. An example of these histograms are graphs shown in figure 2.8.
Figure 2.8: Countings for the complete apparatus (G.A.R.F.I.E.L.D. + RCo) on the left and for the Ring counter on the right. It should be noted that in G.A.R.F.I.E.L.D. four detectors are not counting due to bad functioning [15]
In 2.8 the colour of each detector is proportional to the number of events and, there-fore, the presence of a small number of events is related to detectors turned off because deactivated or malfunctioning. Finally, in order to verify the stability of the electronic chain, it is possible to acquire pulser runs. A pulser is an electrical pulse at different voltage, but similar in shape to that coming from the detectors on the pre-amplifiers. Acquiring this type of measures enables to test the stability and linearity of gain and to verify if they are sensitive to environmental conditions.
Chapter 3
Data analysis and results
In the first part of this chapter, the energy calibration of the data and the methods, ∆E − E and Pulse Shape Analysis (PSA), used to identify the particles detected with the G.A.R.F.I.E.L.D + RCo apparatus are described. Then follows a part in which few global observable and the ways in which they are selected for particular reaction mechanism of interest are present. Finally, the last sections are devoted to the description of the various analyses carried out only on data at 130 MeV, since the number of events available at 90 and 110 MeV beam energy are not enough to allow for a detailed analysis.
3.1
Energy calibration
The energy calibration of the detectors of the entire apparatus represents one of the crucial points in all the data analysis. It provides the energy value in eV for all the particles detected during the reaction.
For detectors, such as RCo silicon strips, whose response is linear with the energy deposited, an energy calibration has been performed by carrying out elastic scattering measurements of a 16O beam on a sheet, 200 µgcm2 thick, of
197Au. The measurements are
carried out in two separate phases: in the first one the ionization chamber is filled with gas, while in the second the chamber is empty. For the measurements without gas, signals coming from the silicon detectors correspond to the energy values calculated from the Rutherford expression for the elastic scattering 1. By fitting these experimental points,
it is possible to obtain a curve that best approximates the relation between the height of the signals supplied by the instrumentation and the calculated energy. The scattering measurements carried out with gas should confirm the validity of the previous energy points (130 MeV). In this case, the calculated energy values are obtained by subtracting the energy loss which occurs in the first stage due to the presence of a layer of gas before
1The energy loss of the beam in half of the target has been subtracted to the beam energy. In addition also energy loss of products in the second half of the target has been taken into account.
CHAPTER 3. DATA ANALYSIS AND RESULTS
the Si strip detectors. In the case discussed, what is expected is that the signals in electronic channels are linearly proportional to the energy of the diffused particle and stopped in the individual detectors. Indeed, what is observed in the calibration energy curve (figure 3.1) is a linear trend of the experimental points. The absence of non-linear effects implies that there are no electronic non linearities.
As far as the CsI(Tl) crystals are concerned, whose response in Light-Output (LO) is not linearly proportional to the energy deposited in the detector, it is not possible to have a simple conversion factor from the LO to the deposited energy. At equal energy detected, a dependence of the interacting ion on the charge Z and on the mass A is found. From measurements carried out to investigate the CsI(Tl) response, the
NUCL-Figure 3.1: Fit procedure on the elastic scattering points, in the presence and absence of the gas in the IC, for strip 5 in sector 3 [16].
EX collaboration has deduced a semi-empirical formula to express the relation between the amplitude in channels of the LO and the energy deposited by the particle when Z and A vary. The formula is the following:
LO(Zef f, E) = (d1+ d2e−d3Zef f)(1 + d4Zef f)Ed5−d6exp(−d7Zef f) (3.1)
where the Zef f = (AZ2)1/3 factor takes into account the dependence of LO on the
CHAPTER 3. DATA ANALYSIS AND RESULTS
i = 1..7 were set by means of elastic diffusion measurements with ion beams from Z=1 to Z=28 [17]. For the calibration, it is assumed that the uncalibrated light response of the CsI, as obtained from the acquisition system, follows the expression (3.1) with the only exception of a multiplicative factor. In order to obtain this factor, called β-factor by the collaboration, the ratio between the theoretical value for a set of known ions and energies derived by applying the formula (3.1) and the experimental amplitude value is calculated. This is possible, indeed, because a sample of known energy events is available. Although eq. (3.1) has been derived for G.A.R.F.I.E.L.D. CsI(Tl) crystals, it can be applied also to the RCo scintillators. However, in this case, the elastically diffused beam ions fail to reach the scintillator due to the presence of silicon layers interposed. For this reason, a different calibration procedure must be applied. Since the silicon strips have already been calibrated in energy, the amount of energy lost in the silicon of each ion that reaches the CsI(Tl) is calculated. When the crossed thickness are known, it is possible to calculate the value of the deposited energy in CsI(Tl).
Finally, the measured LO value is correlated with the corresponding value calculated through the (3.1), thus obtaining a distribution of the points as the one shown in figure 3.2.
Figure 3.2: Correlation LO calculated vs LO measured for RCo CsI (Tl) crystals. The dis-tribution for Z = 1 was fitted through a parabola while for Z > 1 with a straight line. The parameters returned by the fit correspond to the β-factors for the RCo [18].
CHAPTER 3. DATA ANALYSIS AND RESULTS
3.2
Identification of detected ions
As mentioned in section 2.3, the electronics of the G.A.R.F.I.E.L.D. and RCo apparatus is used to collect the signals coming from the detectors and to reprocess stored information. The collected data are arranged in a collection of ”raws”, each of which represents an event and features a list of acquisition data parameters characterized by the same event number. These parameters include energy, speed, charge and mass of reaction products and the identification number of the detector hit by the particle to get information on the emission direction. By studying all these parameters it is possible to reconstruct the dynamics of the interaction and recreate the characteristics of the particles from the detectors signals. It is therefore evident that the identification of the particles produced in an interaction is perhaps one of the most crucial aspects of the study of nuclear reactions. Indeed, it is not possible to investigate the properties of a reaction without identifying the fragments produced in charge Z as well as, if possible, in mass A. In addition to this, the identification phase must be performed before the energy calibration.
There are several identification techniques including the ∆E − E technique and the aforementioned pulse shape analysis (PSA) which are primarily used in this work. Specif-ically, the first method is used for the RCo where the IC-Si and Si-CsI(Tl) correlations can be performed, whereas the second one for the G.A.R.F.I.E.L.D CsI(Tl) crystals.
3.2.1
∆E − E technique
This technique uses the energies deposited by a particle in two detectors placed sequen-tially and it is based on the assumption that the particle stops in the second one. This configuration of detectors is called ”telescope”. The operating principle of this technique is based on the energy loss mechanism of an ionizing particle passing through an absorber of given density. In the non-relativistic limit, according to the Bethe-Block, formula the energy loss is a function of particle charge Z, mass A and incident energy E [19]:
− dE dx ∝ Z 2A E (3.2)
Therefore, the energy loss inside a material is proportional to the square of the impinging particle charge and it increases linearly with the mass of the particle, while it decreases with energy. If one draws the graph of the correlation between the energy lost (∆E) when crossing the first detector and the energy deposited (Eres) in the second, it is observed
that when the energy changes the particles are arranged along distinct curves for different values of the product Z2A (figure 3.3). Indeed, it can be noted that, at the same atomic
number of the incident ion, there is still a separation that depends on its mass. This type of correlation is not normally used for particle identification in G.A.R.F.I.E.L.D. since the PSA method from CsI(Tl) provides more information, in terms of charge and mass, than the ∆E − E technique. On the other hand, the ∆E − E method is widely
CHAPTER 3. DATA ANALYSIS AND RESULTS
Figure 3.3: The upper panel shows ∆E − E correlation obtained with a MSGC-CsI(Tl) telescope in G.A.R.F.I.E.L.D. apparatus, whereas in the last two panels there are the ∆E − E correlations for IC sector 1 and Si strip 2 and for sector 3 Si strip 3 and Cesium 3 in the RCo apparatus [15]. In the second panel it is possible to distinguish Z values up to Z=10. Protons (p), deutrons (d ), tritons (t ), 3He and α particles can be seen in the lower panel [15].
CHAPTER 3. DATA ANALYSIS AND RESULTS
used for particle identification in the RCo. In this case, two different correlations can be performed. The first one is obtained using a IC-Si telescope, whereas the second one can be built from the ∆E extracted from the Si and the energy from the CsI(Tl). With the last kind of correlation it is also possible to identify isotopes of the detected particle. It should be noted that the only particles that can reach the CsI(Tl) through the first two stages of detection in the studied reaction are the light particles. Examples of ∆E − E correlation for the RCo are shown in figure 3.3.
3.2.2
Fast-slow PSA in CsI(Tl)
The ∆E − E identification technique cannot always be applied, for example if the ion stops in the first telescope stage. However, Si and CsI(Tl) detectors enable particle identification through an analysis of the shape of the signal induced by the particle in the detector. As mentioned in section 2.1.2, the CsI(Tl) scintillators emit light pulses whose shape varies as a function of the type of the incident radiation, i.e. it depends on the energy as well as on the charge Z and mass A of the particles. Another important feature of this kind of detector is that its emission spectrum is given by the sum of two exponential terms, one with a short decay time (τs∼ 0.75 µs) and the other with a long
decay time (τl ∼ 5 µs). Both the value of the two time constants and the distribution
of the total intensity between the two components depend on the Z and A of the ion as well as on its energy. In particular, with the same total light emitted, the intensities of the fast and slow components depend on the Z and A of the absorbed ion. Therefore, the fast and slow components of the CsI(Tl) signals provide a correlation for the particle identification in both G.A.R.F.I.E.L.D and RCo. The two components are extracted by the DSP by applying two filters with the two different constants to the pre-amplified CsI(Tl) signals. The following image shows a reproduction of the light response of a scintillator as a function of the time with the slow component separated from the fast one.
Figure 3.4: Light response of a scintillator as a function of time. The slow and fast components of the light response were separated to show the respective contribution to the total response.
CHAPTER 3. DATA ANALYSIS AND RESULTS
However, a better isotopic separation is gained with the use of a new parameter obtained from a linear mixing of the two components, instead of the direct correlation between fast and slow components. Therefore, the actual correlation performed is the one between the fast component and the SlowPSA (spsa) given by:
SlowP SA = 3.5 · (long − 4f ast) (3.3)
Figure 3.5 represents a typical ”Fast vs SlowPSA” correlation matrix for a chosen G.A.R.F.I.E.L.D. and RCo CsI(Tl) detector in which the three hydrogen isotopes (pro-tons, deuterons and tritons) and the α particles are clearly distinguishable. Finally, the presence of γ-rays characterized by a linear dependence between fast and spsa can be noticed. For the scintillators of RCo, due to higher energy particles, also Z=2 isotopes and Z=3 ridges are present.
Figure 3.5: ”Fast and spsa” correlation for the Cesium 8 sector 20 of G.A.R.F.I.E.L.D. (left panel). From the bottom one can recognize the ridges corresponding to γ, p, d, t and α particles, respectively. The same correlation is shown for the Cesium 6 sector 3 of RCo (lright panel) [15]. Here, above the ridge corresponding to tritons, 3He, α and Li ridges are clearly visible.
![Figure 1.5: Variety of types of nuclear clustering from small clusters outside closed shells, to complete condensation into α-particles, to halo nucleons outside of normal core [ 4 ].](https://thumb-eu.123doks.com/thumbv2/123dokorg/7412089.98411/14.892.182.700.373.647/variety-clustering-clusters-complete-condensation-particles-nucleons-outside.webp)