AND
LIFE SCIENCE
To my parents,
my brother
and who believed in me
since the beginning of this adventure into the science.
Acknowledgments
I would like to say thanks to my mentor at Università della Calabria, Prof Giovanni Sindona, and to my mentor at Vanderbilt University, Prof Richard M Caprioli, for giving me the opportunity to study my thesis in their mass spectrometry labs and for giving me the best advices ever about science. Their expert knowledge has been a great support for my work. I was always pushed to move up my limit to reach many goals in my investigations. Further, I would like to thank both my professors because they gave me the opportunity to had not only an important experience in science but also an important experience in life. I would like also to say thanks to my PhD supervisor, Dr Leonardo Di Donna, that followed step by step even if I was so far from the lab, when I was in US. This thank is extended to Dr Fabio Mazzotti, that spent a lot of time with me in the lab working on the instruments and to Prof Giuseppina De Luca for her experience in NMR analysis and data interpretation.
Another thank is for my collaborator at Vandy’s Plastic Surgery Department, Dr Lillian B Nanney and her collaborators, Alonda C Pollins and Nancy L Cardwell, for the constant support in the human skin project. I really appreciate your collaboration.
I would like to say thanks to my first "compagno di venture" in mass spectrometry, Dr Raffaele Salerno, aka Zio Raf, that really introduced me to this life science and followed me through all my thesis work. My thanks will be never enough for all my friends and colleagues in Sindona team as well as in Caprioli team, that joined with me nights and days in the last three years.
I wanna say thanks to the Department of Chemistry family, basically all the administrative staff that supported me and all the others for orders, trips, and much more.
I wish to express my most sincere acknowledge to my PhD Coordinator, Prof Bartolo Gabriele, for his special support during all the PhD program.
How I can forget the hours spent with Mr Vanni and Mr Franco Santoro (aka Zio Franco) to try to figure out what was going on in the lab instruments.
And, Barbara, Paolo, Attilio, my "Olivicultura friends", Anna and Donatella, Antonio, Monica, Caterina, Paolo P, Hicham, Mohammed, Ashif, Will, Rita, Jeff, Junhai, Joy, Kerry, Hans, Erik, Kathleen, Whitney, Veronica, Maureen, Kristina, Noemi, Karinna, Roberto, Andrei, Peggi, Eduardo, Gwendoline, Erin, Jamie, Lisa, Mich, Patricia, Rey, and all my "family" in Nashville.
I really appreciate the help of all of you guys and I really hope that my thesis work is going to make you proud of me.
Thanks,
Contents
Declaration III
Dedication V
Acknowledgements VII
Contents IX
List of terms and abbreviations XV
Preface XVII
Section 1 – Food as a Source of Pharmacological Interest Compounds
Chapter 1 – An Introduction 1
Food as a Source of Pharmacological Interest Compounds: Structural Characterization of New
Flavonoids from Fruits and Plants 3
MS application on food 3
Natural substances on food 5
Phenolic compounds of pharmacological interest: flavonoids 6 Citrus fruits as well as Alliacee plants as source of phytochemical substances 9 Distribution of flavoinoids in Citrus fruits and tissues 13
Mass spectrometry Fundamentals 14
Ion sources 14
Electrospray 14
Mass analyzers and mass resolving power 18
The quadrupole 19
The time-of-flight 21
The reflectron TOF 24
Ion mobility mass spectrometry 26
Tandem mass spectrometry 28
Tandem mass spectrometry with TOF instruments 32
Tandem TOF instruments 33
Coupling separation device – hypenated techniques 34
Chromatography fundamentals 35
Coupled LC/MS 37
References 39
Chapter 2 – Results and Discussion 45
Structural Characterization of Phenolic Compounds in Allium Porrum by High Resolution Tandem
Mass Spectrometry 47
Results 48
Discussion 57
Citrus Grandis Glycosilated Flavonoids Structural Characterization by High Resolution Tandem
Mass Spectrometry 58
Results 59
Discussion 69
Detection of Isomeric Dioleyl Glycerides by Ion Mobility Mass Spectrometry. A Modern
Approach to the Evaluation of Olive Oil Aging 70
Results 71
Discussion 76
References 77
Chapter 3 – Materials and Methods 81
Structural Characterization of Phenolic Compounds in Allium Porrum by High Resolution Tandem
Chemicals 83
Sample preparation 83
Separation of microcomponents 83
High resolution MS and MS/MS experiments 84
Hydrolysis reaction 84
Citrus Grandis Glycosilated Flavonoids Structural Characterization by High Resolution Tandem
Mass Spectrometry 85
Chemicals 85
Sample preparation 85
Separation of microcomponents by HPLC/MS 85
High resolution MS and MS/MS experiments 86
Flavonoids nomenclature 86
Detection of Isomeric Dioleyl Glycerides by Ion Mobility Mass Spectrometry. A Modern Approach
to the Evaluation of Olive Oil Aging 87
Materials and chemicals 87
Sample preparation 87
Ion mobility spectrometer 87
References 87
Section 2 – Imaging Mass Spectrometry Applications on Human Skin
Ulcers
Chapter 1 – An Introduction 89
Skin ulcer as a social and economic problem 91
What’s a pressure ulcer 91
Pressure ulcer stages 91
Modern proteomics 95
Current proteomics technologies 96
MALDI TOF fundamentals 99 Imaging mass spectrometry perspectives in biology and medicine 101
Recent MALDI IMS developments 103
References 104
Chapter 2 – Results and Discussion 107
Spatial Mapping by Imaging Mass Spectrometry Offers Advancements for Rapid Definition of
Human Skin Proteomic Signatures 109
Results 109
Skin protein profiling/imaging 109
Protein identification on tissue sections using in situ tryptic micro digestion 113
Immunohistochemical confirmation 116
Discussion 117
The Microenvironment of Human Pressure Ulcers as Defined by Imaging Mass Spectrometry 118
Results 120
Overview of MALDI IMS applications to chronic wounds 120
Wound molecular MS profiling 121
Molecular imaging produces spatial distribution for molecular features 123
Immunoreactivity for α-defensins 125
Statistical analysis 126
PCA differentiate pressure ulcers areas 126
PCA differentiate ulcer and healthy proteome 128
ROC curves demonstrate ion specificity within wound areas 129
Discussion 132
Spatial Detection of Phospholipids in Human Skin Pressure Ulcers by Imaging Mass Spectrometry 134
Results 135
MS profiling 137
MS imaging 140
Discussion 145
References 149
Chapter 3 – Materials and Methods 157
Spatial Mapping by Imaging Mass Spectrometry Offers Advancements for Rapid Definition of
Human Skin Proteomic Signatures 159
Tissue specimen collection and processing 159
Frozen tissue preparation 159
Tissue fixation and contaminant removal 159
Tissue preparation for profiling 159
Tissue preparation for imaging 160
Tissue preparation for tryptic digestion 160
MS/MS sequence analysis of tryptic peptides and protein identification 160
Immunohistochemistry: an overview 160
Immunohistochemical staining on normal skin tissue sections 162
The Microenvironment of Human Pressure Ulcers as Defined by Imaging Mass Spectrometry 162
Profiling and imaging mass spectrometry 162
Tissue specimen collection and processing 163
Tissue preparation, fixation and contaminant removal 163
Immunohistochemical staining 164
MALDI MS-MS/MS analysis 165
Statistical analysis: an overview 165
Statistical analysis on human skin mass spec data 167
Spatial Detection of Phospholipids in Human Skin Pressure Ulcers by Imaging Mass Spectrometry 168
Chemicals 168 Tissue sectioning 168 Sample preparation 168 Mass spectrometers 169 Data processing 169 References 171 Conclusions 173 Publications 175
List of Terms and Abbreviations
2D DIGE 2 dimensional difference gel electrophoresis APCI atmosperic pressure chemical ionization API atmosperic pressure ionization
AUC area under curve
CE capillary electrophoresis
CE collision energy
CHCA α-cyano-4-hydroxycinnamic acid CID collision-induced dissociation CRM charge residue model
DAD diode array detector
DAG diacyl glycerol
DAN 1,5-diaminonaphtalene
DE delayed extraction
DHA 2,5-dihydroxyacetophenone DHB 2,5-dihydroxybenzoic acid
DT drift time
ESI electrospray ionization FAB fast atom bombardment
FFPE formalin fixed paraffin embedded FT-ICR fourier trasform ion cyclotron resonance FWHM full width half maximum
GC gas chromatography
H&E hematoxylin and eosin
HN-APCI heated nebulizer atmosperic pressure chemical ionization HPLC high performance liquid chromatography
HR high resolution
IC half maximal inhibitory concentration iCAT isotope coded affinity tag
IDM ion-desorption model
IHC immunohystochemistry
IM-MS ion mobility mass spectrometry IMS imaging mass spectrometry
IR infrared
iTRAQ isobaric tag for relative quantitation
k capacity factor
LC liquid chromatography
LDI laser desorption ionization m/q, m/z mass to charge ratio
MALDI matrix assisted laser desorption MRM multi reaction monitoring
MS mass spectrometry
MudPIT multidimesional protein identification technology
MW molecular weight
NMR nuclear magnetic resonance
NPUAP national pressure ulcer advisory panel
NS nozzle skimmer
PC principal components
PCA principac component analysis
pI isoelectric point
PSD post source decay
PTMs post traslatonal modifications QIT quadupole ion trap
Q-TOF quadrupole time of flight
RF radio frequency
ROC receiver oprating characteristic curve
RP reversed phase
RP resolving power
RT retention time
RTOF reflectron TOF
SA sinapinic acid, 3,5-dimethoxy-4-hydroxycinnamic acid SAM significance analysis of microarrays
SAX strong anion exchange column SCX strong cation exchange column SIM selected ion monitoring
SIMS secondary ion mass spectrometry SPE solid phase extraction
TFA trifluoroacetic acid
THAP 2',4',6'-trihydroxyacetophenone
THF tetrahydrofuran
TOF time of flight
his thesis work was focused on two different fields of research in order to develop methodologies for mass spectrometry investigative approaches. In the last decade, the increased interest of the scientific community for the food chemistry, especially in the South of Italy, pushed me to further investigate food and similar. Recent development in methods and instrumentations in mass spectrometry make it possible; in particular, the isolation and characterization of unknown molecules from very complex matrices can be carried out using a mass spectrometry based approach. The first part of the three year PhD was spent on food chemistry; basically, two foods, a fruit and an herbaceous plant, were used as source of compounds of suspected pharmacological interest. Thus, a mass spectrometry based approach was used to observe, separate and then collect semi-purified fractions of molecular weight specific species that were then structurally elucidated. A member of the Citrus fruit family as well as a member of Alliacee family were used as object of this thesis work also to complete the study of the citrus flavonoidic composition started several years ago in Sindona lab. The pummelo, aka Citrus Grandis, was prepared for the extraction of phenolic compounds and chromatography separation of low molecular species (below 1 KDa). The chromatography was used not only to separate different known molecular species but also to collected semi-purified fractions of unknown m/z ions by semi-preparative mode. An high resolution measurement is needed to obtain important information about the molecular formula as well as the number of double bonds present in the structure of the unknown compound of interest. The same high resolution measurement was carried out also for tandem mass spectrometry experiments, in order to fragment the unknown ions and study the obtained fragmentation patterns and assign the different part of the molecules. Many other experiments (either hydrolysis reaction and NMR analysis) were needed to validate the MS/MS spectra interpretations. According to the proved biological and pharmacological activities of such compounds (flavonoids), the characterization of new compounds extracted from food gives new clues to reach a complete and comprehensive characterization of the food molecular composition. The second part of this PhD was spent at the Mass Spectrometry Research Center in Vanderbilt University in order to develop methodologies for on tissue analysis by an emerging mass spectrometry field, Imaging Mass Spectrometry. Object of this study was the human skin: basically, human skin fresh frozen biopsies were used to investigate the proteome of a disease not completely understood, called pressure ulcer at stage IV. For this study, two main experimental approaches were used. One, termed profiling, involves analysis of discrete areas of the tissue sections to enable comparisons between distinct areas on tissue sections, such as normal healthy area versus a diseased area, or between two different specimens. Thus, the profiled spectra can be submitted to computational analysis and can be used to evaluate differences between two specimens. The second approach, termed imaging, is an high-resolution analysis of a tissue section that allows to analyze the entire tissue section from an ordered array of laser ablated spots in which spectra are acquired from those spots at intervals that define the image resolution. Imaging software generates two-dimensional ion-maps, by plotting the intensity of signals obtained as a function of xy coordinates. This procedure allows for rapid assessment of molecules localization and the visualization of the molecular differences between and among samples. This technology was applied to the study of human skin pressure ulcers, optimizing three different methods for proteins (mass range 2-20 kDa), in situ tryptic digested peptides (mass range 500-2000 Da) and lipids
T
(300-1400 Da). To further validate the preliminary findings, many statistical analysis (Significance Analysis of Microarrays, Principal Component Analysis, Receiver Operating Curves) were carried out. Data from the wound area as well as from the adjacent normal dermis/epidermis highlighted also the presence of two sub-regions within the wound bed. The IMS ion density maps for specific molecular species displayed a specific distribution and localization within two wound areas: one, the upper, most stagnant wound are bed apparently very compromised with on top a crust (death skin) and another one, the lower more mature, apparently still instance skin or on the road of healing. Mass spectrometry was used to identify the molecular features observed e recorded in the mass spectra and other techniques, such as immunohistochemistry, were used to confirm the MS/MS spactra interpretation and database search. The present thesis work was divided in two sections: the first section regards the food chemistry part of the PhD as well as the second section was instead focused on the IMS study of the human skin ulcers. Each section was further divided in three chapters (1-Introduction on the object of the study, MS fundamentals and technologies used; 2-Results and Discussion; 3-Material and Methods).
Section 1
Chapter 1
Food as a Source of Pharmacological Interest Compounds
An Introduction
Food as a Source of Pharmacological Interest Compounds: Structural
Characterization of New Flavonoids from Fruits and Plants.
It’s widely known that fruits, vegetables, in general foods, can be considered as a natural source of molecules and compounds of pharmacological interest. It is also known that there are a bunch of inflammatory based processes in the human body and most of them, at date, are not yet fully understood. Fruits, vegetables, in general food, are a good source of several classes of compounds, many times interesting in terms of biological/pharmacological activity or as important component of some healthy diet. Most of the time, working on fruits and vegetables, the main problem for the identification and characterization of a compound of pharmacological interest is the isolation of lower abundant compounds due to the extreme complexity of the matrix; for instance, a fruit as pummelo (one of the object of this thesis work), also called Citrus Grandis from citrus family, is full of different classes of molecules. In particular, it is considered as a rich source of phenolic compounds.1 All his parts, peel’s albedo and
flavedo, juice and also leaves are full of molecules. There are several ways to process a fruit and to try to isolate a compound of interest: in this thesis work a mass spectrometry based approach has been used, preceded by one of the classic separation technique: liquid chromatography. Following the last applications in food chemistry for structural characterization of compounds from fruits, three new, unknown glycosilated flavonoidic compounds were characterized using high resolution and tandem mass spectrometry. Other four previously uncharacterized molecules, again flavonoids, were instead structural elucidated in another vegetable matrix called allium porrum, from aliacee family.
MS Applications on Food
Mass spectrometry (MS), at date, is an analytical technique suitable in several fields of research; MS can be considered as a tool for the biological sciences to reach target that other technologies are not able to reach. According to sensitive mass analyzers capable of appropriate resolution and mass range, MS/chromatography combinations, tandem mass spectrometry and new ionization methods, MS is now an indispensable tool in the fields of proteomics, lipidomics and metabolomics;on the basis of the detection, identification, quantification, and structural characterization of peptides, lipids, and metabolites derived from biological sources. In addition to these small-molecule applications, intact biomolecules such as proteins and protein complexes (enzyme-substrate, protein-protein, and protein- DNA)2, 3are increasingly
falling within the scope of MS, which is providing information such as molecular weight, stoichiometry, and binding affinity. All of these developments seem likely to be accelerated by the advent of ambient MS techniques4, which allow compounds ranging from biopolymers to small drugs to endogenous
biochemicals to be analyzed in unprepared samples, very rapidly and with high specificity. Further,mass spectrometry has become an important analytical tool in biology also because offers high-throughput, sensitive and specific analysis for many applications in microbiology, including clinical diagnostics and environmental research.5
Most of the recent applications in the food world to investigate their composition, their productive processes, for food quality and safety and to figure out their roles in diet and human health, are mass spectrometry-based. Some MS-based techniques are involved in the analysis of compounds of food concern as for instance the MALDI (matrix assisted laser desorption ionization) and ESI (electrospray ionization) sources to the analysis of proteins, peptides, lipids, phenolic compounds, etc.6 In the last few
years the role of mass spectrometry and related techniques is increasingly built up as an enabling tool in food analysis for elucidation of new compounds and also for quality control. Improvements in instrumentation, advances in on-line separation techniques and in data processing have contributed to determine a great expansion in the role of MS also in food-related analysis.6 Liquid chromatography-mass
spectrometry (LC-MS) coupling has led to the development of new interfaces, extending the possibilities and automation of various procedures even more.7, 8 Undoubtedly, significant advances in ionization
techniques having a broad range of applicability and high sensitivity for the analysis of high-polar and high-molecular mass compounds of food concern have been the key of this development in the last years. The impact of ionization technique such as electrospray (ESI) and matrix-assisted laser desorption ionization (MALDI)9on quadrupole, magnetic sector or time-of-flight (TOF) instruments, or coupled with
instruments with tandem MS (MS-MS) capabilities has been fundamental also for food applications. Among atmospheric pressure ionization (API)-based interfacing systems are ESI, that is liquid-based interface, and heated nebulizer-atmospheric pressure chemical ionization (HN-APCI), often coupled with LC systems.8 ESI and APCI well complement one another as regards to polarity and molecular mass of
analytes and of chromatographic conditions. Although use of APCI is not yet as widespread as ESI, the number of reported applications of APCI-MS is rapidly increasing. Separation techniques such as gas chromatography (GC), liquid chromatography (HPLC) and capillary electrophoresis (CE) have become analytical techniques with many applications in study of substances of food concern, ranging from naturally occurring compounds to xenobiotics. Analysis of complex food extracts requires highly selective analytical techniques to characterize and determine targeted compounds and to characterize unknown compounds. The coupling of chromatographic techniques and MS has overcome the main analytical problem, which is scarce information about identity given by the detectors usually associated with GC and HPLC. High analytical power of MS and on-line LC-MS have been convincingly proved. As for GC-MS, principles, instrumentation and analytical strategies using these techniques have been extensively discussed recently.10 Liquid chromatography coupled to MS-MS offers a powerful tool also in food
chemistry due to its selectivity, which enables the use of fast chromatography with low separation efficiency. However, in the analysis of real samples the existence of coeluting undetected components can lead to scarcely accurate method as a consequence of problems with the MS response, due to ion suppression and other effects. Thus the need for an efficient sample purification and chromatographic separation should not be undervalued. MS-MS can be accomplished using triple-quadrupole systems, which realize a tandem in-space instrument, or by performing in-source collision-induced dissociation (CID); furthermore, using ion trap (IT) instruments or LIFT cell instruments.11, 12
Natural Substances in Food
Mass spectrometry is considered to be a significant aid in natural substances characterization. In particular, rapid and sensitive characterization of polypeptides and proteins combined with sequence-related information can be directly obtained from MS-MS experiments of proteins. But also characterization of lipids, carbohydrates, vitamins, phenolic compounds, drugs and much more. In particular, mass spectrometry is suitable to characterize polypheolic compounds in foods; latter, play an important role as natural potent antioxidants exhibiting various physiological and biological activities, such as anti-inflammatory, anti-allergic and anti-carcinogenic activities, in the human metabolism. Owing to recognized beneficial properties toward human health, identification of antioxidant, phenolic compounds and their degradation products has been regarded as an important target successfully reached by using HPLC-MS13-19, 20-22, 23-31 and MALDI -TOF-MS.32-34 In fact, since polyphenolic compounds are
usually found as complex mixture in plants, the composition of which changes according to the plant examined, hyphenated techniques are needed. Among these, LC-MS with different ionization modes represents a rapid and reliable technique to analyze these involatile substances. In some cases the coupled technique can afford a full on-line structural analysis involving no time-consuming isolation process. Innovative results have been demonstrated for accurate mass determination of phenolics and related compounds using MALDI-TOF-MS. The increasing interest in the characterization of phenolic compounds in food products, studied in the first part of this thesis, has created new demands for the development of rapid, sensitive, and specific analytical methodologies for the identification and quantification of this class of chemical compounds in fresh and processed foods. As described in recent overview papers13, 14, over the past few years, various liquid chromatographic methods with UV-Vis
absorption or DAD-UV, fluorescence and more recently with MS detection have been developed for the analysis of these naturally occurring antioxidant, anti-inflammatory compounds in foods. The authors evidence that using traditional approaches based on HPLC-DAD, UV spectra of phenolic compounds are often very similar and the possibility of unambiguous identification does not exist. With the introduction of bench-top instrumentation, mass spectrometry coupled to HPLC has evolved into a routine technique that enables collection of significant data on the structures of these compounds that show similar UV-Vis spectra.15 Phenolic compounds in some vegetables matrices such as olive have been characterized by
reversed-phase liquid chromatography using ESI-MS detection.16, 17 Extracts from several olive fruit
samples were examined by LC–MS using ESI in the positive and negative ion modes to generate total ion current (TIC) chromatograms.16 With the aim to analyze phenolic compounds in olive fruit, the same
authors performed semi-preparative HPLC analyses to isolate the analytes of interest into distinct fractions and then the selected fractions were analyzed by LC–ESI-MS in both negative and positive ion modes.17 Although positive and negative analysis were complementary, the latter showed better sensitivity and selectivity for the acidic and phenolic compounds. Recently, the composition of simple phenolic compounds in fruits has been evaluated by RP-HPLC analysis and the identity of phenolic compounds was confirmed by LC–MS equipped an ESI ionization source.18 HPLC coupled with ESI-MS was investigated
as a reliable method for analyzing wine polymeric tannins.19 The apparatus coupled to the
units. It was observed that the response of polyphenols (except for anthocyanins) was better in negative ion mode than in positive ion mode. Further, signal intensity decreased as the polymerization degree increased. Various series of ion peaks containing a variable number of trihydroxylated units were detected as monocharged ions [M–H]- from dimers to pentamers. The largest mass detected in the analyzed wine
fraction corresponded to the mass of heptamers, which were found as doubly charged ions. Both APCI and ESI interfacing systems have been explored for coupling with HPLC for determination of low-molecular-mass phenols and flavan-3-ols in wine.35 Two different RPLC separation methods were optimized using
APCI and ESI as the ion sources either in positive or negative ion mode. Data reported in this paper showed that ESI coupled with HPLC provided to be the method of choice for the analysis of low-molecular-mass phenols under negative ion mode, whereas flavan-3-ol compounds were well detected under both positive and negative ion modes. HPLC–tandem mass spectrometry has been successfully applied to the quantitation of prenylflavonoids in hops and beer.22 After HPLC separation under
reversed-phase conditions, prenylflavonoids were detected by APCI in positive ion mode. Quantitative MS–MS data were obtained by multiple-reaction monitoring using a triple–quadrupole mass spectrometer equipped with an APCI source. Attention was paid to accuracy and precision of the method, which were evaluated on spiked samples. Besides phenolic compounds such as phenolic acids and aldehydes, include flavonoids. This class of poly coumaphenols have been found to be an important part of the human diet and have become an intense focus of research interest because of their perceived health beneficial effects (ref sindona bergamotto). Sindona et al have characterized 3-hydroxymethilglutaryl flavonid glycosides in bergamot fruit.36 Furthermore, anthocyanidins are an important class of flavonoid compounds which are
widely distributed in nature. Considerable effort was put in polyphenol analysis by the group of Sporns. 32-34 The applicability of MALDI-MS for both qualitative and quantitative analysis of anthocyanins was first
demonstrated in wine and fruit juice samples.32 Anthocyanins under acidic conditions were predominantly
in the aromatic oxonium ion form and easily ionized in MALDI-TOF-MS to form molecular cations [M] in the positive ion mode. Following similar analytical procedures, a MALDI-TOF-MS method was applied to identify flavonol glycosides in yellow onion and green tea.34 Recently, the interest in these phenolic compounds has increased significantly due to their potential health benefits as antioxidants and anti-inflammatory agents.37, 38That’s why the first part of this work was focused to the characterization of
unknown flavonoids, according to their potential beneficial effect on human health. The application of LC–MS with an ESI interface has been evaluated for the analysis of flavanones, flavones and flavonols.27
Following these studies, a method for extraction, separation and collection of unknown ions have been developed in this thesis and some di-glycosilated flavanols have been structurally elucidated using high resolution tandem mass spectrometry and1H-NMR to determine the position of the glycosidic part of the molecules.
Phenolic Compounds of Pharmacological Interest: Flavonoids.
Flavonoids are phenolic substances isolated from a wide range of vascular plants, with over 8000 individual compounds known. Structurally they are a polyphenols subclass which are widely distributed in
the plant kingdom, and characterized by two or more aromatics rings, each bearing at least one aromatic hydroxyl and connected with a heterocyclic pyran.39They act in plants as antioxidants, antimicrobials, photoreceptors, visual attractors, feeding repellants, and for light screening. Many studies have suggested that flavonoids exhibit biological activities, including antiallergenic, antiviral, anti-inflammatory, and vasodilating actions.40-42 However, most interest has been devoted to the antioxidant activity of
flavonoids, which is due to their ability to reduce free radical formation and to scavenge free radicals and to the anti-inflammatory activity, which is due to their polyphenolic structure that renders them quite sensitive to oxidative enzymes.43 Flavonoids are formed in plants from the aromatic amino acids
phenylalanine and tyrosine, and malonate.44The basic flavonoid structure is the flavan nucleus, which
consists of 15 carbon atoms arranged in three rings (C6-C3-C6), which are labeled A, B, and C (Figure 1).
Figure 1: basic flavonoid structure, a flavan nucleus, which consists of 15 carbon atoms arranged in 3
rings labeled A, B and C.
The various classes of flavonoids differ in the level of oxidation and pattern of substitution of the C ring, while individual compounds within a class differ in the pattern of substitution of the A and B rings. Among the many classes of flavonoids, those of particular interest are flavones, flavanones, isoflavones, flavonols, flavanonols, flavan-3-ols, and anthocyanidins. Other flavonoid classes include biflavones, chalcones, aurones, and coumarins. Hydrolyzable tannins, proanthocyanidins (flavan-3-ol oligomers), caffeates, and lignans are all plant phenols, and they are usually classified separately. Flavonoids generally occur in plants as glycosylated derivatives, and they contribute to the brilliant shades of blue, scarlet, and orange, in leaves, flowers, and fruits.45Apart from various vegetables and fruits, flavonoids are found in
seeds, nuts, grains, spices, and different medicinal plants as well in beverages, such as wine (particularly red wine), tea, and (at lower levels) beer.46 More specifically, the flavones apigenin and luteolin are
common in cereal grains and aromatic herbs (parsley, rosemary, thyme), while their hydrogenated analogues hesperetin and naringin are almost exclusively present in citrus fruits.47The flavonols quercetin
and kaempferol are predominant in vegetables and fruits, where they are found mainly in the skin, with the exception of onions. Isoflavones are found most often in legumes, including soybeans, black beans, green beans, and chick peas. Alfalfa and clover sprouts and sunflower seeds also contain isoflavones.48 The
flavan-3-ols (+)-catechin, (-)-epicatechin, (-)-epigallocatechin, and their gallate esters are widely distributed in plants, although they are very rich in tea leaves. Flavan oligomers (proanthocyanidins) are present in apples, grapes, berries, persimmon, black currant, and sorghum and barley grains.49
Anthocyanidins and their glycosides (anthocyanins) are natural pigments and are abundant in berries and red grape.50 Flavonoids play different roles in the ecology of plants. Due to their attractive colors,
flavones, flavonols, and anthocyanidins may act as visual signals for pollinating insects. Because of their astringency, catechins and other flavanols can represent a defense system against insects harmful to the plant.51 Flavonoids act as catalysts in the light phase of photosynthesis and/or as regulators of iron
channels involved in phosphorylation.52 They can also function as stress protectants in plant cells by
scavenging ROS produced by the photosynthetic electron transport system.53 Furthermore, because of their favorable UV-absorbing properties, flavonoids protect plants from UV radiation of sun and scavenge UV-generated ROS.54 Apart from their physiological roles in the plants, flavonoids are important
components in the human diet, although they are generally considered as non-nutrients. Indeed, the level of intake of flavonoids from diet is considerably high as compared to those of vitamin C (70 mg/day), vitamin E (7-10 mg/day), and carotenoids (β- carotene, 2-3 mg/day).55Flavonoid intake can range between
50 and 800 mg/day, depending on the consumption of vegetables and fruit, and of specific beverages, such as red wine, tea, and unfiltered beer.56 In particular, red wine and tea contain high levels (approximately
200 mg per glass of red wine or cup of tea) of total phenols. Thus, variations in consumption of these beverages are mainly responsible for the overall flavonoid intake in different national diets. Another significant source of flavonoids are different medicinal plants and related phytomedicines.57 Several
epidemiological studies provide support for a protective effect of the consumption of fresh fruits and vegetables against cancer58, 59, heart disease60-62, and stroke.63, 64 Normally, high consumers of fruits and
vegetables have a healthy lifestyle, which may be an important factor for their resistance against chronic diseases. All in all, fruits and vegetables do play a preventive role, which is due to a variety of constituents, including vitamins, minerals, fiber, and numerous phytochemicals, including flavonoids. Thus, it is possible that also flavonoids contribute to the protective effect of fruits and vegetables. This possibility has been evidenced by several in vitro, ex vivo, and animal studies.65 Unfortunately, the
evidence in humans is still limited and somewhat controversial.66 According to some epidemiological
studies, there is no evidence that flavonoid intake is protective against some types of cancer.67 Only one
study has shown that the consumption of flavonoids is inversely correlated with lung cancer.68 In contrast,
a possible protective role against coronary heart disease of flavonoid intake (either from fruits and vegetables or red wine and tea) has been reported in four out of six epidemiological studies.69 The dietary
sources of flavonoids were fruits, vegetables, red wine, and tea, and they were found to be inversely correlated with the risk of coronary heart disease and stroke. Accordingly, the present epidemiological data (although far from conclusive) evidence a possible protective role of dietary flavonoids, thus making desirable a regular consumption of foods and beverages rich in flavonoids.
Citrus Fruits as well as Aliacee Plants as Source of Phytochemical Substances
Food, in general, is full of nutrients with some beneficial effects on human health, if the dietary intake is regulated. The possible beneficial effects of foods are due to micronutrients (for example vitamins and minerals) and to functional food ingredients and antioxidant nutraceuticals, ‘‘phytochemical substances”.1
Phytochemicals can be defined as substances found in edible fruits and vegetables that, daily ingested, may exhibit a potential for modulating human metabolism in a manner favourable for the prevention of chronic and degenerative diseases. Nowadays, many studies are carried out on the thousands of phytochemicals that may have important physiological effects. An increased consumption of fruit and vegetables, typical Mediterranean diet foods, may protect against degenerative pathologies, such as cancer and atherosclerosis.70, 71 Epidemiological studies have shown an inverse relationship between dietary flavonoid intake and cardiovascular diseases.72 Among the phytochemicals, flavonoids are widely
contained in Citrus fruits.73 Citrus fruits are the principal source of such important nutrients. They contain
vitamin C, folate, dietary fibre and other bioactive components, such as carotenoids and flavonoids, which are suggested to be responsible for the prevention of cancer and degenerative diseases.74
As described, according to their molecular structures flavonoids are divided into six classes: flavones, flavanones, flavonols, isoflavones, anthocyanidins and flavanols (or catechins) (Figure 2).75 Flavonoids
identified in Citrus fruits cover over 60 types, according to the five classes mentioned76: flavones,
flavanones, flavonols, flavans and anthocyanins (the last only in blood oranges).Table 1shows the main chemical structures of some flavonoids isolated from Citrus fruits, their structures (flavanone, flavone, or flavonol) and their chemical groups. Citrus flavanones are present in the glycoside or aglycone forms. Among the aglycone forms, naringenin and hesperetin are the most important flavanones (Table 1). Among the glycoside forms, two types are classified: neohesperidosides and rutinosides.77, 78
Neohesperidosides, flavanones, naringin, neohesperidin and neoeriocitrin consist of a flavanone with neohesperidose (rhamnosyl-a-1,2 glucose) and they have a bitter taste (Table 1), while rutinosides (flavanones, hesperidin, narirutin and didymin) have a flavanone and a disaccharide residue e.g. rutinose (ramnosyl-a-1,6 glucose) and they are without taste (Table 1). Flavanones are usually present in diglycoside form, conferring the typical taste to Citrus fruits.78 Phenolic compounds and flavonoid
profiles are detected by HPLC-MS. These compounds can be divided into two groups according to the lag-times: the first eluted are flavanone glycosides while the second group are polymethoxylated flavones (subsequently eluted they are less polar).79 Among flavonoids, the anthocyanins are structurally derived
from pyran or flavan and, in particular, oxygen attributes a basic property to this molecule. They can be present as aglycones (anthocyanidins metabolites of flavones) (Figure 2). Catechins, leucoanthocyanin and proanthocyanins are in the flavan group, as also are tannins. They can be found in monomer, dimer and polymer forms, respectively monoflavans, biflavans or triflavans.80
Figure 2: molecular structures of flavonoide. The basic structure consists of the fused A and C ring, with
the phenyl ring B attached to through its 1' position to the 2-position of the C ring (numbered from the pyran oxygen).
Flavonoids are a group of pigments contained in plants and they are responsible for flower and fruit coloration. Flavonoids are present in dietary fruits and vegetables.78 The Citrus peel and seeds are very
rich in phenolic compounds, such as phenolic acids and flavonoids. The peels are richer in flavonoids than are the seeds.81 Since a Citrus fruit is peeled, peel and seeds are not used. It is necessary to estimate these
by-products as natural antioxidants in foods.82 The 7-O-glycosylflavanones are the most abundant
Table 1: structural characteristics and molecular weights of Citrus flavonoide in the aglycone and
glycoside forms.
Among the neohesperidoside flavanones, naringin, neohesperidin and neoeriocitrin, are mainly present in bergamot, grapefruit and bitter orange juices. Among rutinoside flavanones, hesperidin, narirutin and didymin, are present in bergamot, orange, mandarin and lemon juices.86 Flavanone chemical structures
seed and peel compositions are not always the same in Citrus fruits. For example, the lemon seed mainly contains eriocitrin and hesperidin, while the peel is rich in neoeriocitrin, naringin and neohesperidin. Moreover, the glycosylated flavanone concentrations are different; neoeriocitrin and naringin have similar concentrations in peel while, in seed, eriocitrin is 40 times more abundant than is naringin.90
Neohesperidin, naringin and neoeriocitrin are extracted from peel in great amounts. Bitter orange is a very interesting neohesperidin and naringin source; these compounds can be useful for the production of sweeteners. The seeds of bergamot are the most important source of the glycosylated flavanones, naringin and neohesperidin; lemon is rich in eriocitrin and hesperidin. All the other Citrus fruits have small amounts of glycosylated naringin.91 Flavanone glycosyl compositions of peels and seeds are quite unlike
those of juices. Naringin has been found in lemon peel and seed and in mandarin seed, but it is not present in the juices of these fruits.92 This glycosylated flavanone is never present in sweet orange juice, and its
presence is used to detect adulteration.88 Although flavones and flavonols have been found in low
concentrations in Citrus tissues, these compounds are studied to evaluate their antioxidant ability.93
Miyake et al. isolated two C-glucosylflavones from the peel of lemon fruit (Citrus Limon BURM. f.). They identified 6,8-di-C-b-glycosyldiosmin and 6-C-b-glycosyldiosmin by UV, IR, FABMS, 1H NMR,
and 13C NMR analyses. In lemon juice extracted from several cultivars, there is little difference in the
glycosylated flavonoids amounts. Eriocitrin, 6,8-di-C-b-glycosyldiosmin and 6-C-b-glycosyldiosmin are particularly abundant in lemon and lime, while they are almost absent in other Citrus fruits.94 Anthocyanins constitute the colouring compounds of flowers and fruits, but sometimes also of leaves, buds and roots. They are in the epicarp, but they also colour the mesocarp of oranges. The anthocyanin content is strongly dependent on the level of maturation. Catechins, leucoanthocyanin and proanthocyanins are not Citrus fruit specific compounds because they are also found in other vegetables. Also plants of the genus Allium have been recognized as rich sources of secondary metabolites endowed with interesting biological activities.95As a part of a systematic phytochemical study on Mediterranean
Allium species, Fattorusso et al. have recently obtained a number of new kaempferol glycosides from the wild garlic, A. ursinum L.96, and from the ornamental garlic, A. neapolitanum Cyr97, this latter plant also contained some quercetin and isorhamnetin glycosides. They investigated also the flavonoid glycosides of leek, A. porrum L. (Alliaceae). Although this plant is widely distributed and commonly used as a food, no systematic evaluation of its flavonoid composition has been reported yet. The isolation from bulbs of leek of five flavonol glycosides, two of which, based on a kaempferol aglycone and acylated with a 3-methoxy-4-hydroxycinnamoyl moiety, were proposed. All the isolated compounds were evaluated for their inhibitory activity on human platelet aggregation, an action already evidenced for kaempferol. In particular, kaempferol was reported to inhibit markedly (IC50 20 mM) platelet aggregation and ATP release of platelets induced by arachidonic acid or collagen. In addition, kaempferol also acts as a thromboxane receptor antagonist, and it has been claimed as an active agent in the prevention of atherosclerosis and acute platelet thrombus formation. In this thesis work Allium porrum was investigated to furher characterize new unknown flavonoids.
Distribution of Flavonoids in Citrus Fruits and Tissues
The detailed flavonoid composition in fruit tissues of the Citrus species was analyzed by Nogata et al. in 2006; this study provide data that would enable more effective utilization of flavonoids constituents and to examine the agreement of their flavonoids composition with Tanaka’s classification system. The latter was made in 1969 and can be considered as a morphological classification of the Citrus genus divided into 2 subgenera, 8 sections and 16 subsections, involving 149 species.98 Swingle, an advocator of another
system, classified Citrus into 2 subgenera and 16 species including 8 varieties in 1948.99 The major
difference between these two systems is in how mandarins were treated: Swingle placed all mandarins except C. tachibana and C. indica in C. reticulata, whereas Tanaka separated mandarins into 36 species. Nogata et al. evaluated flavonoids concentration in each tissue of citrus fruits on a fresh weight basis. The composition data for each fruit were calculated from all the different parts of the fruit: from those of the flavedo, albedo, segment epidermis, and juice vesicle tissues, and that for the peel tissue was from those of the flavedo and albedo tissue. Albach and Redman have shown that Citrus species could be differentiated on the basis of their content of neohesperidosides or rutinosides.100 Basically, all neoesperidosyl
flavanones present in citrus fruits and also some neohesperidosyl flavones were found as principal components in the segment epidermis; on the other hand, the rutinosyl flavonoids (with some exceptions) had opposite score in the same fruit tissues. The presence and the relative concentration of all the flavonoids species in Citrus fruits was found different. Although some study have suggested that the sugar type largely contribute to the principal components, the flavonoid glycosides generally decreased with decreasing polarity of the fruit.101Therefore, the polarity of the flavonoids constituents is suggested to
contribute in the second principal components of the fruit. In respect of the principal component of the segment epidermis, the flavonoid glycosides had inverse values to those of the fruit and the contribution of polymethoxylated flavonoids was smaller than that of the fruit. Further, values for the flavonoids in the juice vesicle had different patterns from those in the other parts of fruits, and no clear trend apparent. According to several study it’s clear that the composition data are influenced by the flavonoid localization, pulp content, and water content. And also the flavanone glycoside composition of some Citrus juice was demonstrated as differentiated by Mouly et al.. Provided that the number of citrus biotypes is limited, the flavonoid composition should enable their differentiation. In conclusion, the flavonoid composition in the tissues of more than 45 Citrus species may differ with the recognition of morphological differences due also to the geographic area. Although, most of the flavonoids present in the citrus fruits as principal or secondary components are already structurally elucidated and is known their action, physiological and pharmacological, many compounds are still unknown, especially the minor components. The first part of this PhD was focused to discover, isolate and characterize unknown flavonoids in Citrus fruit as Pummelo. The pummelo (Citrus maxima or Citrus grandis) is a citrus fruit native to South East Asia. It is usually pale green to yellow when ripe, with sweet white (or, more rarely, pink or red) flesh and very thick pudgy rind. It is the largest citrus fruit, 15–25 cm in diameter, and usually weighing 1–2 kg. Other spellings for pomelo include pummelo, and pommelo, and other names include Chinese grapefruit, jabong, lusho fruit, grapefruit (aka pomplemous), papanas, and shaddock. The pomelo tastes like a sweet, mild grapefruit, though the typical pomelo is much larger in size than the grapefruit. It has very little, or none, of the
common grapefruit's bitterness, but the enveloping membranous material around the segments is bitter, considered inedible, and thus usually discarded.
Mass Spectrometry Fundamentals
Ion Sources
The function of an ion source is to convert sample molecules or atoms into gas-phase ionic species. Several different types of ion-source designs are in use, some operating at very low pressures and some at atmospheric pressure, and not all are alike in construction. Some common elements of these sources are (1) a source block, (2) a source of energy (e.g., an electron, particle, or ion beam), (3) a source heater, (4) a short ion-extraction region that accelerates the ions to a specified fixed kinetic energy, and (5) an exit slit assembly. The accelerating potential is set to several kilovolts in magnetic-sector and time-of-flight (TOF) instruments, but to only a few volts in quadrupole-based mass spectrometers. The ion source should have the following desirable characteristics: (1) high ionization efficiency (a requirement for high detection sensitivity), (2) a stable ion beam, (3) a low-energy spread in the secondary-ion beam, (4) minimum background ion current, and (5) minimum cross-contamination between successive samples.
Electrospray
Electrospray ionization (ESI) is also an API technique that is applicable to a wide range of liquid-phase
samples. In particular, it has made an enormous impact in the characterization of large biomolecules. It has also become the most successful interface for LC/MS and CE/MS applications.102, 103 Although the
concept of electrospray was put forward by Malcom Dole in 1968104, the development of ESI–MS is
credited to John Fenn105, 106, who was awarded the 2002 Nobel Prize in Chemistry for that contribution. As
the name implies, electrospray ionization is a process that produces a fine spray of highly charged droplets under the influence of an intense electric field. Evaporation of the solvent converts those charged droplets into gas-phase ions. A simplistic view of the ESI process is depicted schematically in Figure 3.
The sample solution in a suitable solvent mixture flows continuously through a stainless steel capillary tube whose tip is held at a high potential (3 to 4 kV) with respect to the walls of the surrounding atmospheric-pressure region, called a counter-electrode. The solvent consists of a 1 : 1 (v : v) mixture of water and acetonitrile and typically contains <1% acetic acid, formic acid, or trifluoroacetic acid. The potential difference between the tip of the capillary and the counterelectrode produces an electrostatic field that is sufficiently strong to disperse the emerging solution into a fine mist of charged droplets. Evaporation of the charged droplets is assisted by a flow of hot nitrogen. During the process of droplet evaporation, some of the dissolved ions are released into the atmosphere. The resulting ions are transported from the atmospheric-pressure region to the high vacuum of the mass analyzer via a series of pressure-reduction stages. Two designs of the transport region are commonplace in the commercial version of the ESI source; one consists of a heated metal or glass capillary several centimeters long (shown in Figure 4) and the other of small-orifice skimmer lenses (Figure 5) similar to those outfitted in an APCI source. To improve the iontransmission efficiency, radio-frequency rf ) multipoles (quadrupoles, hexapoles, or octopoles) or “ion funnels” are placed between the ESI source and the mass analyzer. Optimum operation of a normal ESI source is achieved at flow rates of 2 to 10 μL/min. For stable operation at higher flow rates (0.2 to 1.0 mL/min−1; e.g., effluents from narrow- and wide-bore analytical
HPLC columns), some form of an additional source of energy, such as heat or a high velocity annular flow of gas, is supplemented to disperse the liquid into fine droplets. Electrospray analysis can be performed in positive and negative ionization modes. The polarity of the ions to be analyzed is selected by the capillary voltage bias. A novel feature of the ESI mass spectrum is the formation of intact molecular ions of the analyte. Fragmentation, if desired, can be induced in the ion transport region of the ESI source by increasing the sampling cone voltage. This process is known as in source collision-induced dissociation (CID) or nozzle–skimmer (NS) dissociation.
Figure 5: block diagram of an electrospray ionization source that uses skimmer lenses.
The mechanism of ESI is a highly debated topic.106-112 It is generally believed that ionization in
electrospray involves three different processes: droplet formation, droplet shrinkage, and desorption of gaseous ions. At the onset of the electrospray process, the electrostatic force on the liquid leads to a partial separation of charges. In the positive-ion mode, cations concentrate at the tip of the metal capillary and tend to migrate toward the counter-electrode, whereas anions migrate inside the capillary away from the tip (Figure 6a). The migration of the accumulated positive ions toward the counter-electrode is counterbalanced by the surface tension of the liquid, giving rise to a Taylor cone at the tip of the capillary (Figure 6b). If the applied electric force is large enough, a thin cylinder of the liquid extends from this cone and breaks into a mist of fine droplets. The continuous production of charged species is assisted by electrochemical redox processes. In the positive-ion mode, electrochemical oxidation occurs in solution at the metal contact of the sprayed solution and reduction at the counter-electrode. In the negative-ion mode, the migration of anions and direction of electrochemical processes are reversed. A number of factors, such as applied potential, flow rate of the solvent, capillary diameter, and solvent characteristics influence the size of the droplets formed initially. Evaporation of the solvent from these droplets leads to droplet shrinkage. A cascade of droplet-fission processes follows. As the droplets shrink in size, the charge density on their surface increases until it reaches the Rayleigh instability limit. At this point, the repulsive coulombic forces exceed the droplet surface tension, causing fission of the droplets into smaller and highly charged offspring droplets. Further evaporation of the solvent results in Coulomb fission of the offspring droplets into second-generation droplets. Two mechanisms have been proposed to explain ion desorption from the droplets: the charge-residue model (CRM) and the ion-desorption model (IDM).108 According to
the CRM proposal (see Figure 7a), the sequence of solvent evaporation and droplet fission is repeated several times, until the drop size becomes so small that it contains only one solute molecule. As the last of the solvent is evaporated, that molecule is dispersed into the ambient gas, retaining the charge of the droplets. As shown in Figure 7b, the IDM proposal also relies on the sequence of solvent evaporation and droplet fission.
Figure 6: depiction of electrochemical processes and Taylor cone formation in the ESI.
Figure 7: desorption of ions from charged droplets into the gas phase: (a) Charge residue model; (b)
Expulsion of the solvated ions into the gas phase, however, takes place at some intermediate droplet size (10 to 20 nm in radius) when the electric field due to the surface charge density is sufficiently high but less than the Rayleigh instability limit. Currently, it is generally believed that the IDM model applies to ions with significant surface activity (i.e., hydrophobic molecules) and the CRM model applies largely to hydrophilic species. Thus, proteins and metal cations may follow CRM, whereas peptide and fatty acids follow IDM. As a consequence, the ESI response depends on the nature of the analyte. Enke has put forward an equilibrium partitioning model to explain differences in ESI response.113This model predicts
that surface-active analytes compete favorably with excess droplet surface charge and thus exhibit a higher ESI response. Because of this relationship between the nonpolar character of the analytes and their ESI response114, a correlation exists between ESI response and the HPLC retention time.115
Mass Analyzers and Mass Resolving Power
High resolution is a desirable figure of merit of a mass spectrometer because it helps to (1) perform accurate mass measurements, (2) resolve isotopically labeled species when the percent incorporation of the label is to be determined, (3) resolve an isotopic cluster when the charge state of high-mass compounds is to be determined, (4) enhance the accuracy of quantification, and (5) unambiguously mass-select precursor ions in MS/MS experiments. By definition, the mass resolution of a mass spectrometer is its ability to distinguish between two neighboring ions that differ only slightly in their mass (Δm). Mathematically, it is the inverse of resolving power (RP), given as
where m is the average of, and Δm is the difference in, the accurate masses of two neighboring ions. A larger RP means that a smaller mass differences can be resolved. According to the 10% valley definition (depicted in Figure 8), the two equal-height peaks are considered resolved when the valley between the two ions is 10% of the height of either one (i.e., each contributes 5% to the valley). The value of RP can also be expressed in terms of the width of a single symmetrical well-resolved peak. Here m is the m/q value at the apex of the peak and Δm is the width of the peak at a specified height. The peak-width definition is depicted pictorially on the right-hand side of Figure 8. Use of the 10% valley definition is a common practice with magnetic-sector and quadrupole instruments. In TOF, QIT, and FT-ICR mass analyzers, the peaks separated by 50% valley are considered as resolved. In such cases, resolution is reported in terms of full width at half maximum (FWHM; see Figure 8). The RP value in FWMM definition is larger by a factor of 2 than the 10% valley definition.
Figure 8: resolving power: 10% valley definition (depicted by separation of two ions of mass m1and m2)
and FWHM definition (h/2 is half the height of the peak).
The Quadrupole
Quadrupole instruments are probably the most widely used type of mass spectrometer. A quadrupole consists of four precisely matched parallel metal rods (Figure 9). The mass separation is accomplished by the stable vibratory motion of ions in a high-frequency oscillating electric field that is created by applying direct-current (dc) and radio-frequency (rf) potentials to these electrodes.116-118 Under a set of defined dc
and rf potentials, ions of a specific m/q value pass through the geometry of quadrupole rods. A mass spectrum is obtained by changing both the dc and rf potentials while keeping their ratio constant. Four metallic rods (electrodes) are arranged symmetrically in a square array (Figure 9).
Figure 9: quadrupole mass analyzer. At a certain values of dc potential U and rf potential V , ions of a
within the quadrupole field to reach the detector; all other ions are lost because they follow unstable trajectories.
Ideally, the rods should be of hyperbolic geometry, but for convenience, precisely machined circular rods are acceptable. The field within the square array is created by connecting opposite pairs of electrodes electrically. One pair receives a superimposed positive dc potential U and a time-dependent rf potential V cos ωt, where ω is the angular frequency (in rad s−1) of the applied rf voltage, V its amplitude, and t the
time. The angular frequency is related to the radio-frequency f (in hertz) by ω = 2πf . The other adjacent pair of rods receives a dc potential –U and an rf potential of the same magnitude, V cos ωt , but out of phase by 180° [i.e., −(U − V cosωt)]. Application of these voltages creates an oscillating field within the rods that is given by
where Φ0is the applied potential (i.e., U − V cos ωt ), r0the inscribed radius (i.e., one-half the distance
between the opposite electrodes), and x and y the distances from the center of the field. Ions are injected at one end of the quadrupole structure in the direction of the quadrupole rods (the z-direction). Separation of ions of different m/q value is accomplished through the criterion of path stability within the quadrupole field. At a given set of operating parameters, ions of a narrow but adjustable m/q range have stable trajectories (i.e., their motion is confined within the field-defining electrodes), whereas the remainder of the ions will have unstable trajectories (i.e., the amplitude of their motion exceeds the boundaries of the electrodes). Thus, the mass separation action of a quadrupole is similar to that of a narrow bandpass filter rather than a conventional mass spectrometer (i.e., ions of a narrow mass window can survive within the quadrupole geometry). To obtain a mass spectrum, the quadrupole field is varied to force other mass window ions to sweep through the quadrupole. The mass-filtering action of a quadrupole can be explained as follows118: consider first the action of a positive pair of electrodes (i.e., those acting in the xz-plane). As
shown in Figure 10a, the positive dc potential applied to these rods will accelerate positive ions toward the central axis (point a). The simultaneous action of the rapidly changing rf potential during its negative half-cycle will accelerate these ions toward the rods (point b); the low-m/q ions will be accelerated to the highest velocities on each half cycle and will ultimately be eliminated from the field-defining space. In contrast, the higher-m/q ions will respond sluggishly to this rf potential and will remain confined within the boundaries of the rods. Thus, a positive pair of rods acts as a high-pass filter for positive ions. Now consider the action of the negative pair of electrodes the (y − z-plane). Because of the continuous action of the negative dc potential, all positive ions will be attracted toward the rods (point a in Figure 10b).
Figure 10: operation of a quadrupole in (A) the xz-plane and (B) the yz-plane. In the xz-plane, the positive
rods act as a high-pass filter for positive ions. The ions converge toward the z-axis (at point a) due to the action of the positive dc potential and are defocused due to the action of the negative half-cycle of the rf potential. Similar actions make the negative pair of rods low-pass filter in the yz-plane.
During the short period of the positive half-cycle of the rf potential, only the motion of lower-m/q ions will be reversed toward the center of the rods (point b). Because of their inertia, the higher-m/q ions will be lost to the rapidly changing positive rf potential. Thus, the negative pair of electrodes acts as a low-pass filter. The combination of these actions creates a stability window for ions of a narrow m/q range to travel through the rods (in the z-direction)
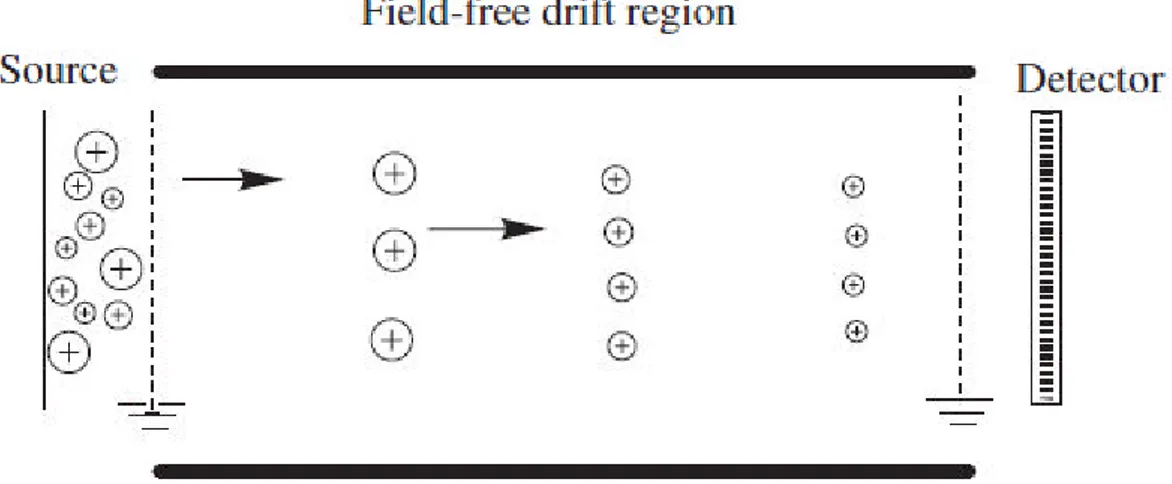
The Time-of-Flight
A time-of-flight (TOF) mass spectrometer, one of the simplest mass-analyzing devices, is currently in high demand. In combination with matrix-assisted laser desorption/ionization (MALDI), it has emerged as a mainstream technique for the analysis of biomolecules. The basic principle of ion separation by TOF mass spectrometry was conceptualized by Stephens in 1946.119This mass analyzer consists of a long (ca. 100
cm in length) field-free flight tube in which ions are separated on the basis of their velocity differences. A short pulse of ions of defined kinetic energy is dispersed in time when it travels a long flight tube (of length L). The velocities, v, of ions are an inverse function of the square root of their (m/q or m/z) values:
Therefore, the lower-m/q ions travel faster and reach the detector earlier than the higher m/q ions. Thus, a short pulse of ions is dispersed into packets of isomass ions (Figure 11).
Figure 11: principle of mass separation by a time-of-flight mass analyzer. Ions are separated on the basis
of their m/q; high m/q ions (big circles) travel slower than the lower m/q ions (smaller circles).
The time of arrival of an ion is given by
The measured arrival times of all ions provides a time spectrum that is converted into a mass spectrum by calibrating the instrument. A generally accepted calibration equation is
which is valid with currently popular delayed-extraction TOF. In these instruments, the linear relation between m/q and t2 no longer exists. In this equation, a is the constant of proportionality between the
arrival time of an ion and its m/q, and b is a time offset that arises from the difference in time between the ion extraction and the data acquisition start pulse. These constants are determined with two different ions of known m/q values.
Because a defined start–stop signal is required for the measurement of time, an essential prerequisite in the TOF operation is that all ions enter the flight tube at exactly the same time. This arrangement would also avoid any artifact left behind from the previous ionization event. For this reason, TOF instruments are optimally combined with pulsed-mode ion sources such as 252Cf plasma desorption or MALDI. Alternatively, pulsing the accelerating potential can provide a pulsed ion beam from continuous ion beam sources (e.g., electron ionization, and electrospray ionization). In the past, conventional TOF–MS, popularly known as linear TOF–MS, found limited application owing primarily to its poor resolution
Eq. 4
(<500) and incompatibility with continuous-beam ion sources. The limitation of poor resolution has been circumvented to some extent by the current developments described next. In TOF–MS, mass resolution is related to the temporal width of the isomass ions packet when that packet arrives at the detector (i.e., R =
t/Δt). In the ion source, ions are accelerated out of the source region with inherent dispersion in time
(instant of ion formation), space (location of ion at the time of acceleration), and velocity (owing to differences in the initial kinetic energy of ions). These are the three primary factors that limit the resolution in a TOF instrument.120-122The initial kinetic energy (KE) of ions (i.e., KE before acceleration)
is given by KE = 1/2 mv02, where v0 is the initial velocity, which will be in a random direction; after
acceleration, KE = qV + 1/2 mv02. The temporal dispersion creates uncertainty in the ions’ arrival time at
the detector. The contribution of this factor can be minimized by the use of a very short ionization pulse and/or a fast-rise ion-extraction pulse, and also by increasing the flight path. Multiturn and multipass research TOF mass spectrometers are available to increase the ion flight path without increasing the size of the instrument significantly.123, 124The spatial distribution gives rise to differences in kinetic energies
and source exit times of ions after their acceleration. Consider two same-mass ions formed at different locations in the ion source. Because the ion formed to the left of the central axis is subjected to a higher potential, it will be accelerated to a higher velocity than the ion formed to the right of the central line, but it will exit the source later. Convergence of spatially dispersed ions is achieved at the space focus plane, where the faster later ions catch up with the slower earlier ones. The spatial distribution of MALDI-formed ions is inherently low because the plane of ion formation is well defined. The initial kinetic energy spread 1/2 mv02 is the dominating factor that restricts resolution in TOF instruments. The spatial
distribution and initial kinetic-energy spread of ions are minimized by incorporating delayed-extraction and reflectron devices. With gas-phase ionization techniques, the initial kinetic energy variations in both magnitude and direction gives rise to a resolution factor called the turnaround time, the extra time that an ion traveling initially away from the exit slit must take to exit the ion source. Because this ion must reverse its direction before it begins its journey toward the detector, it lags behind other ions of identical initial velocity that were moving toward the exit slit. Longer flight tubes and longer flight times can reduce the effect of the turnaround time. The difference in the arrival times of ions that differ in mass by 1 u (say, 2000 and 2001 u) is very short (in nanosections). Therefore, the mass resolution of TOF instruments is also limited by the time-resolving power of the ion detection system. Delayed extraction (DE), the principle of which was first enumerated by Wiley and McLaren in 1956 in the form of time-lag
focusing125, is one way to improve the resolution of linear TOF mass spectrometers.126-128 This procedure
uses a dual-stage ion-extraction optics with two distinct extraction and acceleration regions (Figure 12). During the ionization pulse, no potential is applied to the extraction region. Therefore, ions drift in this region in a field-free environment with their initial velocities v0. After a short delay of a few hundred nanoseconds, the acceleration potential is applied to extract the ions from the source. During this delay period, the slow-moving ions lag behind the fast-moving ions.