MARKERS OF EFFECT IN DOPING ANALYSIS:
IDENTIFICATION OF NOVEL POTENTIAL
BIOMARKERS OF DOPING IN BLOOD SAMPLES.
Tutors:
Prof. Claudio Villani
Prof. Francesco M. Botrè
PhD Program in Pharmaceutical Science XXXIII Cycle (2017-2020)
Giorgia Corpetti
1
Summary of contents
General Section
1. Background and aim
1.1. Background and brief historical remarks
1.2. The present organization of the fight against doping: the World Anti-Doping Agency 1.3. Aims and scope of the project
2. Overview on the main energetic cellular pathways
3. Physical exercise, cell energy metabolism and doping: selected candidate markers
3.1 Adiponectin 3.2 Leptin 3.3 Irisin
3.4 Hypoxanthine and Xanthine
Experimental Section
4. Materials and Methods
4.1. Blood samples preparations 4.2. Immuno-enzymatic analysis 4.3. LC-MS-MS Analysis
2
5. Results and discussion
5.1. Targeted approach 5.2. Untargeted approach
6. Conclusions
7. Future perspectives
3
1 Background and Aim
1.1 Background and brief historical remarks
Drugs are chemical substances used in the treatment, cure, prevention, or diagnosis of disease, or used to otherwise enhance physical or mental well-being. This class of biologically active agents can interact and alter the physical, chemical and biolgical properties of the body. The definition of “biologically active” dates back to ancient Greece, when Hippocrates, often considered the “Father of Medicine”, defined “drug” an agent “biologically active”. Indeed, drugs can interfere with the homeostatic state of the body to express their therapeutical properties [1].
Biologically active substances were also used, already many centuries ago, to increase strength and surpass fatigue and possible injuries, caused by war, heavy physical works, and also athletic competition [2]. Among the first examples of naturally substances used for these aims are extracts from Ephedra, widely used in Chinese traditional medicine for their stimulants and anti-asthmatic effects [3], or coca leaves, used by South America together with other herbal extracts containing powerful stimulants. Regarding the abuse of pharmacologically active substances to improve sport performance, the intake of specific natural substances, contained in opium, hallucinogenic mushrooms, and alcoholic beverages has been often documented [2, 4, 5].
Throughout ancient history, the use of enhancing substances is almost omnipresent in all civilizations, but their prohibition dates back to the 20th century. For instance, it is remarkable that at the Ancient Olympic Games, the doping abuse among the athletes was normally not considered cheating (with the exception of alcohol, whose abuse was grossly screened for by “breath smelling”, whereas other dishonest behaviors, such as bribing an opponent, was punished severely.
In the 19th century, the use of stimulants to improve the physical capacity was usual amongst athletes
and without any prohibition, there was no need to cover its use. Around the end of the 19th and the
beginning of the 20th century, caffeine, alcohol, ether, nitro-glycerine, strychnine, cocaine and also
morphine were usual components of the enhancing mixtures taken by athletes [4].
In the second half of the 20th century, the new developments in science and medicine were crucial to identify and purify the active compounds that could promote an improvement of athletic performance. This new knowledge and the emergence of the first synthetic organic pharmaceuticals met the ideal conditions for the growth of modern “doping strategies” [6].
4
In the ‘60s, with the constitution of the Medical Commission of the International Olympic Committee (IOC) officially started the fight against the use of performance-enhancing substances. In 1999 a newly constituted organization, the World Anti-Doping Agency (WADA), replaced the IOC Medical Commission to take control of the overall anti-doping activities worldwide.
1.1 The present organization of the fight against doping: the World Anti-Doping Agency
The WADA’s primary mission is to coordinate and promote the development of international standardized anti-doping rules, to facilitate the coordination between sports organization and governmental authorities, ongoing with doping control research, and to encourage doping prevention activities [7]. In 2003 WADA adopted the World Anti-Doping Code (WADC) that became the first worldwide accepted document providing a set of harmonized antidoping policies, rules and regulations within sport organizations and public authorities. The current version of the World Anti-Doping Code[8] is under review for improving several aspects of anti-doping rules.
The process of revising of Code started in December 2017, and involved extensive stakeholder consultation regarding the International Standards (Standards) and WADA’s Athlete Committee’s Anti-Doping Charter of Athlete Rights (the latter that was subject to several rounds of athletes’ consultation in addition to one round of public consultation). As it relates to the Standards, the World Anti-Doping Agency (WADA) solicited feedback on the following, which included two new Standards. The review excluded the List of Prohibited Substances and Methods, which is reviewed annually via a separate stakeholder consultation process:
o International Standard for Code Compliance by Signatories (ISCCS) o International Standard for Testing and Investigations (ISTI)
o International Standard for Therapeutic Use Exemptions (ISTUE)
o International Standard for the Protection of Privacy and Personal Information (ISPPPI) o International Standard for Laboratories (ISL)
o International Standard for Education (ISE) (New)
o International Standard for Results Management (ISRM) (New)
The 2021 Code Review Process was held in three distinct consultation phases (while the Standards had two phases); during which, stakeholders received successive draft revisions; and, their feedback and recommendations were provided to the drafting teams.
The main significant changes between the current 2015 Code and the proposed 2021 Code have taken in consideration several aspects that gave the reviewed principal guidelines. As it relates to the
5
Prohibited List, it is reviewed annually via a separate stakeholder process, which leads to its continuous update. In the current version[9], the Prohibited List is structured as follows:
• Substances and Methods prohibited at all-times: o Prohibited Substances
▪ S0: Non-Approved Substances ▪ S1: Anabolic Agents
▪ S2: Peptide Hormones, Growth Factors, Related Substances and Mimetics ▪ S3: Beta-2 Agonist
▪ S4: Hormone and Metabolic Modulators ▪ S5: Diuretics and Masking Agents o Prohibited Methods
▪ M1: Manipulation of Blood and Blood Components ▪ M2: Chemical and Physical Manipulation
▪ M3: Gene and Cell Doping
• Substances and Methods prohibited in competition: o Prohibited Substances
▪ S6: Stimulants ▪ S7: Narcotics ▪ S8: Cannabinoids ▪ S9: Glucocorticoids
• Substances and Methods prohibited in particular sports: ▪ P1: Beta-Blockers
6
Figure 1.1: The Prohibited List 2020
In the last fifteen years, from the introduction of the Anti-Doping Code, there were significant milestones in the fight against doping. In 2004 Summer Olympic Games, a reliable test for hGH was introduced [10], in 2008 was developed the first method for determination of insulins [11], in 2009 was introduced the Athlete Biological Passport (ABP) [12], in 2011 the Section S0 of “ Non-Approved Substances” was inserted in the WADA Prohibited List. In 2014 and 2015 the gas Xenon and the stabilizes of Hypoxia-inducible factors (HIF) were inserted in the Prohibited List and in the Summer Olympic Game of Rio de Janeiro. In 2016 the first test for Gene Doping was done.
The anti-doping challenge is based on direct and indirect analysis. The first one allows to individuate targeted substances alias banned substance or their metabolite(s) in the athlete’s body, the last one provides valuable information that can be used to direct Target Testing or investigations more effectively. The longitudinal analysis is another nodal part of the anti-doping strategy to supervise the physiological data of athletes. Every ABP is analyzed during all athlete’s career-long and if some analytical data result “atypical” alias outside of “normal” own personal physiological range, the athlete undergoes a detailed analytical study with risk to penalty and ban to the sport.
The scientific community first proposed the term “athlete biological passport” in the early 2000s when monitoring of select hematological variables (Markers of blood doping) was identified as a way to define an individual’s hematological profile. In conjunction with several stakeholders and medical experts, the World Anti-Doping Agency (WADA) further developed, harmonized and validated this concept. The result was a formal operating guideline and mandatory standards known as the Athlete
7
Biological Passport (ABP), first published in 2009, which concerned exclusively the Hematological Module or Blood Module.
Since then, WADA ABP Guidelines have been continuously refined and the ABP approach has been successfully integrated into the anti-doping strategies of numerous International Federation (IF) and National Anti-Doping Agency (NADO) programs, resulting in a significant increase in the number of adverse analytical findings (AAFs) that are a result of targeting by the ABP as well as several direct anti-doping rule violations (ADRVs).
In 2014, the initial system was complemented with the Steroidal Module, which was launched to establish longitudinal profiles of an athlete’s steroid variables.
The framework proposed in these Guidelines builds on existing anti-doping infrastructure to promote harmonization in ABP Programs, facilitate the exchange of information and mutual recognition of data and, consequently, to enhance efficiencies in the operation of Anti-Doping Activities.
These Guidelines provide a harmonized process for both the Hematological Module and the Steroidal Module of the ABP, following nearly identical administrative procedures in ADAMS.
As with all Guidelines, this document is subject to ongoing review and assessment to ensure it reflects best practice moving forward. WADA encourages feedback on this document and recommends stakeholders to consult WADA’s Web site for the latest version.
The principal objectives of integrating the ABP into the larger framework of a robust anti-doping program are the following:
1. The ABP can be used to identify Athletes requiring further attention through the intelligent, timely interpretation of Passport data. The ABP provides valuable information that can be used to direct Target Testing or investigations more effectively. The ABP can notably be used as a complement to analytical methods to refine further and strengthen overall anti-doping strategies:
i) For the Haematological Module, this could be, for example, Testing for Erythropoiesis-Stimulating Agents [6](ESAs) or homologous blood transfusion (HBT).
ii) For the Steroidal Module, this could be, for example, the use of Gas-Chromatography-Combustion-Isotope Ratio Mass Spectrometry (GCC-IRMS) to detect endogenous steroids administered exogenously.
2. A Passport may be used to pursue an Anti-Doping Rule Violation (ADRV) in accordance with the World Anti-Doping Code (Code) Article 2.2. Through changes in biological Markers of doping collated over an Athlete’s career, the ABP can be used to establish ‘Use’ per Code Article 2.2 without necessarily relying on the detection of a particular Prohibited Substance or Prohibited Method. This
8
approach has proven effective in establishing ADRVs without having to rely on traditional analytical techniques.
Therefore the incessantly growing knowledge in medicine, biochemistry, biotechnology and molecular biology has substantially expanded the options to manipulate sports efficiency. The constant evolution of doping strategies suggests that it is necessary to keep up. Indeed evidence-based, targeted, sport-specific and situation-specific strategies along with more effective analysis and improved efficiency and intelligence are approaches that represent the best deterrence of doping in sport [13]. These strategies, combined with education and commitment of all doping organizations (ADOs) to implement evidence-based programs, should help protect the integrity of sport and all those athletes who do not dope [14].
Thus, the fight against sport doping must be conceived also considering analytical strategies and methods to identify and characterize substances and doping practices that may still be “invisible” at the time of the doping test if targeted by “direct” methods. The “invisible” at the time of the doping test satisfies some or all the following conditions: the substance is still unknown, is identical to a substance that is produced by the organism, is no longer present – or present below the limit of detection of the analytical methods - in biological fluids, is masked by still unknown masking agents. In cases like these, the analytical strategy can be planned to target “markers of effect” rather than “markers of exposure” [15].
The implementation of the “indirect” antidoping strategies with metabolic markers supports the “direct” analysis of banned substances or their metabolites.
Today, the use of “markers of effect” together with “markers of exposure” is the successful analytical strategy because that it allows identifying the ‘fingerprint’ that doping leaves on the biology of the athlete; the ABP is used to identify that ‘fingerprint’, and thus once a biomarker of doping is implemented in the ABP, the potential to detect those changes brought on by performance-enhancing drugs is increased; it may prove possible to detect changes caused by substances that have not yet been identified [14].
The concept of “markers of effect” is the alterations due to the interaction between the body physiologic homeostasis and every active pharmacological substance. These modifications could also last when the etiologic factor disappears. Moreover, markers of effect are less affected by changes to the body due to the pharmacological agent.
9 1.1 Aims and scope of the project
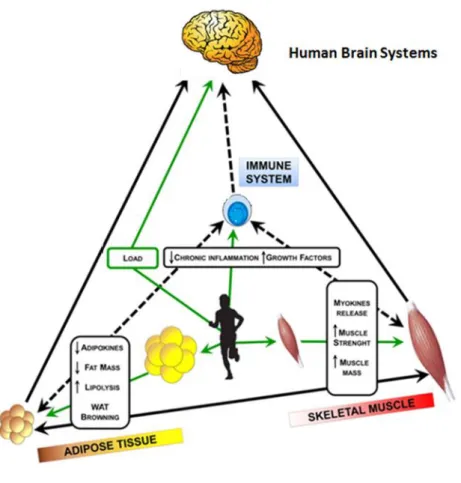
The knowledge and analysis of the main aspects of the crosstalk between skeletal muscle, adipose tissue, and central nervous system, plays a key role in the study of biochemistry and physiology of physical activity. This preliminary study aims to identify novel potential biomarkers related to energy metabolism, to evaluate their possible diagnostic value if considered for anti-doping purposes, and to identify critical factors in exercise prescription to develop improved training programs.
The experimental investigation was carried out on one hundred blood samples from male elite athletes, selected among those collected on the occasion of official anti-doping tests. The analytical approach included both untargeted and targeted methods, to build up the basis of our experimental design.
An extensive study about the many physiological pathways allowed us to pre-select a range of potential biomarkers, which are likely to play a key role in the main signaling pathways linked with mitochondrial biogenesis and glucose metabolism, lipolysis, anabolism, thermogenesis, and tissue inflammation. These elected cytokines were pre-selected for the targeted analysis, to evaluate their potential result versus different sport’s category or “in competition” phase or regular training phase. At the same time, we also focused our attention on the cellular energy metabolism networks, investigated by untargeted methods.
The results that have been achieved from these different analytical studies were evaluated and integrated into a wider metabolic network in order to better understand the interactions of different pathways, which play a significant role in athletic activity and energy management.
If our preliminary results, in terms of the panel of cytokines pre-selected in this study, will be confirmed on a broader population of athletes, and if proved to be sufficiently stable over time, they could be of utility to support the identification of an enough selective panel of biomarkers to be monitored longitudinally, also to verify whether the recourse to doping substances and methods can be detected by monitoring any significant variation from the normality values. Finally, the physiological evidence achieved could be useful also to monitor the well-being of the athlete.
10
Figure 1.2 Crosstalk between skeletal muscle, adipose tissue and
11
2. Overview on the main energetic cellular pathways
Every cell can receive and process signals that originate from every part of the body to respond to changes in the surrounding environment. Individual cells often receive many signals simultaneously, and they must integrate the relevant information into a unified action plan. Moreover, they also send out messages to other cellular systems. Thus more cells, in the complex structure that is the organ, communicate together and across different part of the body. The cellular environment signals could have a different nature: mechanical and chemical.
The “Pacinian corpuscle”, for example, is a skin structure sensitive to mechanical kind of messages [16].
The “islets of Langerhans” are pancreas cellular structures responsive to different blood glucose concentrations. Glucose is a chemical signal, and its modification in blood concentration stimulates the secretion by the organism of other different hormones [17].
The crosstalk between the body’s organs represents the thickly and tricky web of the information’s metabolism.
The cell signaling needs a specific structure to detect and integrate different signals, a molecular switch that is the receptor. Receptors are generally transmembrane proteins that bind to signaling molecules outside the cell and subsequently transmit the signal through a sequence of molecular switches to internal signaling pathways [18].
It is well known that different receptors are specific for different ligands. Membrane receptors fall into three major classes: G-protein-coupled receptors, ion channel receptors, and enzyme-linked receptors. These receptor classes' names refer to the mechanism by which the receptors transform external signals into internal information — via protein action, ion channel opening, or enzyme activation, respectively [19].
Because membrane receptors interact with both extracellular signals and molecules within the cell, they permit signaling molecules to affect cell function without physically entering the cell. This is important because most signaling molecules are either too big or too charged to move across the cell membrane. However, not all receptors are located on the external surface of the cell membrane. Some are present in the cytosol, or even in the nucleus. These receptors typically bind to molecules that can pass through the plasma membrane, such as gases, like nitrous oxide, and hormones, like steroid hormones.
12
These intracellular signaling pathways, a molecular circuit known as signal transduction cascade, typically amplify the message, producing multiple intracellular signals.
Activation of receptors can spark the synthesis of small molecules called second messengers, which initiate and coordinate intracellular signaling pathways.
Conventionally, sequences of consecutive biochemical reactions that transform a goven chemical into specific products are called pathways. In cell metabolism, there are several universal pathways that when interconnected form a complex metabolic network. Almost all metabolic processes need the enzyme's biocatalytic activity to occur at rates fast enough to sustain lifespan.
Cellular metabolism includes the complete set of chemical reactions at the cellular and subcellular level sustain the physiological processes: thousands of reactions interconnected through common metabolites, take place simultaneously in cells, trigger a network that is adequately controlled by the combined specific activities (enzymes, genes, etc.) to secure functions. This network takes part in the growth of cells, in the maintenance and construction of their structures, and in the response and adaptation of the cell to different environmental conditions or internal changes.
From a most general point of view, cellular metabolism is based on the dynamic equilibria of two main processes: catabolism and anabolism.
The first one includes all the reactions related to the degradation of nutrients and intermediate substrates to provide energy and basic building blocks coming from the rupture of chemical bonds of nutrients [20].
The anabolism comprises the processes that are related fundamentally to the synthesis of complex organic molecules.
The interactions between these processes are tight, indeed catabolism supplies anabolism with the necessary energy and basic compounds or elements to synthesize new molecules. Metabolic pathways are not isolated entities and, instead, they constantly interact with each other. The metabolism strategy produces the universal energy currency as adenosine triphosphate (ATP), reducing power and precursor for biosynthesis [20].
The building blocks of ATP are carbon, nitrogen, hydrogen, oxygen, and phosphorus. The high-energy bonds in ATP are readily enzymatically hydrolyzed in reactions to release a large amount of energy used by the cell in several metabolic processes and the synthesis of macromolecules such as proteins [21].
Indeed the ATP coupling allows reactions that require energy to occur by using the energy released in the change from ATP to ADP (adenosine diphosphate) to power the rest of the reaction.
13
Therefore, processes like the non-spontaneous transport across the membrane take advantage of the free energy coming from a proton gradient or ATP hydrolysis.
The catabolism of carbohydrates is a process defined as glycolysis. It takes place in the cytosol, and its main fuel is glucose [22]. Glycolysis contains enzyme-catalyzed chemical reactions that transform glucose into pyruvate. In its more common form, this process generates the necessary free energy in order to form two molecules of ATP along with NADH (Nicotinamide adenine dinucleotide). NAD is a “helper molecule” that assists in biochemical transformations, central to metabolism, as a cofactor.
NAD is called a dinucleotide because it consists of two nucleotides joined through their phosphate groups. NAD exists in two forms: an oxidized and reduced form: NAD+ and NADH respectively [23].
Glycolysis is structured along two phases, the first one is where energy must be invested, which costs two ATP molecules but generates important intermediate compounds.
On the contrary, the second phase produces energy, since four ATP molecules are generated, along with two pyruvate molecules and two NADH molecules. Wherefore glycolysis realizes an important position not only to obtain energy but to generate important biosynthetic precursors. It is important to underline that the inverse process, which generates glucose from pyruvate, is defined as gluconeogenesis and corresponds to anabolism.
Pyruvate obtained from glycolysis can be metabolized in two different ways. The first way corresponds to anaerobic processes, when no oxygen is available. This is called fermentation and consists of reducing pyruvate into several components like ethanol, lactate or acetate by oxidizing NADH into NAD+. Fermentation generates two ATP molecules [24].
On the contrary, in case that oxygen is present, pyruvate's main fate is to become acetyl-CoA, a chemically activated compound formed by a cofactor, called coenzyme A, and an acetyl group. Acetyl-CoA enters the citric acid cycle, a route that takes simple carbon compounds and transforms them into carbon dioxide in order to obtain energy [24].
The citric acid cycle accepts acetyl-CoA from glycolysis and other routes like lipid or protein metabolism, which emphasizes the importance and centrality of this pathway [25].
14
The anabolic and catabolism processes take place always on different sub cellular localization so biosynthetic and degradative pathways are ever possible, in this way the control of the metabolic network is successful. Indeed, the citric acid cycle occurs in the mitochondria matrix, whereas glycolysis takes place in the cytosol.
The citric acid cycle generates CO2, guanosine-5_-triphosphate (GTP), NADH, and flavin
adenine dinucleotide in hydroquinone form (FADH2). GTP is transformed directly into ATP.
NADH and FADH2 are two reduced species that, by being oxidized, also generate ATP. This
oxidation happens at the level of oxidative phosphorylation [26].
Organisms take advantage of the electron respiratory chain processes defined as oxidative phosphorylation to oxidize the reduced species coming from the citric acid cycle to generate energy. Oxidative phosphorylation takes place inside Mitochondria.
To synthesize the product that gets with these metabolic processes: by fermentation the organisms are can generate 2 ATP molecules compared to 38 obtained by coupling glycolysis to the citric acid cycle and oxidative phosphorylation. However, it is possible to regain to get ATP, whenever oxygen is present [26].
Other important pathways in cell metabolism comprise the degradation of fatty acids inside mitochondria, a process called β-oxidation, which is another source of acetyl-CoA apart from glycolysis.
Another source of acetyl-CoA comes from the degradation of amino acids, which can be synthesized by transamination.
Basically, transamination transforms α-ketoacids coming from the Citric Acid Cycle to generate amino acids, which emphasizing the centrality of the Citric Acid Cycle [25].
There are two main routes for the synthesis of purines and pyrimidines, the building blocks of nucleic acids or coenzymes like NAD+: the “de novo”, which refers to the synthesis from simple molecules, and the “salvage pathways”, where purines and pyrimidines are recycled from intermediates coming from the routes that degrade nucleotides. The “de novo” way of nucleotide synthesis has a high energetic requirement as compared to the “salvage pathway”. The enzymes that synthesize purines and pyrimidines perform basic, cellular activities and it is thought that are present in low, constitutive levels in all cells.
15
The cellular environment is constantly changing. Organisms themselves modify their own surroundings by consuming nutrients and expelling waste. Therefore, every process must be regulated in order to avoid large cellular imbalances state due to inside or external perturbations. Hence, organisms have developed different regulation strategies to maintain “homeostatic” states in which internal conditions remain stable. This condition requires that concentrations of internal metabolites are maintained steady in front of variations in metabolic fluxes. Furthermore, this state implicates the regulation of enzymes by increasing or decreasing their response to signals [25].
The control and regulation activity have been deeply differentiated. Metabolic control refers to the ability to change a metabolic state as a response to an external signal. In this manner, control can be assessed in terms of the intensity of the response to the external factor without knowing how the organism can achieve this state internally. This implies that control is simpler than regulation because no judgment about the system’s function is needed [27].
3 Physical exercise, cell energy metabolism and doping: selection of candidate biomarkers
Physical activity affects the homeostatic equilibrium of internal environments. Main body organs and tissue sense any internal variation and react to maintain a stable physiological condition.
The mechanisms by which exercise is tolerated and adapted to are intimately related to the hormonal regulation of specific physiological subsystems, but with both acute and chronic changes [28].
During exercise, the contracting muscles generate force or power and heat (which increase the entropy of their surroundings). The exercise intensity, exercise endurance, time and type of exercise causes modifications within the body systems [29].
The synergic physiological effect due to all sport’s activities causes a variety of events culminating in specific responses, such as an increase in muscle protein synthesis. Therefore, chronic exercise with training provokes a chain of modifications that culminate also with tissue remodeling. The main difference between sedentary, amatorial and elite athletes are based on how the organism is ready to react to exercise [28].
16
Modifications to tissue metabolism, as adipose tissue, cause a systemic effect on processes such as glucose and lipid homeostasis, body weight regulation, blood pressure, and immune function. Indeed adipose tissue, as well as skeletal muscle, are endocrine organs that secrete a large number of hormones and cytokines [29].
Energy management and metabolism, in general, are a prominent aspect not only in the sport field.
Thus, the main signaling pathways linked with mitochondrial biogenesis and glucose metabolism, lipolysis, muscle mass, thermogenesis, tissue inflammation in sport doping are the aim of cheating athletes to improve their performance using strategies that can modulate energy metabolism [30].
In this preliminary study, after an extensive analysis of the main energy networks, we have considered the activity of some cytokines selected due to their essential role in cellular metabolism [31, 32].Then we have evaluated the effects that each one cytokine cause on the cellular “microcosm” and integrated this knowledge with the “macrocosm” scheme of the organism.
3.1 Adiponectin
Animal experiments, at the end of the last century, revealed a plethora of activities associated with adiponectin, a protein hormone constituted by a polypeptide chain of 244 aminoacids, encoded by the AdipoQ gene mapped to chromosome locus 3q27 [33]. Produced and secreted predominantly by fat cells in adipose tissue, adiponectin exerts pleiotropic effects on numerous tissues, including the liver, kidney, pancreatic β-cells, blood vessels, brain, bone and immune cells, before its clearance in hepatocytes.
17
In the beginning, when researchers first described adiponectin’s functions and its relative receptors, AdipoR1 and AdipoR2, the idea was that the protein articulates its role on lipid homeostasis management. On the contrary, the adiponectin ensures its metabolic control from the lipid and glucose regulation management to the anti-inflammatory and anti-apoptotic functions.
At the level of fat cells, adiponectin is multimerized within the secretory pathways. Indeed, thanks to several post-translational modifications, the protein is secreted in multimeric forms. The different multimers interact in diverse affinity way with target cells. The adiponectin effect depends on the form of the protein, the type of receptor and the specific multimer bind that results.
The adiponectin’s roles are linked to the binding with AdipoRs [34]. The crystal structure of the human AdipoR reveals that the seven transmembrane-spanning domains of ADIPOR1 and ADIPOR2 form a cavity that directs three histidine residues to coordinate a zinc ion. However, the structure of these AdipoRs is distinct from that of G-protein-coupled receptors because the N terminus is cytoplasmic, and the C terminus is extracellular. Moreover, the anti-apoptotic and the insulin-sensitizing protein’s properties are due to revealed a ceramidase domain present within the receptors, thus confirming previous reports demonstrating potent ceramide-lowering effects associated with adiponectin action.
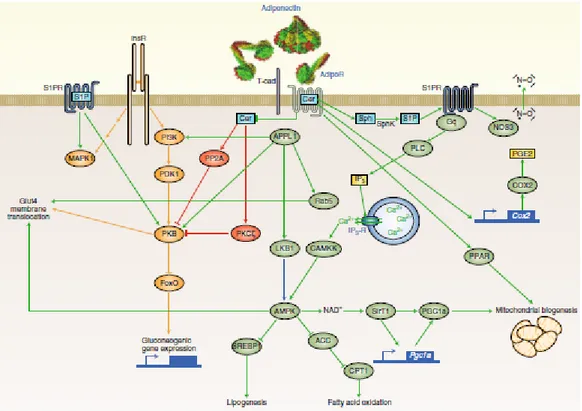
Figure 3.1 (modified from Leon G. Straub and Philipp E. Scherer. Metabolic Messengers: adiponectin. Nature Metabolism 2019) Crosstalk between skeletal muscle, adipose tissue and brain)
18
Furthermore, about the key sites of the adiponectin action, it is important to take into consideration T-cadherin that is another molecule with an affinity for adiponectin, and it may serve as a co-receptor.
T-cadherin itself is a cell-surface glycoprotein with a glycosylphosphatidylinositol anchor that lacks signaling capacity, because it contains neither a transmembrane nor a cytoplasmic signaling domain. The tissue distribution of T-cadherin overlaps widely with that of the AdipoRs. Interestingly, genetic deletion of T-cadherin leads to an accumulation of adiponectin in circulation, a phenomenon not observed for the individual AdipoR deletions [35].
To evaluate the main downstream signaling event to the AdipoRs it is necessary to consider Ca2+/calmodulin-dependent protein kinase and AMP-activated protein kinase (AMPK) cascades [36]. Other aspects of adiponectin’s anti-lipotoxic effects may be explained by enhanced fatty acid oxidation, which the receptors induce through enhanced activity of peroxisome proliferator-activated receptors α (PPARα) and peroxisome proliferator-activated receptor-gamma coactivator 1-alpha (PGC1α) [37, 38]. Adiponectin’s main suppressive effects on lipogenesis in the liver are mediated by AMPK by inhibition of sterol regulatory element-binding transcription factor 1 and acetyl-CoA carboxylase [39].
Figure 3.2 Adiponectin’s network. (modified from Leon G. Straub and Philipp E. Scherer. Metabolic Messengers:
19
Beyond AMPK signaling, prostaglandin-endoperoxide synthase 2 (PTGS2 or COX2) can be regulated by AdipoRs [35].
The AMP- activated protein kinase (AMPK) pathways cause the biggest variety of effects on the body, it is the central regulator of cell growth, autophagy and metabolism. AMPK is a sensor of intracellular adenosine nucleotide levels that is activated when even modest decreases in ATP production result in a relative increase in AMP or ADP due to a variety of physiological stress, as well as pharmacological inducers.
Thus, activated AMPK is able to phosphorylate a plethora of substrates that cause an acutely impact on metabolism and growth. Indeed AMPK is able to phosphorylate several transcriptional regulators that mediate long-term metabolic reprogramming.
The metabolic stress due to exercise produces the AMPK activation. AMPK activity depends on the intensity of exercise and is thought to be induced by changes in AMP/ATP and creatine/phosphocreatine ratios.
AMPK activation in response to exercise acutely inhibits ATP-consuming pathways and activates carbohydrate and fatty acid metabolism to restore ATP levels in muscle. It also plays a role in the adaptive response of muscle to endurance training by altering muscle fuel reserves and expression of exercise-responsive genes [40].
Then exercise is associated with activation of AMPK and for this reason, it is implicated with the increase in longevity. Indeed, adiponectin activates AMPK (via AdipoR1) in skeletal muscle, which in turn activates SirT1 (Sirtuin 1), implicated in longevity [41].
These are the main pathways where adiponectin takes part and exerts a crucial effect on its target cells and tissue [42]. Therefore, adiponectin plays an important role in the organism’s metabolic reprogramming and provides a possible strategy to enhance the beneficial effect of exercise [43].
3.2 Leptin
Leptin, from the Greek word ‘‘leptos,’’ meaning lean, is an adipocyte‐derived hormone that acts as a major regulator for food intake and energy homeostasis. Twenty years ago, Friedman and colleagues identified by positional cloning an obese (OB) gene responsible for obesity in the ob/ob mouse [44]. The OB gene encodes a 16‐kDa circulating hormone [45]. Leptin is secreted, in a pulsatile manner,
20
predominantly by white adipose tissue Leptin, with higher levels in the evening and early morning, and circulates in the plasma in both free and bound form). Leptin is also expressed in a plethora of tissues: placenta, stomach, mammary gland, and cells of the immune. Leptin’s secretion depends on several factors, cytokines and hormone as insulin and cortisol, circulating leptin conveys information to the hypothalamus regarding the amount of energy stored in adipose tissue as well as acute changes of energy intake, which in turn alter appetite and affect energy expenditure [46]. However, the ubiquitous distribution of leptin receptors (OBR) in almost all tissues underlines the pleiotropism of leptin [47].
Leptin’s receptors belong to the class I cytokine receptor superfamily.
The extracellular leptin‐binding domain of the leptin receptor possesses strong homolog to the gp130 signal‐transducing subunits present in receptors for IL-6 and Leukemia inhibitory factor (LIF). These receptors, just as the leptin receptor, couple to the Janus kinase (JAK)/signal transducer and activator of transcription (STAT) signal transduction pathway.
There are several Leptin’s receptors isoforms with differing biological activity, result from alternate gene splicing. All leptin receptors share an identical N‐terminal ligand-binding domain but differ in the C‐terminal region. The OBRa, OBRb, OBRc, and OBRd receptor isoforms contain a single transmembrane region, whereas the OBRe receptor is truncated proximal to the membrane‐spanning domain. This last receptor isoform without a membrane anchor functions as a soluble circulating leptin‐binding protein[48]. OBRb, also called the long isoform, is the predominant signaling form of the receptor and is strongly expressed in the hypothalamus, where it regulates energy homeostasis and neuroendocrine function.
Transport of leptin across the blood–brain barrier is a vital function of OBRa that could be important to the etiology of human obesity. The scientific literature suggests that the ratio of leptin in cerebrospinal fluid to plasma leptin is lower in obesity, probably because the leptin uptake is inefficient in obese subjects. Circulating leptin-binding protein is the soluble, extracellular domain of the leptin receptor (OBRe) and maybe an important regulator of leptin activity. Understanding the molecular mechanisms of leptin action, it is easier investigate energy homeostasis and metabolism [46].
Although the leptin gene and protein have been extensively studied, there are several aspects to elucidate above all about the plethora of pathways that leptin can trigger.
21
Indeed leptin is involved in main metabolic processes, it is necessary to introduce a brief overview of them to appreciate the pleiotropic leptin’s role.
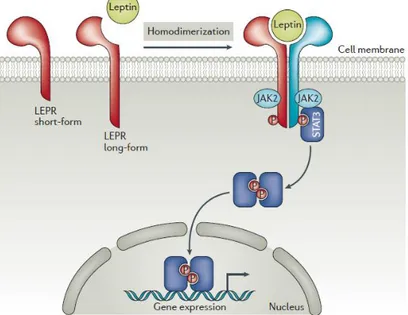
The JAK-STAT pathway is activated by leptin binding to OBRb, which results in autophosphorylation of Janus kinase 1 (JAK1) and JAK2, tyrosine phosphorylation of the cytoplasmic domain of OBRb, and phosphorylation and activation of STAT3 (signal transducer and activator of transcription). Tyrosine-phosphorylated STAT3 undergoes homodimerization and translocates to the nucleus where it induces the expression of genes. The melanocortin system might be the major JAK‐STAT central target of leptin action in appetite and energy expenditure regulation [45].
Leptin also modulates through JAK/STAT pathway the expression of genes important for thermogenesis, such as thyrotropin‐releasing hormone (TRH). TRH is essential for the pituitary production of thyroid‐stimulating hormone, as well as thyroid gland synthesis of thyroid hormone. The thyroid hormone is well recognized as a stimulator of energy expenditure through increased basal metabolic rate. Leptin has also been demonstrated to stimulate tyrosine phosphorylation of the RNA binding protein Sam68 and its association with STAT3. In this way, leptin signaling could modulate
Figure 3.3 : Schematic representation of leptin receptors and its signal transduction pathway.
22
RNA metabolism. This signal transduction pathway provides possible mechanisms for leptin modulation of the activation of peripheral blood mononuclear cells[49].
Leptin has been shown to activate the MAPK (mitogen-activated protein kinase) pathway in central and peripheral tissues in animal models and in ex vivo human tissues. MAPK pathways relay, amplify and integrate signals from a diverse range of stimuli and elicit an appropriate physiological response, including cellular proliferation, differentiation, development, inflammatory responses and apoptosis.
Indeed leptin, about the last two items above mentioned, can act on innate and adaptive immunity cells by the interaction with p38 MAPK, TNF (Tumor necrosis factor ) NF-kB (Nuclear Factor ) and modulate signal transduction by downstream targets [50].
Overall, Leptin, by the MAPK’s network, is involved in a series of processes that play a critical role in a wide range of stimuli.
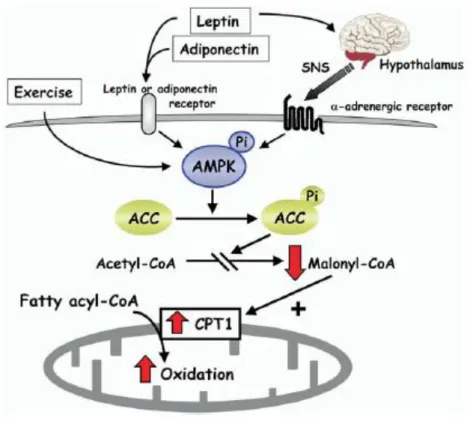
Figura 3.4: Model for the stimulatory effect of AMPK on fatty-acid oxidation in muscle.
Exercise and adipokines (leptin and adiponectin) result in activation of AMPK, which phosphorylates and inhibits acetyl CoA carboxylase (ACC) activity. This reduces malonyl CoA synthesis, activating carnitine palmitoyl transferase (CPT1) and thereby increasing mitochondrial import and oxidation of long-chain acyl- CoA fatty acids in muscle. Leptin activates AMPK in muscle through two distinct mechanisms: one is a direct effect through the leptin receptor in muscle and the other is mediated by the hypothalamic-sympathetic nervous system (SNS) through a adrenergic receptors in muscle.
23
Furthermore, animal studies suggest that leptin might have direct effects on peripheral tissues through activation of PI3K (phosphatidyl-inositol 3'-kinase). Moreover, PI3K activity represents a key target regulated by a broad spectrum of ligands, with insulin-requiring special mention. In fact, Leptin, in addition to IRS1 (Insulin receptor substrates) and IRS2, regulates AKT through OBRb, implying crosstalk between leptin and insulin signaling pathways [51].
Finally, also leptin, like adiponectin, activates the AMPK pathway.
Activation of leptin receptor by leptin activates JAK2 kinase, resulting in tyrosine phosphorylation of the receptor and downstream proteins, including STAT3, SHP-2 (SH2 (Src-like homology 2) domain-containing protein tyrosine phosphatase), IRS2, and PI3K, that play roles in regulating transcription of genes important for food intake and lipid metabolism. In the hypothalamus, leptin inactivates AMPK, increases ACC (acetyl CoA carboxylase) activity, and decreases food intake.
In skeletal muscle, leptin activates AMPK and decreases ACC, and CPT-1 (carnitine palmitoyl transferase) activity, in turn, increases mitochondria ‐oxidation. Another component of leptin’s metabolic activity is inhibition of hepatic SCD-1 (stearoyl-CoA desaturase-1 ) activity to regulate lipoprotein metabolism and energy expenditure [42].
Thus, leptin’s network acts both centrally and peripherally to regulate energy homeostasis [51].
Figure 3.5:The schematic diagram summarizes the numerous and diverse pathways in which leptin is involved. DGK, diacylglycerol kinase; PG, prostaglandin; PLC, phospholipase C; ROS, reactive oxygen species
24
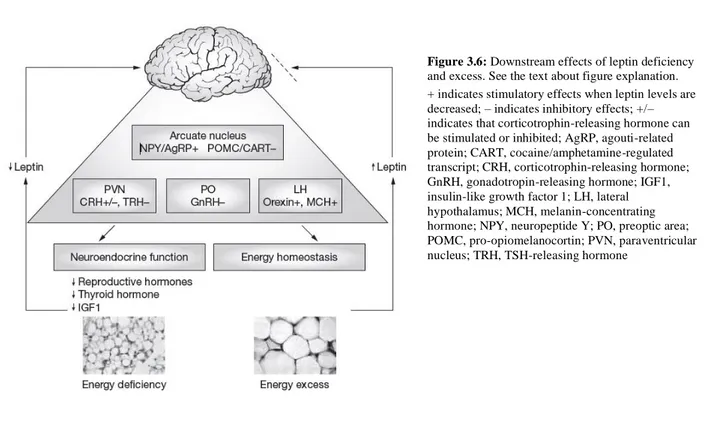
Finally, to underline the crucial leptin role below figure summarize the downstream effects of leptin deficiency and excess.
Indeed, states of energy excess are associated with increased leptin levels, but both neuroendocrine function and energy homeostasis are resistant (dashed line) to the effects of increased leptin. Energy deficiency results in falling leptin levels and reduced leptin receptor activation in the arcuate nucleus of the hypothalamus. This leads to the activation of a complicated neural circuitry comprising orexigenic and anorexigenic signals. The main anorexigenic peptides are pro-opiomelanocortin and cocaine/amphetamine-regulated transcript; these are stimulated by leptin [52]. The main orexigenic peptides downstream of leptin are neuropeptide Y and agouti-related protein; both potently stimulate food intake and reduce energy expenditure, thereby promoting weight gain in response to falling leptin levels. Other orexigenic peptides, such as melanin-concentrating hormone and orexins, are synthesized in the lateral hypothalamus and are indirectly inhibited by leptin. Neurons expressing these peptides project to the cerebral cortex and might be involved in the interaction between leptin and higher central nervous system functions. Leptin receptors are also localized in other hypothalamic nuclei, such as the paraventricular nucleus and preoptic area, where falling leptin levels are responsible for the neuroendocrine response to energy deprivation [46].
Figure 3.6:Downstream effects of leptin deficiency and excess. See the text about figure explanation. + indicates stimulatory effects when leptin levels are decreased; – indicates inhibitory effects; +/– indicates that corticotrophin-releasing hormone can be stimulated or inhibited; AgRP, agouti-related protein; CART, cocaine/amphetamine-regulated transcript; CRH, corticotrophin-releasing hormone; GnRH, gonadotropin-releasing hormone; IGF1, insulin-like growth factor 1; LH, lateral hypothalamus; MCH, melanin-concentrating hormone; NPY, neuropeptide Y; PO, preoptic area; POMC, pro-opiomelanocortin; PVN, paraventricular nucleus; TRH, TSH-releasing hormone
25 3.3 Irisin
On 2012 irisin was described first as a hormone that is secreted from the muscle cells of transgenic mice overexpressing Ppargc1a, which encodes the transcription cofactor peroxisome proliferator-activated receptor-γ co-activator 1α (PGC1α) that is involved in many pathways related to energy metabolism [53]. PGC1α stimulates the expression of fibronectin type III domain-containing protein 5 (FNDC5) and the synthesis of the transmembrane FNDC5 protein [54]. Transmembrane protein has been demonstrated to be cleaved and released as a novel hormone-like myokine irisin.
Around half a decade later, this myokine gained much attention due to its mechanism of action. Several studies attempted to characterize the role of FNDC5 and, consequently, the role of irisin. All the research achieved about underline the crucial activity of irisin around glucose homeostasis, lipid profile and metabolic parameters and thermogenesis during exercise, even though did not be miss controversies regarding the characterization and identification of irisin have arisen [55].
FNDC5 is highly expressed in skeletal muscle and in other organs that contain muscle, such as the heart, tongue and rectum, moreover it is interesting to note that the expression of FNDC5 in adipose tissue is 100–200 times lower than in skeletal muscle which suggests that adipose tissue is not the primary source of irisin. Circulating irisin is removed from the body mainly through the hepatobiliary system and the kidneys. The reported circulating levels of irisin seem to differ greatly even in the same species, then also due to these inconsistencies were raised doubts about the actual existence of irisin in humans [56].
Irisin, secreted into the bloodstream, has been shown to stimulate white adipose tissue (WAT) to adopt a brown adipose tissue-like phenotype through increasing cellular mitochondrial density and expression of uncoupling protein-1 (UCP-1) [57]. In-vivo studies suggest that the primary target organ of irisin is the skeleton rather than WAT.
Figure 3.7: Schematic representation of the FNDC5 protein structure (top) and irisin (bottom). SP, signal peptide; H, hydrophobic domain; C, C-terminal domain. Below is shown the human FNDC5 sequence with corresponding domains colored. Modified from Mark P. Jedrychowski et al. Detection and Quantitation of Circulating Human Irisin by Tandem Mass Spectrometry
26
FNDC5 dysregulation may lead to systemic metabolism imbalance and eventually result in the onset of metabolic disorders. Lecker and colleagues found that aerobic exercise induced PGC1 (peroxisome proliferator-activated receptor gamma coactivator 1-alpha) was significantly correlated with increased FNDC5 expression in skeletal muscle while low FNDC5 expression accompanied by reduced aerobic exercise performance existed in patients with heart failure [58].
The main irisin’s effects are summarized below.
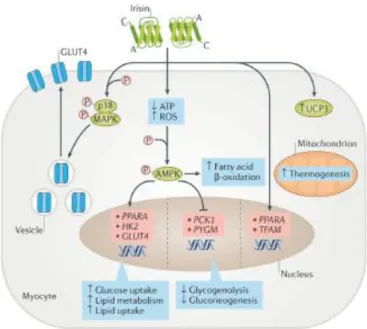
Irisin can activate the AMP-activated protein kinase (AMPK) pathway by reducing intracellular ATP levels, or by increasing reactive oxygen species (ROS) or intracellular calcium concentrations [59]. Activation of the AMPK pathway stimulates the expression of genes that are involved in glucose transport and lipid metabolism in myocytes such as glucose transporter type 4 (GLUT4), Hexokinases 2 (HK2) and peroxisome proliferator-activated receptor (PPARA), whereas the expression of genes that are involved in glycogenolysis such as glycogen phosphorylase muscle associated (PYGM) or gluconeogenesis PCK1(phosphoenolpyruvate carboxykinase) was suppressed [56]. The high expression of GLUT4 and HK2, combined with the increased translocation of GLUT4 protein from the cytoplasm to the membrane (mainly via the p38 mitogen-activated protein kinase (MAPK) pathway), induces glucose uptake by myocytes. Conversely, inhibition of PYGM and PCK1 expression reduces glycogenolysis and gluconeogenesis. In addition, the increased expression of
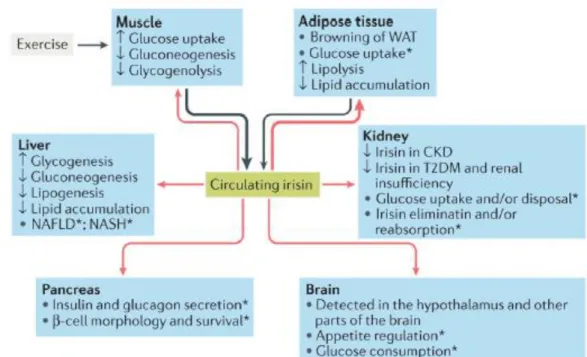
Figure 3.8: Irisin is primarily secreted by muscle during exercise and secondarily by adipose tissue (black arrows). Irisin reaches different organs via the blood (red arrows), leading to changes in their handling of glucose and lipid homeostasis..*Although present in pancreas, muscle and brain, the role of irisin in these organs, as well as in kidney and liver (especially in nonalcoholic fatty liver disease (NAFLD) and nonalcoholic steatohepatitis (NASH)), has yet to be adequately investigated. CKD, chronic kidney disease; T2DM, type 2 diabetes mellitus. N Perakakis et al. Physiology and role of irisin in glucose homeostasis. Nat Rev Endocrinol (2017)
27
PPARA stimulates lipid metabolism [60]. The irisin–AMPK pathway also increases fatty acid β-oxidation. Finally, irisin stimulates biogenesis in mitochondria by regulating the expression of PPARA and mitochondrial transcription factor A (TFAM) genes and of UCP3 (uncoupling protein-3) protein [59].
A relevant aspect to take into consideration is the potential influence of FNDC5 polymorphisms on metabolism. The above clinical data indicate that FNDC5 is crucial for the regulation of metabolic parameters and polymorphisms of FDC5 can be associated with health and disease. Although animal/cell models and in vivo/in vitro methods are often utilized to understand complicated molecular signaling networks connected to the physiological role of irisin in humans, much remains unknown regarding its function as a hormone and the regulation of FNDC5 synthesis and irisin secretion [55, 61].
3.4 Hypoxanthine and Xanthine
The main metabolic pathways related to all the activities needed for life are related to purine metabolism. Indeed adenine nucleotide metabolism results crucial during exercise and after to adenine nucleotide pool restoration AdN=ATP+ADP+AMP (adenine nucleotide pool=Σ adenosine-5'-triphosphate + adenosine 5'-diphosphate + adenosine 5'-monophosphate).
Figure 3.9: N Perakakis et al. Physiology and role of irisin in glucose homeostasis. Nat Rev Endocrinol (2017).
28
Inosine-5′-monophosphate (IMP), inosine (Ino), hypoxanthine (Hx), xanthine (X) and uric acid (UA), as known, are exercise-related products of AdN degradation that accumulate in skeletal muscle or efflux into the blood, decreasing the pool of AdN precursors. In the myokinase reaction, one phosphate moiety is transported between two ADP molecules. As a result, one ATP and one AMP molecule is formed. AMP is then deaminated by AMP deaminase to inosine monophosphate (IMP) and ammonia (NH3) that accumulate in the skeletal muscle. An alternative pathway of AMP degradation is dephosphorylation to adenosine and ortophosphatase by 5'-nuceotidase (5'-NT). However, this pathway is relatively weakly active in the skeletal muscle. IMP being accumulated in the muscle may be reaminated to AMP in the purine nucleotide cycle (PNC), restoring the AdN pool, or further be dephosphorylated to inosine (Ino) in a reaction catalysed by 5'-NT. However, the reamination is very limited during intense exercise and Ino is mainly degraded to hypoxanthine (Hx) in a reaction mediated by purine nucleotide phosphorylase (PNP).
In the skeletal muscle, Hx is degraded to xanthine (X) and uric acid (UA) in an irreversible reaction catalyzed by xanthine dehydrogenase (XDH).
Figure 3.10: Schematic representation of atoms that take part in the purine ring formation. Main structures and principal pathways connected to these structures. Modified from Jeremy M. Berg, John L. Tymoczko e Lubert Stryer. Biochemistry. 2004.
29
In resting conditions, 80-90% of this enzyme occur as dehydrogenase but under metabolic stress the dehydrogenase form is transformed into oxidase form. Regardless of the form, XDH catalyzes the degradation of Hx to X and then to UA. Moreover, both forms play an important role in the formation of free radicals that can cause tissue damage by triggering specific chemical reactions. The transformation of dehydrogenase into oxidase is mediated by nicotinamide adenine dinucleotide (NAD), an electron acceptor, resulting in the formation of superoxide radicals.
XDH is present in the endothelium of most human tissues including liver, intestine, heart, lungs and skeletal muscles but its activity differs between tissues.
The highest activity was shown in endothelial liver cells, which suggests that liver substantially contributes to Hx degradation to UA. Plasma purine metabolites (Ino, Hx and UA) are excreted via kidneys or, in the case of UA, via gut [62].
The main part of skeletal muscle ATP is restored by IMP reamination in the PNC cycle. However, the latter process is energy-consuming [63].
The intramuscular resources of IMP may be, in turn, resynthesized via the salvage pathway [64]. Hx is the only compound that can be reconverted by the enzyme hypoxanthine-guanine phosphoribosyl transferase (HGPRT) and reutilized in the AdN pool. Ino and Hx, which are moved out of the skeletal muscle, represent the loss of and precursors. In the latter case, the full restoration of resting ATP levels depends on a relatively slow and energy-consuming de novo pathway that needs six high-energy phosphate bonds.
IMP is the final product of both salvage and de novo pathways. The salvage pathway, involving purine bases, allows the avoidance of the energy-consuming de novo synthesis of nucleotides and limits purine loss from skeletal muscle by IMP reconstitution from Hx. The latter reaction combines Hx with 5-phosphoribosyl-1-pyrophosphate (PRPP) to form IMP and is catalyzed by HGPRT. After exercise, the accumulated muscle IMP is dephosphorylated in an irreversible reaction catalyzed by 5'-NT. Ino, in turn, may degrade to Hx in the reaction catalyzed by PNP. Some studies evaluate the adenosine triphosphate (ATP) degradation and restoring to understand exercise body response and eventual muscle adaptation in different human training status [65].
Indeed, in young individual purine metabolism was strongly related to training status and performance and indicated as a key adaptation, enabling a more economical distribution of energy sources for ATP re-synthesis during and after exercise [66]. Research on changes in purine metabolism during short-term (6‒7-week) sprint training showed a reduction in muscle AdN pool loss, a decrease in resting and post-exercise plasma Hx concentration and an increase in muscle HGPRT activity, suggesting that the reduction in exercise-induced AdN loss was one of muscle adaptations [31]. Moreover, the release of Ino and Hx from the muscle at rests is small and increases
30
after intense exercise . Hx accumulates in the muscle not only after high-intensity exercise but also during long-lasting endurance exercise until exhaustion. Intramuscular Hx accumulation is not observed after intense short-time exercise The release of Ino and Hx from the muscle at rest is small and increases after intense exercise. Hx accumulates in the muscle not only after high-intensity exercise but also during long-lasting endurance exercise until exhaustion. Then, Hx was proposed as an exercise intensity indicator and a criterion for exercise classification. Hx was also identified as a marker of metabolic stress during exercise and a marker of muscle AdN degradation [67].
Zielinski, J et al. explained clearly main metabolic pathways of adenine nucleotide degradation during exercise and recovery period (figure below).
Indeed, in the skeletal muscle, blood, and liver, Hx is degraded further to xanthine and uric acid in an irreversible reaction catalyzed by xanthine dehydrogenase, how just described above, and the exercise-related plasma Hx concentration is first due to muscle production increase with exercise intensity, then to muscle Hx reconversion to IMP by muscle HGPRT activity and in addition, it depends on the plasma Hx reconversion to IMP by erythrocyte HGPRT. Finally, Hx concentration is
Figure 3.11: Main metabolic pathways of adenine nucleotide degradation duringexercise. Intramuscular IMP can be resynthesized from Hx by salvage using muscle HGPRT (big dashed box) or by the energy-consuming de novo synthesis from purine bases (small dashed box). We studied the blood levels of purine bases that efflux the muscle (big gray box), especially plasma Hx, reflecting the loss of muscle adenine nucleotides during exercise. Erythrocyte HGPRT activity (small gray box) also is exercise and training dependent; how ever, mechanisms are not known yet. ADP, adenosine-5¶-diphosphate; AMP, adenosine-5¶-monophosphate; AMP-s, AMP synthase; ATP, adenosine-5¶-triphosphate; HGPRT, Hxguanine phosphoribosyltransferase; Hx, hypoxanthine; IMP, inosine-5¶-monophosphate; Ino, inosine; NH3, ammonia; PNC, purine nucleotide cycle; PRPP, phosphoribosyl pyrophosphate; UA, uric acid; X, xanthine.
31
affected by Hx uptake by the liver, and by excretion with urine [68].
Moreover, it is interesting to note not only that the purine metabolism is affected by the effects of training loads but also that it is the manifestation of the athlete’s age and performance level. Indeed, some research about demonstrates that incorporation of high-intensity (anaerobic) exercise in long-term endurance training causes significant changes in purine metabolism, whereas a low-intensity (aerobic) training does not. Therefore, it is possible to highlight the different energy management of athletes' which is function of training status.
Therefore, several studies suggest to consider purine's metabolism as sensitive markers of body training' and of adaptation' status as well as a criterion for healthiness control.
32
4 Material and Methods
All the analytical and data processing activities here described were carried out at the Antidoping Laboratory of Rome and at the NMR Laboratory of Prof D. O. Cicero, of the Department of Chemical Sciences and Technologies of the "Tor Vergata" University of Rome.
4.1 Blood samples
Blood samples of 105 male elite athletes in the age range aged 17-66 years were selected for the study and all have given the authorization to use blood for research.
The serum samples were collected in the framework of official anti-doping test from athletes of different sports/sport disciplines. Samples were collected either in competition or out of competition (see Table A).
33
Venous blood samples were taken from an antecubital vein at rest and collected in blood tubes that allow the separation of serum, thanks to a separating gel that, after centrifugation, occupies the middle position between the cells (clot) and the serum, as its density is intermediate between theirs.
The sample preparation sequence for the further analysis used in this work and routinely applied in our laboratory is here briefly described. Blood tubes were centrifuged at 1400 g, 10 min, 4 °C, then the serum samples are collected, anonymized and stored at -20° C until the analysis.
Samples collected have been analyzed by the anti-doping Laboratory to screen for the presence of: human growth hormone, both recombinant [(GH) REC], and pituitary [(GH) PIT], used to detect the intake of recombinant growth hormone by the so called “isoform method”; P-III-P (Type III collagen)], and IGF1 (Insulin-like Growth Factor), used to detect doping by growth hormone and related substances by the so called “biomarker method”.
4.2 Immuno-enzymatic assays
Three proteins have been considered in this study: irisin, adiponectin and leptin. As outlined in the previous sections, they have been selected based on their characteristics since they play a role, at different stages, on the effects of intensive exercise, and they are implicated in oxidative stress and energy metabolism. Quantitative assays have been performed in the serum of male subjects by immunoanalytical procedures, which have been proved to be fit for purpose (i.e. sufficiently selective and sensitive) for the aim of this study.
In particular, Human Total Adiponectin, Immunoassay R&D Systems Quantikine® ELISA kit (Range: 0-250 ng/mL), is designed to measure total (low, middle, and high molecular weight) human Adiponectin in cell culture supernatant, serum, and plasma. It contains NS0-expressed recombinant human Adiponectin and has been shown to quantitate the recombinant factor accurately. Results obtained using natural human Adiponectin showed linear curves that were parallel to the standard curves obtained using the Quantikine® kit standards. These results indicate that this kit can be used to determine relative mass values for natural human Adiponectin. This assay employs the quantitative sandwich enzyme immunoassay technique. Serum samples were prepared and analyzed according to the instructions of the manufacturer.
Briefly, a monoclonal antibody specific for the human Adiponectin globular domain has been pre-coated onto a microplate. Standards and samples are diluted, if necessary, to a suitable concentration to match the best linear range of the kit and then are pipetted in duplicate into the wells and any
34
Adiponectin present is bound by the immobilized antibody. The 1X Reaction Buffer was used as a negative control. After washing away any unbound substances, an enzyme-linked monoclonal antibody specific for the human Adiponectin globular domain is added to the wells. Following a wash to remove any unbound antibody-enzyme reagent, a substrate solution is added to the wells and color develops in proportion to the amount of Adiponectin bound in the initial step. The color development is stopped and the intensity of the color is measured. The optical density (O.D.) are determined of each well within 30 minutes, using a microplate reader set to 450 nm. Construct a standard curve by plotting the mean absorbance for each standard on the y-axis against the concentration on the x-axis and draw a best fit curve through the points on a log/log graph. The data may be linearized by plotting the log of the human Adiponectin concentrations versus the log of the O.D. on a linear scale, and the best fit line can be determined by regression analysis. If the samples have been diluted, the concentration read from the standard curve must be multiplied by the dilution factor.
Human Leptin Immunoassay R&D Systems Quantikine® ELISA kit (Range: 0- 1000 pg/mL), is designed to measure soluble human Leptin in cell culture supernatants, serum, and plasma. It contains E. coli-expressed recombinant human Leptin and antibodies raised against the recombinant factor. This immunoassay has been shown to quantitate recombinant Leptin accurately. Results obtained measuring natural human Leptin showed dose-response curves parallel to the standard curves obtained using the Quantikine® kit standards. These results indicate that this kit can be used to determine relative mass values for natural human Leptin. This assay employs the quantitative sandwich enzyme immunoassay technique. Serum samples were prepared and analyzed according to the instructions of the manufacturer. A monoclonal antibody specific for human Leptin has been pre-coated onto a microplate. Standards and samples are diluted, if necessary, to a suitable concentration to match the best linear range of the kit, and then are pipetted in duplicate into the wells and any Leptin present is bound by the immobilized antibody. The 1X Reaction Buffer was used as a negative control. After washing away any unbound substances, an enzyme-linked monoclonal antibody specific for human Leptin is added to the wells. Following a wash to remove any unbound antibody-enzyme reagent, a substrate solution is added to the wells and color develops in proportion to the amount of Leptin bound in the initial step. The color development is stopped and the intensity of the color is measured. The optical density (O.D.) is determined of each well within 30 minutes, using a microplate reader set to 450 nm. Construct a standard curve by plotting the mean absorbance for each standard on the y-axis against the concentration on the x-axis and draw a best fit curve through the points on a log/log graph. The data may be linearized by plotting the log of the human Adiponectin concentrations versus the log of the O.D. on a linear scale, and the best fit line can be determined by
35
regression analysis. If the samples have been diluted, the concentration read from the standard curve must be multiplied by the dilution factor.
Irisin, Recombinant (Human, Mouse, Rat, Canine) immune assay was from Phoenix Pharmaceuticals Inc. (Range: 0-1000 ng/mL). This kit is designed to measure the concentration of a specific peptide and its related peptides based on the principle of a “competitive” enzyme immunoassay. The immunoplate in this kit is pre-coated with a secondary antibody, whose non-specific binding sites are blocked. The secondary antibody can bind to the Fc fragment of the primary antibody. This primary antibody’s Fab fragment will then be competitively bound by both the biotinylated peptide and the targeted peptide in either the standard peptide solution or the unknown sample diluted (if necessary). The 1X Reaction Buffer was used as a negative control. The biotinylated peptide interacts with streptavidin-horseradish peroxidase (SA-HRP) which catalyzes the substrate solution.
The optical density (O.D.) is determined of each well within 30 minutes, using a microplate reader set to 450 nm. The intensity of the resulting yellow color is directly proportional to the amount of biotinylated peptide-SA-HRP complex, but inversely proportional to the targeted peptide amount (in either the standard peptide solution or the unknown sample). This is due to competition between the biotinylated peptide and the target peptide for binding with the primary antibody. A standard curve can be established by plotting the measured O.D. as a function of the various known standard peptide concentrations. Unknown peptide concentration in samples can then be determined via extrapolation based on this standard curve. Serum samples were prepared and analyzed according to the instructions of the manufacturer.
Univariate and multivariate data analysis methods were applied to the complete data set of metabolite concentrations to investigate the general structure of the metabolomics data and how the different metabolic features are related to athletes' training status. Resultswere expressed in terms of mean and
36
standard deviation except different indicated. A paired Student’s t-test was performed to investigate the differences in metabolite concentration in serum samples between endurance versus power and competition versus normal training status. The p values lower than 0.05 were considered statistically significant.
4.3 LC-MS-MS Analysis
Two xanthines (hypoxanthine and xanthine) have been considered. The experimental procedure was structured as follows.
An aliquot of 10 µL of serum was diluted with 90 µL of internal standard solution (ISTD, deuterated ephedrine final concentration 1 µg/mL). All LC/MS–MS experiments were performed using UPLC ACQUITY which was interfaced to an Applied Biosystems API 5500 (Applera Europe B.V. Monza, MI, Italy). The chromatographic separation was carried out using a Supelco C18 column (15 cm, 2.1 mm, 5 µm) and 0.1% formic acid (eluent A) and Ultra-purified water (eluent A) and acetonitrile (eluent B), both containing 0.1% formic acid as mobile phases. The gradient program selected started at 5% B increased to 60% B in 6 min, after 4 min, to 100% in 4 min. The column was flushed for 2 min at 100% B and finally re-equilibrated at 5% B for 3 min. The flow rate was set to a constant flow rate of 0.25 mL/min. Detection was carried out using a triple quadrupole as the mass analyzer in positive electrospray ionization (ESI). The capillary and declustering voltages were 5000 and 60 V, respectively. The source temperature was set at 500 °C. Curtain gas, ion source gas 1 (auxiliary gas), and ion source gas 2 (nebulizer gas) pressures were set at 25, 35, and 40 psi, respectively. Multiple Reaction Monitoring (MRM) was used as acquisition modes. The collision energies (CE) were optimized for the maximum abundance of the selected ion transitions by infusion of the standard solution of the analytes under investigation at a concentration of 10 μg/mL.
Figures 4.2 report the mass spectra obtained using product ion scan as acquisition mode and a collision energy of 25 eV for xanthine and hypoxanthine. In Figures 4.2 were instead reported the fragmentation pathways of both xanthine and hypoxanthine, the characteristic ion fragments selected were: