Agronomy Research 17(1), 60–76, 2019 https://doi.org/10.15159/AR.19.011
Environmental and economic assessment of sustainability in
Mediterranean wheat production
G. Falcone1, T. Stillitano1, F. Montemurro2, A.I. De Luca1,*, G. Gulisano1 and
A. Strano1
1Department of Agriculture, Mediterranean University of Reggio Calabria, Feo di Vito, IT89100 Reggio Calabria, Italy
2Consiglio per la ricerca in agricoltura e l’analisi dell’economia agraria - Research Centre for Agriculture and Environment, Bari, Italy
*Correspondence: [email protected]
Abstract. This study proposes the application of the Life Cycle Assessment (LCA) and economic evaluations conducted on different cereal production systems in semi-arid environments. Two different crop management systems of durum wheat were analysed by distinguishing Continuous Cropping (CC) and Crop Rotation (CR) with vetch, that are conducted through two different levels of crop intensification (in terms of tillage and fertilization strategies): Conventional (Conv) and Conservative (Cons). The resulting four scenarios were examined using LCA methodology to assess the environmental impacts, and the Production Cost (PC) analysis to estimate the economic results. Overall, the findings of this research provide an opportunity to identify sustainable crops management strategies.
Key words: crop management systems, life cycle assessment (LCA), cost production analysis.
INTRODUCTION
Among crops for food use, cereals represent one of the most important groups in the world agricultural economy since they play a fundamental role both in human nutrition, with the production of starchy grains for the flours used in numerous food preparations, and in animal feed used as fodder.
In terms of harvested area, grain is the most cultivated cereal in the world mainly as soft wheat (Triticum aestivum L.) and durum wheat (Triticum turgidum ssp. durum). Today, wheat cultivation represents, overall, the first crops in terms of the arable surface in the world, accounting 220.11 million of hectares, and the third (after sugarcane and maize) in terms of production quantity, with 749.46 million tonnes (Faostat, 2016). Asia and Europe intercept around 77% of the worldwide production; in particular, India, China, Russian Federation, France, Ukraine, Pakistan, and Germany are in the first positions, by covering 50% of production. In Europe, the cultivation of wheat represents, overall, the most important agricultural production with 62.52 million hectares and 250.13 million tons (Faostat, 2016).
It is undoubted that, in coming decades, the request of land for food, fibre, and fuel will continue to increase rapidly. In this sense, the search for an equilibrium between
61
agricultural harvests to meet demand from a growing world population and minimizing environmental impacts represents an everlasting challenge in sustainable agricultural production.
Agricultural practices are responsible both to sustain and to degrade the environment (MEA, 2005); therefore, it is increasingly urgent to reaffirm the necessity to preserving soil, water, biodiversity and ecosystems and improving resilience to climate change in a long-term perspective. Starting from the American Agronomy Society’s definition of sustainable agriculture (Weil, 1990), in the last thirty years, this concept, while remaining substantially unchanged, it has enriched itself with contents on practical solutions for the achievement of its objectives (De Luca et al., 2015). According to several scholars, the need for eco-compatible crops management is increasingly growing, particularly in regards to agronomic practices, soil processing, and fertilisation strategies (Montemurro et al., 2008; Rabbinge & Bindraban, 2012; Bindraban et al., 2015).
Among all the sustainable practices, conservation agriculture (CA) is widely recognized to be able to cause positive outcomes on organic matter, soil proprieties, and to reduce environmental risks (Montemurro & Maiorana, 2015), and at the same time, to sustain yield and crop quality. CA considers the coexistence of three main elements related to minimize soil disturbance, maintenance of permanent soil covers, and crop rotations (Gonzalez-Sanchez et al., 2015). According to Montemurro (Montemurro et al., 2008; Montemurro & Maiorana, 2014), continuous cropping systems in some Mediterranean areas, like Southern Italy, are still widespread, especially for cereal production; for these contexts, or similar, the contribution of CA practices has been largely studied (Montemurro & Maiorana, 2015), but to the authors’ best knowledge, specific analysis to measure environmental impact indicators are few implemented. Therefore, just as the effects of the use of chemical inputs, loss of crop and livestock genetic diversity through the spread of monocultures have been studied with greater reliability, in the meantime it needs verify the real effects of sustainable practices applied for meeting agricultural productivity and environmental goals.
To this aim, the use of innovative methods for assessment of sustainability can represent a powerful tool to increase the knowledge about new paradigms of agricultural production processes (Sands & Podmore, 2000). Life Cycle Assessment (LCA) method (Rebitzer et al., 2004; Guinée et al., 2011; Falcone et al., 2017; 2018) allows to investigate the sustainability issues through a conceptual model, based on the deepening of all impacts that a product or a service generates during its whole life cycle, related to all sustainability components, from design to disposal of the used product. Based on a standardized framework, the LCA represents, then, the tool more appropriate to compare transparently in different methods to achieve the same product, in order to choose the most sustainable (Brankatschk & Finkbeiner, 2015). However, an assessment of sustainability cannot be distinct from the profitability evaluation, a factor that mainly affects decision making in business activity, in the absence of specific constraints.
Despite several studies exist on impacts of cereal crops evaluated by means of LCA, the specific issue on modeling crop rotations is very topical, as confirmed recently by Brankatschk (2019), who tries to give an answer to the numerous open questions related to this topic. To confirm this, carrying out a survey on the main web search engines of scientific literature (Scopus, ScienceDirect, Google Scholar, etc.), it emerges as few works exist and, therefore, that this issue needs to be further explored.
However, among the published article existing, Nemecek et al. (2007), performed one of the first case studies on LCA applied to crop rotations, with the aim to underline the environmental impacts linked to the introduction of grain legumes in the crop rotation systems. Later, results of applications carried out by Hayer et al. (2010), Kulshreshtha et al. (2013), Naudin et al. (2014) and Nemecek et al. (2015) suggested the intercropping of a legume crop in rotations in order to reduce environmental burdens, while Brankatschk & Finkbeiner (2014; 2015) and Goglio et al. (2018) have focused on methodological aspects related to the LCA modeling of crop rotations. In this context, the issue of environmental impacts of CA techniques has been treated as a problem in its own right and there is a very limited number of studies that have deepened it (Sparrevik et al., 2012); furthermore, none specific LCA analysis exists on crop rotation systems with conservative agricultural practices.
In particular, this study aimed to evaluate the environmental impacts of four wheat management systems with LCA methodology that by now is widespread, increasingly, in agro-food studies (Abeliotis et al., 2013; Cerutti et al., 2014; Notarnicola et. al, 2015). Furthermore, an economic appraisal was performed through a Production Cost (PC) analysis (Gresta et al., 2014; Bernardi et al., 2017; Stillitano et al., 2017a), in order to compare the results of the different crop scenarios in terms of profitability performances.
MATERIALS AND METHODS Experimental design
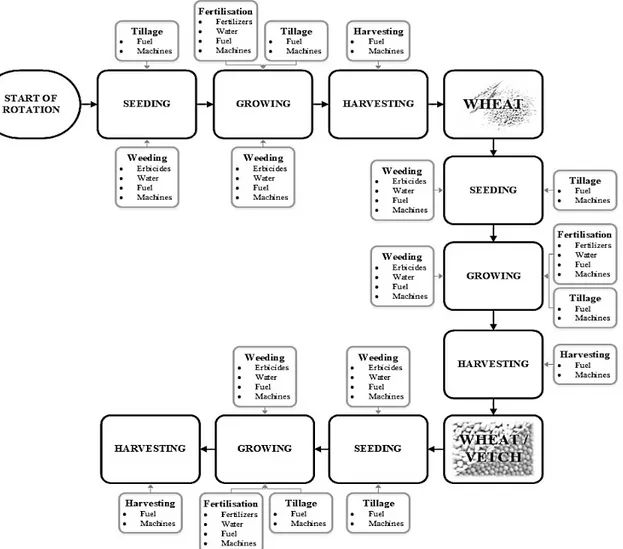
Data used in this research were obtained from a multidisciplinary three-year field experiment conducted in Foggia (Southern Italy) in collaboration with the Agricultural Research Council. Details of these experimental trials are available on Montemurro and Maiorana (2014). The experimental design involved four scenarios: the cultivation of durum wheat (W) – Triticum durum Desf. – grown in Continuous Cropping Conventional (CCConv) and Continuous Cropping Conservative (CCCons); and wheat in alternation with vetch (V) – Vicia sativa L. – conducted with Crop Rotation Conventional (CRConv) and Crop Rotation Conservative (CRCons) techniques. In particular, conventional management entailed soil tillage at 40–50 cm depth with mineral nitrogen fertilization, while conservative management required soil tillage at 15–20 cm depth with organic-mineral nitrogen fertilization.
For each scenario examined, quantitative data of the three-year of experimentation are related to hectare and are adapted to farm context in the Apulia region (South Italy). To assess the environmental and economic sustainability the typologies and quantities of inputs and outputs were directly observed (as primary data) for the establishment of a single inventory, useful for further elaborations. Inventory data were monetized considering the current market prices, to determine the economic results of different crop scenarios.
Environmental analysis
The environmental dimension of sustainability was analysed using the LCA methodology according to ISO norms (ISO, 2006a; 2006b), ‘an objective process to evaluate the environmental burdens associated to a product, a process, or an activity by identifying energy and materials usage and environmental releases, and to evaluate opportunities to achieve environmental improvements’ (SETAC, 1991). Four steps are
63
necessary to implement a rigorous LCA study (ISO, 2006a). Primarily, the phase of goal and scope definition should be carried out, including a clear statement on the specification of Functional Unit (FU) – i.e. the measurement unit to which all inputs and outputs data are related – as well as of system boundaries, data quality, limitations and procedures of allocation.
In this research, a system boundary from the ‘cradle to gate farm’ was chosen and in order to incorporate the interactions within the scenarios, all inputs and outputs of the three-years of experimentation were considered (Fig. 1).
In order to appraisal the environmental impacts of different soil management systems, the hectare of land was chosen as FU. This choice allows to evaluate the potential environmental impact in an area per time, but it would lead the decision-makers to undertake critical actions for the economic sustainability of the individual farms. In this sense, the use of a functional unit related to the mass, allows connecting directly the impacts generated from the cultivation processes to the product for which such impacts were generated. However, in the case of complex cultivation systems, like rotations, cannot be used this type of functional unit, because of the different yield per hectare of the crops which succeed.
Figure 1. Production systems analysed with the detail of input per unitary operation and growing phase.
The use of a ‘financial type’ functional unit could be a good choice, combining different aspects related both to produced mass and to the economic value of this; however, this choice is strongly influenced by the performances agricultural markets. Furthermore, the use of a financial functional unit may cause double accounting problems in the economic sustainability evaluation phase.
In terms of data quality, primary data on quality and quantities of inputs really used in the experimentations were considered for the environmental and economic assessment. Data were converted to productive scale multiplying quantity used in the experimental parcel for the quotient of ratio ‘hectare/experimental parcel surface’.
In particular, data on the foreground processes as seeds, fuels, fertilisers, herbicides and, water consumption were obtained directly from on-field trials and were collected during three years for each experimental hypothesis (Table 1). Referring to the load and fate of fertilisers due to their dispersion, the assessment of the emissions was carried out by using Brentrup et al. (2000) and Nemecek & Kägi (2007). To quantify the fuel combustion emissions, the suggestions by Nemecek & Kägi (2007) were followed, while for the emissions related to the dispersion and fate of the pesticides, the assumptions of Margni et al. (2002) were used. Data on background processes as the production phases of fuel, fertilisers and, pesticides were found in the Ecoinvent V.3.0 database, the most used Life Cycle Inventory dataset in the world. None allocation procedure were considered.
The compilation of Life Cycle Inventory (LCI) was performed by the collection of primary, secondary and tertiary data related to background and foreground processes. The calculation of incoming and outgoing flows (e.g. energy, materials, and emissions) was carried out in function of the FU chosen, as well as the validation of data quality. Three-year average data were used, considering a triangular distribution for primary data, in order to assess the uncertainty of Life Cycle Impact Assessment (LCIA) results.
The LCIA represents the third step and consists of quantifying potential environmental impacts, through the selection of impact categories and, for all of them, relevant indicators and characterization models.
The elaborations were performed using SimaPro 8.1 software and choosing as impact assessment method the ReCiPe midpoint (Pré, 2014), one of the method most appropriate for the evaluation of agricultural production processes thanks to the number of indicators closely related to cultivation processes. For example: Marine and Freshwater eutrophication and Terrestrial acidification, influenced by the use of fertilizers; Marine, Freshwater and Terrestrial Ecotoxicity as well as Human Toxicity, influenced by the dispersion of pesticides and herbicides; Agricultural and Urban land occupation as well as Natural land transformation, influenced by the type of crop cultivated. The impacts assessment phase only includes the results of characterisation.
The final phase is the interpretation of results that highlight the hotspots of life cycle analysed and it allows formulating suggestions to improve the production process. Uncertainty analysis was performed by applying the Monte Carlo sampling technique (Sonnemann et al., 2003). In particular, the analysis was carried out using SimaPro software, running 1,000 iterations (Niero et al., 2015). For secondary data, the distribution considered in the Ecoinvent database was held (Niero et al., 2014). LCIA and Interpretation phases will be discussed in the results section.
Economic analysis
In order to highlight the economic performance of the four production systems for durum wheat under study, the total production costs and revenues, referred to 1 ha of cultivated surface, were evaluated as in other studies (Pardo et al., 2009; Sartori et al., 2005; Sgroi et al., 2014; Vach et al., 2016). The economic analysis was conducted using data from the field trials concerning all inputs, machinery, and labour involved in agriculture operations, from pre-seeding to harvesting, and assuming the real wheat crop management performed widely by local farmers. For the latter purpose, the farm data have been collected through face-to-face interviews with farmers and privileged stakeholders of the durum wheat supply chain. Then, correction coefficients were calculated to convert the experimental data into real data. Input prices and all cost items refer to the year 2015.
The production cost analysis was carried out by dividing the total cost into its variable and fixed components. The first component depends on the activity undertaken, while the second one is linked with the farm structure (Peris Moll and Juliá Igual, 2006). In this study, variable costs included all inputs used in the production process such as seeds, fertilizers, pesticides, fuel and lubricants consumption of machinery ownership (specific costs), the rental cost of machinery for harvesting, labour cost needed during field operations and interests on advance capital.
Within the fixed costs, ownership costs of machinery and equipment, and land investments (i.e. depreciation, insurance, repairs, and maintenance), interests on capital goods, taxes, rent for land use and administration overheads were taken into account (Bernardi et al., 2017; Stillitano et al., 2017b; Strano et al., 2017; Stillitano et al., 2018). This analysis allowed to investigate those activities more affecting the production and profitability, in order to reduce production costs and improve profit margins, as suggested by Mohamad et al. (2013), Tudisca et al. (2013), Testa et al. (2014) and Iotti & Bonazzi (2015).
Specifically, regarding inputs cost, it was calculated taking into consideration each environmental input considered in LCA inventory and pricing them according to the current market. Rental cost of machinery for harvesting operation was evaluated considering current tariffs charged by firms hire. Labour cost was assessed in terms of opportunity cost and was equalised to the employment of casual workers for manual and mechanical operations by assuming local current hourly wage as the basis (Strano et al., 2015; Stillitano et al., 2016). Interests on advance capital and capital good were determined by applying an interest rate equal to 4.5% and 2%, respectively. To evaluate the rental cost for land use, the local rental prices were considered. Administration overheads were estimated as 5% of the Gross Production Value (GPV), which corresponds to the annual total revenues. In particular, total revenues (TR) for each production system took account of both the market value of the crop, obtained by multiplying the yield for its market price, and the EU Agricultural Policy subsidies. The average selling prices of durum wheat and common vetch were referred to 2017 crop year and provided by the Italian public institution for the monitoring of agricultural market (ISMEA, 2017). According to Pardo et al. (2009) and (2014), the main purpose of such analysis was to consent right understanding of the importance of each combined crop management system, i.e. in terms of cropping systems, soil tillage, and fertilization techniques, to final farm profitability. Therefore, to compare the profitability of the durum wheat production under the different crop management strategies investigated,
67
specific economic indicators were used, such as gross margin (GM) and net profit (NP) (Tatlidil et al., 2005; Banaeian et al., 2011; Nave et al., 2013; Tudisca et al., 2014). Gross margin was calculated by subtracting the variable costs to the total revenues (TR), while the net profit was determined as the difference between GPV and total production cost (Table 2).
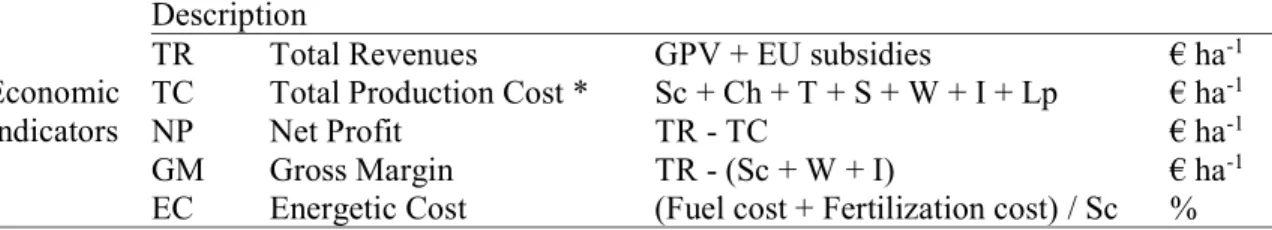
Table 2. Economic indicators used
Economic Indicators
Description
TR Total Revenues GPV + EU subsidies € ha-1
TC Total Production Cost * Sc + Ch + T + S + W + I + Lp € ha-1
NP Net Profit TR - TC € ha-1
GM Gross Margin TR - (Sc + W + I) € ha-1
EC Energetic Cost (Fuel cost + Fertilization cost) / Sc %
*Sc: Specific costs; Ch: Depreciation, maintenance, and insurance charges; T: Taxes; S: Salaries;
W: Wages; I: Interest; Lp: Land profit.
RESULTS AND DISCUSSION Life Cycle Assessment results
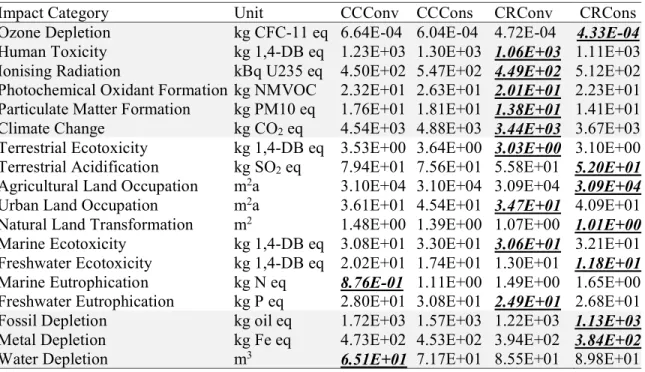
Results of impact characterization are described grouping the different impact categories according to the areas of protection where they have a negative impact, in a cause-and-effect perspective. In this sense, the connection between the impact category and the areas of protection was performed according to the ReCiPe Method (Goedkoop et al., 2013). The first six impact categories listed in Table 3, are related to Human Health protection area, except for Climate Change which has environmental effects also on the Ecosystems area. Comparing the four experimental scenarios, CRConv shows better performances in five out of six impact categories. In particular, expressing impacts on Human Toxicity in kg 1.4-Dichlorobenzene equivalent, the CRConv emits 1,061.20 kg, versus the worst scenario (CCCons) that emits 1,303.29 kg. The same ranking can be observed for Ionising Radiation, Photochemical oxidant formation, Particulate matter formation, and Climate Change, where the CRConv is on average better than CCCons about 23.7%. For this area of protection, Crop Rotation (CR) scenarios result generally better than Continuous Crop (CC) scenarios, excluding for Ionising Radiation where the second better scenario was CCConv. This result can be explained by a greater amount of fertilizers used in conservative scenarios. In particular, the higher impacts in human health area of protection can be attributable to fertilizers production (Fig. 2). The only impact category where CRCons represents the low pollutant scenarios was Ozone Depletion due to the higher impact in this category of nitrogen fertilizer.
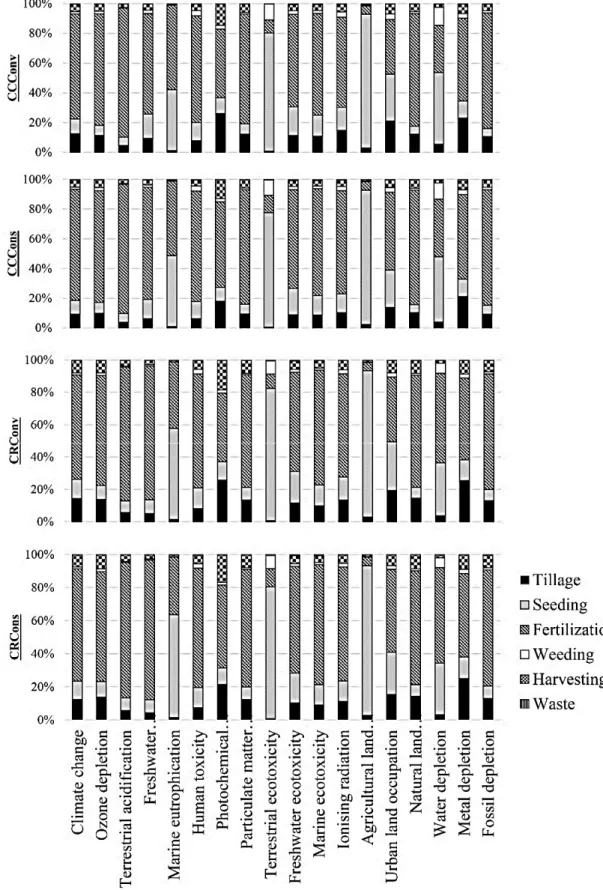
As already mentioned, Climate Change represents a bridge category in the ReCiPe method, because are attributed to it negative effects both on Human Health and on the Ecosystems areas (Table 3). In this category, the CRConv scenario gets the best performance, followed by the CRCons scenario, penalized by a large use of fertilizers. For the terrestrial ecotoxicity indicator as well, the best scenario was CRConv, but the highest percentage of impact can be attributed to seeding, which represents in each scenario about 80% (Fig. 2), in particular, due to the seed production. In relation to terrestrial acidification, the better scenario was CRCons, thanks to the lower emission of slow-release fertilisers used in conservative scenarios. For Agricultural Land Occupation
too, the CRCons gained the best performance, though the difference with CRConv scenario is not considerable. It is significant to underline that this impact category by herself does not represent a comprehensive indicator of land use, providing only the surface occupied during the life cycle. The same consideration should be applied to Urban Land Occupation and Natural Land Transformation. In the first case, the scenario CRConv have lower impacts because of the smaller quantity of fertilizers used, input which represents the highest contributor in this impact category due to the fertilizers production plant; for the second indicator the best performance of CRCons scenario can be attributed to tillage operations, as already seen for Agricultural Land Occupation. The different tillage techniques in terms of land transformation and/or land occupation derive from different quantities of inputs utilized, and not from different types of land use. A comprehensive land use assessment must consider a broader set of specific indicators (e.g., soil erosion, biotic production, etc.).
Table 3. Life Cycle Impact Assessment through ReCiPe Midpoint method
Impact Category Unit CCConv CCCons CRConv CRCons
Ozone Depletion kg CFC-11 eq 6.64E-04 6.04E-04 4.72E-04 4.33E-04
Human Toxicity kg 1,4-DB eq 1.23E+03 1.30E+03 1.06E+03 1.11E+03
Ionising Radiation kBq U235 eq 4.50E+02 5.47E+02 4.49E+02 5.12E+02
Photochemical Oxidant Formation kg NMVOC 2.32E+01 2.63E+01 2.01E+01 2.23E+01
Particulate Matter Formation kg PM10 eq 1.76E+01 1.81E+01 1.38E+01 1.41E+01
Climate Change kg CO2eq 4.54E+03 4.88E+03 3.44E+03 3.67E+03
Terrestrial Ecotoxicity kg 1,4-DB eq 3.53E+00 3.64E+00 3.03E+00 3.10E+00
Terrestrial Acidification kg SO2eq 7.94E+01 7.56E+01 5.58E+01 5.20E+01
Agricultural Land Occupation m2a 3.10E+04 3.10E+04 3.09E+04 3.09E+04
Urban Land Occupation m2a 3.61E+01 4.54E+01 3.47E+01 4.09E+01
Natural Land Transformation m2 1.48E+00 1.39E+00 1.07E+00 1.01E+00
Marine Ecotoxicity kg 1,4-DB eq 3.08E+01 3.30E+01 3.06E+01 3.21E+01
Freshwater Ecotoxicity kg 1,4-DB eq 2.02E+01 1.74E+01 1.30E+01 1.18E+01
Marine Eutrophication kg N eq 8.76E-01 1.11E+00 1.49E+00 1.65E+00
Freshwater Eutrophication kg P eq 2.80E+01 3.08E+01 2.49E+01 2.68E+01
Fossil Depletion kg oil eq 1.72E+03 1.57E+03 1.22E+03 1.13E+03
Metal Depletion kg Fe eq 4.73E+02 4.53E+02 3.94E+02 3.84E+02
Water Depletion m3 6.51E+01 7.17E+01 8.55E+01 8.98E+01
In relation to the categories of Marine Ecotoxicity and Freshwater Eutrophication, the best results are obtained by CRConv while, in Marine Eutrophication and Freshwater Ecotoxicity categories, the best results are obtained respectively by CCConv and CRCons scenarios. It should be noted that while for the Marine Ecotoxicity, Freshwater Ecotoxicity and Freshwater Eutrophication indicators the main hotspot is the fertilisation, for the Marine Eutrophication indicator, the impacts have to be attributed also to seeding, and in particular to fertilisers used for seed production.
The last three categories are related to resources depletion and are mainly interested by fertilisation, seeding and tillage operations. In relation to Fossil and Metal Depletion, the CRCons scenario has the better performance thanks to the lower impact in fertilisation and tillage operations, while for Water depletion CCConv gains the best performance thanks to lower impacts linked to the fertilisers production. In relation to Fossil and Metal
69
Depletion must be underlined the influence of machinery, diesel (Lovarelli & Bacenetti, 2017; Lovarelli et al., 2017) and urea production (Bacenetti et al., 2016) (Fig. 2).
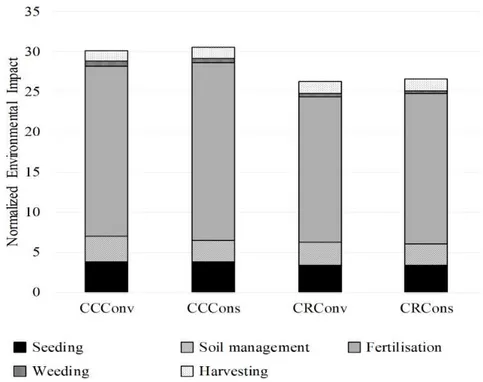
More in detail, by analysing LCA results, for all scenarios considered and for each agronomic operation (Figs 2 and 3), it is shown that the fertilisation, which account, on average, for 68.8% on each impact category, represents the crop operation most impactful for all environmental indicators, according to Schneider et al. (2010). This is not true for Agricultural Land Occupation, Marine Eutrophication and Terrestrial Ecotoxicity indicators. For the latter, the most impactful operation is represented by planting operation, in particular, by seed production that weights, on average, 87.9% on Agricultural Land Occupation, 63.5% on Marine Eutrophication and, 80% on Terrestrial Ecotoxicity.
Figure 3. LCA results for agronomic operation.
In cropping rotation scenarios, the introduction of vetch allows avoiding a large amount of environmental impact, approximately 36% less, due to the reduction of fertilizers, especially thanks to nitrogen fixation process, according to Nemecek et al. (2008) and Ryan et al (2008). However, although in absolute values, these scenarios have a diesel consumption lower than continuous crop ones, in percentage terms, fossil fuels represent the second most important impact factor (in respect to a decrease of fertilization influence on impacts), mainly due to the soil management and harvesting operations.
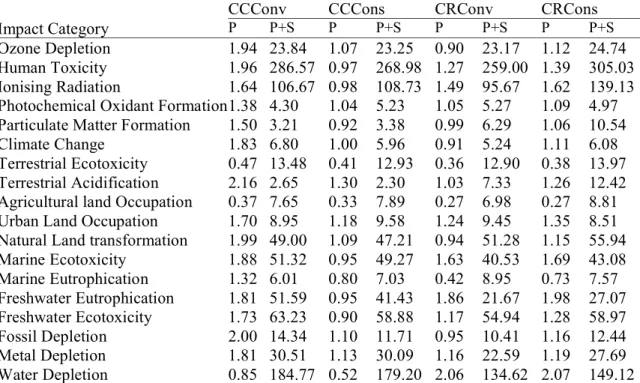
The uncertainty analysis performed through 1000-runs Monte Carlo simulation (Table 4) allowed analysing the toughness of results for each Impact Assessment Category, by considering the probability distribution of LCI parameters.
In particular, two different insights were carried out in order to assess the robustness of inventory. A preliminary a Monte Carlo analysis has been carried out for each scenario by considering only the distribution of primary data; a subsequently Monte Carlo analysis has been performed considering both primary and secondary data distribution.
71
Table 4. The coefficient of variation (%) of results depending on the distribution of primary (P) and secondary (P+S) data
CCConv CCCons CRConv CRCons
Impact Category P P+S P P+S P P+S P P+S
Ozone Depletion 1.94 23.84 1.07 23.25 0.90 23.17 1.12 24.74
Human Toxicity 1.96 286.57 0.97 268.98 1.27 259.00 1.39 305.03
Ionising Radiation 1.64 106.67 0.98 108.73 1.49 95.67 1.62 139.13
Photochemical Oxidant Formation1.38 4.30 1.04 5.23 1.05 5.27 1.09 4.97
Particulate Matter Formation 1.50 3.21 0.92 3.38 0.99 6.29 1.06 10.54
Climate Change 1.83 6.80 1.00 5.96 0.91 5.24 1.11 6.08
Terrestrial Ecotoxicity 0.47 13.48 0.41 12.93 0.36 12.90 0.38 13.97
Terrestrial Acidification 2.16 2.65 1.30 2.30 1.03 7.33 1.26 12.42
Agricultural land Occupation 0.37 7.65 0.33 7.89 0.27 6.98 0.27 8.81
Urban Land Occupation 1.70 8.95 1.18 9.58 1.24 9.45 1.35 8.51
Natural Land transformation 1.99 49.00 1.09 47.21 0.94 51.28 1.15 55.94
Marine Ecotoxicity 1.88 51.32 0.95 49.27 1.63 40.53 1.69 43.08 Marine Eutrophication 1.32 6.01 0.80 7.03 0.42 8.95 0.73 7.57 Freshwater Eutrophication 1.81 51.59 0.95 41.43 1.86 21.67 1.98 27.07 Freshwater Ecotoxicity 1.73 63.23 0.90 58.88 1.17 54.94 1.28 58.97 Fossil Depletion 2.00 14.34 1.10 11.71 0.95 10.41 1.16 12.44 Metal Depletion 1.81 30.51 1.13 30.09 1.16 22.59 1.19 27.69 Water Depletion 0.85 184.77 0.52 179.20 2.06 134.62 2.07 149.12
The uncertainty assessment considering only primary data underlined a good significance level of results with a coefficient of variation, on average, lower than 1.5%. Considering also the distribution of secondary data, the uncertainty of results for Ozone Depletion, Natural Land Transformation, Marine Ecotoxicity, Freshwater Eutrophication, Freshwater Ecotoxicity, and Metal Depletion categories was found to be appreciable. Instead, for Human Toxicity, Ionising Radiation and, Water Depletion categories, the uncertainty was found to be very high.
These results depend on the quality of some inventory data that possess, intrinsically, a high degree of uncertainty, being modeled on the average values of a given process.
Economic performances of different scenarios
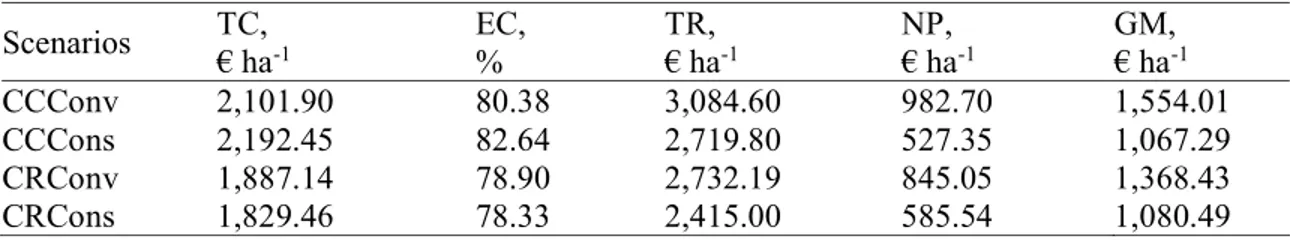
In Table 5, the results of economic indicators obtained from PC analysis are reported. The results show that the cropping rotation scenarios record the best performance in terms of both total production cost and energetic cost compared to the continuous cropping ones. In particular, CRCons scenario has the lowest TC and EC indicators with 1,829.46 € ha-1and 78.33%, respectively, followed by the CRConv with 1,887.14 € ha-1(+3.2%) and 79.90% (+0.7%). This is mostly caused by the lower cost related to the inputs employed in crop rotation, which accounts for around 49% to the total production cost for both scenarios with rotation. Within the input costs (or specific costs), the main contributors are the fertilization and fuel costs estimated at 48.42% and 29.91%, respectively, for the CRCons scenario, while these amount to 45.22% and 33.68% for the CRConv scenario. Likewise, Vach et al. (2016) found the highest fuel consumption in all crops cultivated under conventional tillage.
Table 5. Results of economic analysis Scenarios TC,€ ha-1 EC,% TR,€ ha-1 NP,€ ha-1 GM,€ ha-1 CCConv 2,101.90 80.38 3,084.60 982.70 1,554.01 CCCons 2,192.45 82.64 2,719.80 527.35 1,067.29 CRConv 1,887.14 78.90 2,732.19 845.05 1,368.43 CRCons 1,829.46 78.33 2,415.00 585.54 1,080.49
However, in terms of benefit indicators, the CCConv scenario achieves the best performance. In particular, it is observed for TR, NP and GM indicators the higher values equal to a three-year total amount of 3,084.60 € ha-1, 982.70 € ha-1and 1,270.18 € ha-1, respectively. This scenario is able to maximize the remuneration of entrepreneur. Therefore, it represents the most profitable crop management system. The high value of TR indicator can be explained, on one hand, by the higher wheat yield equal to 8,790.00 kg ha-1, on the other hand by the amount of European subsidies, e.g. 325 € ha-1 year-1for wheat against 181 € ha-1year-1for vetch in crop rotation. Conversely, in terms of TR, the CRCons scenario shows the worst performance with an amount equal to 2,415.00 € ha-1, mainly due to the lower total production yield equal to 7,090.00 kg ha-1 of which 5,410.00 kg ha-1 are wheat. However, it should be noted that, in CRCons scenario, an increase of grain yield equal to 2.6% is reached, likely due to the capability of leguminous crops to increase soil fertility.
This latter result endorses the findings by Montemurro & Maiorana (2015), who highlighted a possible improvement of wheat yield, mainly when in rotation with leguminous crops compared to the continuous cropping. Similarly, Calzarano et al. (2018) confirmed that under conservation agriculture higher yields are reached, also due to the improved nutrient availability achieved by including fava beans in the rotation.
For the remaining scenarios, the values of TR ranging from 2,732.19 € ha-1 (CRConv) to 2,719.80 € ha-1 (CCCons). The CCCons scenario reaches the worst performance in terms of NP and GM indicators estimated at 46.3% and 31.3% lower than the best scenario (CCConv).
CONCLUSIONS
In modern agricultural crop production, get to maintain farm income and reduce environmental impacts is a prerequisite for sustainable agriculture. To obtain useful recommendations for farmers in selecting crop management systems that combine environmental and economic benefits, key measurement methods are needed. In this work, LCA and production cost analysis were used in order to assess the environmental and economic performance of different cereal production methods. The environmental results highlighted that the crop rotation with conventional management (CRConv) obtain better performances in almost all impact categories. The economic finding showed that CRCons scenario reached the lowest total production costs, followed by CRConv, although in terms of benefit indicators the CCConv scenario achieves the best performance. An evaluation in the long period should highlight some benefits of conservation agriculture in environmental and economic terms. The growing interest towards the vegetable proteins could cause an increase of leguminous grain price encouraging crop rotations.
73
REFERENCES
Abeliotis, K., Detsis, V. & Pappia, C. 2013. Life cycle assessment of bean production in the Prespa National Park Greece. Journal of Cleaner Production 41, 89–96.
Bacenetti, J., Lovarelli, D. & Fiala, M. 2016. Mechanisation of organic fertiliser spreading, choice of fertiliser and crop residue management as solutions for maize environmental impact mitigation. European Journal of Agronomy 79, 107–118.
Banaeian, N., Omid, M. & Ahmadi, H. 2011. Energy and economic analysis of greenhouse strawberry production in Tehran province of Iran. Energy Conversion and Management 52(2), 1020–1025.
Bernardi, B., Tous, J., Benalia, S., Abenavoli, L.M., Zimbalatti, G., Stillitano, T. & De Luca, A.I. 2017. The assessment of hazelnut mechanical harvesting productivity. Agronomy Research 15(4), 1491–1497.
Bindraban, P.S., Dimkpa, C., Nagarajan, L., Roy, A. & Rabbinge, R. 2015. Revisiting fertilisers and fertilisation strategies for improved nutrient uptake by plants. Biology and Fertility of Soils 51(8), 897–911.
Brankatschk, G. & Finkbeiner, M. 2015. Modeling crop rotation in agricultural LCAs – Challenges and potential solutions. Agricultural Systems 138, 66–76.
Brankatschk, G. & Finkbeiner, M. 2014. From wheat to beet – challenges and potential solutions of modeling crop rotation systems in LCA. In: Schenck, R. & Huizenga, D., (eds) Proceedings of the 9th International Conference on Life Cycle Assessment in the Agri-Food Sector. 8-10 October 2014 - San Francisco.
Brankatschk, G. 2019. Modeling Crop Rotations and Co-Products in Agricultural Life Cycle Assessments. Springer Vieweg, Wiesbaden, Germany.
Brentrup, F., Küsters, J., Lammel, J. & Kuhlmann, H. 2000. Methods to estimate on-field nitrogen emission from crop production as an input to LCA studies in the agricultural sector. International Journal of Life Cycle Assessment 5(6), 349–357.
Calzarano, F., Stagnari, F., D’egidio, S., Pagnani, G., Galieni, A., Di Marco, S., Metruccio, E.G. & Pisante, M. 2018. Durum wheat quality, yield and sanitary status under conservation agriculture. Agriculture (Switzerland) 8(9), art. no. 140.
Cerutti, A.K., Beccaro, G.L., Bruun, S., Bosco, S., Donno, D., Notarnicola, B. & Bounous, G. 2014. Life cycle assessment application in the fruit sector: State of the art and recommendations for environmental declarations of fruit products. Journal of Cleaner Production 73, 125–135.
De Luca, A.I., Molari, G., Seddaiu, G., Toscano, A., Bombino, G., Ledda, L., Milani, M., Vittuari, M. 2015. Multidisciplinary and innovative methodologies for sustainable management in agricultural systems. Environmental Engineering and Management Journal 14(7), 1571–1581.
Falcone, G., De Luca, A.I., Stillitano, T., Iofrida, N., Strano, A., Piscopo, A., Branca, M.L. & Gulisano, G. 2017. Shelf life extension to reduce food losses: The case of Mozzarella Cheese. Chemical Engineering Transactions 57, 1849–1854.
Falcone, G., Lovarelli, D. & Bacenetti, J. 2018. Electricity generation from anaerobic digestion in Italy: Environmental consequences related to the changing of economic subsidies. Chemical Engineering Transactions 67, 475–480.
Faostat. 2016. Crop production. http://faostat3.fao.org/download/Q/QC/E (accessed 30/10/2018) Goedkoop, M., Heijungs, R., Huijbregts, M.A.J., De Schryver, A., Struijs, J. & Van Zelm, R.
2013. ReCiPe 2008. A life cycle impact assessment method which comprises harmonised category indicators at the midpoint and the endpoint level. First edition (Version 1.08) – Report I: Characterisation. RIVM report
Goglio, P., Brankatschk, G., Knudsen, M.T., Williams, A.G. & Nemecek, T., 2018. Addressing crop interactions within cropping systems in LCA. International Journal of Life Cycle Assessment 23, 1735–1743.
Gonzalez-Sanchez, E.J., Veroz-Gonzalez, O., Blanco-Roldan, G.L., Marquez-Garcia, F., Carbonell-Bojollo, R. 2015. A renewed view of conservation agriculture and its evolution over the last decade in Spain. Soil Till. Res. 146, 204–212.
Gresta, F., De Luca, A.I., Strano, A., Falcone, G., Santonoceto, C., Anastasi, U. & Gulisano, G. 2014. Economic and environmental sustainability analysis of guar (Cyamopsis tetragonoloba L) farming process in a Mediterranean area: two case studies. Italian Journal of Agronomy 9, 20–24.
Guinée, J.B., Heijungs, R., Huppes, G., Zamagni, A., Masoni, P., Buonamici, R., Ekvall, T. & Rydberg, T. 2011. Life Cycle Assessment: Past, Present, and Future. Environmental Science Technology 45, 90–96.
Hayer, F., Bonnin, E., Carrouée, B., Gaillard, G., Nemecek, T., Schneider, A. & Vivier, C. 2013. Designing sustainable crop rotations using Life Cycle Assessment of crop combinations. In: Darnhofer, I. & Grötzer, M., (eds) Proceedings of the 9th European IFSA Symposium. Universität für Bodenkultur, Vienna, 903–911.
International Organization for Standardization (ISO) 2006a ISO Norm 14040:2006 Environmental management – Life Cycle Assessment – Principles and framework. Geneva CH.
International Organization for Standardization (ISO) 2006b ISO Norm 14044:2006 Environmental management – Life Cycle Assessment – Requirements and guidelines. Geneva CH.
Iotti, M. & Bonazzi, G. 2015. Profitability and Financial Sustainability Analysis in Italian Aquaculture Firms by Application of Economic and Financial Margins. Am. J. Agric. Biol. Sci. 10(1), 18–34.
ISMEA. 2017. http://www.ismeamercati.it/flex/cm/pages/ServeBLOB.php/L/IT/IDPagina/8082 (accessed 30/08/2017)
Kulshreshtha, S., MacWilliam, S. & Wismer, M. 2013. Economic and environmental assessment of pulse rotations in canadian prairies. 19thInternational Farm Management Congress Vol.1 July 21st – 26th, 2013.
Lovarelli, D. & Bacenetti, J. 2017. Bridging the gap between reliable data collection and the environmental impact for mechanised field operations. Biosystems Engineering 160, 109–123.
Lovarelli, D., Bacenetti, J. & Fiala, M. 2017. Effect of local conditions and machinery characteristics on the environmental impacts of primary soil tillage. Journal of Cleaner Production 140(2), 479–491.
Margni, M., Rossier, D., Crettaz, P. & Jolliet, O. 2002. Life cycle impact assessment of pesticides on human health and ecosystems. Agriculture Ecosystems and Environment 93, 379–392. Millennium Ecosystem Assessment (MEA). 2005. Ecosystems and Human Well-being:
Synthesis. Island Press, Washington, DC, pp. 1–24.
Mohamad, R.S., Bteich, M.R., Cardone, G. & Marchini, A. 2013. Economic analysis in organic olive farms: the case of the ancient olive trees in the rural parkland in Apulia. New Medit 4, 55–61.
Montemurro, F. & Maiorana, M. 2015. Agronomic practices at low environmental impact for Durum wheat in Mediterranean conditions. Journal of Plant Nutrition 38, 624–638. Montemurro, F. & Maiorana, M. 2014. Cropping systems tillage and fertilization strategies for
durum wheat performance and soil properties. International Journal of Plant Production 8(1), 51–75.
Montemurro, F., Maiorana, M., Convertini, G. & Fornaro, F. 2008. Cropping systems: the role of continuous cropping crop rotation leguminous crops and catch crop in Mediterranean conditions, pp. 141–171. In: Berklian YU (ed) Crop Rotation. Nova Science Pub Inc Hauppauge NY USA.
75
Naudin, C., van der Werf, H.M.G., Jeuffroy, M-H. & Corre-Hellou, G. 2014. Life cycle assessment applied to pea-wheat intercrops: A new method for handling the impacts of co-products. Journal of Cleaner Production 73, 80–87.
Nave, S., Jacquet, F. & Jeuffroy, M.H. 2013. Why wheat farmers could reduce chemical inputs: evidence from social, economic, and agronomic analysis. Agronomy for Sustainable Development 33(4), 795–807.
Nemecek, T. & Kägi, T. 2007. Life Cycle Inventories of Agricultural Production Systems. Final report Ecoinvent v2.0 No15 Swiss Centre for Life Cycle Inventories Dübendorf CH, pp. 1–360.
Nemecek, T., Frick, C., Dubois, D. & Gaillard., G. 2007. Comparing farming systems at crop rotation level by LCA. In: Geerken, T., Mattson, B., Olsson, P. & Johansson, E., (eds.) Proceedings of the International Conference on LCA in Foods, Gothenburg. SIK, VITO, Gothenburg, pp. 65–69.
Nemecek, T., Schneider, A., Hayer, F., Bonnin, E., Carrouée, B., Vivier, C. 2015. Designing eco-efficient crop rotations using life cycle assessment of crop combinations. European Journal of Agronomy 65, 40–51.
Nemecek, T., von Richthofen, J.S., Dubois, G., Casta, P., Charles, R. & Pahl, H. 2008. Environmental impacts of introducing grain legumes into European crop rotations. European Journal of Agronomy 28, 380–393.
Niero, M., Ingvordsen, C.H., Jørgensen, RB. & Hauschild, M.Z. 2015. How to manage uncertainty in future Life Cycle Assessment (LCA) scenarios addressing the effect of climate change in crop production. Journal of Cleaner Production 107, 693–706.
Niero, M., Pizzol, M., Bruun, H.G. & Thomsen, M. 2014. Comparative life cycle assessment of wastewater treatment in Denmark including sensitivity and uncertainty analysis. Journal of Cleaner Production 68, 25–35
Notarnicola, B., Salomone, R., Petti, L., Renzulli, P.A., Roma, R. & Cerutti, A.K. 2015. Life Cycle Assessment in the Agri-food Sector Case Studies, Methodological Issues and Best Practices. Springer International Publishing Switzerland, pp. 1–420.
Pardo, G., Aibar, J., Cavero, J. & Zaragoza, C. 2009. Economic evaluation of cereal cropping systems under semiarid conditions: minimum input, organic and conventional. Sci. Agric. (Piracicaba, Braz.) 66(5), 615–621.
Pardo, G., Perea, F., Martínez Y. & Urbano, J.M. 2014. Economic profitability analysis of rainfed organic farming in SW Spain. Outlook on Agriculture 43(2), 115–122.
Peris Moll, E.M. & Juliá Igual, J.F. 2006. Production costs of the organic Clementine crop in the region of Valencia (Spain). Span. J. Agric. Res. 4(1), 17–25.
Pré Consultants. 2014. SimaPro Database Manual – Methods library. The Netherlands.
Rabbinge, R. & Bindraban, P.S. 2012. Making More Food Available: Promoting Sustainable Agricultural Production. Journal of Integrative Agriculture 11(1), 1–8.
Rebitzer, G., Ekvall, T., Frischknecht, R., Hunkeler, D., Norris, G., Rydberg, T., Schmidt, W.P., Suh, S., Weidema, B.P. & Pennington, D.W. 2004. Life cycle assessment Part 1: Framework, goal and scope definition, inventory analysis, and applications. Environment International 30(5), 701–720.
Ryan, J., Pala, M., Masri, S., Singh, M. & Harris, H. 2008. Rainfed wheat-based rotations under Mediterranean conditions: Crop sequences nitrogen fertilization and stubble grazing in relation to grain and straw quality. European Journal of Agronomy 28, 112–118.
Sands, G.R. & Podmore, T.H. 2000. A generalized environmental sustainability index for agricultural systems. Agriculture Ecosystems & Environment 79, 29–41.
Sartori, L., Basso, B., Bertocco, M. & Oliviero, G. 2005. Energy Use and Economic Evaluation of a Three Year Crop Rotation for Conservation and Organic Farming in NE Italy. Biosystems Engineering 91(2), 245–256.
Schneider, A., Flénet, F., Dumans, P., Bonnin, E., De Chezelles, E., Jeuffroy, M.H., Hayer, F., Nemecek, T. & Carrouée, B. 2010. Diversifying cereal crop rotations notably with peas and rapeseed – Recent experiment and study data. OCL – Oleagineux Corps Gras Lipides 17(5), 301–311 (in French with abstract in English).
Sgroi, F., Di Trapani, A.M., Testa, R. & Tudisca, S. 2014. Economic sustainability of early potato production in the Mediterranean area. American Journal of Applied Sciences 11(9), 1598–1603.
Society of Environmental Toxicology and Chemistry [SETAC]. 1991. A technical framework for [product] life-cycle assessments. Held in Smuggler’s Notch Vermont USA.
Sonnemann, G.W., Schuhmacher, M. & Castells, F. 2003. Uncertainty assessment by a Monte Carlo simulation in a life cycle inventory of electricity produced by a waste incinerator. Journal of Cleaner Production 11, 279–292.
Sparrevik, M., Field, J.L., Martinsen, V., Breedveld, G.D. & Cornelissen, G. 2012. Life Cycle Assessment to Evaluate the Environmental Impact of Biochar Implementation in Conservation Agriculture in Zambia. Environmental Science & Technology 47(3), 1206– 1215.
Stillitano, T., De Luca, A.I., Falcone, G., Spada, E., Gulisano, G. & Strano, A. 2016. Economic profitability assessment of Mediterranean olive growing systems. Bulg. J. Agric. Sci. 22(4), 517–526.
Stillitano, T., Falcone, G., Spada, E., De Luca, A.I., Grillone, N., Strano, A. & Gulisano, G. 2017a. An economic sustainability assessment of ‘Fichi di Cosenza’ PDO production compared with other profitable permanent crops. Acta Horticulturae 1173, 395–400. Stillitano, T., De Luca, A.I., Iofrida, N., Falcone, G., Spada, E. & Gulisano, G. 2017b. Economic
analysis of olive oil production systems in southern Italy. Quality - Access to Success 18(157), 107–112.
Stillitano, T., Falcone, G., De Luca, A.I., Spada, E., Gulisano, G. & Strano, A. 2018. Long-term feasibility of Mediterranean olive production systems. Acta Horticulturae 1199, 203–208. Strano, A., Stillitano, T., De Luca, A.I., Falcone, G. & Gulisano, G., 2015. Profitability analysis
of small-scale Beekeeping firms by using Life Cycle Costing (LCC) methodology. American Journal of Agricultural and Biological Sciences 10(3), 116–127.
Tatlidil, F.F., Kiral, T., Gündoǧmuş, E., Fidan, H. & Aktürk, D. 2005. The effect of crop losses during pre-harvest and harvest periods on production costs in tomato production in the Ayaş and Nallihan districts of Ankara province. Turkish Journal of Agriculture and Forestry 29(6), 499–509.
Testa, R., Di Trapani, A.M., Sgroi, F. & Tudisca, S. 2014. Economic analysis of process innovations in the management of olive farms. Am. J. Appl. Sci. 11(9), 1486–1491.
Tudisca, S., Di Trapani, A.M., Sgroi, F. & Testa, R. 2013. The cost advantage of Sicilian wine farms. Am. J. Appl. Sci. 10(12), 1529–1536.
Tudisca, S., Di Trapani, A.M., Sgroi, F. & Testa, R. 2014. Organic farming and economic sustainability: the case of Sicilian Durum Wheat. Quality - Access to Success 15(138), 93–96. Vach, M., Strašil, Z. & Javůrek, M. 2016. Economic efficiency of selected crops cultivated under
different technology of soil tillage. Scientia Agriculturae Bohemica 47(1), 40–46.
Weil, R.R. 1990. Defining and Using the Concept of Sustainable Agriculture. J. Agron. Educ. 19(2), 126–130.