predict mortality, cardiovascular events and bleeding in stable coronary
artery disease. American Journal of Medicine, 130(6), pp. 720-730.
(doi:
10.1016/j.amjmed.2017.01.002
)
This is the author’s final accepted version.
There may be differences between this version and the published version.
You are advised to consult the publisher’s version if you wish to cite from
it.
http://eprints.gla.ac.uk/135955/
Deposited on: 31 January 2017
Enlighten – Research publications by members of the University of Glasgow
http://eprints.gla.ac.uk
Hemoglobin and Change in Hemoglobin Status Predict Mortality, Cardiovascular Events and Bleeding in Stable Coronary Artery Disease
Paul R. Kalra, MD, Nicola Greenlaw, MS, Roberto Ferrari, MD, Ian Ford, PhD, Jean-Claude Tardif, MD, Michal Tendera, MD, Christopher M. Reid, MD, Nicolas Danchin, MD, Janina Stepinska, MD, Ph. Gabriel Steg, MD, Kim M. Fox, MD
PII: S0002-9343(17)30032-3
DOI: 10.1016/j.amjmed.2017.01.002 Reference: AJM 13871
To appear in: The American Journal of Medicine
Received Date: 13 October 2016 Revised Date: 31 December 2016 Accepted Date: 3 January 2017
Please cite this article as: Kalra PR, Greenlaw N, Ferrari R, Ford I, Tardif JC, Tendera M, Reid CM, Danchin N, Stepinska J, Steg PG, Fox KM, for the CLARIFY Investigators, Hemoglobin and Change in Hemoglobin Status Predict Mortality, Cardiovascular Events and Bleeding in Stable Coronary Artery Disease, The American Journal of Medicine (2017), doi: 10.1016/j.amjmed.2017.01.002.
This is a PDF file of an unedited manuscript that has been accepted for publication. As a service to our customers we are providing this early version of the manuscript. The manuscript will undergo copyediting, typesetting, and review of the resulting proof before it is published in its final form. Please note that during the production process errors may be discovered which could affect the content, and all legal disclaimers that apply to the journal pertain.
M
AN
US
CR
IP
T
AC
CE
PT
ED
Type of manuscript: Clinical Research Study
Hemoglobin and Change in Hemoglobin Status Predict Mortality, Cardiovascular Events and Bleeding in Stable Coronary Artery Disease
Paul R. Kalra, MD,a Nicola Greenlaw, MS,b Roberto Ferrari, MD,c Ian Ford, PhD,b Jean-Claude Tardif,d MD, Michal Tendera,e MD, Christopher M. Reid, MD,f Nicolas Danchin, MD,g Janina Stepinska, MD,h Ph. Gabriel Steg, MD,I,j Kim M. Fox, MD,j for the CLARIFY Investigators*
a
Portsmouth Hospital NHS Trust, Portsmouth and NHLI Imperial College, London, UK; bRobertson Centre, University of Glasgow, Glasgow; cDepartment of Cardiology and LTTA Centre, University Hospital of Ferrara and Maria Cecilia Hospital, GVM Care&Research, E.S: Health Science Foundation, Cotignola, Italy; dMontreal Heart Institute, Université de Montreal, Montreal, Canada; eMedical University of Silesia, Katowice, Poland; fCurtin University, Western Australia & Monash University, Victoria, Australia;
g
Cardiology, European Hospital Georges-Pompidou, Paris, France; hCardiology, Institute of Cardiology, Warsaw, Poland; iDépartement Hospitalo-Universitaire FIRE, Hôpital Bichat, Assistance Publique – Hôpitaux de Paris, Paris, France; jNHLI Imperial College, ICMS, Royal Brompton Hospital, London, UK.
*A full list of the CLARIFY Investigators can be found in Appendix 1, available online.
Corresponding Author: Paul R. Kalra, MD, Portsmouth Hospital NHS Trust, Queen Alexandra Hospital, Southwick Hill Road, Cosham, PO6 3LY, UK.
Tel: +44-23-92-28-36-50, Fax: +44-23-92-286037 E-mail address: [email protected]
Funding: This work was supported by research grants from Servier, France.
Conflict of Interest:
M
AN
US
CR
IP
T
AC
CE
PT
ED
Servier, outside the submitted work.
NG reports grants from Servier, during the conduct of the study.
RF reports grants and personal fees from Servier, grants and personal fees from Novartis, personal fees from Merck Serono, grants and personal fees from Boehringer Ingelheim, grants from Irbtech, personal fees from Amgen, outside the submitted work.
IF reports grants and personal fees from Servier, during the conduct of the study; grants and personal fees from Amgen, outside the submitted work.
J-CT reports grants from Servier, during the conduct of the study; grants and other from Servier, grants from Roche, grants and other from Pfizer, grants from AstraZeneca, grants from Merck, grants and other from Sanofi, grants from Eli-Lilly, grants and other from Thrasos, grants from Valeant, other from Takeda, outside the submitted work.
MT reports personal fees from Servier, during the conduct of the study; personal fees from Bayer, personal fees from Celyad, personal fees from Janssen-Cilag, personal fees from Novartis, personal fees from Servier, personal fees from Stealth Biotherapeutics, grants from Polish National Center for Research and Development, outside the submitted work.
CMR reports no disclosures.
ND reports grants, personal fees and financial support from Amgen, grants, personal fees and non-financial support from AstraZeneca, grants and personal fees from Bayer, grants and personal fees from Daiichi Sankyo, grants, personal fees and non-financial support from Eli Lilly, personal fees from GSK, grants and personal fees from MSD, personal fees from Novartis, personal fees from Novo-Nordisk, personal fees from Pfizer, personal fees from Roche, grants, personal fees and non-financial support from Sanofi, personal fees and non-financial support from Servier, personal fees from BMS, personal fees from Boehringer Ingelheim, during the conduct of the study.
JS reports grants from Novartis, grants, personal fees and non-financial support from Servier, personal fees from Abbott, personal fees from Astra Zeneca, personal fees from Bayer, personal fees and non-financial support from Boehringer Ingelheim, personal fees from Elli Lilly, personal fees from Sanofi, personal fees from Amgen, outside the submitted work; Dr. Fox reports personal fees from Servier, non-financial support from Servier, during the conduct of the study; personal fees and non-non-financial support
M
AN
US
CR
IP
T
AC
CE
PT
ED
from Servier, personal fees from AstraZeneca, personal fees from TaurX, non-financial support from Armgo, personal fees and non-financial support from Broadview Ventures, personal fees from CellAegis, outside the submitted work; and Director of Heart Research Ltd and Vesalius Trials Ltd; minimal
stockholder of Armgo and CellAegis.
PGS reports grants and personal fees from Servier, during the conduct of the study; personal fees from Amarin, personal fees from AstraZeneca, personal fees from Bayer, personal fees from Boehringer-Ingelheim, personal fees from Bristol-Myers-Squibb, personal fees from Daiichi-Sankyo, personal fees from GlaxoSmithKline, personal fees from Lilly, personal fees from Merck-Sharpe-Dohme, personal fees from Novartis, personal fees from Pfizer, personal fees from Roche, grants and personal fees from Sanofi, grants and personal fees from Servier, personal fees from Janssen, personal fees and non-financial support from The Medicines Company, personal fees from Regado, personal fees from Regeneron, outside the submitted work.
Authorship: All authors had access to the data and a role in writing the manuscript. KEYWORDS: Coronary artery disease; Anemia; Hemoglobin
Running head: Hemoglobin Levels can Predict Outcomes in Stable coronary artery disease
M
AN
US
CR
IP
T
AC
CE
PT
ED
ABSTRACTBACKGROUND: Anemia is a predictor of adverse outcomes in acute myocardial infarction. We studied the relationship of hemoglobin, or its change over time, and outcomes in patients with stable coronary artery disease.
METHODS: CLARIFY is a prospective, cohort study of outpatients with stable coronary artery disease (32,901 in 45 countries 2009-2010); 21,829 with baseline hemoglobin levels. They were divided into hemoglobin quintiles and anemia status (anemic [A] or normal [N]) at baseline/follow-up: N/N; A/N; N/A; A/A. All-cause mortality, cardiovascular events, and major bleeding at 4-year follow-up were assessed. RESULTS: Low baseline hemoglobin was an independent predictor of all-cause, cardiovascular, and noncardiovascular mortality, the composite of cardiovascular death/myocardial infarction or stroke and major bleeds (all P <.001; unadjusted models). Anemia at follow-up was independently associated with all-cause mortality (hazard ratio [HR], 1.90; 95% confidence interval [CI], 1.55-2.33 for A/A; 1.87; 1.54-2.28 for N/A; both P <.001), noncardiovascular mortality (P <.001), and cardiovascular mortality (P = .001). Patients whose baseline anemia normalized (A/N) were not at increased risk of death (HR, 1.02; 95% CI, 0.77-1.35), although risk of major bleeding was greater (HR, 2.06; 95% CI, 1.23-3.44; P = .013) than in those with normal hemoglobin throughout. Sensitivity analyses excluding patients with heart failure and chronic kidney disease at baseline yielded qualitatively similar results.
CONCLUSION: In this large stable coronary artery disease population, low hemoglobin was an independent predictor of mortality, cardiovascular events, and major bleeds. Persisting or new-onset anemia is a powerful predictor of cardiovascular and noncardiovascular mortality.
M
AN
US
CR
IP
T
AC
CE
PT
ED
INTRODUCTIONAnemia is a risk factor for cardiovascular disease in the general population.1 Anemia is also an independent predictor of adverse outcomes in acute coronary syndromes.2-4 In addition, lower hemoglobin levels or anemia independently predict higher mortality after percutaneous coronary intervention5 or coronary artery bypass graft surgery.6
Anemia may be associated with elevated levels of inflammatory mediators,7 and inflammation is associated with atherosclerotic progression.8 As such, anemia could theoretically contribute to
progression of coronary artery disease. However, coexisting conditions (cardiovascular and other) are also intricately related to both inflammation and hemoglobin levels and it remains uncertain as to whether anemia is causally implicated in adverse outcomes or whether it is a marker of other, or advanced, disease. For example, a particularly strong adverse relationship is seen between anemia and outcomes in heart failure.9,10
Little is known regarding the relationship of hemoglobin or change in anemia status over time and cardiovascular events and mortality in stable coronary artery disease. The aims of the current analysis from the large contemporary global CLARIFY (ProspeCtive observational LongitudinAl RegIstry oF patients with stable coronary arterY disease) registry were to assess the relationship between
hemoglobin, or change in anemia status over time, and 4-year mortality and cardiovascular and major bleeding events. We hypothesized that both lower baseline hemoglobin and change in hemoglobin over time would be associated with mortality and adverse cardiovascular events.
METHODS Ethics Statement
The study was conducted in accordance with the principles in the Declaration of Helsinki. Local ethical approval was obtained as necessary in all countries prior to recruitment. All patients provided written informed consent.
Study Design and Patients
M
AN
US
CR
IP
T
AC
CE
PT
ED
coronary artery disease.11-14 The study was established to characterize outpatients with stable coronary artery disease in terms of clinical profiles, therapeutic strategies, and outcomes. Patients are followed up with annual visits for 5 years, with interim telephone calls every 6 months to maximize participant retention. Data collected included demographics, medical history, risk factors and lifestyle, physical condition and vital signs, current symptoms and treatments. Presence of diabetes or dyslipidemia reflects a history of these conditions. Patients were asked about their symptoms of heart failure; when present, symptoms were categorized per New York Heart Association class. Physical activity was graded according to the amount undertaken per week. Treatment is per usual local clinical practice. Laboratory and other test (invasive and noninvasive) results were collected, but no test was mandated by the study protocol.
Patients were required to have stable coronary artery disease, defined as history of ≥1 of the following: previous (>3 months before enrolment) documented myocardial infarction or coronary revascularization procedure; coronary stenosis >50% at angiography; or chest pain with evidence of myocardial ischaemia (stress electrocardiogram, stress echocardiograph or myocardial perfusion imaging). Exclusion criteria included recent (≤3 months) hospitalization for a cardiovascular reason (including revascularization), planned revascularization, or conditions hampering participation for the 5-year follow-up. Anemia was not an exclusion criterion.
To ensure patients were representative of stable coronary artery disease outpatients, recruitment of sites was based on selection of physicians (n = 2884, including cardiologists, office-based primary care physicians, and physicians based in hospitals with outpatient clinics) by national coordinators, using the best available epidemiological data in each country reflecting the burden of coronary artery disease. To reduce selection bias, each participating physician was asked to recruit 10-15 consecutive stable outpatients with coronary artery disease over a short period to meet a predefined country target of 25 patients per million inhabitants (range 12.5-50).
This analysis focused on patients with available hemoglobin data at baseline (collection of these data was not mandated for study enrolment). Patients were grouped according to quintile of baseline hemoglobin to permit comparison of characteristics and treatments between the groups and the
13.70-M
AN
US
CR
IP
T
AC
CE
PT
ED
14.40 g/dL; quintile 4: 14.41-15.20 g/dL; and quintile 5: >15.20 g/dL). In this analysis, the primary endpoint was all-cause mortality at 4-year follow up, with secondary cardiovascular mortality and major bleeding endpoints. Major bleeding was defined as that requiring hospitalization or blood transfusion.
Anemia was defined according to World Health Organization criteria as hemoglobin <13 g/dL for men and <12 g/dL for women.15 To evaluate change in anemia status over time with 4-year outcomes, patients were divided into four groups according to the presence or absence of anemia at baseline and at follow-up, respectively: Normal/Normal (N/N); Anemic/Normal (A/N); Normal/Anemic (N/A); and
Anemic/Anemic (A/A). Analysis of the effect of the change in hemoglobin on the outcome used the latest available hemoglobin value prior to each event.
Statistical Analysis
All CLARIFY data are collected and analyzed at an independent academic statistics center (Robertson Centre for Biostatistics, University of Glasgow, UK) that is responsible for the management of the database, all analyses (using the SAS statistical program, version 9.2 or higher), and storing the data according to regulations. Baseline characteristics, according to hemoglobin quintiles, are presented using descriptive statistics with mean (standard deviation [SD]) or median (quartile 1, quartile 3 [Q1, Q3]) for continuous variables, depending on the distribution of the data, and as counts (percentages) for categorical data.
Comparisons between the hemoglobin quintiles were made using either one-way analysis of variance or the Kruskal-Wallis test for continuous data, depending on the distribution of the data, or the chi-square test for categorical data.
The primary and secondary endpoints were evaluated with the use of univariate and multivariable Cox proportional hazards models to examine the effect of the hemoglobin quintiles on each of the
endpoints, with the multivariable model adjusting for clinical and demographic baseline variables known to have a relationship with these endpoints, and included the following: age, sex, geographic region, smoking status, systolic blood pressure, diastolic blood pressure, history of heart failure, dyslipidemia, history of myocardial infarction, history of percutaneous coronary intervention, history of coronary artery bypass graft, left ventricular ejection fraction, peripheral artery disease, asthma/chronic obstructive
M
AN
US
CR
IP
T
AC
CE
PT
ED
pulmonary disease, diabetes mellitus and renal function, where renal function was calculated using the Chronic Kidney Disease-Epidemiological Collaboration (CKD-EPI) formula for estimated glomerular filtration rate.16 Similar Cox proportional hazards models were produced to examine the effect of the change in hemoglobin on each of the endpoints. These models included the above-noted four-level categorical variable, indicating the presence or absences of anemia in patients at baseline and at follow-up visits, instead of the hemoglobin quintiles.
Sensitivity analyses were performed, excluding patients with heart failure, and separately patients with severe chronic kidney disease at baseline. Severe chronic kidney disease was defined as estimated glomerular filtration rate <30 mL/min/1.73 m2.
RESULTS
A total of 33,375 patients were enrolled in 45 countries between November 2009 and June 2010. Four hundred seventy-four patients were excluded as they did not meet the study criteria, did not provide informed consent, or were missing ethics committee approval (Figure 1). Of the remaining 32,901 patients, baseline hemoglobin level was available in 21,829 patients and formed the study group. The mean age was 64 ± 10 years, 77.4% were male, and mean hemoglobin was 14.0 ± 1.5 g/dL. At baseline, 11.0% of men and 13.1% of women were anemic.
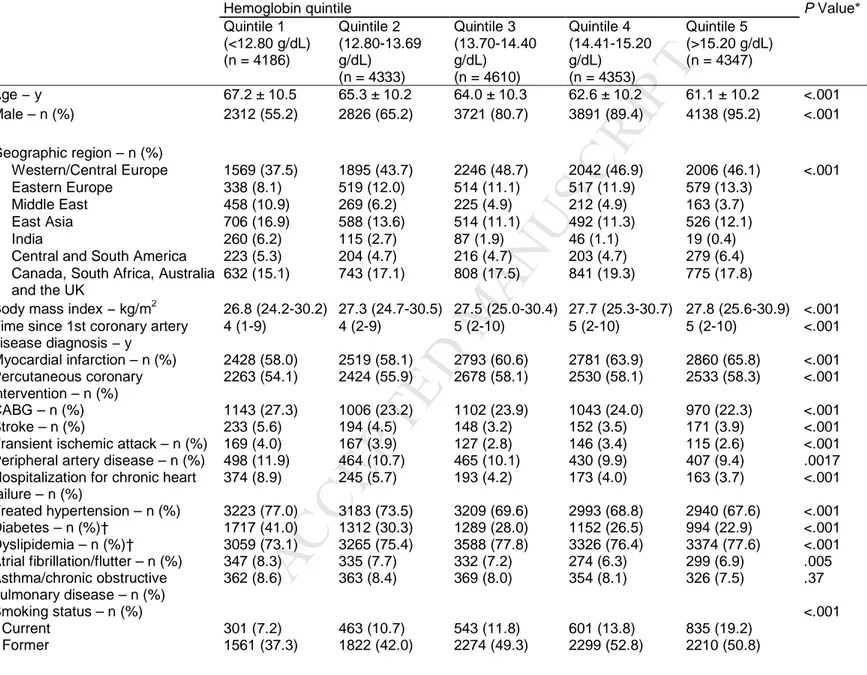
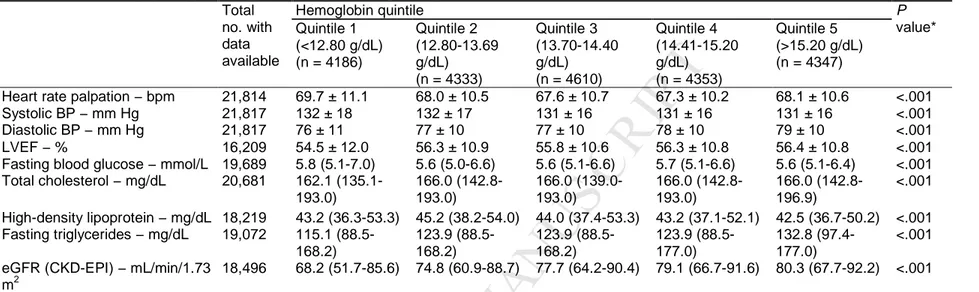
Baseline characteristics of the study population according to hemoglobin quintile are shown in Table 1. The profiles of the quintiles differed. For example, age decreased steadily with increasing quintiles of hemoglobin; the percentage of men and the median body mass index increased from quintile 1 to quintile 5, whilst the converse was seen for age. Patients in the higher quintiles were more likely to be smokers and consume alcohol but less likely to be sedentary. They also had a longer duration of coronary artery disease and were more likely to have had a myocardial infarction or undergone percutaneous coronary intervention but less likely to have had coronary artery bypass graft. Patients in the lower quintiles had higher rates of prior hospitalization for heart failure and had higher prevalences of coexisting conditions, most notably diabetes. The prevalence of left bundle branch block decreased from quintile 1 to quintile 5; the opposite was seen for the mean concentration of triglycerides and estimated glomerular filtration rate (Table 2).
M
AN
US
CR
IP
T
AC
CE
PT
ED
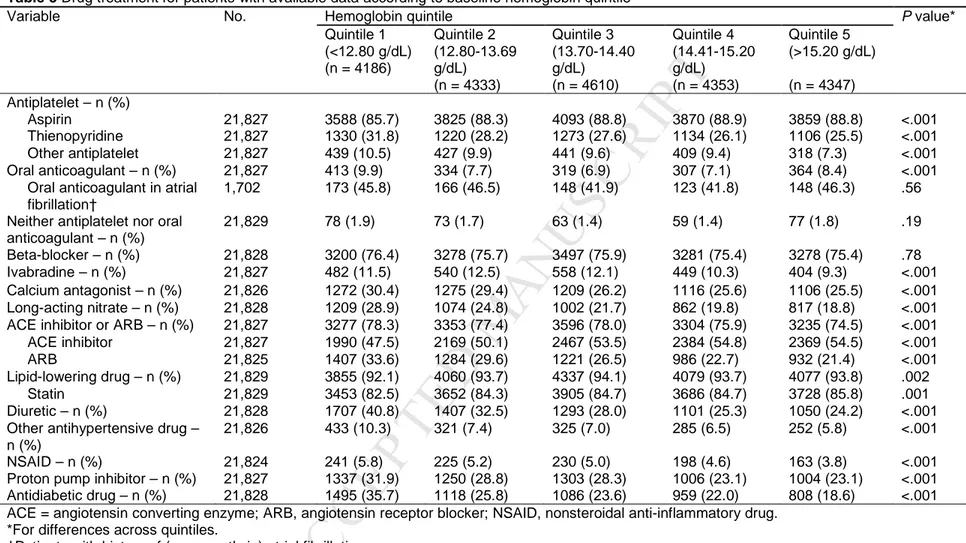
Whilst patients with lower hemoglobin were less commonly treated with aspirin and angiotensin-converting enzyme inhibitors, they more commonly received thienopyridines, anticoagulants, angiotensin receptor blockers, calcium antagonists, proton pump inhibitors, antihypertensive medications,
nonsteroidal anti-inflammatory, and antidiabetic drugs (Table 3).
Outcomes According to Hemoglobin Status
In univariate analysis (Figure 2A), all-cause mortality, cardiovascular mortality (quintile 1 only), noncardiovascular mortality, and major bleeding were significantly more common in the lowest two quintiles as compared with quintile 3. Following multivariable adjustment (Figure 2B), with quintile 3 as reference, patients in quintile 1 more commonly experienced all-cause and cardiovascular mortality and major bleeding whilst patients in quintile 2 more commonly experienced noncardiovascular mortality and major bleeding (trend for all-cause mortality). A composite of cardiovascular death, myocardial infarction, or stroke was more commonly seen in quintiles 1 and 2 (trend for quintile 5) as compared with quintile 3. As sex is a strong predictor of both mortality and hemoglobin level, separate analyses have been done for men and women (Appendix 2).
Outcomes According to Change in Hemoglobin Status
Additional hemoglobin data at follow-up were available for a subset of 17,584 subjects, most of whom were not anemic at baseline and at follow-up. In univariate (Figure 3A) and multivariable (Figure 3B) analysis, anemia status at follow-up (N/A or A/A) was associated with an increased risk of mortality (all-cause, cardiovascular, and noncardiovascular) as compared to patients without anemia during the study (N/N). Patients whose baseline anemia normalized during follow-up (A/N) did not appear to be at increased risk of death, although risk of major bleeding was greater following multivariable analysis. The results were qualitatively similar when major bleeding outcomes were further adjusted for oral
anticoagulant use at baseline.
Sensitivity analyses were performed after excluding patients with heart failure and severe chronic kidney disease at baseline and yielded qualitatively similar results.
M
AN
US
CR
IP
T
AC
CE
PT
ED
DISCUSSIONIn this large international contemporary stable coronary artery disease population, low hemoglobin at baseline was an independent predictor of mortality, adverse cardiovascular events, and major bleeds when assessed over a 4-year period. Persisting or new onset anemia was an independent powerful predictor of cardiovascular and noncardiovascular mortality. In contrast, patients whose anemia
normalized over time did not appear to have an excess mortality risk, although their risk of major bleeding was increased relative to patients without anemia. Whilst low hemoglobin levels may play a
pathophysiological role in cardiovascular disease progression, and thereby adverse events, these data suggest that it may also be a marker of coexisting disease.
Published studies have focused on the relationship between anemia and outcomes in patients presenting with acute coronary syndromes3,4,17,18 and/or undergoing revascularization, with variable lengths of follow-up.5,19 Many of these were single center experiences.2,18,19 Anemia at baseline has consistently been shown to predict adverse outcome. For example, data from the Acute Catheterization and Urgent Intervention Triage StrategY (ACUITY) trial showed that anemia was an independent predictor of 1-year mortality and major bleeding at 1 month.4 A meta-analysis of 27 studies of patients with acute coronary syndromes (n = 233,144) found that anemia was associated with comorbidities and was an independent predictor of all-cause mortality.3 In contrast, few studies have evaluated patients with stable coronary artery disease. Muzarelli et al.20 evaluated data in 253 elderly subjects (≥75 years) with symptomatic stable coronary artery disease from the TIME study and found that anemia was an
independent predictor of all-cause and cardiovascular mortality. Anemia was a predictor of a composite of cardiovascular events when evaluated in 143 subjects undergoing first diagnostic angiogram for stable angina and proven coronary artery disease (>50% luminal narrowing).21
The current study contributes to our understanding of the relationship of hemoglobin and change in anemia status in stable coronary artery disease, having recruited a large (21,829 patients) and
representative (multicenter from 45 countries) population with long-term follow-up (4 years). A relationship between heart failure and low hemoglobin is well established22; presence of anemia is a powerful predictor of adverse outcomes in heart failure. Relatively few patients in the CLARIFY study had a history of heart failure at baseline (83.2% had no symptoms of heart failure) and
M
AN
US
CR
IP
T
AC
CE
PT
ED
mean left ventricular ejection fraction was 56% (noting that data on left ventricular function were not systematically required for the study). To ensure that this group was not driving the main results of the study, sensitivity analysis, following the exclusion of patients with symptoms of heart failure, were performed and revealed qualitatively similar results. There is an intricate relationship between advanced chronic kidney disease and hemoglobin, and chronic kidney disease is an independent predictor of adverse outcomes for patients presenting with many different cardiovascular disorders. As such, the sensitivity analyses excluding patients with severe chronic kidney disease (estimated glomerular filtration rate <30 mL/min/1.73 m2) add weight to establishing low hemoglobin as an independent predictor of events in patients with stable coronary artery disease.
Few studies have evaluated the effect of change in hemoglobin or anemia status over time in patients with coronary artery disease. A retrospective analysis of patients surviving to at least 6 months following a myocardial infarction showed that the last hemoglobin measurement had the highest prognostic power and that hemoglobin decrement was associated with an increased risk of all-cause mortality and recurrent cardiovascular events even among nonanemic patients at baseline.23 Ang et al.2 evaluated 448 patients presenting with acute coronary syndrome with hemoglobin assessment at baseline and 7 weeks. They found a doubling of the prevalence of anemia by 7 weeks and that its presence at either time point was an independent predictor of adverse prognosis. Our current study evaluated data from a subset of 17,584 patients and highlights that anemia at follow-up is an important independent predictor of all-cause, cardiovascular, and noncardiovascular mortality in stable coronary artery disease. When anemia normalizes over time, this relationship is lost. Anemia at baseline is a correlate of major bleeds; this is unlikely to be a causative relationship and more likely identifies patients at higher bleeding risk, perhaps reflecting prior blood loss.
Patient characteristics differed according to hemoglobin level. In keeping with other studies, patients with higher baseline hemoglobin were younger and more likely to be male.5,18 Comorbidities were more prevalent in patients with lower hemoglobin and this was particularly noticeable for diabetes;
patients in the lowest quintile of hemoglobin were nearly twice as likely to be diabetic as compared to those in the highest quintile. Lower levels of lipids seen in patients with low hemoglobin (and thereby in those with worse prognosis) may well be a reflection of impaired general health. How all these
M
AN
US
CR
IP
T
AC
CE
PT
ED
comorbidities inter-relate to affect both hemoglobin and long-term outcomes is complex. Whist the development of anemia might itself contribute to cardiovascular events, it is likely that at least part of its association with adverse prognosis is related to underlying comorbid disease given that it is also an independent predictor of noncardiovascular mortality.
A cause-effect relationship exists between renal function and hemoglobin – patients with reduced renal function are known to have lower hemoglobin. Some studies have suggested an additive risk of chronic kidney disease and anemia in patients undergoing percutaneous coronary intervention.5 In our study, low hemoglobin and anemia at follow-up were strong predictors of adverse outcome even after correcting for baseline renal function. Sensitivity analysis whereby patients with severe chronic kidney disease were excluded revealed qualitatively similar results.
Differences in treatments were seen across hemoglobin groups. From our data it is not possible to distinguish whether various treatments per se effects the development of anemia or whether
hemoglobin influences prescribing practice. Despite a wide range of hemoglobin values very few patients did not receive either antiplatelet or oral anticoagulant therapy. Associated comorbidities are likely to play a role in differences; for example, the prescribing pattern of aspirin and anticoagulants could be in part be explained by associated atrial fibrillation. Higher use of thienopyridines was seen in stepwise fashion in lower hemoglobin quintiles despite lower rates of previous percutaneous coronary intervention. Overall use of nonsteroidal anti-inflammatory drugs was low in the total population, but was higher in patients with lower hemoglobin. A stepwise increase in prescription of proton pump inhibitors was seen with lower hemoglobin quintile. It is uncertain as to whether this relates to the presence of gastrointestinal disease or symptoms, or reflects a response to low hemoglobin or even contributes to anemia through the
development of iron deficiency.24,25
Patients with lower hemoglobin more frequently received angiotensin receptor blockers and were less likely to be prescribed angiotensin-converting enzyme inhibitors. We have shown a similar pattern when patients with coronary artery disease are evaluated according to severity of renal dysfunction.11
This study has several limitations. The current study population comprises 66.3% of the total CLARIFY population, due to baseline hemoglobin being unavailable in the remainder (recent blood tests were not mandated for inclusion in the study). Owing in part to the large size of the study and the fact that
M
AN
US
CR
IP
T
AC
CE
PT
ED
there appear to be regional differences in patients with and without blood test results, there are inevitably statistical differences between the two groups. This is another reason as to why we adjusted the analysis for geographic region. On inspection of the comparative data, the magnitude of difference and clinical relevance does not appear to be too large. Endpoints are all as reported by investigators without central adjudication. However, we do not expect major differences in ascertainment as a function of hemoglobin. At yearly follow-up visits, blood tests were included if available within the previous 12 months and exact dates for the blood results were not collected. The clinical indication for the blood test might add confounding. Anemia per se was not an exclusion criterion, but it is plausible that subjects with more severe reduction in hemoglobin may have been excluded based on this being considered as hampering the collection of 5-year follow-up data. As such, the results may not be applicable to patients with more severe anemia at baseline. Whilst we have adjusted for geographic region, data on presence of thallasemia trait in participants are lacking and could theoretically influence the results.
We did not collect data relating to the cause of anemia, such as hematinics (in particular ferritin was unavailable), or other indices of red blood cell status (including mean corpuscular volume or red cell distribution width) or markers of inflammation (e.g. C-reactive protein), which might be associated with adverse outcome in coronary artery disease.26 Knowledge of such data will be crucial to fully
understanding the relationships we have demonstrated, and will be fundamental to planning prospective studies to see if correction of anemia is associated with improved outcomes in coronary artery disease.
CONCLUSIONS
Low hemoglobin is common and is an independent predictor of mortality, adverse cardiovascular events, and major bleeds in patients with stable coronary artery disease. Persisting or new onset anemia is a powerful predictor of cardiovascular and noncardiovascular mortality. More studies are required to establish the cause of low hemoglobin and whether correction, if possible, can translate into improved outcomes. In current clinical practice hemoglobin level should be considered an important marker in terms of assessment of prognosis and bleeding risk. Our data suggest that whilst low hemoglobin level may play a pathophysiological role in cardiovascular events, it is also likely to be a marker of coexisting disease.
M
AN
US
CR
IP
T
AC
CE
PT
ED
ROLE OF THE FUNDING SOURCE
The study was designed and conducted by the investigators. All data were collected and analyzed by NG and IF at the independent academic statistics center at the Robertson Centre for Biostatistics at the University of Glasgow, UK and interpreted by the investigators. The sponsor had no role in the design and management of the study, in the analysis, and interpretation of the data; and in the decision to submit the manuscript for publication, but did assist with the set up, data collection and management of the study in each country. The sponsor funded editorial support for editing and revision of the manuscript and received the manuscript for review prior to submission. The CLARIFY registry enforces a no ghost-writing policy. This manuscript was written by the authors, who take full responsibility for its content.
ACKNOWLEDGMENTS
Sophie Rushton-Smith, PhD (MedLink Healthcare Communications Ltd), provided editorial assistance and was compensated by the sponsor.
References
1. Sarnak MJ, Tighiouart H, Manjunath G, et al. Anemia as a risk factor for cardiovascular disease in The Atherosclerosis Risk in Communities (ARIC) study. J Am Coll Cardiol. 2002;40:27-33. 2. Ang DS, Kao MP, Noman A, et al. The prognostic significance of early and late anaemia in acute
coronary syndrome. QJM. 2012;105:445-454.
3. Lawler PR, Filion KB, Dourian T, et al. Anemia and mortality in acute coronary syndromes: a systematic review and meta-analysis. Am Heart J. 2013;165:143-153 e145.
4. Kunadian V, Mehran R, Lincoff AM, et al. Effect of anemia on frequency of short- and long-term clinical events in acute coronary syndromes (from the Acute Catheterization and Urgent Intervention Triage Strategy Trial). Am J Cardiol. 2014;114:1823-1829.
5. Pilgrim T, Rothenbuhler M, Kalesan B, et al. Additive effect of anemia and renal impairment on long-term outcome after percutaneous coronary intervention. PLoS One. 2014;9:e114846.
M
AN
US
CR
IP
T
AC
CE
PT
ED
6. van Straten AH, Hamad MA, van Zundert AJ, et al. Preoperative hemoglobin level as a predictor of survival after coronary artery bypass grafting: a comparison with the matched general
population. Circulation. 2009;120:118-125.
7. Weiss G, Goodnough LT. Anemia of chronic disease. N Engl J Med. 2005;352:1011-1023. 8. Libby P, Hansson GK. Inflammation and immunity in diseases of the arterial tree: players and
layers. Circ Res. 2015;116:307-311.
9. McCullough PA, Barnard D, Clare R, et al. Anemia and associated clinical outcomes in patients with heart failure due to reduced left ventricular systolic function. Clin Cardiol. 2013;36:611-620. 10. He SW, Wang LX. The impact of anemia on the prognosis of chronic heart failure: a
meta-analysis and systemic review. Congest Heart Fail. 2009;15:123-130.
11. Kalra PR, Garcia-Moll X, Zamorano J, et al. Impact of chronic kidney disease on use of evidence-based therapy in stable coronary artery disease: a prospective analysis of 22,272 patients. PLoS
One. 2014;9:e102335.
12. Steg PG, Greenlaw N, Tardif JC, et al. Women and men with stable coronary artery disease have similar clinical outcomes: insights from the international prospective CLARIFY registry. Eur Heart
J. 2012;33:2831-2840.
13. Ferrari R, Abergel H, Ford I, et al. Gender- and age-related differences in clinical presentation and management of outpatients with stable coronary artery disease. Int J Cardiol.
2013;167:2938-2943.
14. Fauchier L, Greenlaw N, Ferrari R, et al. Use of Anticoagulants and Antiplatelet Agents in Stable Outpatients with Coronary Artery Disease and Atrial Fibrillation. International CLARIFY Registry.
PLoS One. 2015;10:e0125164.
15. World Health Organization (WHO). Haemoglobin concentrations for the diagnosis of anaemia and assessment of severity. Available at: http://www.who.int/vmnis/indicators/haemoglobin/en/. Accessed October 6, 2016.
16. Levey AS, Stevens LA, Schmid CH, et al. A new equation to estimate glomerular filtration rate.
M
AN
US
CR
IP
T
AC
CE
PT
ED
17. Ennezat PV, Marechaux S, Pincon C, et al. Anaemia to predict outcome in patients with acute coronary syndromes. Arch Cardiovasc Dis. 2013;106:357-365.
18. Rathod KS, Jones DA, Rathod VS, et al. Prognostic impact of anaemia on patients with ST-elevation myocardial infarction treated by primary PCI. Coron Artery Dis. 2014;25:52-59. 19. Landes U, Kornowski R, Assali A, et al. Predictors of long term outcomes in 11,441 consecutive
patients following percutaneous coronary interventions. Am J Cardiol. 2015;115:855-859.
20. Muzzarelli S, Pfisterer M, TIME Investigators. Anemia as independent predictor of major events in elderly patients with chronic angina. Am Heart J. 2006;152:991-996.
21. Lipsic E, Asselbergs FW, van der Meer P, et al. Anaemia predicts cardiovascular events in patients with stable coronary artery disease. Neth Heart J. 2005;13:254-258.
22. Groenveld HF, Januzzi JL, Damman K, et al. Anemia and mortality in heart failure patients a systematic review and meta-analysis. J Am Coll Cardiol. 2008;52:818-827.
23. Leshem-Rubinow E, Steinvil A, Rogowski O, et al. Hemoglobin nonrecovery following acute myocardial infarction is a biomarker of poor outcome: a retrospective database study. Int J
Cardiol. 2013;169:349-353.
24. Wilhelm SM, Rjater RG, Kale-Pradhan PB. Perils and pitfalls of long-term effects of proton pump inhibitors. Expert Rev Clin Pharmacol. 2013;6:443-451.
25. Shikata T, Sasaki N, Ueda M, et al. Use of proton pump inhibitors is associated with anemia in cardiovascular outpatients. Circ J. 2015;79:193-200.
26. Tonelli M, Sacks F, Arnold M, et al. Relation Between Red Blood Cell Distribution Width and Cardiovascular Event Rate in People With Coronary Disease. Circulation. 2008;117:163-168.
M
AN
US
CR
IP
T
AC
CE
PT
ED
Figure captionsFigure 1 Flow chart showing the derivation of current study population.
Figure 2 Four-year outcomes according to baseline hemoglobin status. (A) Unadjusted analysis with HRs for all-cause mortality, cardiovascular mortality, noncardiovascular mortality, major bleeding and
composite of cardiovascular death, myocardial infarction or stroke according to quintile of baseline hemoglobin (reference: quintile 3). (B) Multivariable adjustment (reference: quintile 3) with HRs for patients grouped according to baseline quintile of hemoglobin. Adjusted for age, sex, geographic region, smoking status, dyslipidemia, myocardial infarction, percutaneous coronary intervention, coronary artery bypass graft, systolic blood pressure, diastolic blood pressure, left ventricular ejection fraction, heart failure, diabetes, peripheral artery disease, asthma/chronic obstructive pulmonary disease and baseline renal function. CI = confidence interval; CV = cardiovascular; HR = hazard ratio; MI = myocardial infarction.
Figure 3 Four-year outcomes according to change in anemia status. (A) Unadjusted analysis with HRs for all-cause mortality, cardiovascular mortality, noncardiovascular mortality, major bleeding and
composite of cardiovascular death, myocardial infarction or stroke according to anemia status (reference: N/N). (B) Multivariable adjustment (reference: N/N) with HRs for patients grouped according to anemia status. Adjusted for age, sex, geographic region, smoking status, dyslipidemia, myocardial infarction, percutaneous coronary intervention, coronary artery bypass graft, systolic blood pressure, diastolic blood pressure, left ventricular ejection fraction, heart failure, diabetes, peripheral artery disease,
asthma/chronic obstructive pulmonary disease and baseline renal function. A/A = anemic at baseline and follow-up; A/N = anemic at baseline; normal at follow-up; CI = confidence interval; CV = cardiovascular; HR = hazard ratio; MI = myocardial infarction; N/A = normal at baseline; anemic at follow-up; N/N = normal at baseline and follow-up.
M
AN
US
CR
IP
T
AC
CE
PT
ED
Table 1 Characteristics of study population classified according to baseline hemoglobin quintile
Hemoglobin quintile P Value*
Quintile 1 (<12.80 g/dL) (n = 4186) Quintile 2 (12.80-13.69 g/dL) (n = 4333) Quintile 3 (13.70-14.40 g/dL) (n = 4610) Quintile 4 (14.41-15.20 g/dL) (n = 4353) Quintile 5 (>15.20 g/dL) (n = 4347) Age − y 67.2 ± 10.5 65.3 ± 10.2 64.0 ± 10.3 62.6 ± 10.2 61.1 ± 10.2 <.001 Male – n (%) 2312 (55.2) 2826 (65.2) 3721 (80.7) 3891 (89.4) 4138 (95.2) <.001 Geographic region – n (%) Western/Central Europe 1569 (37.5) 1895 (43.7) 2246 (48.7) 2042 (46.9) 2006 (46.1) <.001 Eastern Europe 338 (8.1) 519 (12.0) 514 (11.1) 517 (11.9) 579 (13.3) Middle East 458 (10.9) 269 (6.2) 225 (4.9) 212 (4.9) 163 (3.7) East Asia 706 (16.9) 588 (13.6) 514 (11.1) 492 (11.3) 526 (12.1) India 260 (6.2) 115 (2.7) 87 (1.9) 46 (1.1) 19 (0.4)
Central and South America 223 (5.3) 204 (4.7) 216 (4.7) 203 (4.7) 279 (6.4)
Canada, South Africa, Australia and the UK
632 (15.1) 743 (17.1) 808 (17.5) 841 (19.3) 775 (17.8)
Body mass index − kg/m2 26.8 (24.2-30.2) 27.3 (24.7-30.5) 27.5 (25.0-30.4) 27.7 (25.3-30.7) 27.8 (25.6-30.9) <.001
Time since 1st coronary artery disease diagnosis − y 4 (1-9) 4 (2-9) 5 (2-10) 5 (2-10) 5 (2-10) <.001 Myocardial infarction – n (%) 2428 (58.0) 2519 (58.1) 2793 (60.6) 2781 (63.9) 2860 (65.8) <.001 Percutaneous coronary intervention – n (%) 2263 (54.1) 2424 (55.9) 2678 (58.1) 2530 (58.1) 2533 (58.3) <.001 CABG – n (%) 1143 (27.3) 1006 (23.2) 1102 (23.9) 1043 (24.0) 970 (22.3) <.001 Stroke – n (%) 233 (5.6) 194 (4.5) 148 (3.2) 152 (3.5) 171 (3.9) <.001
Transient ischemic attack – n (%) 169 (4.0) 167 (3.9) 127 (2.8) 146 (3.4) 115 (2.6) <.001
Peripheral artery disease – n (%) 498 (11.9) 464 (10.7) 465 (10.1) 430 (9.9) 407 (9.4) .0017
Hospitalization for chronic heart failure – n (%) 374 (8.9) 245 (5.7) 193 (4.2) 173 (4.0) 163 (3.7) <.001 Treated hypertension – n (%) 3223 (77.0) 3183 (73.5) 3209 (69.6) 2993 (68.8) 2940 (67.6) <.001 Diabetes – n (%)† 1717 (41.0) 1312 (30.3) 1289 (28.0) 1152 (26.5) 994 (22.9) <.001 Dyslipidemia – n (%)† 3059 (73.1) 3265 (75.4) 3588 (77.8) 3326 (76.4) 3374 (77.6) <.001 Atrial fibrillation/flutter – n (%) 347 (8.3) 335 (7.7) 332 (7.2) 274 (6.3) 299 (6.9) .005 Asthma/chronic obstructive pulmonary disease – n (%) 362 (8.6) 363 (8.4) 369 (8.0) 354 (8.1) 326 (7.5) .37 Smoking status – n (%) <.001 Current 301 (7.2) 463 (10.7) 543 (11.8) 601 (13.8) 835 (19.2) Former 1561 (37.3) 1822 (42.0) 2274 (49.3) 2299 (52.8) 2210 (50.8)
M
AN
US
CR
IP
T
AC
CE
PT
ED
Hemoglobin quintile P Value*
Quintile 1 (<12.80 g/dL) (n = 4186) Quintile 2 (12.80-13.69 g/dL) (n = 4333) Quintile 3 (13.70-14.40 g/dL) (n = 4610) Quintile 4 (14.41-15.20 g/dL) (n = 4353) Quintile 5 (>15.20 g/dL) (n = 4347) No chronic heart failure symptoms
– n (%)†
3396 (81.1) 3556 (82.1) 3893 (84.4) 3693 (84.8) 3618 (83.2) <.001
No physical activity – n (%)† 992 (23.7) 743 (17.1) 635 (13.8) 540 (12.4) 517 (11.9) <.001
Data are presented as mean ± SD, number (percentage), or median (Q1-Q3). CABG = coronary artery bypass graft; Q = quartile; SD = standard deviation. *For differences across quintiles.
†Diabetes or dyslipidemia reflects a history of these conditions. Patients were asked regarding symptoms of heart failure – this was categorized according to either New York Heart Association class or absent. Physical activity was graded according to the amount undertaken per week.
M
AN
US
CR
IP
T
AC
CE
PT
ED
Table 2 Clinical and physiologic findings according to hemoglobin quintiles. Total no. with data available Hemoglobin quintile P value* Quintile 1 (<12.80 g/dL) (n = 4186) Quintile 2 (12.80-13.69 g/dL) (n = 4333) Quintile 3 (13.70-14.40 g/dL) (n = 4610) Quintile 4 (14.41-15.20 g/dL) (n = 4353) Quintile 5 (>15.20 g/dL) (n = 4347)
Heart rate palpation − bpm 21,814 69.7 ± 11.1 68.0 ± 10.5 67.6 ± 10.7 67.3 ± 10.2 68.1 ± 10.6 <.001
Systolic BP − mm Hg 21,817 132 ± 18 132 ± 17 131 ± 16 131 ± 16 131 ± 16 <.001
Diastolic BP − mm Hg 21,817 76 ± 11 77 ± 10 77 ± 10 78 ± 10 79 ± 10 <.001
LVEF − % 16,209 54.5 ± 12.0 56.3 ± 10.9 55.8 ± 10.6 56.3 ± 10.8 56.4 ± 10.8 <.001
Fasting blood glucose − mmol/L 19,689 5.8 (5.1-7.0) 5.6 (5.0-6.6) 5.6 (5.1-6.6) 5.7 (5.1-6.6) 5.6 (5.1-6.4) <.001
Total cholesterol − mg/dL 20,681 162.1 (135.1-193.0) 166.0 (142.8-193.0) 166.0 (139.0-193.0) 166.0 (142.8-193.0) 166.0 (142.8-196.9) <.001 High-density lipoprotein − mg/dL 18,219 43.2 (36.3-53.3) 45.2 (38.2-54.0) 44.0 (37.4-53.3) 43.2 (37.1-52.1) 42.5 (36.7-50.2) <.001 Fasting triglycerides − mg/dL 19,072 115.1 (88.5-168.2) 123.9 (88.5-168.2) 123.9 (88.5-168.2) 123.9 (88.5-177.0) 132.8 (97.4-177.0) <.001 eGFR (CKD-EPI) − mL/min/1.73
m2
18,496 68.2 (51.7-85.6) 74.8 (60.9-88.7) 77.7 (64.2-90.4) 79.1 (66.7-91.6) 80.3 (67.7-92.2) <.001
Data are presented as mean ± SD or median (Q1-Q3).
BP = blood pressure; bpm = beats per minute; CKD-EPI = Chronic Kidney Disease-Epidemiology Collaboration; eGFR = estimated glomerular filtration rate; LVEF = left ventricular ejection fraction; Q = quartile; SD = standard deviation.
*For differences across quintiles.
M
AN
US
CR
IP
T
AC
CE
PT
ED
Table 3 Drug treatment for patients with available data according to baseline hemoglobin quintile
Variable No. Hemoglobin quintile P value*
Quintile 1 (<12.80 g/dL) (n = 4186) Quintile 2 (12.80-13.69 g/dL) (n = 4333) Quintile 3 (13.70-14.40 g/dL) (n = 4610) Quintile 4 (14.41-15.20 g/dL) (n = 4353) Quintile 5 (>15.20 g/dL) (n = 4347) Antiplatelet – n (%) Aspirin 21,827 3588 (85.7) 3825 (88.3) 4093 (88.8) 3870 (88.9) 3859 (88.8) <.001 Thienopyridine 21,827 1330 (31.8) 1220 (28.2) 1273 (27.6) 1134 (26.1) 1106 (25.5) <.001 Other antiplatelet 21,827 439 (10.5) 427 (9.9) 441 (9.6) 409 (9.4) 318 (7.3) <.001 Oral anticoagulant – n (%) 21,827 413 (9.9) 334 (7.7) 319 (6.9) 307 (7.1) 364 (8.4) <.001
Oral anticoagulant in atrial fibrillation†
1,702 173 (45.8) 166 (46.5) 148 (41.9) 123 (41.8) 148 (46.3) .56
Neither antiplatelet nor oral anticoagulant – n (%) 21,829 78 (1.9) 73 (1.7) 63 (1.4) 59 (1.4) 77 (1.8) .19 Beta-blocker – n (%) 21,828 3200 (76.4) 3278 (75.7) 3497 (75.9) 3281 (75.4) 3278 (75.4) .78 Ivabradine – n (%) 21,827 482 (11.5) 540 (12.5) 558 (12.1) 449 (10.3) 404 (9.3) <.001 Calcium antagonist – n (%) 21,826 1272 (30.4) 1275 (29.4) 1209 (26.2) 1116 (25.6) 1106 (25.5) <.001 Long-acting nitrate – n (%) 21,828 1209 (28.9) 1074 (24.8) 1002 (21.7) 862 (19.8) 817 (18.8) <.001
ACE inhibitor or ARB – n (%) 21,827 3277 (78.3) 3353 (77.4) 3596 (78.0) 3304 (75.9) 3235 (74.5) <.001
ACE inhibitor 21,827 1990 (47.5) 2169 (50.1) 2467 (53.5) 2384 (54.8) 2369 (54.5) <.001
ARB 21,825 1407 (33.6) 1284 (29.6) 1221 (26.5) 986 (22.7) 932 (21.4) <.001
Lipid-lowering drug – n (%) 21,829 3855 (92.1) 4060 (93.7) 4337 (94.1) 4079 (93.7) 4077 (93.8) .002
Statin 21,829 3453 (82.5) 3652 (84.3) 3905 (84.7) 3686 (84.7) 3728 (85.8) .001
Diuretic – n (%) 21,828 1707 (40.8) 1407 (32.5) 1293 (28.0) 1101 (25.3) 1050 (24.2) <.001
Other antihypertensive drug – n (%)
21,826 433 (10.3) 321 (7.4) 325 (7.0) 285 (6.5) 252 (5.8) <.001
NSAID – n (%) 21,824 241 (5.8) 225 (5.2) 230 (5.0) 198 (4.6) 163 (3.8) <.001
Proton pump inhibitor – n (%) 21,827 1337 (31.9) 1250 (28.8) 1303 (28.3) 1006 (23.1) 1004 (23.1) <.001
Antidiabetic drug – n (%) 21,828 1495 (35.7) 1118 (25.8) 1086 (23.6) 959 (22.0) 808 (18.6) <.001
ACE = angiotensin converting enzyme; ARB, angiotensin receptor blocker; NSAID, nonsteroidal anti-inflammatory drug. *For differences across quintiles.
M
AN
US
CR
IP
T
AC
CE
M
AN
US
CR
IP
T
AC
CE
M
AN
US
CR
IP
T
AC
CE
M
AN
US
CR
IP
T
AC
CE
M
AN
US
CR
IP
T
AC
CE
M
AN
US
CR
IP
T
AC
CE
PT
ED
• Patients with stable coronary artery disease and low hemoglobin are at increased risk of mortality, cardiovascular death/myocardial infarction/stroke, and major bleeding.
• Normalizing anemic hemoglobin levels may decrease risk of mortality and cardiovascular events.
• Hemoglobin levels in stable coronary artery disease should be tested and, if possible, corrected.
• It is not known whether low hemoglobin has a role in cardiovascular events and/or is a marker of comorbidities.
M
AN
US
CR
IP
T
AC
CE
PT
ED
Appendix 2. Four-year outcomes according to baseline hemoglobin status in men and in women Men
Outcome Level No. with event / No. in
group
HR (95% CI) Individual p-values Overall p-value
All Cause Death - Univariate 1: Quintile 1 349 / 3299 2.08 (1.74, 2.5) <0.0001 2: Quintile 2 254 / 3769 1.27 (1.05, 1.55) 0.0147 3: Quintile 3 170 / 3170 1.00 (-) <0.0001 4: Quintile 4 158 / 3295 0.89 (0.72, 1.11) 0.3021 5: Quintile 5 162 / 3354 0.91 (0.73, 1.12) 0.3742
All Cause Death - Adjusted for age, geographical region, smoking status, dyslipidemia, MI, PCI, CABG, SBP, DBP, LVEF, Diabetes, PAD, Asthma/COPD and baseline renal function
1: Quintile 1 300 / 2822 1.35 (1.1, 1.66) 0.0040 2: Quintile 2 223 / 3214 1.13 (0.91, 1.39) 0.2647 3: Quintile 3 143 / 2627 1.00 (-) 0.0017 4: Quintile 4 132 / 2763 0.91 (0.72, 1.16) 0.4535 5: Quintile 5 144 / 2835 1.01 (0.8, 1.27) 0.9534 Cardiovascular Death - Univariate 1: Quintile 1 158 / 3299 1.92 (1.48, 2.51) <0.0001 2: Quintile 2 103 / 3769 1.06 (0.79, 1.41) 0.7067 3: Quintile 3 83 / 3170 1.00 (-) <0.0001 4: Quintile 4 75 / 3295 0.87 (0.63, 1.18) 0.3702 5: Quintile 5 78 / 3354 0.89 (0.66, 1.22) 0.4745 Cardiovascular Death - Adjusted for age, geographical region, smoking status, dyslipidemia, MI, PCI, CABG, SBP, DBP, LVEF, Diabetes, PAD, Asthma/COPD and baseline renal function
1: Quintile 1 139 / 2822 1.39 (1.02, 1.89) 0.0347 2: Quintile 2 87 / 3214 1 (0.72, 1.39) 0.9817 3: Quintile 3 63 / 2627 1.00 (-) 0.0799 4: Quintile 4 64 / 2763 1.02 (0.72, 1.44) 0.9261 5: Quintile 5 69 / 2835 1.05 (0.75, 1.49) 0.7730 1: Quintile 1 123 / 3299 1.99 (1.47, 2.7) <0.0001 2: Quintile 2 109 / 3769 1.48 (1.08, 2.01) 0.0140
M
AN
US
CR
IP
T
AC
CE
PT
ED
Non-Cardiovascular Death - Univariate 3: Quintile 3 63 / 3170 1.00 (-) <0.0001 4: Quintile 4 60 / 3295 0.91 (0.64, 1.3) 0.6214 5: Quintile 5 54 / 3354 0.82 (0.57, 1.17) 0.2745 1: Quintile 1 102 / 2822 1.11 (0.8, 1.55) 0.5257 2: Quintile 2 97 / 3214 1.16 (0.84, 1.6) 0.3767 Non-Cardiovascular Death - Adjusted for age, geographical region, smoking status, dyslipidemia, MI, PCI, CABG, SBP, DBP, LVEF, Diabetes, PAD, Asthma/COPD and baseline renal function3: Quintile 3 60 / 2627 1.00 (-) 0.1105 4: Quintile 4 48 / 2763 0.79 (0.54, 1.16) 0.2250 5: Quintile 5 46 / 2835 0.8 (0.54, 1.18) 0.2642 1: Quintile 1 278 / 3296 1.34 (1.12, 1.6) 0.0015 2: Quintile 2 213 / 3769 0.86 (0.71, 1.04) 0.1151 CV Death, MI or stroke - Univariate 3: Quintile 3 210 / 3167 1.00 (-) <0.0001 4: Quintile 4 169 / 3289 0.77 (0.63, 0.94) 0.0115 5: Quintile 5 203 / 3351 0.92 (0.76, 1.12) 0.3957 1: Quintile 1 245 / 2819 1.13 (0.93, 1.39) 0.2236 2: Quintile 2 186 / 3214 0.86 (0.7, 1.06) 0.1539 CV Death, MI or stroke - Adjusted for age, geographical region, smoking status, dyslipidemia, MI, PCI, CABG, SBP, DBP, LVEF, Diabetes, PAD, Asthma/COPD and baseline renal function
3: Quintile 3 169 / 2624 1.00 (-) 0.0161
4: Quintile 4 144 / 2758 0.82 (0.66, 1.02) 0.0804
5: Quintile 5 169 / 2833 0.94 (0.76, 1.17) 0.6016
M
AN
US
CR
IP
T
AC
CE
PT
ED
2: Quintile 2 53 / 3647 1.82 (1.13, 2.93) 0.0135 Major Bleeding - Univariate 3: Quintile 3 25 / 3094 1.00 (-) <0.0001 4: Quintile 4 33 / 3196 1.27 (0.76, 2.14) 0.3644 5: Quintile 5 33 / 3257 1.26 (0.75, 2.12) 0.3804 1: Quintile 1 58 / 2710 2.22 (1.34, 3.66) 0.0019 2: Quintile 2 46 / 3112 1.63 (0.98, 2.72) 0.0598 Major Bleeding - Adjusted for age, geographical region, smoking status, dyslipidemia, MI, PCI, CABG, SBP, DBP, LVEF, Diabetes, PAD, Asthma/COPD and baseline renal function3: Quintile 3 22 / 2574 1.00 (-) 0.0174
4: Quintile 4 29 / 2691 1.29 (0.74, 2.25) 0.3662
5: Quintile 5 28 / 2757 1.34 (0.76, 2.35) 0.3066
Women
Outcome Level No. with event / No. in
group HR (95% CI) Individual p-values Overall p-value
All Cause Death - Univariate 1: Quintile 1 112 / 954 2.16 (1.57, 2.96) <0.0001 2: Quintile 2 58 / 1080 0.93 (0.65, 1.33) 0.6821 3: Quintile 3 59 / 1007 1.00 (-) <0.0001 4: Quintile 4 46 / 895 0.88 (0.6, 1.29) 0.5029 5: Quintile 5 46 / 1003 0.79 (0.54, 1.16) 0.2271
All Cause Death - Adjusted for age, geographical region, smoking status, dyslipidemia, MI, PCI, CABG, SBP, DBP, LVEF, Diabetes, PAD,
1: Quintile 1 98 / 840 1.33 (0.93, 1.91) 0.1156
2: Quintile 2 52 / 901 0.82 (0.56, 1.21) 0.3182
3: Quintile 3 52 / 843 1.00 (-) 0.0415
4: Quintile 4 43 / 774 0.93 (0.62, 1.4) 0.7260
M
AN
US
CR
IP
T
AC
CE
PT
ED
baseline renal function
Cardiovascular Death - Univariate 1: Quintile 1 49 / 954 1.73 (1.11, 2.7) 0.0162 2: Quintile 2 27 / 1080 0.8 (0.48, 1.33) 0.3801 3: Quintile 3 32 / 1007 1.00 (-) <0.0001 4: Quintile 4 14 / 895 0.49 (0.26, 0.92) 0.0269 5: Quintile 5 24 / 1002 0.76 (0.45, 1.29) 0.3051 Cardiovascular Death - Adjusted for age, geographical region, smoking status, dyslipidemia, MI, PCI, CABG, SBP, DBP, LVEF, Diabetes, PAD, Asthma/COPD and baseline renal function
1: Quintile 1 44 / 840 1.04 (0.62, 1.75) 0.8756 2: Quintile 2 25 / 901 0.71 (0.41, 1.24) 0.2291 3: Quintile 3 27 / 843 1.00 (-) 0.2535 4: Quintile 4 13 / 774 0.55 (0.28, 1.07) 0.0803 5: Quintile 5 22 / 870 0.86 (0.49, 1.52) 0.6040 Non-Cardiovascular Death - Univariate 1: Quintile 1 46 / 954 2.77 (1.62, 4.73) 0.0002 2: Quintile 2 21 / 1080 1.04 (0.56, 1.94) 0.8939 3: Quintile 3 19 / 1007 1.00 (-) <0.0001 4: Quintile 4 18 / 895 1.06 (0.56, 2.03) 0.8498 5: Quintile 5 14 / 1002 0.75 (0.37, 1.49) 0.4034 Non-Cardiovascular Death - Adjusted for age, geographical region, smoking status, dyslipidemia, MI, PCI, CABG, SBP, DBP, LVEF, Diabetes, PAD, Asthma/COPD and baseline renal function
1: Quintile 1 38 / 840 1.69 (0.93, 3.06) 0.0842 2: Quintile 2 21 / 901 1 (0.53, 1.89) 0.9981 3: Quintile 3 18 / 843 1.00 (-) 0.0879 4: Quintile 4 16 / 774 0.99 (0.5, 1.95) 0.9754 5: Quintile 5 12 / 870 0.69 (0.33, 1.45) 0.3318 CV Death, MI or stroke - Univariate 1: Quintile 1 78 / 952 1.62 (1.14, 2.28) 0.0065 2: Quintile 2 65 / 1078 1.12 (0.78, 1.6) 0.5368 3: Quintile 3 55 / 1005 1.00 (-) 0.0047 4: Quintile 4 41 / 894 0.84 (0.56, 1.26) 0.4009 5: Quintile 5 55 / 1001 1.01 (0.7, 1.47) 0.9470 CV Death, MI or stroke - Adjusted for age,
1: Quintile 1 69 / 838 1.21 (0.82, 1.77) 0.3432
M
AN
US
CR
IP
T
AC
CE
PT
ED
geographical region, smoking status, dyslipidemia, MI, PCI, CABG, SBP, DBP, LVEF, Diabetes, PAD, Asthma/COPD and baseline renal function3: Quintile 3 48 / 841 1.00 (-) 0.7928 4: Quintile 4 40 / 774 0.94 (0.61, 1.43) 0.7652 5: Quintile 5 49 / 869 1.04 (0.7, 1.56) 0.8402 Major Bleeding - Univariate 1: Quintile 1 19 / 915 1.27 (0.66, 2.45) 0.4699 2: Quintile 2 12 / 1049 0.67 (0.32, 1.39) 0.2795 3: Quintile 3 17 / 982 1.00 (-) 0.1887 4: Quintile 4 10 / 871 0.66 (0.3, 1.44) 0.2970 5: Quintile 5 10 / 973 0.6 (0.27, 1.3) 0.1934 Major Bleeding - Adjusted for age, geographical region, smoking status, dyslipidemia, MI, PCI, CABG, SBP, DBP, LVEF, Diabetes, PAD, Asthma/COPD and baseline renal function
1: Quintile 1 17 / 809 1.12 (0.53, 2.35) 0.7669
2: Quintile 2 10 / 874 0.65 (0.29, 1.47) 0.3009
3: Quintile 3 14 / 823 1.00 (-) 0.4370
4: Quintile 4 8 / 754 0.61 (0.26, 1.47) 0.2747
5: Quintile 5 9 / 845 0.62 (0.27, 1.45) 0.2700
CABG, coronary artery bypass graft; CI, confidence interval; COPD, chronic obstructive pulmonary disease; DBP, diastolic blood pressure; HR, hazard ratio; LVEF, left ventricular ejection fraction; MI, myocardial infarction; PAD, peripheral artery disease; PCI, percutaneous coronary intervention; SBP, systolic blood pressure.