1
Index
Abstract pag. 3
1. Introduction pag. 5
1.1 The immune system
1.2 The T cell receptor (TCR)
1.3 The Immune Tolerance
1.4 Regulatory T cells (Treg)
1.5 Metabolism and immunity
1.6 Nutraceutical compounds and pro-inflammatory activity control in vitro
1.7 Myelodysplastic Syndromes: a model to study deranged immune effectors inside an inflammatory microenvironment
1.8 Co-expression of CD3 and CD56 molecule as a marker of a new regulatory T cell subset
2. Aim pag. 12
3. Materials and methods pag. 13
3.1 Immune dysregulation and Myelodysplastic Syndromes pag. 13 Patients and controls
mAb, immunofluorescence and flow cytometry
Statistical analysis
3.2 mTOR modulation and tolerance in kidney transplanted patients pag. 14 Study population
Study protocol
Immunofluorescence and T cell activation
Statistical analysis
3.3 Study of in vitro effects of Nutraceutical compounds on pro-inflammatory T cell profile pag. 16
Culture Medium and Botanicals
Statistical Analysis
3.4 Study of CD3+CD56+ cell subset pag. 17
Monoclonal antibodies, immunofluorescence, flow cytometry and cell sorting Cell culture, CD107/LAMP-1 expression and cytokine production
Proliferation assay Statistical analysis
4. Results and Discussion pag. 19
4.1 Immune dysregulation and Myelodysplastic Syndromes pag. 19 Treg increase and decreased expression of CD54 on CD8+ T cells in BM associate with MDS
progression
Reduced BM Treg levels in Low Risk MDS patients are significantly associated with increased BM recruitment of CD8+T cells
Clonal expansion and activation status of CD8+ T cells in BM of Low risk MDS patients
inversely correlates with BM Treg percentage
Grouping of Low Risk MDS individuals according to their BM Treg level identifies a subgroup of patients showing a skewed CD8 T cell repertoire in BM, lesser leukaemia evolution and better survival in a minimal 36 month follow
4.2 mTOR modulation and tolerance of kidney transplants pag. 24 Effect of conversion from CNI to Everolimus on immune profile
Effect of Everolimus on Treg number and proliferation
Everolimus serum concentration associates with different levels of mTOR-dependent S6 kinase Phosphorylation
4.3 Study of in vitro effects of nutraceutical compounds on pro-inflammatory cytokine
production by T cell effectors pag. 28
Nutraceutical compounds co-culture is able to modulate in vitro IFN- production by human T cells
4.4 A study of cell-mediated regulation of T cell-dependent cytotoxic effector functions:
characterization of the CD3+CD56+ T cell subset as a novel regulatory cell population pag. 29 TR3-56 are able to modulate antigen-dependent cytotoxicity and interferon- production by CD8+
T cells
TR3-56 cells can be induced in vitro and require cell-to-cell contact to exert their regulatory
activity
5. Conclusions pag. 36
6. Acknowledgements pag. 38
7. References pag. 39
3
Abstract
Immune response is based on a complex molecular and cellular network able to ensure protection against pathogens and simultaneously maintain tissue homeostasis. Multiple immunoregulatory processes are physiologically involved in preventing potentially deleterious immune reactions against self tissues. The key role of regulatory immune cell populations, as
represented by CD4+CD25+Foxp3+ Treg cells, in induction and maintenance of immunological
tolerance has been largely demonstrated.
Aim of this study is to investigate on cell-dependent control of immune response in physiological conditions as well as in the context of immune-mediated diseases, also addressing the possibility to modulate deranged immune effectors.
With this purpose we focused: i. a human model of autoimmunity, as represented by a subgroup of patients affected by Myelodysplastic Syndrome (MDS), a hematological disorder characterized by immune-mediated selection and expansion of pathological stem precursors; ii. human and animal models of pharmacological and metabolic immune-modulation; iii. the functional analysis of a T cell population, characterized by the co-expression of CD3 and CD56 molecules, whose quantitative defect has been observed in autoimmune diabetes.
Immune-response has been largely recognised as a finely tuned micro-site process. Thus, the possibility to focus cell-mediated immune tolerance control in Bone Marrow (BM), the microenvironment in which immune-mediated selection of pathological stem precursor takes place, represent a powerful analysis tool to investigate on MDS pathogenesis. Our study of BM T cell repertoire revealed an inverse correlation between BM Treg levels, activation status and BM clonal
expansion of CD8+ T lymphocytes in MDS patients. Thus, BM Treg were proposed to represent a
key element for the control of the deranged immune effectors in an inflammatory microenvironment.
Cross talk between immune response and metabolism is still largely undefined. Particularly, Treg availability has been observed in vitro to specifically depend on the oscillatory activity of the mammalian Target Of Rapamycin (mTOR), a Serine/Threonine kinase playing a key role in regulating cell growth and metabolism in response to nutritional cues. The employment of mTOR pharmacological inhibition for the control of tumour cell growth has been largely described. We found that dosage and administration schedule of the mTOR inhibitor Everolimus, able to ensure mTOR oscillatory activity, is relevant to induce immune-tolerance rather than inhibition of cell growth in a model of tolerance induction, as represented by allogeneic kidney transplant.
Our study also addressed the possibility to use nutraceutical compounds, by us selected for their immune-modulating effects in a veterinary model of chronic infection, to control immune effector activity in vitro. Our data are conceivable with the possibility to employ these substances as pharmacological co-adjuvants to modulate pro-inflammatory activity in contexts of altered immune homeostasis.
Co-expression of CD3 and CD56 molecules identifies a lymphocyte population whose functional activity is largely undefined. A severe reduction of this cells has been associated with the
extent of β-cell loss in patients affected by type 1 diabetes. We found that CD3+CD56+
lymphocytes, by us named TR3-56, represent a distinct subgroup of T lymphocytes, able to
preferentially modulate effector function of cytotoxic T cells. Indeed, the co-culture of TR3-56 with
CD8+ effector cells mediates significant inhibition of their cytotoxic activity and IFN- γ production.
No effects were observed when cytotoxic T cells were cultured with NK, CD4 or CD8 T lymphocytes. A contact-dependent mechanism has been observed to underlie immune-modulating activity of TR3-56 cells.
A better knowledge of cell mediated processes involved in immune-tolerance control is expected to significantly improve the availability of innovative immune-modulating strategies, thus ameliorating clinical management of immune-mediated disorders.
5
1. Introduction
1.1 The immune system
The immune system represents a complex network of molecular and cellular mediators ensuring effective defense against pathogens together with tissue homeostasis maintenance. It is organized in two compartments, innate immunity and adaptive immunity, that coordinate their activity in order to maximize immune functions.
The innate immunity represents the first defence-line of both vertebrate and non-vertebrate organisms. It is based on the availability of a molecular machinery able to directly recognize and consequently destroy potentially harmful agents as well as damaged self tissues. Indeed, a series of molecular structures, (TLR, NOD, RIG) enable innate immune effectors to rapidly recognize the Pathogen Associated Molecular Patterns (PAMP), representing molecular targets specifically expressed by foreign, potentially invading organisms. In addition, Natural Killer cells evaluate cell integrity trough a complex repertoire of surface receptors. Thus, the possibility to directly recognize a dangerous diversity inside tissues is the basis for molecular and cellular innate defense mechanisms. Direct induction of microrganism-lysis (Complement), phagocytosis, as well as apoptosis induction of infected or damaged autologous cells are the main mechanisms employed by innate immune compartment (1).
The adaptive immune response (Figure 1), also called acquired, is highly specific and is able to "remember" and to respond more effectively to repeated exposure to a specific pathogen. Its recognition strategy involves a high variable repertoire of receptors generated by clonal gene rearrangement strategies; these receptors are able to recognize a wide range (billions) of molecular
specificities, but are unable per se to distinguish self and non-self structures (2).
The adaptive immunity can be distinguished in humoral immunity, mediated by antibody, and cell-mediated immunity, dependent on helper (CD4+) and cytotoxic (CD8+) T lymphocytes. Helper
T cells (TH) are a key element for the orchestration of immune response; indeed, they are able to
improve phagocytic activity of innate cells and to optimize humoral and cytotoxic functions. Moreover, their activity is plastically dependent on the differentiation of peculiar cytokine production profile (Figure 2), usually defined as proinflammatory (TH1, TH17) or non-inflammatory
(TH2). The TH1 response is characterized by the production of Interferon-gamma (IFN-γ) which
optimizes the bactericidal macrophages capability, induces pathogen-opsonization and optimizes
cytotoxic T lymphocyte (CTL) response. The TH2 response is characterized by the release of
Interleukin-4, IL-5, IL-10, IL-13 which results in the activation of B cells to make neutralizing non-cytolytic antibodies, leading to "humoral non-inflammatory immunity" (3).
Figure 2: Plasticity of cytokine profile acquirement by helper CD4 T cells. O’Shea &W. Paul, Mechanisms Underlying Lineage Commitment and Plasticity of Helper CD4+ T Cells. Science 2010; 327:1098-110.
T lymphocytes are unable to recognize native antigens. Indeed, only peptides, expressed on the surface of Antigen Presenting Cells (APC) in association with Major Histocompatibility Complex (MHC) molecules, are specifically recognized by the T Cells Receptor (TCR).
1.2 The T cell receptor (TCR)
The TCR is a membrane glycoprotein constituted by two polypeptide chain, called α and β chain, each showing a constant (C) and a variable (V) region. The variable region has three handles, called Complementary Determining Regions (CDR), representing the hypervariable regions that form the binding site for the antigen-MHC complexes.
The possibility of T lymphocytes to recognize a wide number of specificities is due to TCR diversity. It is generated, on clonal basis, during T lymphocytes development thanks to the presence
7
of RAG recombinase enzymes. Gene rearrangement of V and J genes for α chain variable region and of V, D, and J genes for β chain variable region are key events for TCR generation (1).
Each T clone expresses only a TCR type. Therefore, the TCR, that marks a single T clone, is characterized by the presence of the particular V gene segment used to build the receptor during the gene rearrangement processes (1). When a T cell clone recognizes a foreign substance it undergoes a
clonal expansion.
The TCR ligands are represented by the complex of antigenic peptide-MHC molecule expressed on APC cells. The MHC molecules are divided into two classes, the MHC class I and MHC class II that are recognized by different T cells. The cytotoxic lymphocytes bind endogenous
antigens associated to MHC class I molecules; instead, the helper T cells recognize, in association with MHC class II, exogenous antigens. This recognition strategy, called restriction, allows T cells to obtain specific information about pathogen intracellular localization. Indeed, MHC Class I molecules preferential binds intracellular molecules, while MHC Class II antigens are mainly associated with extracellular antigens (2).
The TCR-binding to MHC-ligand complex is usually insufficient to achieve antigen-dependent naïve T cell activation. In order to allow adaptive response, a second signal (co-stimulation), generally delivered by innate compartment after recognition of microbial molecules, is able to place the TCR-recognized antigen, in a danger frame. Binding of CD28 molecule, expressed by T lymphocytes, with CD80/CD86 costimulatory molecules, expressed by APC, represents the main second signal delivering system, able to avoid harmful T cell activation against autologous, non-dangerous targets (2).
1.3 The Immune Tolerance
Due to inability of adaptive recognition repertoire to distinguish self from non-self/dangerous structures, a complex network of cellular and molecular mechanisms usually controls physiological adaptive immune response (Figure 3). Particularly, we define central immune tolerance the selection processes of adaptive repertoire taking place in primary lymphoid organs, thymus for T
lymphocytes and bone marrow for B lymphocytes (1). Moreover, a number of redundant
mechanisms, belonging to peripheral tolerance control, usually provide to inactivate the auto-reactive T and B cell clones that, despite central selection, are physiologically present in the adaptive repertoire.
Figure 3: A scheme of immune tolerance mechanisms. From Abul K. Abbas, Cellular and Molecular Immunology, Elsevier Inc.
A key role in peripheral tolerance control is played by regulatory cell populations mainly represented by the Treg subset, characterized by the expression of the fork head box protein 3 (Foxp3) Transcription Factor (1).
1.4 Regulatory T cells (Treg)
Treg are a subpopulation of CD4+ T lymphocytes (generally, 5-10% of CD4 population)
expressing high levels of the α chain of the interleukin-2 receptor (IL-2R or CD25) together with Foxp3 (4). Treg originate in thymus (natural Treg o nTreg) or in tissue by differentiation of CD4+ T
cells in a microenvironment characterized by high levels of Transforming Growth Factor (TGF)-β, in the absence of IL-6 production. Survival and function of Treg is dependent on the presence of IL-2 (4). Indeed, expression of high affinity IL-2R on their surface and signalling through IL-2R are
required for optimal Treg function. Treg act with different mechanisms: direct inhibition of APC cells, secretion of anti-inflammatory cytokines (IL-10 and TGF-β), inhibition of effector cells by direct contact, induction of T cells death by deprivation of IL-2, their growth factor. Moreover, Treg cells have been observed to regulate tissue homeostasis, also affecting neo-angiogenesis processes (5). Depletion of Treg results in development of autoimmune disorders (6). Thus, the
control of Treg availability and function has been largely suggested as a critical element for fine tuning of immune response.
1.5 Metabolism and immunity
Recent observations indicate that nutrient availability influences immune system functions. Indeed, nutrient deprivation has been associated with defects in adaptive immunity activation and
9
epidemiological studies refer the failure of immunological responsiveness in hypo-nutrition conditions. Instead, high caloric intake in industrialized countries has been associated with reduced infections and increased risk of autoimmune disorders (7,8). Moreover, adipose tissue has been
observed to produce inflammatory cytokines and adipocytokines that favor activation of pro-inflammatory immune cells including those with an autoreactive potential (9-11). In this contest, a
key role is performed by the mammalian Target of Rapamycin (mTOR), the main intracellular nutrient sensor (12) (Figure 4). It is a serine-threonine kinase that regulates cell growth, glycolysis
and nucleotide synthesis.
A number of data indicate that effector T lymphocytes and Treg are characterized by distinct metabolic profiles (13). Indeed, effector T cells contain inactive mTOR, unable to sustain their
growth, while active mTOR molecules, present in Treg, underlie their proliferation in vivo. These observations are conceivable with the opposite effects exerted in vitro by pharmacological mTOR inhibition of T cell effectors or Treg (14). Indeed, the mTOR inhibitor rapamycin is able to inhibit
effector T cells growth, while restoring TCR-dependent Treg proliferation (15,16).
Figure 4: A simplified model of mammalian target of rapamycin (mTOR) signaling. From Pollizzi and Powell. Regulation of T cells by mTOR: the known knowns and the known unknowns. Trends in Immunology 2015; 36:13.
Thus, the activation of mTOR represents a key environmental signal for the plasticity of adaptive cells that may use metabolic pathways to finely tune their fate and function. In particular, the intracellular metabolic balance of Treg, strictly dependent on extracellular environment, regulates proliferation or quiescence of these cells highlighting the importance of metabolism for immune system control (13).
The standard treatment for kidney transplantation is currently represented by calcineurin inhibitors (CNI) whose chronic use can cause cardiovascular disease, as well as graft dysfunction
therapeutic alternative for effective immune modulation in this condition. A number of data refer the use of mTOR inhibitors (Rapamicin and/or Everolimus) to treat solid and hematological malignancies. The possibility to establish specific schedule and administration strategies in order to obtain immune modulation instead of cell death, represents a key investigation issue.
1.6 Nutraceutical compounds and pro-inflammatory activity control in vitro.
A deranged regulation of the immune system represents a key element for the pathogenesis of immune-mediated diseases (20,21). In particular, the exacerbation and endurance of T
H1 response,
based on a pathological production of IFN-γ, has been largely associated with inflammatory and
autoimmune diseases (22,23). Several studies have been suggesting the anti-inflammatory and
antioxidant properties of some botanicals (24-28). Moreover, previous studies evidenced the
immune-modulating effects of a nutraceutical diet in dogs affected by Canine Leishmaniosis, a model of natural chronic infection (29). In this context, the evaluation of in vitro effects of the botanical
substances, contained in the nutraceutical canine food on cytokine production by human and animal lymphocytes, represents an interesting field of investigation to provide useful information about the possibility modulate human inflammatory immune response by using metabolic tools.
1.7 Myelodysplastic Syndromes: a model to study deranged immune effectors inside an inflammatory microenvironment.
Myelodysplastic Syndromes (MDS) are clonal haematological disorders characterised by emergence, dominance and expansion of dysplastic progenitor/s in the context of ineffective haematopoiesis, peripheral cytopenia/s and increased risk to develop Acute Myeloid Leukaemia (AML).
The pathogenesis of the disease is not still well defined; cytogenetic and molecular abnormality as well as an altered medullar microenvironment are involved in the selection and clonal expansion of the dysplastic precursor/s (30,31). Several data have been suggesting the involvement of an altered
immune tolerance control in MDS pathogenesis (32). Indeed, an autoimmune attack to normal Bone
Marrow (BM) precursors by deranged adaptive effectors as well as the activity of bystander T cells, recruited during an immune-response against dysplastic antigens, can be hypothesised to be relevant for the selection of dysplastic clones that are able to escape to immune-mediated damage.
The study of the Treg cells, involved in negative control of immune response, in MDS patients suggests that these cells can play two opposite pathogenic roles (33,34). Indeed, functional defects
11
stages of MDS have been consistently found (33-35). These data support the hypothesis that in the
advanced stage of the disease, the increase of the regulatory cells might promote the suppression of the immune response against the dysplastic clones fostering AML progression while, in the early stage of MDS, Treg defects can enhance activity of cytotoxic immune effectors against normal BM precursors, favoring selection of the dysplastic clone/s. Therapeutic efficacy of immune-suppressive drugs (mainly anti-T lymphocyte sera with or without Cyclosporin A) in a group of MDS patients (36,37) strongly supports such hypothesis. The possibility to correctly identify the
subgroup of MDS patients susceptible to immune-modulating therapy represents a key element to optimize clinical management of the disease. In this context, the analysis of the Treg role in the inflammatory microsite, the BM, is a key element to propose immune-modulating strategies able to control the pathological selection of dysplastic stem precursors in MDS.
1.8 Co-expression of CD3 and CD56 molecule as a marker of a new regulatory T cell subset.
The key role of deranged cytotoxic effectors in the pathogenesis of immune-mediated disorders has been largely recognized (38). Together with the classical regulatory cells, represented by the
CD4+CD25+Foxp3+ (Treg) cells, a number of experimental data point to the involvement of other
regulatory, less characterized, regulatory cell subsets in tolerance maintenance. In this context, the
involvement of CD8+ T regulatory cells, whose role and phenotype features are still undefined
(39,40), has been consistently postulated. Moreover, it is not clear whether different CD8+ regulatory
T cells represent an independent T subset or if they reflect the dynamic plasticity of a single population during immune response.
We observed that co-expression of CD3 and CD56 molecules identifies a T cell subset significantly reduced in type I autoimmune diabetes. Moreover, we observed significant positive correlation between the number of CD3+CD56+ cells and the β-cell residual function (41).
Considering that auto-reactive CD8+ cells represent the main T cell subset mediating disruption of
insulin-producing β-cells in T1D, we investigate whether CD3+CD56+ cells are able to control
CD8+ T cells functions. The referred correlation of this cell subset with viral persistence in hepatitis (42,43) and with the positive outcome of in vitro fertilization approaches (44) strongly supports such
2. Aim
This study is aimed to investigate on cell-dependent mechanisms of immune response control in physiological conditions as well as in the context of immune-mediated diseases.
In order to address such issues, we investigated a human model of autoimmunity, as represented by a subgroup of patients affected by MDS, a hematological disorder characterized by immune-mediated selection and expansion of pathological stem precursors. In this model, the possibility to directly analyse cell-mediated tolerance control in the microsite of the deranged inflammation, is expected to represent a powerful tool to identify the key regulatory mechanisms to be hopefully targeted by effective immune-modulating strategies.
Recent observations indicate that the availability of nutrients and the possibility to modulate metabolic pathways might influence immune system regulation and functions. In particular, in vitro studies consistently indicate that activation status of mTOR, the main cell nutrient sensor, represents a key environmental signal for the plasticity of adaptive cells and that changes in metabolic pathways might be used to finely tune their fate and function.
The employment of mTOR pharmacological inhibition for the control of tumour cell growth has been largely described. However, in vitro data indicate that oscillatory mTOR inhibition is critical to ensure preferential Treg expansion. Thus, we asked whether dosage and administration schedule of mTOR inhibitors, able to ensure mTOR oscillatory activity, might be relevant to induce immune-tolerance, rather than cell growth inhibition in a model of tolerance induction as represented by kidney allogeneic transplant.
Moreover, our study addressed the possibility to use nutraceutical compounds, by us selected for their immune-modulating effects in a veterinary model of chronic infection, to control immune effector activity in vitro.
Control of deranged cytotoxic effectors is a key therapeutic target in immune-mediated disorders. In this context, the involvement of multiple cell-dependent mechanisms of immune modulation has been largely demonstrated. Here, we addressed the functional analysis of a poorly defined T cell subset, characterized by the co-expression of CD3 and CD56 molecules, recently associated with the residual pancreatic function in type I autoimmune diabetes.
A better knowledge of cell mediated processes involved in immune-tolerance control is expected to significantly improve the availability of innovative immune-modulating strategies, thus ameliorating clinical management of immune-mediated disorders.
13
3. Materials and methods
3.1 Immune dysregulation and Myelodysplastic Syndromes
Patients and controls
In collaboration with the Divisione di Ematologia dell’Università “Federico II” di Napoli, we examined BM and peripheral blood (PB) samples of 37 consecutive, newly diagnosed MDS patients categorised according to WHO 2016 and IPSS score. Twenty-six have been classified as Low Risk, six as Intermediate-1 (Int-1) Risk, five as Intermediate-2 (Int-2) Risk/High Risk. BM and PB samples from MDS patients were obtained during routine diagnostic procedures previous informed consent from each patient. None of the recruited patients were receiving medical treatments that could have an impact on their immune condition. To avoid any interference on immune-regulatory mechanisms, patients were devoid of immune-mediated diseases and acute or chronic viral infections. All the patients enrolled in the study received a minimal 36-month clinical follow up.
For comparative analysis of T cell repertoire, 10 PB and 3 BM samples of healthy donors have been collected. BM specimens, obtained from consenting healthy donors, were part of their marrow donation.
mAb, immunofluorescence and flow cytometry
Lymphocyte population has been gated by using FSC and SSC parameters, as well as CD45 labelling. FITC, PE, Cychrome and APC labelled mAb against CD3, CD4, CD8, CD56, CD25, CD45 and CD54 have been used to the identification of immune cell subsets and to evaluate their activation status. To study the T cell repertoire have been used mAbs anti Vβ14, Vβ12, Vβ7.2, -Vβ20, -Vβ18, -Vβ7.1, -Vβ22, -Vβ13.2, -Vβ1, -Vβ17, -Vβ5.3, -Vβ5.1 -Vβ23, -Vβ4, -Vβ2, -Vβ13.1,
-Vβ5.2, -Vβ8, -Vβ9, -Vβ11, -Vβ3, -Vβ13.6, -Vβ21.3F, -Vβ16. To define a CD4+ and/or CD8+
skewed repertoire, we considered the occurrence of a percentage of expression exceeding of three Standard Deviation (SD) that observed, for each Vβ family analysed, in ten healthy controls sex/age matched with the MDS patient cohort. Occurrence of a skewed BM CD4/CD8 repertoire with an expression frequency higher that 20% respect to peripheral blood (PB) has been considered as a BM
preferential skewing. Treg subset was identified as the higher CD25 expressing CD4+CD3+
population and Foxp3 at a percentage ˃98%. The Foxp3 expression has been evaluated trough an intracellular staining using the anti-human Foxp3 kit (eBioscience San Diego, USA) and following the manufacturer’s instructions. For the comparative analysis of CD54 expression level on BM
CD8+CD3+ and CD4+CD3+ lymphocytes, immune-fluorescence data were expressed as ratio of
mean intensity fluorescence (MIF) value for the CD4+ and CD8+ population and the control MIF
value obtained after staining of the same cell population with the isotype control mAb, as previously described (34).
Flow cytometry and data analysis were performed by a two-laser equipped FACScalibur apparatus and the CellQuest analysis software (Becton Dickinson).
Statistical analysis
Statistical evaluation of data, by InStat 3.0 software (GraphPad Software Inc., San Diego, California, USA), was performed by Mann-Whitney test or Fisher’s exact test. Two-sided p values less than 0.05 have been considered significant.
3.2 mTOR modulation and tolerance in kidney transplanted patients Study population
The study was carried out on 19 renal transplant recipients, all first transplant from cadaver donors. Inclusion criteria were: age 18-65 years; transplant vintage >3 years; plasma creatinine <2 mg/dl, with stable estimated glomerular filtration rate (eGFR) in the previous three months; haemoglobin value >10 g/dl; white cell count >3000/μL (neutrophils >1500/μL); platelets >75.000/μL; and absence of rejection signs or infectious episodes in the previous three months. Individuals with previous or combined transplantation, hyperlipidaemia (baseline cholesterol and/or triglycerides values exceeding 220 and 200 mg/dl, respectively) andor evidence of autoimmune diseases or viral infections have been excluded from the study.
Study protocol
At baseline (T0), dosage of CNI was reduced empirically by 50% and the mTORC1 specific inhibitory drug Everolimus was introduced at a starting dosage of 0-50 mg/twice a day (b.i.d). Plasma levels of both drugs were checked after 1 week, and Everolimus dosage was modified opportunely to reach trough levels (TL) of 5–8 ng/ml. After a 4-week stabilization period, CNI dose was further reduced by 25% and finally withdrawn (within the fourth month), whereas Everolimus TL was increased up to 6–10 ng/ml. After 6 months all the patients were on Everolimus alone; they were evaluated again at one year from baseline (T12). Dosage of steroids was never altered throughout the study. Six of the enrolled patients continued mycophenolic acid (MFA) co-treatment that was associated to Everolimus. These patients, whose immune modulating regimen included
15
of the patients was performed at Divisione di Nefrologia dell’Università “Federico II” di Napoli. All the patients signed their informed consent to the study. Twelve healthy blood donors, age- and sex-matched with the patients, were enrolled into the study as controls.
Immunofluorescence and T cell activation
To evaluate the immune profile, blood samples of kidney transplanted patients were analysed by immunofluorescence and flow cytometry by using a two-laser equipped fluorescence activated cell sorter (FACS) Calibur apparatus and CellQuest analysis software (Becton Dickinson, San Jose, CA, USA). To identify the different cell populations and the cytokine production were employed monoclonal antibodies (mAbs) against CD3, CD4, CD8, CD56, CD25, FoxP3, Ki67, interferon (IFN)-, interleukin (IL)-4, IL-17 labelled to fluorochromes [Fluorescein isothiocyanate (FITC), phycoerythrin (PE), cychrome (CY) and allophycocyanin (APC)] purchased from Becton Dickinson. APC labelled anti-phospho S6 kinase mAb was purchased from Cell Signaling Technology, Inc. (Beverly, MA, USA). To analyse cytokine production, Peripheral Blood Mononuclear Cells (PBMC) were isolated from whole blood through centrifugation on Lymphoprep gradients (Nycomed Pharma) and cultured overnight in the presence of phorbol myristate acetate (PMA) and ionomycin to induce the ex vivo cytokine production and with 5 μg/mL of Brefeldin-A (Sigma-Aldrich) to avoid extracellular cytokine export. Intracellular cytokine profile, FoxP3, Ki67 and phospho S6 kinase staining were performed with a fixation-permeabilization buffer (Becton Dickinson), following the manufacturer’s instructions. CD4+ and
CD8+ T cells were sorted by FACSJazz (Becton-Dickinson). To mimic antigen-dependent T cell
activation, sorted CD4+ and CD8+ cells were incubated for 1 hour with anti-CD3/anti-CD28
mAb-coupled microbeads (Life Technologies AS, Oslo, Norway) at the cell/bead ratio of 1:0.2.
Statistical analysis
Statistical evaluation of the data using InStat version 3.0 software (GraphPad Software Inc., San Diego, CA, USA), was performed by Mann–Whitney test or Wilcoxon’s matched pairs signed-rank test, as indicated. Two-sided P-values less than 0.05 have been considered significant. The corrected P-value (Pc) were calculated by applying Bonferroni adjustment for multiple comparisons.
3.3 Study of in vitro effects of Nutraceutical compounds on pro-inflammatory T cell profile
Culture Medium and Botanicals
PBMCs isolated by peripheral blood samples of 10 healthy donors were tested for their capability to produce cytokines in the presence of conditioned cell cultured medium containing botanicals compounds. Conditioned cell cultured medium was prepared by using 1gr of powder of each plant-derived substance, solubilized in an appropriate chemical vehicle. The botanical substances and the amount to be used for the in vitro study were selected according to the immune-modulating results previously obtained in a canine model (29). In particular, Ascophyllum nodosum
(pure powder of Ascophyllum nodosum seaweed, laminarin content min. 2.3%, and fucoidans content min. 11.4%); Aloe vera (Aloe vera gel 200:1 powder, aloe content min. 1%); Cucumis melo (lyophilized extract of melon, superoxide dismutase min. 1 UI/mg), Polygonum cuspidatum (powder obtained from dried Polygonum cuspidatum roots, resveratrol content min. 8%), Camellia
sinensis (standardized decaffeinated green tea leaves powder, catechins content min. 75%), Carica papaya (Papaya fermented granular, rich in papain), Glycine max (Soy powder, 40% isoflavones),
and Grifola frondosa (maitake carpophore dry extract, polysaccharides content min. 20%) have been solubilized in 10mL of PBS, while the Glycine max has been added to 30 mL of PBS to gain the full solubilization. Haematococcus pluvialis (standardized beadlets of Haematococcus pluvialis extract, astaxanthin content min. 2.5%) has been solubilized in 5 mL of dimethyl sulfoxide and 5 mL of PBS. Echinacea purpurea (Echinacea purpurea dried extract, polyphenols content min 4%),
Piper nigrum (black pepper powder, piperine content min. 95%), Curcuma longa (turmeric dried
extract, curcuminoids content min. 95%), and Punica granatum (standardized powdered extract from pomegranate, ellagic acid content min. 20%) have been solubilized in 4 mL of ethanol and 6 mL of water. To obtain a conditioned culture medium, the solubilized botanicals have been added to RPMI 1640 culture medium (Sigma-Aldrich, Milan, Italy) in the proportion of 1:10 in order to preserve the good conditions of the cell cultures.
Intracellular cytokine production was evaluated after ON incubation with Phorbol 12-Myristate 13-Acetate (PMA) and Ionomycin (Sigma-Aldrich, St. Louis, MO) alone or in the presence of culture medium containing the single substance or a mixture of all the botanicals tested. This approach has been widely described for the study of cytokine profile in human and animal models.
Cytokine production was evaluated by using immune fluorescence and flow cytometry detection (FACSCalibur platform) and CellQuest Software (Becton Dickinson Pharmingen, San Jose, California).
17
Statistical Analysis
Statistical analysis was performed by Kruskal-Wallis followed by Dunn's multiple comparisons analysis (GraphPad Prism, San Diego, CA, USA). Results were considered significant at p< 0.05.
3.4 Study of CD3+CD56+ cell subset
Monoclonal antibodies, immunofluorescence, flow cytometry and cell sorting
CD3+CD56+ (TR3-56), CD3−CD56+ (NK) and CD4+ and CD8+ T cells were isolated, after Ficoll
hypaque–gradient centrifugation (GE-Healthcare), from PBMCs of human healthy donors by high-performance cell sorting (BD FACS-Jazz, BD Bioscience) in the IEOS-CNR Sorting Facility in Napoli, after staining with the following antibodies: anti-CD3, anti-CD56, anti-CD4, anti-CD8 or by magnetic cell separation with microbeads CD3+CD56+ isolation Kit (Miltenyi Biotec). Sorted
cells were 95%–99% pure by FACS analysis. Samples were analysed by immunofluorescence and Flow Cytometry by using a two-laser equipped FACSCanto II (BD PharMingen).
FITC, PE, PE-Cy7, PE-Cy5, APC-H7 and APC-labelled mAbs against CD3, CD4, CD8, CD16, CD45, CD25, CD39, CD49d, CD45RA, CD45RO, CD54, CD56, CD57, CD62L, CD69,
CD107a/LAMP-1, CD94, CCR7, CTLA-4, CXCR4, Foxp3, GITR, DNAM-1, PD1, IFN-,
NKG2A, NKp30, NKp46, CD1d Ig fusion, V24 and isotype-matched controls, all from BD Pharmingen were used for cell characterisation. FITC and PE labelled mAbs against TCR
Vepitopes, namely anti-V1, V2, V3, V4, V5.1, V5.2 V5.3, V7.1, V8 V, V11,
V13.1, V13.2, V13.6, V14, V16, V17, V20, V1.3 V22, V23, all from Beckman
Coulter were used for T cell repertoire analysis. To analyse the production of Interferon (IFN)- intracellular staining with the specific mAb was performed by using the fixing/permeabilization (BD Bioscience), following the manufacturer’s instructions. To avoid extracellular cytokine export, the cultures were performed in the presence of 5 g/ml of Brefeldin-A (Sigma-Aldrich). Analysis were performed by using FlowJo Software (FlowJo, LLC). The control 345.134 IgG2a mAb, recognizing a glycoprotein widely expressed on human leucocytes was a kind gift of Dr. S. Ferrone; recombinant human soluble NCAM-1/CD56 molecule was purchased from R&D Systems, Inc.
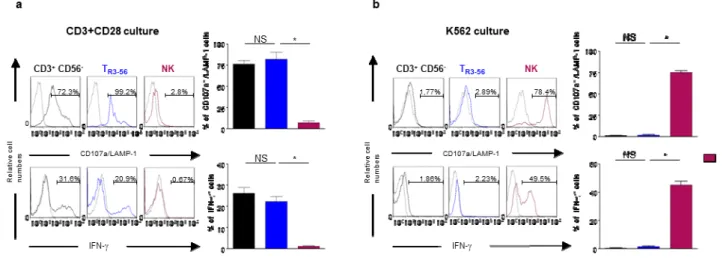
Cell culture, CD107/LAMP-1 expression and cytokine production
To obtain activated IL-2PBMC or IL-2CD8+ cells, PBMC or flow sorted CD8+ T cells were
cultured for 36 hours in RPMI-1640 (Thermo Scientific Scientific) supplemented with 5% AB human serum (Euroclone) in the presence of recombinant human 2 (Sigma) at 200UI/ml.
IL-2PBMC or IL-2CD8+ cells were incubated for 4 hours with anti-CD3 plus anti-CD28 mAb-coupled
microbeads (Gibco by Thermo Scientific) at the cell/bead ratio of 1:1 or with the K562 cell line (ATCC) at 1:1 ratio. CD107a/LAMP-1 expression and IFN-production was evaluated in flow cytometry gated CD3+CD56- (T cells), T
R3-56, NK, CD4+ and CD8+ T cells,as indicated. When
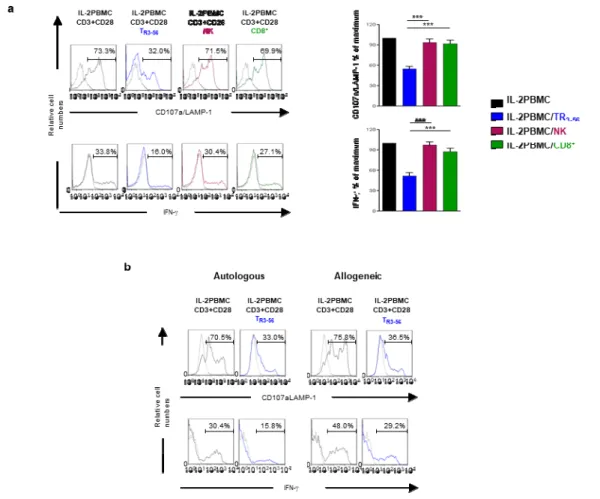
indicated IL-2PBMC or IL-2CD8+ T cells were co-cultured with fresh isolated T
R3-56, NK CD4+ and
CD8+ T lymphocytes at different ratio. Brefeldin-A at 5 g/ml (Sigma Aldrich) was added in the
last 3 hours of culture for CD107a/LAMP-1 expression or for the whole culture period for IFN-production. To avoid cell-to-cell contact, co-culture of TR3-56 cells with IL-2CD8+ T lymphocytes
was performed by using transwell inserts (Corning Life Sciences).
Proliferation assay
For the assessment of cell proliferation, cells were cultured in the presence of microbeads coated with anti-CD3 plus anti-CD28 (Gibco by Thermo Scientific). Cultures were incubated for 72 hours
at 37°C in a humidified atmosphere containing 5% CO2 and pulsed with 0.5 Ci/well [3H]
thymidine for the final 16 hours. The incorporation of the labelled nucleotide was determined by scintillation counting after automatic cell harvesting. All tests were performed in the presence of RPMI 1640 Medium supplemented with 5% heat inactivated AB human serum (Euroclone). To
analyse cell division flow cytometry sorted CD4+ and CD8+ T cells were labelled with 5,
6-carboxyfluorescein-diacetate-succinimidyl ester (CFSE) (ThermoFischer Scientific) before the culture.
Statistical analysis
Statistical evaluation of data has been performed by Mann-Whitney test and Student's t-test using the InStat 3.O software (GraphPad Software Inc, San Diego, California, USA). Two- sided p values less than 0.05 has been considered significant.
19
4. Results and Discussion
4.1 Immune dysregulation and Myelodysplastic Syndromes
Treg increase and decreased expression of CD54 on CD8+ T cells in BM associate with MDS
progression.
Immune response is a finely tuned micro-site process. Thus, the possibility to specifically access the study of BM immune profile in MDS represents a powerful tool to investigate on Treg-mediated immune tolerance control in the pathogenesis and progression of the disease. With this purpose, we evaluated the level of Treg and activated cytotoxic T cells in the BM of 37 MDS patients classified according to IPSS score system, mirroring leukemia progression risk. Left panel of Figure 5 shows that Treg levels in the BM increase with disease progression. A significant increment (p<0.05) of BM Treg percentage has been observed in Int-2/High Risk patients in comparison with the Low and Int-1 Risk groups. Moreover, in order to investigate on BM cytotoxic
CD8+ T cells (CTL), largely associated with the occurrence of immune-mediated damage of stem
precursors (45,46), we focused on activated cytotoxic effectors by evaluating surface expression of
CD54 molecule, consistently associated with the occurrence of antigen dependent activation of CTL
(47,48). As shown, a clear trend of reduction of CD54 expression on BM CD8+ cytotoxic T cells was
observed from the Low Risk to the Int-2/High Risk stage of MDS (Figure 5, right panel). These data suggest that BM Treg levels increase with disease progression and that, instead, an higher number of activated CD8+ T cells characterises the first stage of the disease.
Figure 5: Treg percentage and CD54 expression on bone marrow CD8+ T lymphocytes in MDS patients. Left panel indicates the percentage of Treg cells in BM of MDS patients classified according the International Prognostic Score System (IPSS). Treg are significantly increased in Int-2/High when compared to the Low and Int-1 patients (p ˂ 0.05). Right panel indicates the expression level of CD54 on CD8+ T lymphocytes in BM of MDS patients classified according to the IPSS; a trend of decreased expression from Low to Int-2/High patients is observed. White, grey and black columns indicate Low, Int-1 and Int-2/High Risk MDS patients, respectively.
Thus, reduced Treg level in BM might be hypothesised to associate with the occurrence of deranged activity of CTL, likely able to damage stem precursors in BM and to select pathological dysplastic precursors able to escape CTL attack. (46,49).
Reduced BM Treg levels in Low Risk MDS patients are significantly associated with increased BM recruitment of CD8+ T cells
To evaluate whether activity of cytotoxic adaptive effectors in BM of MDS patients associate with immune-mediated selection of pathological precursors, we first evaluated the recruitment in BM of cytotoxic adaptive effectors in our MDS cohort calculating the ratio between the BM and peripheral blood (PB) CD8+ T cells. A value >1 indicates an increased frequency of cytotoxic
effectors in BM, as compared with the PB.
Figure 6: BM recruitment of CTL in Low Risk MDS patients inversely associates with Treg level in BM. Panel A indicates the CTL recruitment in BM of MDS patients classified according the IPSS. There is a significant increase of CTL in BM of Int-1 patients compared to Low and Int-2/High Risk individuals. White, grey and black columns indicate Low, Int-1 and Int2/high Risk MDS patients, respectively. Panel B shows the CTL recruitment in BM of Low Risk MDS patients categorized according to Treg levels in BM; Percentage ˂ 2% or ≥ 2% were indicated with white and grey columns, respectively The BM recruitment of CTL has been evaluated by calculating the ratio between CTL percentage in BM and in PB.
As shown in panel A of Figure 6, there is a significant BM recruitment of CD8+ T lymphocytes
in Int-1 when compared with Low Risk group, while reduction of CTL recruitment in BM characterises the Int2/high Risk stage of MDS.
Previous data obtained by our research group indicated (34) that Treg show a clustered
distribution in BM of Low Risk patients and that a cut-off of 2% allows the identification of two subgroups of Low Risk individuals. A subgroup with physiological level of BM Treg (>2%) and another one with lower BM Treg level (<2%) compared to healthy donors (data not shown). As shown in panel B of Figure 6 the subgroup of Low Risk MDS patients with lower (<2%) BM Treg
level show an increased BM recruitment of CD8+ T lymphocyte. No significant difference in the
BM recruitment of CD4+ T cell effectors was observed (not shown).
Then, BM-Treg level, seems to preferentially control the BM recruitment of CTL in MDS. These observations support the idea that lower Treg level could promote immune-mediated damage of stem precursors in BM of Low/Int-1 Risk patients. In addition, the increasing of Treg number
21
associated to a decreased activation status of CD8+ T cells, could allow the suppression of the
cytotoxic response against the dysplastic clones in the Int-2/High Risk groups (33-35).
Then, BM Treg levels preferentially control both the activation status and the BM recruitment of cytotoxic T cell effectors in MDS.
Clonal expansion and activation status of CD8+ T cells in BM of Low risk MDS patients
inversely correlates with BM Treg percentage.
Antigen-dependent activation of effector T lymphocytes is associated with their expansion. Diversity of T cell repertoire is dependent on rearrangement of V-D-J gene segments occurring during TCR assembly. Each single T cell clone expresses one type of TCR. So, the expression level of single Vβ gene segments of the variable region of TCR β-chain indicates the expansion, also called “skewing”, of single T cell clones.
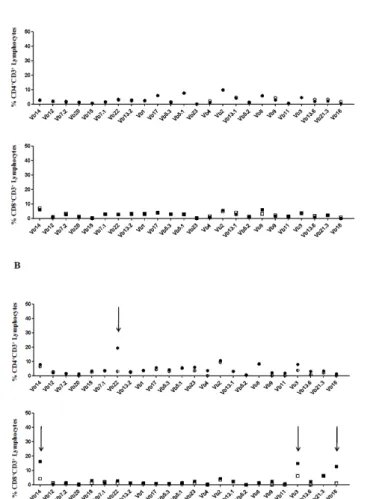
Figure 7: Comparative analysis of TCR repertoire on BM and PB of CD4+ and CD8+ T cells in one representative healthy donor (CTR) and
one Low Risk MDS patient. Panel A shows the expression of Vβ gene segments in BM and PB of CD4 and CD8 T lymphocytes in the CTR. White and black symbols indicate BM and PB, respectively; Panel B shows the expression of Vβ gene segments in BM and PB of CD4 and CD8 T lymphocytes in a representative Low Risk MDS patient. White and black symbols indicate BM and PB, respectively; The arrows indicate the occurrence of BM T cell expansions in CD4 and CD8 lymphocyte repertoire. T lymphocyte expansion has been considered significant when the TCR Vβ expression percentage is higher than 3 standard deviations (SD) compared to TCR Vβ expression in a cohort of 10 healthy controls. Furthermore, preferential BM TCR Vβ expansions have been considered significant when the expression percentage of a TCR Vβ family in BM was greater than 20% compared to peripheral blood.
In this context, the possibility to directly analyse the BM microenvironment, represents a valuable tool to investigate on T-cell mediated mechanisms involved in the selection/expansion of pathological clones in the first phases of MDS. Indeed, the presence of a T cell expansion in BM is likely related with an ongoing T cell response against BM antigens.
Figure 7 shows the results obtained when T cell repertoire in BM and PB was compared. As shown, (Figure 7A) in one healthy donor no significant difference was observed in BM and PB CD4 and CD8 T cell repertoire (indicated by the black and white symbols); at variance, in Low
Risk MDS patients the presence of preferential BM clonal expansions were observed in both CD4+
and CD8+ T lymphocytes (panel B). Of note, no particular Vβ segment expansion has been
observed to characterise BM of MDS patients. Thus, Low Risk patients were divided in two groups, according to the number of T cell expansions detected in BM: those with <2 Vβ skewing and those showing ≥2 Vβ skewing in BM T cell repertoire.
As shown in Figure 8, Low Risk MDS patients with ≥2 Vβ BM clonal expansion have lower BM Treg cells level (panel A) and higher CD54 expression (panel C) on BM T lymphocyte as compared to patients with <2 Vβ skewing. No significant difference was observed when CD4+ T
lymphocyte BM clonal expansions were evaluated (panel B and D).
Figure 8: Treg percentage and CD54 expression on bone marrow (BM) CD8+ and CD4+ T lymphocytes in Low Risk MDS patients classified
according the number of T cell expansions (skewing) in BM. Panel A and B indicate the Treg percentage in Low Risk MDS patients with ˂2 (white columns) or ≥2 (gray columns) skewing in BM CD8+ and CD4+ T cells, respectively. Panel C and D indicate CD54 expression on BM CD8+ and CD4+ T lymphocytes in Low Risk MDS patients with ˂2 (white columns) or ≥2 (gray columns) skewing in BM CD8+ and CD4+ T cells, respectively. Significant difference has been observed only for CD8 T cells.
23
These data confirm the relevance of BM Treg levels in the preferential regulation of both the expansion and activation status of cytotoxic T cell effectors in BM of Low Risk MDS patients.
Grouping of Low Risk MDS individuals according to their BM Treg level identifies a subgroup of patients showing a skewed CD8 T cell repertoire in BM, lesser leukaemia evolution and better survival in a minimal 36 month follow up.
In order to investigate whether the evaluation of Treg level in BM (˂ 2% versus ≥2%) might represent a useful criterion to identify the MDS patients in which immune-mediated mechanism are involved in pathogenesis or progression of the disease, we analysed the occurrence of CD8+ and
CD4+ T cell expansions in BM of 26 Low Risk individuals categorised according to their BM Treg
level. As shown in Table 1, a significant increase of CD8+ T cell expansions in BM has been
observed in patients showing lower Treg level (˂ 2%) at disease onset, as compared to the counterpart with BM Treg percentage >2% (p<0.05). No significant association of Treg level with CD4+ T cell expansions in BM has been observed.
To investigate on the prognostic relevance of Treg BM level at diagnosis, we also analysed leukaemia evolution and survival, in a minimal 36 month follow up, in Low Risk MDS patients grouped according to their BM Treg level. Table 1 shows that there is a significant increment of leukaemia evolution (p<0.05) and death (p<0.05) in the sub-group of Low Risk patients with BM Treg percentage >2% at disease onset.
These observations are conceivable with the hypothesis that Treg preferentially suppress cytotoxic immune effectors in BM of MDS Low Risk patients. Moreover, their number at diagnosis, seems to inversely associate with an immune profile able to control disease progression.
Table 1. Follow up evaluation of Low risk MDS patients categorised according to Treg level in BM at disease onset1
N Age CD8 skewed in BM ≥2 CD4 skewed in BM ≥2 Transfusion dependance Leukemia evolution Death Low Risk 26 72.6±9 13 10 8 5 6 BM Treg ≤2% 14 71±5 102 63 5 04 05 BM Treg >2% 12 74.4±11 3 4 3 5 6
1data refer a minimum 36 month follow-up; 2 significantly different from BM Treg >2% group (p<0.05 by Fisher exact test; Odd Ratio 7.5 (95% CI: 1.307 to 43.047); 3 not significantly different from BM Treg >2% group; 4 significantly different from BM Treg >2% group (p<0.05 by Fisher exact test); Odd Ratio 0.047 (95% CI: 0.002279 to 0.9704); 5significantly different from BM Treg >2% group (p<0.005 by Fisher exact test); Odd Ratio 0.034 (95% CI: 0.001679 to 0.7082);
Taken in all our observations indicate that BM Treg level at diagnosis inversely associates with an immune profile able to control disease progression. Indeed, at disease onset, Treg percentage in BM associated with decreased occurrence of Leukaemia progression and better survival. Further investigation, addressing the molecular target/s of the BM skewed CTL, will likely clarify the role of immune mediated processes in MDS pathogenesis and/or progression.
4.2 mTOR modulation and tolerance of kidney transplants
Effect of conversion from CNI to Everolimus on immune profile
Previous data indicate that Treg amount in the inflammatory microsite is a key element to modulate adaptive cytotoxic effectors and mediate immune-tolerance control. A number of experimental data (12,13) suggest mTOR modulation as a valuable strategy to increase Treg subset in
the context of a deranged tolerance control. Pharmacological mTOR inhibition is currently employed in clinical trials to suppress tumor growth in multiple oncological settings. Moreover, selective Treg growth in vitro has been observed to depend on oscillatory mTOR activity (14).
Kidney transplant condition represent a valuable clinical model of tolerance induction. In this context, the employment of immune-modulating strategies based on CNI drugs has been largely associated with therapy-related damaging of the transplanted organ. Thus, the needing of alternative pharmacological approach to immune suppression in kidney transplanted patients is largely recognised.
mTOR inhibition has been proposed as an alternative strategy to obtain immune-modulation, also avoiding possible nephrotoxic effect. In this context we took advantage from a clinical trial at Divisione di Nefrologia dell’Università di Napoli “Federico II” based on the conversion from CNI to mTOR inhibitory immune-modulating protocol in a cohort of kidney transplanted patients. In this model we investigated on the hypothesis that dosage and clinical administration schedule of mTOR inhibitors, as represented by Everolimus, might selectively mediate the establishment of a Treg-dependent tolerance control of the transplanted organ.
With this aim we analysed the number of leucocytes, neutrophils, CD4+ and CD8+ T
lymphocytes at T0 (at the beginning of the study) and at T12 (after 12 months of pharmacological conversion). We found that conversion from CNI to Everolimus is able to reduce the number of
total leucocytes, neutrophils cells and CD8+ T lymphocytes at T12 if compared to T0 data. No
25
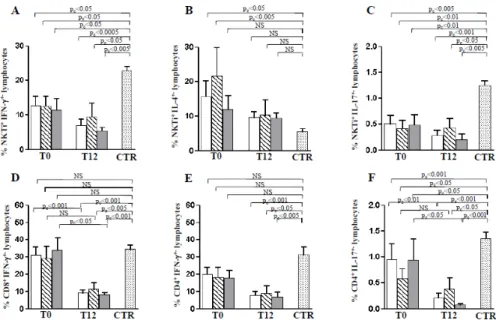
Then we evaluated the effect of Everolimus conversion on cytokine production, by analysing IFN-γ, IL-4 and IL-17 in iNKT lymphocytes, a major player in cytokine profile polarization (50),
IFN-γ in CD8+ T cells and IFN-γ and IL-17 in CD4+ T lymphocytes. Comparison with healthy
donors (CTR) was also performed.
As shown in Figure 9 (panel A-C) IFN-γ and IL-17 produced by iNKT cells remained significantly lower respect to healthy donors in patients both at T0 as well as at T12. In contrast, the high IL-4 production in CNI treated patients, evident at T0, was significantly reduced at T12 becoming similar to healthy donors (Figure 5B). The production of IFN-γ by CD8+ T cells (Figure
9D) significantly decreased after the Everolimus conversion, resulting lower than controls at T12.
Figure 9: Cytokine secretion profile of NKTi, CD8+ T and CD4+ T lymphocytes in kidney-transplanted patients undergoing conversion from
CNI to Everolimus. Panels A-C refer to the IFN-γ, IL-4 and IL-4 production by NKTi cells at T0 and T12 after CNI to Everolimus conversion. Panel D indicates IFN-γ production in CD8+ T cells and Panels E and F indicate IFN-γ and IL-17 production by CD4+ lymphocytes at T0, and T12. Data have been referred as mean±SEM. White columns indicate data obtained in all the patients enrolled in the study (N=18); striped columns indicate patients whose treatment included MFA co-administration (N=6); Grey columns indicate patients treated with immune modulating regimens not including MFA (N=12). Mann-Withney test is reported. For T0-T12 comparison of paired samples Wilcoxon matched-pairs signed-rank test has been performed. The corrected p value (pc) was calculated by applying Bonferroni adjustment for multiple comparisons.
Notably, the IFN- reduction was preferentially observed in the group of patients undergoing an immune-modulating treatment without MFA. Such evidence suggests a preferential role for
mTOR-dependent mechanisms in regulating CD8+ T lymphocyte pro-inflammatory cytokine
production. IFN-γ by CD4+ T cells was significantly lower at T12 than controls (Figure 9E). In
addition, the percentage of IL-17 produced by CD4+ T lymphocyte was reduced in patients than in
controls at T0 and at T12 (Figure 9F). Moreover, in paired samples, the comparison of T0 and T12 values suggested that Everolimus, in absence of MFA, was able to mediate complete inhibition of
IL-17 producing CD4+ T cells. Thus, MFA co-administration affects Everolimus-dependent
CD4 +Fo xp3 +L ym pho cy tes x10 9/L NS NS NS pc<0.05 NS NS T0 CTRT12 NS NS NS % k i6 7 +CD4 +Fo xp 3 +ly m p h oc yt es NS NS NS NS NS NS T0 CTRT12 pc<0.05 pc<0.05 pc<0.05
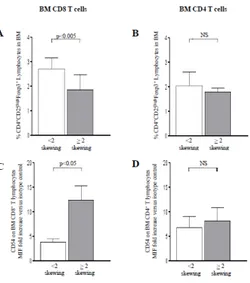
Effect of Everolimus on Treg number and proliferation
Treg cell homeostasis depends on mTOR activation pathways (14,51). Therefore, we analysed the
effects of the pharmacological mTOR inhibition on number and proliferation of Treg cells. As indicated in Figure 10, T12 patients treated without MFA association show a significant increase of Treg number as compared to T0 values. Notably, Treg count always remains similar to controls.
Figure 10: Treg population in kidney-transplanted patients following CNI to Everolimus conversion. Number of Treg, gated as CD4+Foxp3+T cells, at T0 and T12 were reported. Data have been referred as mean±SEM. White columns indicate data obtained in all the patients enrolled in the study (N=18); striped columns indicate patients whose treatment included MFA co-administration (N=6); Grey columns indicate patients treated with immune modulating regimens not including MFA (N=12). For comparison with controls Mann-Withney test is reported. For T0-T12 comparison of paired samples Wilcoxon matched-pairs signed-rank test has been performed. The corrected p value (pc) was calculated by applying Bonferroni adjustment for multiple comparisons.
Moreover, we analysed Treg growth rate by evaluating ex-vivo the expression of the proliferation marker Ki67. As shown in Figure 11, the conversion from CNI to Everolimus was associated with a significant increase of Ki67 expression on the Treg population. Conversely, Everolimus-MFA co-treatment mediated a significant reduction of Treg proliferation. At variance, the ex-vivo evaluation of Ki67 expression in CD4+FoxP3-T effector cells indicated a significant
proliferation decrease at T12 (data not shown). This decreased trend was observed to be very strong in T12 patients treated with Everolimus in association to MFA. Therefore, MFA administration was observed to mediate significant growth reduction of both Treg and T cell effectors.
Figure 11: Ki67 expression on Treg cells gated as CD4+Foxp3+T cells in kidney-transplanted patients. Data have been referred as mean±SEM. White columns indicate data obtained in all the patients enrolled in the study (N=18); striped columns indicate patients whose treatment included MFA co-administration (N=6); Grey columns indicate patients treated with immune modulating regimens not including MFA (N=12). For comparison with controls Mann-Withney test is reported. For T0-T12 comparison of paired samples Wilcoxon matched-pairs signed-rank test has been performed. The corrected p value (pc) was calculated by applying Bonferroni adjustment for multiple comparisons.
27
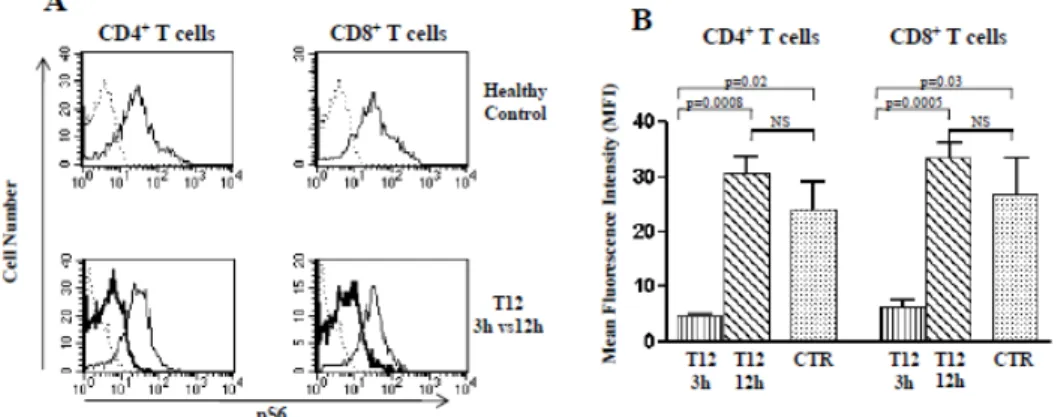
Everolimus serum concentration associates with different levels of mTOR-dependent S6 kinase phosphorylation
To evaluate the activation status of mTOR complex after one year of Everolimus administration, we studied the phosphorylation of S6 kinase (p-S6), the major downstream target of
mTOR activity (52). Moreover, to assess whether phosphorylation of mTOR-dependent targets
might be conditioned by drug serum concentration, we evaluated S6 kinase phosphorylation (p-S6)
level in CD4+ and CD8+ T cells of T12 patients after 3h (T12-3h) and 12h (T12-12h) from
Everolimus administration, reflecting maximal and minimal TL of the drug (data not shown). As shown (Panel A and B of Figure 12), comparative analysis by immune fluorescence of basal p-S6
levels in CD4+ and CD8+ T cells from samples obtained from T12 patients 3h and 12h after
Everolimus administration (highest and lowest drug TL, respectively) indicated the occurrence of an oscillatory inhibition of mTORC1 kinase activity. Indeed, significant decrease of p-S6 kinase was observed in CD4+ and CD8+ T cells obtained after 3h, as compared with those obtained after
12h from Everolimus administration (p<0.001). Moreover, p-S6 kinase levels were significantly lower than controls in samples after 3h (p<0.05), but not after 12h from Everolimus (Panel A and B of Figure 12).
Figure 12. p-S6 kinase analysis 3 and 12 hours after Everolimus administration in T12 patients. Panel A refers to flow cytometry comparative evaluation of p-S6 kinase levels in CD4+ and CD8+ T cells obtained from one representative T12 patient 3h and 12h after Everolimus administration (T12-3h and T12-12h) and in one healthy control. As indicated, upper histogram plots in Panel A show the p-S6 kinase level in CD4+ and CD8+ T cells of one healthy donor (plane line); isotype matched control binding is indicated as dashed line. Lower histogram plots in Panel A refer to the p-S6 kinase evaluation in cells of one representative patient 3h (bold line) and 12h (plane line) after Everolimus administration; dashed line indicates isotype matched control binding. Panel B shows comparative analysis of p-S6 phosphorylation levels of CD4+ and CD8+ T cells after 3h (vertical depicted column) and 12h (oblique depicted column) in all four T12 patients analysed. Dotted columns indicate healthy controls (CTR). Statistical analysis was performed by Mann Whitney test.
Similar data were obtained by western blot analysis. Indeed (Figure 13), no difference in p-S6 levels in medium cultured samples obtained from T0 and T12 patients were observed in CD4+ and
CD8+ T cells after a one-hour culture in the presence of medium alone or with anti-CD3/anti-CD28
beads. Conversely, a strong increase of TCR-dependent p-S6 up-regulation was observed in the samples obtained from T12 patients after 12h from Everolimus administration (minimal drug serum
concentration), in both the CD4+ and CD8+ T cells. In addition, strongly reduced pS6 up-regulation
was observed upon TCR triggering in the samples obtained from the same patients 3 hours after Everolimus administration (maximal drug serum concentration).
Figure 13: Western blot analysis of p-S6 kinase from protein lysates of sorted CD4+ T cells. Data are from two representative T0 and T12 patients and refer to 1h culture with medium or anti-CD3/anti-CD28 mAb coupled microbeads. As shown, a tremendous increase of pS6 levels was observed in T12-12h patients after TCR triggering. As indicated, (Panel B) comparable up-regulation of pS6 was observed in T12-3h patients and controls. Arabic numbers (1-4) identify samples obtained from single patients. Data are representative of two concordant experiments.
Thus, basal phosphorylation level of S6 kinase, a major mTOR-dependent molecular target, was substantially maintained in patients treated with Everolimus. Moreover, oscillations in serum concentration of Everolimus were associated with changes in basal and activation-dependent S6 kinase phosphorylation of CD4+ and CD8+ T cells. Indeed, T Cell Receptor (TCR) triggering was
observed to induce significantly higher S6 kinase phosphorylation in the presence of lower Everolimus serum concentrations. Taken in all, our results shed light on the complex mTOR-dependent immune-metabolic network, and propose that oscillatory inhibition of TCR-mTOR-dependent mTOR activity might represent a therapeutic strategy to optimise targeted manipulation of specific adaptive effectors in kidney-transplant recipients.
4.3 Study of in vitro effects of nutraceutical compounds on pro-inflammatory cytokine production by T cell effectors
Nutraceutical compounds co-culture is able to modulate in vitro IFN- production by human T cells Our previous work (29) showed, in a model of natural chronic canine infection, as represented by
Canine Leishmaniosis, that combination of pharmacological treatment with an immune-modulating diet containing Ascophyllum nodosum, Cucumis melo, Carica papaya, Aloe vera, Haematococcus
pluvialis, Curcuma longa, Camellia sinensis, Punica granatum, Piper nigrum, Polygonum cuspidatum, Echinacea purpurea, Grifola frondosa and Glycine max was associated with
29
significant restoration of Treg level and with the decrease of TH1 inflammatory response. These
effects were proposed to have a role in reducing the immune-pathological injury resulting from canine leishmaniasis. Thus, we investigated whether co-culture of human T cells with the above botanicals might exert immune-modulating effect on activated human T cells.
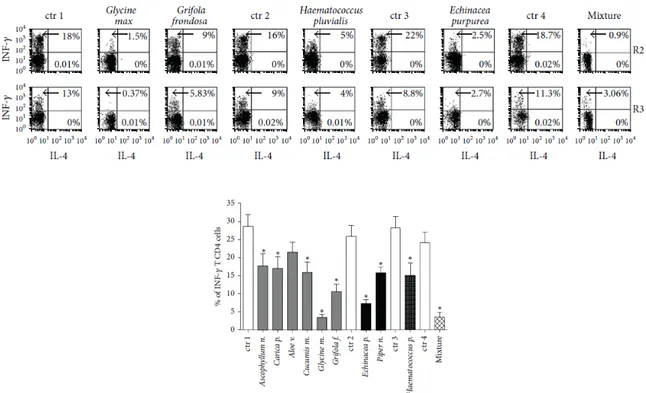
Figure 14: Effects of botanical treatment on INF- production by human PBMCs. Upper dot plots represent results from one representative experiment showing the percentage of INF-and IL produced by CD4+ T lymphocytes (R2) and non-T cells (R3). The different cell treatment with ad hoc medium or mixture are indicated on the top. Lower histograms show the statistic representation of the INF- production by human CD4+ T Lymphocytes evaluated as percentage of INF- producing cells in 10 representative experiments, p < 0.05. The abbreviation “ctr” indicates the basal INF- production by PMBC stimulated by PMA and Ionomycin in the presence of the ad hoc medium, containing the same solubilizing-vehicle but free from the botanicals.
As shown in Figure 14, co-culture of the botanicals, except Aloe vera, were able to induce a significant decrease in IFN-γ production of human T and non-T lymphocytes (manly represented by NK cells). Instead, no changes were observed in IL-4 production, undetectable or only slightly detectable in T and non-T lymphocytes. The chemical vehicles, used to solubilize the substances, were always used as control and the resulting values were subtracted from each experimental point.
4.4 A study of cell-mediated regulation of T cell-dependent cytotoxic effector functions: characterization of the CD3+CD56+ T cell subset as a novel regulatory cell population.
Co-expression of CD3 and CD56 molecules characterises a subset of lymphocytes whose physiological function is still undefined. Recently, the absolute number of circulating CD3+CD56+
has been observed to mirror residual function of pancreatic -cell up to one year after diagnosis of
autoimmune type 1 diabetes (T1D) (41). In order to investigate on the possible involvement of
phenotype of TR3-56 cells in order to clarify whether co-expression of T and NK molecules (CD3
and CD56 molecule) might indicate belonging of TR3-56 cells to the NKT cell lineage. Of note, NKT
cells have been largely characterized as a CD1d T cell subset, able to ensure prompt cytokine production also shaping T cell cytokine profile during antigen-dependent immune response.
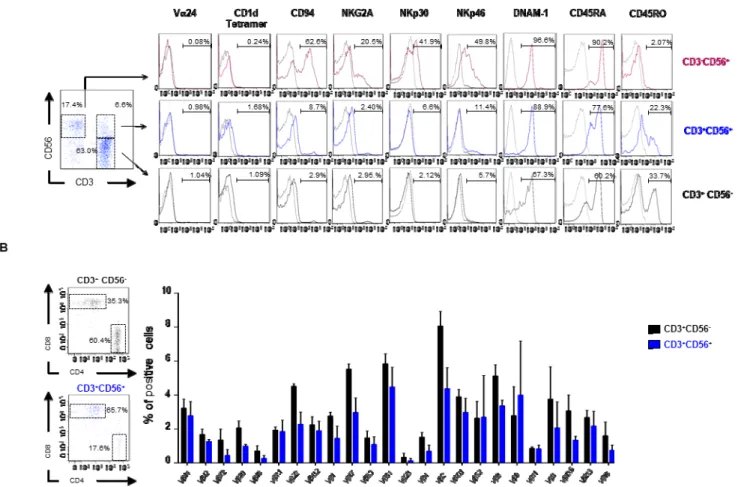
As shown in panel A of Figure 15, TR3-56 cells are not CD1d-restricted for the Ag-recognition,
their TCR does not express the Vα24 segment in the chain, commonly associated with the invariant NKT subset and are unable to be activated by NK-dependent stimulation, as represented by the K562 cell line. Thus, TR3-56 cells do not belong to the NKT cell subset.
Figure 15: TR3-56 cells are a T cell subset distinct from NK and NKT cells.A. left panel shows flow cytometry analysis and gating strategy to define NK, TR3-56 and T cell subset on PBMC of one representative healthy subject; right panels show the expression of several molecules usually associated with NKT, NK and T cells in NK (magenta), TR3-56 (blue) and T (black) cells. Numbers indicate the percentage of positive cells. B. Left panels show the ratio of CD4+ and CD8+ cells in T (black) and T
R3-56 (blue) cells. Right panel shows TCR V gene family expression in CD3+CD56 -(black) and TR3-56 (blue) cells; data are from three independent experiments (n=3);
The TR3-56 cells express low level of the typical molecules of NK lymphocytes (CD94, NKG2A,
NKp30, Nkp46 and DNAM-1), resembling that observed on CD8 T cells. In addition, the analysis
of CD45 isoforms shows that TR3-56 cells preferentially express CD45RA molecule (Panel A of