Sant’Anna School of Advanced Studies
Fostering Regional Resilience:
the Role of Venture Capital
Supervisor: Prof. Andrea Mina Tutor: Prof. Andrea Piccaluga
Candidate: Damiano Maria Morando
1. Introduction
The concept of resilience has gained special traction after the 2008 financial crisis: the profound and long lasting effects of this downturn, the most pronounced since the Great Depression, have compelled many economists to pose new questions concerning the ability of economies to sustain shocks. Despite its relatively novel adoption in the field of economic geography, a key ingredient of this approach is represented by the study of resilience (Boschma, 2014). The concept itself is multifaceted, hence it is particularly suitable to portray the different elements that contribute to economies’ ability to overcome shocks. On the one hand, resilient economies may be more “resistant”, meaning that they are less affected when a shock harm them. One the other hand, recovery is paramount for both resistant and “sensitive” regions. Thus, these two dimensions are somehow “interlocked”- they can be seen as two sides of the prism we call resilience. Notably, this entire debate may lose some of its relevance if recovery is, up to a certain degree, “mechanical”, i.e. economies bounce back to their natural rate of growth, once a shock is over (Martin and Sunley, 2015). Whilst this view may be appealing for proponents of an “equilibrium” perspective, it fails to properly account for the empirical evidence at hand. As noted by Crescenzi et al. (2016), last crisis’s effects have not only been highly heterogeneous across European regions: they have actually altered the growth path in place before the crisis, arguably having a permanent effect on European regions.
In light of these arguments, the present study is focused on analysing both resistance and recovery, in the context of NUTS2 belonging to the European Union (European Commission, 2013). A central part of this work is a convincing identification of valid proxies for both dimensions of resilience: until now, there have not been many attempts to empirically investigate this field (Balland et al. 2015; Brakman et al. 2015; Crescenzi et al. 2016; Mina and Rocchetta, 2017), despite the wealth of conceptual literature concerned with resilience. To a certain extent, this is motivated by data limitations (Crescenzi et al., 2016): in fact, the financial crisis is still recent and, especially in Europe, the recovery process has been laborious, if not lacking.1 Another problem with
1 Furthermore, in 2010 many European nations have been affected by the Sovereign Debt Crisis (Lane, 2012), which further complicated the recovery process.
empirical studies concerning resilience has a more theoretical nature: in fact, it is open to debate whether resilience should be interpreted in terms of “time” (how much did the crisis last? how quick was the recovery process?) or “severity”. Even more, it might be wise to include a “counterfactual” element in resiliency measures (Martin and Gardiner, 2016): in fact, an indicator like the employment rate trend might tell only a partial story. For instance, a negative trend occurring during a recession may hide a negative process that started before the shock. These “counterfactuals” may be geographical (in this sense, we can look for comparisons between regional and national performance) or historical (in this case, looking at deviations from the ongoing trend in employment can be a viable option).
Taking into account these difficulties, the innovative contribution of this work is the exploration of the relationship between VC investment and resilience. There are two main reasons why VC investment may enhance local resilience. First, VC investments tend to promote innovation (Kortoum and Lerner, 2000; Ueda and Hirukawa, 2008). There are different mechanisms trough which this may positively correlate with resilience: for instance, the ability to move from less to more advanced and productive sectors has been highlighted as a resilience-enhancer factor (Fingleton et al. 2012; Brakman et al. 2015). Second, VC investment has a positive impact on employment and entrepreneurship (Samila and Sorenson, 2010; Puri and Zarutskie, 2011). In this vein, the creation of new firms - whose positive impact on resilience has been commonly cited in the literature (Simmie and Martin, 2010) - may constitute another linking mechanism. 2
The article is divided as follows: in the first part, I discuss resilience’s focused literature. Whilst this concept is relatively new in economic geography, the study of factors diminishing regional exposure to downturns is not. However, what emerges from this review is the way in which the concept of resilience helped shaping an original and more profound understanding of the reasons why some regions are less affected by
2 The positive role of entrepreneurship was not empirically confirmed in the work of Mina and Rocchetta (2016); however this may be due to the measure of entrepreneurship they used, namely the number of new firms in a region. In fact, the bulk of employment is generated by a few firms (Coad and Nightingale, 2014). Interestingly, VC are particularly good at selecting (or coaching) high growth firm (Puri and Zarutskie, 2011): thus, their evidence do not directly contradict the above mentioned hypothesis
shocks than others, and how the latter can improve this capability. Subsequently, I introduce the data used in this work, and the methodology I followed. The focus on the regional dimension, which is common among scholars interested in resilience, is crucial to this approach. In the third part, I discuss European regions’ resilience: the results confirm the vast heterogeneity already identified in this sector, at multiple levels of analysis (EU Commission, 2013; Djikstra, 2015; Crescenzi et al. 2016). Another intuitive result concerns the differences existing among regions, with respect to their resistance and recovery capabilities. In other words, the best performing regions in terms of resistance do not necessarily coincide with the ones with the strongest post-crisis growth. Finally, I assess the relation between regions’ ability to resist and recover from crisis with their VC investments. Using multiple indicators for each of these two dimensions has a practical purpose: in fact, given the uncertainty surrounding the best way to portray resilience, exploiting different variables may provide more convincing results.
2. Literature Review
2.1. The concept of regional resilience
Notwithstanding the recent wave of interest, the concept of resilience is still overlooked when it comes to discuss and assess regional policy effectiveness, as noted by Martin (2012). One of the key explanation for this partial neglect can be identified in the infamous reputation of “fuzziness” that haunts the concept of resilience (Pendall, 2010):3 this is still true (Boschma, 2014), despite the fact that economic geographers
have been inquiring the factors enhancing resistance to shocks - both sudden and slowly mounting ones - for quite a long time (Conroy, 1974). In fact, during the 80s, different studies started to underline some of the themes that, nowadays, are closely associated with the notion of resilience: the role of regional structural variety is probably the most paradigmatic example. For instance, Attaran studied this theme in a series of papers during the 80s: in an early work, Attaran (1985) failed to find any significant correlation between variety and employment/GDP cyclical stability (i.e. it had no role in reducing economic fluctuations).4 However, he found a positive effect of diversity on
employment, similarly to what was later found by Wagner and Deller (1998). Overall, according to Dissart’s (2003) review, the empirical evidence accumulated during the 80s and 90s points in the direction of a positive effect of diversity with respect to employment and, less manifestly, income.
There is a crucial caveat concerning the discussion in the previous paragraph. In those early works, resilience, as we phrase it today, was not at the centre of the debate: scholars investigated diversity’s effects on GDP and employment, without paying too much attention to some of the nuances that are currently under economists’ lenses. In other words, their attention was mainly focused on growth, and on convergence among regions, rather than on the divergence that occurs during crisis period, and on regions’ sustainability (Cristopherson et al., 2010; Fingleton et al., 2012). The adoption of the resilience framework provides new angles to this discussion.5 It broadens the aspects
3 “Malleability”, as in Cristopherson et al. (2010) could be a more flattering definition
4 Siegel et al. (1995) provides a brief overview on the different measures of diversity used in this area of study, including the entropy measure developed by Attaran et al. (1987)
5 This is not to say that those studies completely ignored the importance of diversity in mitigating crisis’ effects: in fact, Attaran (1985) suggest that diverse regions shielded the effects of the Great
taken into account and considers them under a unifying umbrella – the concept of resilience – which, as we will discuss in the next paragraph – introduces elements derived from evolutionary theory that were missing in previous works. 6
Unsurprisingly, the idea that some regions, or cities (Vale and Campanella, 2005; Swanstrom et al. 2009; Dijkstra et al., 2015), benefit from certain characteristics, facilitating their recovery from the most harmful effects of economic downturns, appeal to many economists. For example, at the turn of the century, Florida (1996) provided an exhaustive discussion of the importance of diversity in shaping regions’ renewal in the US. Nonetheless, in the last fifteen year, the interest in these themes increased (Swanstrom, 2008; Evenhuis, 2017): as stressed by Cristopherson et al. (2010), this might be imputed to a stronger perception of risk’s pervasiveness, as a consequence of natural disasters recently occurred, such as hurricane Katrina (2005), but especially of the laborious recovery from the 2008 financial crisis. Acknowledging the existence of systemic vulnerability have drove many authors to focus on the process of economic recovery, rather than on unconditional growth.
As a consequence, resilience, which can be generally defined as the ability of successfully overcoming hurdles, was “summoned” in the realms of economics. Being an imported concept, a unifying conceptualization of resilience was lacking, as manifested by Walker et al. (2002) in posing the apparently trivial question: “the resilience of what to what?” (pp. 187). With respect to the “what” element, most contemporary authors are concerned with the resilience of regions, or cities: however, as critically stressed by Boschma (2014), resilience is multi scalar in nature, being affected by decisions taken at multiple levels.7 Secondly, the majority of studies in this field have
focused on the effect of sudden economic crisis, rather than on “slow burners”: this may facilitate quantitative analysis, given that swift shocks tend to be exogenous, and easy to
Depression.
6 For example, Malizia and Ke (1993) explicitly link diversity to stability – defined as the “absence of variation in economic activity over time (pp. 222) - a perspective that we nowadays may consider outdated
point out and temporally circumscribe. However, this approach should not limit the debate on resilience, given the importance of long term economic restructuring.8
From those days, numerous progresses have been made toward a universally-agreed definition of what exactly resilience is. Nonetheless, numerous difficulties still impair an operational-oriented definition of the concept. In fact, different authors have pointed to the overlap between resilience and other related concepts, such as lock-in, path dependency and the so called “learning regions” approach (Davies, 2011; Hassink, 2010). However, even the most critical voice tend to concede that emphasizing the specificities of the notion of resilience can be fruitful, if we are careful in stressing its elements of novelty and practical usefulness (Hassink, 2010). In this sense, the most diffused narrative tend to recognize at least three main strands in the definition of resilience (Martin, 2012; Pendall, 2010; Evenhuis, 2017). These, in turn, can be reconnected to two opposing economic approaches (Boschma, 2014): on the one hand, the so called engineering-based view of resilience is closely linked to an “equilibrium” perspective, in which the most resilient economies are those able to return to the previous steady state, following a shock, in a similar vein to the “plucking model” proposed by Friedman (Fingleton et al., 2012). According to this view, as stressed by Hassink (2010), resilience can be mainly reconnected to a process of adjustment: in other words, what matters in this approach is the quickness trough which a system can recover its initial configuration (Pimm,1984). On the contrary, the ecological approach is closer to an evolutionary view: it stresses how regions renew and adapt in order to face shocks, trough a process which do not necessarily lead to the previous equilibrium, but rather to a new one (Holling and Gunderson, 2002; Swanstrom, 2008). Reggiani et al. (2002) provided a key contribution in this area, having pioneered the exploration of these two views from an economic point of view, carefully exploring their differences and similarities. They followed Perrings et al. (1998) in bridging the gap between economic theory and the fields where the concept of resilience was originally developed, like ecology and psychology.
8 Martin and Simmie (2010) and Cowell (2015) discuss the effects of “slow burning” crisis, in the UK and the US respectively
The third approach was shaped, in an original fashion, within the field of economic geography (Pike et al. 2010); thus, it is even more inclined toward an evolutionary approach, and it is currently the favoured one among economic scholars (Cristopherson et al., 2010). According to the early proponents of this view, the response to shocks does not happen in a vacuum: regional growth cannot be defined as a series of silos (equilibria) separated by moments of crisis. On the contrary, growth is a long term process of continuous reconfiguration. Clearly, this view excludes the notion of stable equilibria, both the unique one of the engineering approach and the multiple one of the ecological view. Martin (Martin and Simmie, 2010; Fingleton et al., 2012) is among the most prominent supporters of this view, having claimed that “while not denying the value and possible relevance of such an equilibrist interpretation, our interest is much more in how far and in what ways resilience can function as an evolutionary concept” (Martin and Simmie, 2010, pp. 28): in this vein, the evolutionary element of resilience stems mainly from the incessant process of reconfiguration that characterizes regional economies. In this sense, resilience can be described a dynamic quality, rather than a stable attribute (Pendall et al. 2010).9 To provide a depiction of this characterization, it
is useful to look at Glaeser (2005), that carefully follows the evolution of the city of Boston, from its foundation (in 1630) to 2003. This study provides an accomplished example of what resilience is, despite not being focused on resilience itself, but more generically on the relentless flow of adaptation and renewal that ensured Boston’s survival and prosperity despite the downturns the city has faced. What emerges from this account is that path dependency matters in shaping regions’ success: in a sense, phases of crisis, as well as successful ones, were inscribed in the history of Boston, its specialization and its resources, in terms of both labour and capital. However, this does not exclude the importance of certain features, that we might claim accounted for Boston’s resilience: quite the contrary, it suggests that the evolutionary vision, which encompasses elements of path dependency, may be the most appropriate approach to resilience. First, Boston quickly emerged as an entrepreneurial city, with a strong orientation toward exporting refined products. This attitude was favoured by its natural location, being Boston an ideal place for a harbour, and, paradoxically, by its lack of
natural resources, that compelled Bostonian to dedicate themselves to the refinement of products made elsewhere. This bring us to the second point: at the end of the 19th
century, Boston reoriented from being a trading city toward being a manufacturing centre without excessive difficulties. In fact, Boston was considerably diversified, with a large share of its population composed by artisans, producing the goods sailors were shipping, and bankers, ensuring the existence of a well-oiled credit system. Interestingly, this financial system emerged even more lately, around the 1980s, when de-industrialization harmed many US cities, like Pittsburgh and Detroit. Third, Boston could rely on an above average human capital throughout its history, starting with its original settlers, Lutherans that stressed the importance of reading and writing, to its skilled sailors, who led the construction of Boston maritime empire in the early 19th
century, to its universities, paramount in the last 30 years Boston’s resurgence, as a financial, tech and education lab. Finally, Boston benefited from its strong, democratic institutions, which avoided hysteris: on the contrary, they eased changes policies’ renewal, as economic tides changed. At the same time, this ensured that Boston remained an attractive city for residents even during downturns, given its wealth of reliable, citizens’ oriented services. 10
In addition to providing a vivid picture of resilience “in action”, the above description introduces the themes of resilience’s determinants. Even more, it confirms some of the key factors identified by Fingleton et al. (2012) and Cristopherson et al. (2010): a strong regional system of innovation (Cooke, 2001), an entrepreneurial and skilled population, a good finance system, adequate infrastructure and a diversified economy, all contribute to increasing resilience.11
2.2 Empirical findings in the field
An interesting aspect that I have not tackled yet concern the operationalization of resiliency: in other words, what should we look at if we want to define how resilient a regions is? A first issue, which was already encapsulated in the previous discussion,
10 The role of institutions for building resilience is one of the most overlooked theme in this field of study (Balland et al. 2015), despite its importance
11 For a broad overview on resilience determinants, Evenhuis’ (2017) review provides a good starting point
concerns the dynamic nature of resiliency. In other words, some characteristics apt to enhance the resistance of a region may be detrimental when conditions mutates. In this sense, a naive view of the Boston case might suggest that having a good provision of natural resources, in terms of wood, provided Boston with increased resiliency during the second half of the 19th century: however, when the steam boat era came, that
endowment was no longer relevant. It was not wood that was crucial for Boston’s resiliency, despite its positive role in Boston’s growth, and the fact that it helped the city to survive its first difficulties. Thus, it is unsurprising that the overall ability of a region to resist a crisis may vary trough time: as a consequence, a single measure of resiliency calculated at one point in time may be rather insignificant. Crucially, this does not answer the upstream question: how can we measure resiliency?
One of the most relevant aspect concerning resilience is that it can be better understood if it is divided in different parts. We can imagine the case of an economy A which lose few jobs position during the height of the crisis, but, following it, is not able to recover even those few jobs, whilst an economy B may follow the opposite path.12 This
introduces the crucial difference between resistance and recovery: the former entails the ability of a region to avoid the negative effects of a downturn, whilst the latter is focused on how quickly an economy is able to recover from it. Most theorical studies concerned with resilience tend to distinguish between this two measures. We can be even more precise with respect to this second dimension: in fact, the process of recovery typically takes place trough reorganisation and reorientation of local industrial activities (Martin, 2012). Martin and Simmie (2010) propose a different framework – the so called “adaptive cycle”, based on the panarchy model proposed by Holling and Gunderson (2002) distinguishing two phases, one of “conventional” growth, and another of change and reorganization, triggered by a crisis. Their idea is that as economies undergo a phase of growth (i.e. accumulation of resources), they tend to become more rigid: essentially, routines becomes entrenched in more and more productive aspects. Hence, resilience, which in this case is meant as quickness and
12 We may say that the “memory” of the crisis (Cross, 2009) in economy A is much stronger than in economy B
flexibility in producing countermeasures, may diminish.13 When shocks hit an economy,
the growth phase is halted, causing routines’ disruption and an overall reorganization, breaking established relationship and forming novel ones. This opens up a new phase of growth, and consequently a new loop. We can find a depiction of how this whole process has taken place in two UK cities: Swansea and Cambridge, where the former failed to properly reorganize following the effects of two major shocks (1980-1983; 1990-1992) and a slow burn crisis revolving around the overall trend of de-industrialization that affected the UK. On the contrary, the latter thrived thanks to a mechanism of “branching out”, which resembles the one described in the Boston case. The reorganization of Cambridge has been more successful than the one in Swansea essentially because it promoted the development of endogenous knowledge, whilst the reorganization in Swansea relied on FDI from Japanese companies. Furthermore, development of local knowledge in Cambridge eased a process of differentiation, whilst Swansea remained strictly focus on electronics.
Until now, despite having gained a clearer look on what resilience, we have not yet enter the realm of quantitative analysis. A first, and very intuitive way to tackle this issue is to look at GDP per capita and employment rates during crisis and the following periods, as way to measure alternatively resistance and recovery (Martin and Gardiner, 2016). Interestingly, employment have usually been considered the most useful indicator in this sector. The rational is quite intuitive: employment rates have been historically more sensitive, compared to GDP, to economic downturns, in the sense that companies tend to resort to lay-offs as a way to limit the damages of diminished fund availability and reduced demand.
A second way to look at resilience is to take into account the national trend by comparing the percentage decline in one region and the national one, trough a simple ratio, that Fingleton et al. (2012) define as a “sensitivity ratio”: if the result is higher than one, this implies a higher regional sensitivity compared to the overall national one.
13 This argument may remind the discussion, in the strategic literature, concerning the value of ambidexterity: routines increase the efficiency of firms, but often end up to be detrimental for exploration and innovation. This trade-off, between rigidity/efficiency and flexibility/change, is central in the notion of resilience (Swanstrom, 2008)
In the same vein, the “recovery index” is the ratio between the percentage regional growth in the post crisis period and the corresponding national one.
Fingleton et al. (2012), studying UK NUTS1 regions, observe both these measures over forty years, including at least four major economic crisis: 1973–1975, 1980–1981, 1990–1993, and 2008–2009. One of the most notable finding of this work is that UK regions’ resilience have changed trough time: in the recession of the early-1980s, the southern and eastern U.K. regions were more resistant to the recessionary shock than the (industrial) regions in the Midlands and the northern areas of the United Kingdom, whilst the opposite was true for the following crisis. During the most recent downturn, the situation was fuzzier. Overall, southern regions showed a constant tendency to outperform northern ones in terms of their ability to recover from crisis. The two trends combined, resistance and recovery, account for the diverging trend in employment, which clearly favoured the south of the UK in the last forty years. Furthermore, there has been a decrease in the differences among regions in terms of their resilience, up until the last crisis, where the path of recovery has clearly favoured London over northern regions.14
Martin and his co-authors, which focused on the UK, are not the only scholars that have analysed resilience in national contexts. For instance, Modica et al. (2016) study Italian regions, more specifically the importance of variety (which, according to our previous discussion, is a key factor in promoting resilience), finding a positive effect over Italian NUTS2. Mina and Rocchetta (2017) broaden the exploration of variety’s role: in fact, following the works of Boschma (2014) and Frenken et al. (2007), they distinguish between different types of variety, essentially between related and unrelated variety. Their intuition is that redundant employees cannot be easily re-employed in sectors that are considerably different from their knowledge base; even more, factories can more easily start novel recombinant processes in areas that are close to their existing specialization. Thus, related variety may have a larger impact than unrelated one. The authors tested this hypothesis on a panel comprising 134 UK NUTS3 regions, focusing
14 According to the authors, this may be due to the fact that northern regions had to bear most of the weight of the austerity policies enacted by the government, targeting especially the public sector, prevailing in these areas
on the last crisis. 15The results suggest that related variety is indeed the one increasing
regions’ resistance to shocks. 16 Allegedly, re-orientation toward sectors which are close
to already existing specialization is easier than “jumping” to an unrelated sector, due to excessive cognitive distance.17 Already in the discussion concerning Boston we have
noted how the city’s variety was essentially related, and this eased the transition and reorientation phases. Additionally, Mina and Rocchetta (2017) find that patenting in high tech sectors has a positive effect on resilience, a result that potentially opens a new avenue in the investigation of resilience.
The investigation of the importance of technology in promoting resilience has been pursued also by Balland et al. (2015), that explicitly focus on the technological resiliency of US cities, looking at the evolution of patents granted in loco. What they find is that cities whose knowledge base is close to areas they have not yet explored are better suited to face shocks. Brackman et al. (2015) employed a sample closer to the one used in this study: in fact, the looked at European NUTS2, and in particular at the effect of urbanisation over resilience. They find that regions with a higher degree of population clustering around urban centres performed better during the crisis. Similarly, they find that a large output share in medium-high tech industries has a positive effect on resilience. Finally, Crescenzi et al. (2016) similarly looked at European NUTS2: however, they employed a multilevel analysis to study the impact of country as well as regional dimensions. With respect to the former aspect, account surplus is find out to be the stronger predictor of resilience, whilst education is the more relevant regional indicator. Their measure of innovation, namely regional R&D, is not correlated with resilience: this result does not particularly bother the present research, since VC does not strictly require, or entail, R&D expenditure.18
15 The panel covers the years 2004-2012
16 Related variety is measured by an indicator of regional technological coherence, built on the technological proximity of patents available in the region. Resilience is measured as the yearly percentage change in employment
17 Interestingly, this result is far from surprising: in a different context, Hausman and Hidalgo (2009) have pointed out nations’ tendency to follow their specialization in the product space, slowly moving in the branch where they enjoy a comparative advantage in term of available capabilities
18 Firm level R&D is usually a good predictor of VC investment (Baum and Silverman, 2004); however, VC investors typically focus their efforts in boosting marketing and commercialization expenses, once the investment deal is signed (Hellman and Puri, 2002)
3. Empirical analysis
3.1 Data and variablesOverall, this sample consists of 262 NUTS2, observed for fourteen years, from 2002 to 2015. Of the 27 members of the European Union, I excluded the smallest countries (Luxembourg, Cyprus, Malta, Slovenia) due to the insignificant amount of VC investment raised. Additionally, I also excluded Greece since I was not able to find information for key variables needed for my estimations, notably the number of patents. The effects of the shift to the newest NUTS classification, which can be traced back to 2013, but was not implemented before 2015, were taken into account: the data provided by Eurostat suffered from minor inconsistencies that were generally solved without data losses. The thorniest instance concerned the UKI area, namely “Greater London”: before 2015, this region was split into UKI1 and UKI2, which nowadays have been redefined into five smaller NUTS2. The fact that Inner London (former UKI1) is currently identified by two NUTS2 - UKI3 and UKI4 - jeopardizes a univocal assignment of VC investments to a single NUTS. To find a way around this problem, I tried multiple alternatives: the main solution adopted has been to recreate the old UKI1, summing or taking the average value (depending on the variable considered) of UKI3 and UKI4. Hence, even though it does not introduce any randomness in the attribution of VC investments, this solution implies a merger between two different NUTS classification (2010 and 2013).
A part from the Eurostat Regional Indicators, I relied on VentureXpert to construct my VC based variables. The merging procedure I employed is described in the Appendix. VentureXpert is one the most frequently used source of information on VC investment: for this reason, its reliability has been tested and, especially compared to alternative databases, it provides the best data, in terms of coverage and accuracy (Kaplan et al., 2002; Kaplan and Lerner, 2016). In this case, I focused exclusively on limited partnership companies, thus excluding CVC funds and business angels. This restriction might have had the effect of downsizing the effect of VC in my analysis: nonetheless, I
preferred a more stringent VC’ s definition, since, from a policy making perspective, enhancing conventional VC is not the same as strengthening CVC or business angel networks.
I used four main dependent variables to study resilience: the objective behind this choice is to underline different definition of both “resistance” and “recovery”. For each of these measures, the starting point is regional employment, expressed in thousands of people employed in each region (Empl).19 This choice is in line with most evidence in
this sector, which points toward a higher effect of economic shocks over the employment rate, rather than GDP per capita, as previously discussed. In what I define as model zero, I simply exploited the panel dimension of the data at my disposal to look at the impact of VC on the employment rate’s variation, which is a very intuitive measure of resilience. However, this approach does not allow to distinguish between resistance and recovery. Thus, the first measure on which I actually focused is the percentage variation in the employment rate considered over two periods. The first one, 2008-2011 is regarded as the crisis period; hence, a good performance over this arc of time would suggest that a region possesses a high resistance to shocks. The second period is 2012-2015, which is considered here as the recovery period: having a good performance in this period would imply good recovery capabilities.20
The second indicator I considered is exclusively focused on resistance (resistance_index): in this case, I looked at the variation between the actual employment rate over the crisis period and its expected value, forecasted using the exponential smoothing method.21 The measure is expressed as the ratio between these two values,
where a value lower than one suggest that an economy has underperformed compared to expectations, whilst the opposite is true if the value is higher than one.
19 Gross Domestic Product per inhabitant, per region (GDP), represents an alternative approach to the study of resilience, that I have taken into consideration in the robustness checks
20 Having considered many countries in this analysis, the division between a crisis and a recovery period is somewhat arbitrary: indeed, European countries have been affected in remarkably different ways by both the above mentioned crisis. In order to at least partially account for these differences, I considered also an alternative definition of crisis and recovery period, namely 2008-20XX and 20XX-2015
21 This method was chosen after comparing the resulting forecasts with alternative approaches, like the Holts’ Linear Trend and the Exponential Trend Method.
Fourth, I looked at a specific measure of recovery, in particular focusing on the speed of the process (recovery_index): in fact, I looked at the number of years it took a region to recover its pre-crisis level of employment, from the minimum value reached during the period 2008-2011, namely the crisis period. 22
Finally, I calculated the index originally developed by Fingleton et al. (2012) and exploited by Modica et al. (2016): this is essentially a ratio between the growth rate in employment at the regional and at the national level. Since it is calculated over the crisis period, a value higher than one suggests higher sensitivity to shocks, whilst a lower value hints at higher resistance. Notably, I have excluded this measure from the final analysis, after a preliminary scrutiny: in fact, the value obtained is at time difficult to interpret, due to sign issues.23 In addition, it is scarcely correlated with the actual
employment rate trend, and the model I employed was not able to explain a relevant portion of this index variation.
The independent variables employed in this analysis are the following: o Total amount of VC investment (in euros), per region (Inv) o Count of VC investments, per region (N-inv)
o Gross Domestic Product per inhabitant, per region (GDP) o Number of Patent Applications, per region (Pat)
o Number of inhabitants, per region (Pop)
o Percentage of population having tertiary education, per region (Educ)
o Number of scientists, per region (SE)
Inv and N_inv are the main regressors considered in this analysis. The first is the annual
amount of VC investment made in a region, whilst the second is the count of all VC investments made, per year, in an area. Importantly, they do not have the same economic meaning: in fact, what we might find is that some regions, despite having a
22 The pre crisis level of employment is the level of employment in year 2007. I also considered an alternative definition, where the pre-crisis level is defined as the average employment rate over the period 2005_2007.
23 For instance, Poland has had a positive performance over the period taken into consideration, as noted in the descriptive analysis (Section 3.2): thus, it would be impossible to provide an overall interpretation of the sign of this indicator
high investment’s level, heavily rely on big injections of funds, rather than a “constant” flow. In this sense, it is debatable whether a single, massive investment in a promising start-up can be more effective, for regional resilience, than a plethora of smaller investments. In fact, the second approach might be better, if continuing support is the more relevant aspect for start-ups (Samila and Sorenson, 2011). The remaining variables are control ones. Population (Pop) controls for the size of a region, whilst GDP per capita (GDP) tries to account for the economic development of an area. The number of patent application (Pat) controls for the innovative activities taking place in a region.
Educ and SE both control for regional human capital endowment, but the second with a
stronger focus over scientific prowess.
3.2 Descriptive statistics
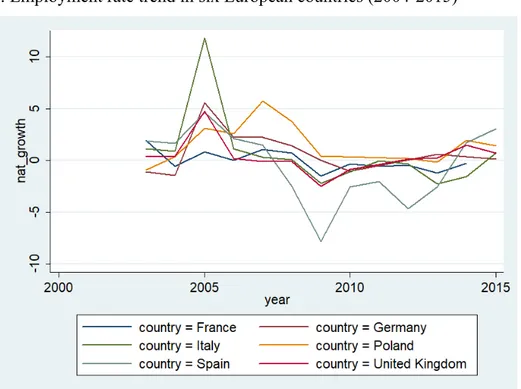
In Figure 1, we can observe the historical trend of the employment rate for six European countries: France, Germany, Italy, Poland, Spain and the UK. The negative peak that occurred in year 2009 is particularly noticeable, and it clearly affected all countries; nonetheless, it is worth noting that there are differences in terms of the harm caused by the crisis. For example, Spain was deeply affected by this shock, whilst, in Poland, the growth of the employment rate remained positive (constituting an exception in this sample) despite being considerably lower compared to previous years.
Another interesting feature that Figure 1 highlights is the impact of the Sovereign Debt Crisis, which further slowed European recovery starting from the end of year 2009. This is mostly visible in how stagnant the recovery process has been up until 2012, where the first signs of growth start to become more visible: Spain, which was clearly the country most affected by the downturn- reaching record levels of unemployment - started to bounce back in that year. In this context, Italy represents a notable exception, since its recovery did not take place before 2013. Finally, there is a positive and sizeable growth trend gaining momentum around years 2014-2015.
Figure 1: Employment rate trend in six European countries (2004-2015)
Source: own calculation
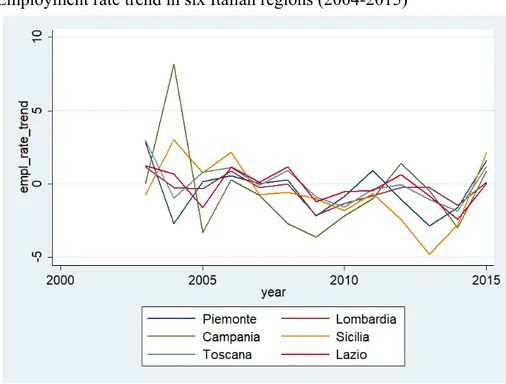
Unsurprisingly, the type of picture presented above is confirmed at the regional level as well: in Figure 2 are presented the effect of the crisis, in term of percentage employment growth, on a handful of selected Italian regions, namely Lombardia, Piemonte, Toscana, Lazio, Campania and Sicilia. These regions are among the biggest, in term of population, in Italy, and are distributed across the North, Center and South of the country. All these regions experienced a contraction in employment during the 2008 crisis: the only exception in the entire peninsula is represented by the Province of Bolzano, a relatively small and autonomous area. However, mimicking the results we observed at the national level, Italy’s peculiarity lies in the strength of the 2011 crisis, whose effect loomed over the economy up until 2012-2013, where the lowest employment rate was reached in the majority of regions. In this sense, Italy represents a laggard with respect to the recovery process, compared to the rest of European countries. Interestingly, the southern regions, Campania and Sicilia, where the ones that
experienced the highest contraction over this period: even more worrying is the fact that they started having overall lower levels of employment and GDP per capita compared to northern regions. Thus, the crisis arguably contributed to reinforce the Italian North-South economic divide.
Figure 2: Employment rate trend in six Italian regions (2004-2015)
Source: own calculation
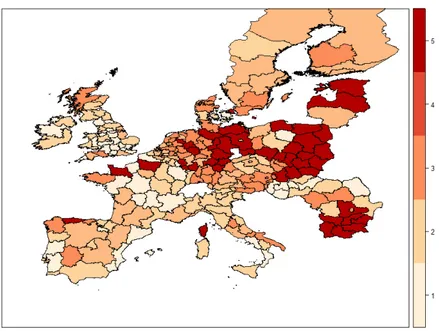
Figure 3 provide a more comprehensive view of the way in which European NUTS2 reacted to the crisis. In the map, regions have been divided into five quintiles according to their average growth rate in the period 2005-2007. Thus, this representation provides a picture of what was the ongoing situation before the slowdown which occurred in 2008.
The picture is far from being easily intelligible, but there are some noticeable trends that can be distinguished: regions belonging to the top quintile, namely the one that were experiencing the highest employment rate growth in Europe, belongs mainly to eastern European countries and eastern regions of Germany. This evidence should be coupled with the information concerning the relative economic backwardness of countries like Poland, Czech Republic and Hungary compared to the original members of the UE.
Figure 3: NUTS2 by quintiles of employment growth rate (2005-2007)
Source: own calculation
Nonetheless, we may argue that in the period 2005-2007, there was an ongoing catching up process that involved the newest members of the European economic area.24
Additionally, this picture confirms the healthy condition of the German economy following the difficulties faced at the turn of the century.25
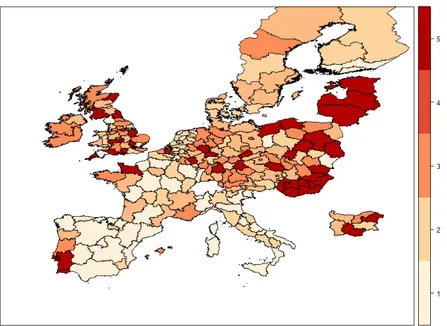
The picture changes in Figure 4, which takes into account the period 2008-2011. Two shocks hit European regions in rapid sequence, and their effects were disparate across European regions. A first impression suggests that the periphery of Europe (Romania, Bulgaria, Spain, Portugal and Ireland) was the area mostly affected by this shock, whilst the core, especially Germany, fared well the downturn. In fact, some regions in Germany, Austria, Belgium and Finland experienced a positive growth. Even more noticeably is the fact that, overall, Poland’s employment rate grew during this period. Following Crescenzi et al., 2016, we can notice how, during this period, there was an overall reduction in the within nation dispersion of employment rates: this implies that
24 Romania and Bulgaria joined the EU in 2007
25 Many commentators stressed the importance for this growth period of Schroeder’ labour market reform, which were enacted around 2002
regions with lower level of unemployment were the ones, on average, more affected by the crisis. However, this equalizing effect is not confirmed if we look at inter national differences: in this case, there has been a divergence phenomenon, which is arguably the one summarising by the Core vs Periphery analysis just mentioned.
Figure 4: NUTS2 by quintiles of employment growth rate (2008-2011)
Source: own calculation
Finally, the situation changes again over the period 2012-2015: one clear novelty is constituted by the very weak performance of Italian regions over this period, that fared the 2008-2009 crisis relatively well. On the opposite, Ireland and Portugal NUTS2 seem to be well placed to recover from the crisis: their regions belong to top quintiles of the distribution. The recovery was also strong in the UK, which was experiencing a sustained phase of growth, including some of the areas that suffered the most as a consequence of the 2008-2009 downturn. Overall, in this picture, the often mentioned division between Mediterranean and Northern countries seems to receive at best a partial confirmation, with notable differences between countries and regions as well. Furthermore, the divide is far less easily identifiable as simply a North vs South divide, with Eastern European countries following a peculiar trajectory.
Figure 5: NUTS2 by quintiles of employment growth rate (2002-2015)
Source: own calculation
3.3 Empirical estimates
First, I estimated what I defined as Equation (0):
(0) empl_rate = α +β VC measures + γ Χ + δ d_crisis + ε
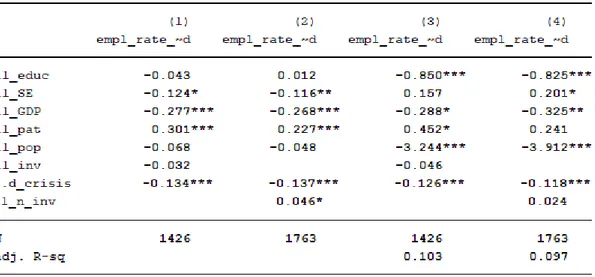
The explanandum in this case is the yearly percentage change in the employment rate, measured at the regional level. The main regressors are both VC measures we previously discussed. Χ is a vector of control variables, the ones that were introduced in Section 3.1, whilst ε is the error term. Finally, d_crisis is a dummy that takes value 1 in the years 2008 and 2009. All the independent variables are lagged by one period, and taken in logs. One of the most interesting aspects of this approach is that it fully exploits the panel dimension of the data at disposal. However, it fails to differentiate between resistance and recovery, providing only an intuitive idea of the impact of VC over resilience. Nonetheless, in Table 1 I reported the results obtained using the above specification: I used a Random Effect model, to consider both within and between
variability (Columns 1 and 2), and a Fixed Effect model (Columns 3 and 4).26 Looking
at the RE model, it is apparent is that only one of the measure of VC I exploited seems to have a statistically significant impact over the trend in employment during the period taken into consideration, namely the number of investment (n_inv). This is not particularly surprising: as mentioned in Section 3.1., the number of investment may be regarded as a more significant measure compared to the overall amount of investment. However, this effect is absent in Columns (3) and (4), possibly due to the fact that Fixed Effect models rule out between group variability. Overall, these results advise a cautious approach to successive estimates.
Table 1: VC Effect over the Employment Rate Trend (Random Effect and Fixed Effect)
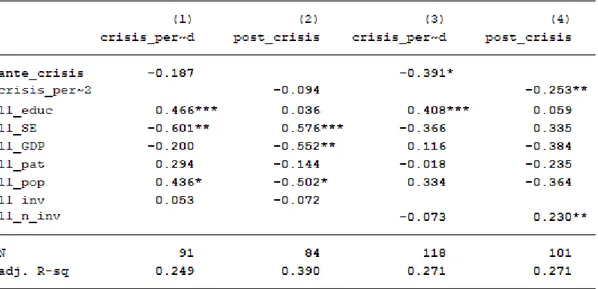
In Equation (1), I started to account for the difference between resistance and recovery. As discussed at length, there is no standardized approach to this theme: in Equation (1), I choose to look at the average employment growth during two periods: 2008-2011 and 2012-2015. According to this approach, the correlation with the first of these two variables (crisis_period) highlights regressors’ effect on regional resistance, whilst the second looks at recovery (post_crisis). In this case, the estimation was performed by
26 I preferred this model over the alternative Random Effect model in light of the results of an Hausman test
adopting a robust OLS estimator, with errors clustered at single regions level. In addition to the usual measures of VC and controls, all lagged by one period, I added the average growth in the employment rate over the previous three year period. Its effect can provide interesting insights on whether a convergence or divergence phenomenon was favoured by the crisis.
(1.a) crisis_period = α +β VC measures + γ Χ + δ ante_crisis + ε (1.b) post_crisis = α +β VC measures + γ Χ + δ crisis_period + ε
One key result obtained trough this model specification is that the amount of VC invested (inv) seems to have no impact on the employment rate during the peak of the crisis, as can be noted by looking at Columns (1) and (2). On the other hand, the number of VC investments (n_inv) has a positive and statistically significant effect on the employment rate during the aftermath of the crisis, i.e. on recovery (Column (4)), but not on resistance. Importantly, these results take into consideration the effect of the crisis itself, since the average growth in the previous period is considered. Finally, both models suggest a positive effect of education (educ) over employment during the crisis period.
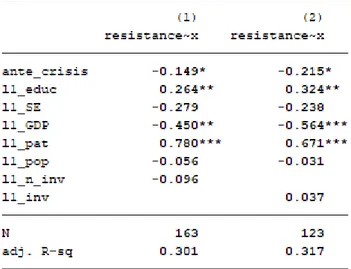
In equation (2) I exclusively focused on the study of resistance, as expressed by the variable resistance_index. In order to construct this variable, I looked at the divergence between actual and forecasted levels of employment, as described in Section 3.1. Also in this case, I exploited a robust OLS estimator. Finally, I used the same vector of regressors considered in the previous equations (X ), taken in logs and considered for the year 2007, namely the last year before the crisis.
(2) resistance_index = α +β VC measures + γ Χ + δ ante_crisis + ε
The results are presented in Table 3, where Column (1) takes into account the effect of the amount of investment (inv), whilst Column (2) looks at the total number of investment (n_inv). Overall, the results strongly point in the direction of a lack of effect of the provision of VC, regardless of the measure chosen, over resistance, which confirms the results obtained following Equation (1). In fact, neither of the measures chosen has an effect over resistance_index. On the contrary, the number of patents granted in a region and the level of education has a positive effect over resistance, suggesting that innovativeness and high human capital can indeed help during crisis. Finally, growth over the pre_crisis period and the level of GDP has a negative effect over resistance: this result echoes the one obtained by Crescenzi et al. (2016).
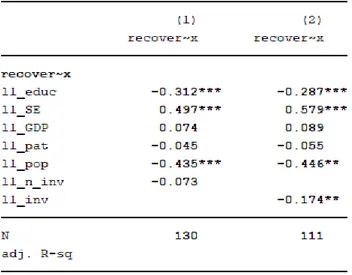
Finally, the model proposed in Equation (3) is focused exclusively on recovery. In order to achieve this result, I used the recovery_index, presented in Section 3.1. Given the nature of this indicator, I used an Order Probit model, to account for the fact that its values are ordered and finite, representing the number of years needed to recover from the crisis. The results are reported in Table 4, where the investments’ count (n_inv) is regarded in Column (1), whilst the total amount of VC invested in a region (inv) is considered in Column (2).
(3) recovery_index = α +β VC measures + γ Χ + ε
The result suggests that the amount invested, as expressed by inv, has an effect over the speed of recovery. More precisely, the negative sign of the coefficient indicates that higher investment increases the probability of belonging to lower classes, which, in this case, indicates lower amount of time needed to recover the pre crisis level of employment.27 This is quite interesting since it does not confirm the result found
looking at employment growth in the recovery period, where the number of investments (n_inv) was the only significant VC measure: however, this is not in direct contrast with the above mentioned result either. In fact, the two measures of recovery do not have the same economic meaning: quite the contrary, this finding should be analysed in further detail to understand the difference found. Finally, education contribute to speeding up the process of recovery as well, whilst the number of scientist (SE) seems to have a negative effect: this might be explained as a consequence of the long time needed to produce marketable ideas starting from scientific discoveries. In other words, this result do not suggest that the number of scientist is bad per sé, when it comes to recovery, but that it might slow down the process.
27 This result is confirmed also by looking at the alternative measure of pre_crisis level of employment, namely the average rate over the period 2005_2007
Conclusion
The contribution of this work is twofold: the first is focused on the difference existing between resistance and recovery, which are conceptually different aspects of resilience and thus should be investigated in separate terms. In this work, I defined two indicators, respectively focused on resistance and recovery, to investigate both dimensions. The former is built as a ratio between the growth of the employment rate and its expected value, thus highlighting the impact of an economic shocks over a “counterfactual” trajectory. The latter focuses on the temporal dimension of resilience: in this sense, it looks at the time needed to recover from the minimum level of employment reached during a crisis to a region’s pre crisis level.
The second contribution of this work is the investigation of the role of venture capital over resilience: I have described two main mechanism trough which this effect may explicate. The first is the promotion of innovation generated by VC investments, which can have a positive impact over regions’ resilience, shifting production to medium/high tech sectors (Brackman et al., 2015). The second link is the enhancement of entrepreneurship. This is true not only because VC directly finance new companies, but also because the presence of VC generates positive expectations, among local business people, concerning their chances of obtaining funding.
Our preliminary results largely confirm the evidence found in previous works: as noted by Crescenzi et al. (2016), the geography of the crisis is far more complex to interpret than a superficial narrative would suggest. In fact, the North-South divide rhetoric overlooks many intra national as well as inter national differences, not to mention the fact that it largely ignores the peculiar trajectory followed by Eastern European countries. With respect to the main conclusions, they point mainly into two directions: first, I was not able to identify any significant effect of VC investment over any of the measure of regional resistance I adopted. This suggests that neither the amount of VC invested, neither the number of VC deals affect the ability of a region to resist the effect of a crisis. However, the second conclusion is that an effect is visible when it comes to recovery: this is true both with respect to the growth of the employment rate, and to the quickness of the recovery process. Both these results should be cautiously considered: there are numerous caveat concerning the nature of the relations observed, especially
with respect to the linkage mechanism and to the possibility of extending these results to other crisis, or geographical areas. Nonetheless, a possible interpretation of this evidence is that, being VC a pro cyclical investment, its effect during periods of crisis is limited at best. On the contrary, it is an integral part of the recovery process. It is debatable whether keeping a high level of VC investment during crisis periods could have a positive impact over resistance: however, it is unlikely that active partners of VC funds would be interested in making sizeable investments in periods when their chances of successful exits are small.
Appendix: The Merging Procedure
Eurostat Regional Indicators and the Thomson VentureXpert are not structured in a way that allows an immediate merge: the latter source presents information gathered at individual investment in single companies, whilst the former is built with respect to geographical units. In particular, the unit of analysis taken into consideration here is the NUTS2 level which, as mentioned, roughly corresponds to regions. Thus, a first challenge to be addressed was displacing the information provided at the firm level to a regional one. To do so, I exploited VentureXpert information concerning the location of investees. The database did not provide an immediate connection to the regions (NUTS2) where the companies are situated, only providing the city and address. The NUTS classification does not present a level as granular as cities: NUTS3, the more detailed level of granularity, tends to represent bigger aggregates. As a consequence, further information was needed to connect cities and provinces. An effective solution was obtained thanks to another standard, namely the LAU one which, as discussed, can be easily reconnected to NUTS. Thus, in my work, LAU worked as a bridging database, crucial to build the final source of information. Overall, the LAU database I used encompasses 119586 municipalities.
However, the initial result for the merge were unsatisfying: indeed, many locations reported in the VentureXpert database did not have a corresponding one in the LAU classification. After a check on which could be the sources of this additional problem, it quickly emerged that slight differences in how cities were reported were the cause. To solve this issue, I resorted to a “fuzzy” merge, able to reconnect cities with similar names even in the case of slight differences in how their names were written.
Despite being a useful step toward the final database, I performed an additional check. A coefficient provides the quality of the merge: if this coefficient is equal to one, the cities’ names were exactly the same in the two databases; if it is lower than one, there are differences, growing bigger as coefficients decrease. The percentage of perfect merges was exactly the same as the percentage of merges obtained by not accounting for small differences in the spelling of cities, but many additional merges were obtained with values very close to one. I identified 0,95 as a good threshold of “good” merges.
However, I manually revised the results, looking to increase the size of the “good” merges.
Bibliography
Attaran M. (1985), “Industrial diversity and economic performance in U.S. areas”, The
Annals of Regional Science, vol. 20, pp. 44-54
Attaran M. (1987), “Entropy and Other Measures of Industrial Diversification”,
Quarterly Journal of Business and Economics, vol. 26, pp. 17-34
Audretsch D., Feldman M. (2003), “Knowledge Spillovers and the Geography of Innovation”, in J. Henderson, J. Thisse (2004), Handbook of Regional and Urban
Economics, Elsevier
Balland P.A., Rigby D., Boschma, R. (2015), “The Technological Resilience of US Cities”, Cambridge Journal of Regions, Economy and Society, vol. 8, pp. 167–184 Boschma R. (2005), “Proximity and Innovation: A Critical Assessment”, Regional Studies, vol. 39, pp. 61–74
Boschma R. (2015), “Towards an evolutionary perspective on regional resilience”,
Regional Studies, vol. 49, pp. 733-751
Brackman S., Garretsen H., and van Marrewijk C. (2015), “Regional resilience across Europe: on urbanisation and the initial impact of the Great Recession”, Cambridge
Journal of Regions, Economy and Society, vol. 8, pp. 225–240
Coad A., Nightingale P., (2014), “Muppets and gazelles: political and methodological biases in entrepreneurship research”, Industrial and Corporate Change, vol. 23, pp. 113–143
Conroy M. (1975), Regional Economic Diversification, New York: Praeger
Cooke P. (2001), “Regional Innovation Systems, Clusters, and the Knowledge Economy”, Industrial and Corporate Change, vol. 10, pp. 945-975
Cowell M. M. (2013), “Bounce Back or Move On: Regional Resilience and Economic Development Planning”, Cities, vol. 30, pp. 212–222
Crescenzi R., Luca D., Milio S. (2016), “The geography of the economic crisis in Europe: national macroeconomic conditions, regional structural factors and short-term
economic performance”, Cambridge Journal of Regions, Economy and Society, vol. 9, pp. 13-33
Christopherson S., Michie J., Tyler P. (2010), “Regional resilience: theoretical and empirical perspectives”, Cambridge Journal of Regions, Economy and Society, vol. 3, pp. 3–10
Christopherson S., Belzer M. (2009), “The next move: metro regions and the transformation of the freight transform and distribution system”, in N. Pindus, H. Wial, H. Wolman, Urban and Regional Policy and Its Effects, Washington, DC: The Brookings Institution
Conroy M. (1975) Regional Economic Diversification. Praeger, New York, NY.
Cross R., McNamara H., Pokrovskii A. (2009), “Memory of Recessions”, Discussion Papers in Economics 10–09. University of Strathclyde, Department of Economics, Glasgow
Da Rin M., Helman T., Puri M. (2011), “A Survey of Venture Capital Research”, NBER Working Paper Series
Dissart C. (2003), “Regional Economic Diversity and Regional Economic Stability: Research Results and Agenda”, International Regional Science Review, vol. 26, pp. 423-446
Dijkstra L., Garcilazo E., McCann P. (2015), “The effects of the global financial crisis on European regions and cities”, Journal of Economic Geography, vol. 15, pp. 935–945 European Commission
Evenhuis E. (2017), “New directions in researching regional economic resilience and adaptation”, Geography Compass, vol. 11, pp. 1-15
Fingleton B., Garretsen H., Martin R. (2012), “Recessionary shocks and regional employment: evidence on the resilience of U.K. regions”, Journal of Regional Science, vol. 52, pp. 109–133
Florida R. (1996), “Regional Creative Destruction: Production Organization, Globalization, and the Economic Transformation of the Midwest”, Economic Geography, vol. 72, pp. 314-334
Frenken K., Van Oort F. G., Verburg T. (2007), “Related variety, unrelated variety and regional economic growth”, Regional Studies, vol. 41, pp. 685-697
Friedman M. (1988), “The ‘plucking model’ of business fluctuations revisited”, Economic Inquiry, vol. 31, vol.171–177
Gardiner B., Martin R., Sunley P., Tyler P. (2013), “Spatially unbalanced growth in the British economy”, Journal of Economic Geography, vol. 13, pp. 889–928
Glaeser E.L. (2005), “Reinventing Boston: 1630–2003”, Journal of Economic
Geography, vol. 5, pp. 119-153
Griliches Z., Pakes A. (1980), “Patents and R and D at the Firm Level: A First Look”, NBER Working Paper No. 561
Hassink R. (2010), “Regional resilience: a promising concept to explain differences in regional economic adaptability?”, Cambridge Journal of Regions, Economy and
Society, vol. 3, pp. 45–58.
Gunderson L. H., Holling C. S. (2002), Panarchy: Understanding Transformations in
Human and Natural Systems, Washington DC: Island Press
Hall B. (2011), “Innovation and productivity”, NBER Working Paper
Hall B., Lerner J.,(2009), “The financing of R&D and innovation”, UNU Merit Working Paper Serie
Kaplan S. Lerner J. (2010) “It Ain’t Broke: The Past, Present, and Future of Venture Capital”, Journal of Applied Corporate Finance, vol. 22, pp. 1-12
Kaplan S., Lerner J.(2016), “Venture Capital Data: Opportunities and Challenges”, HBS Working Paper
Kaplan S., Schoar A. (2005), “Private Equity Performance: Returns, Persistence and Capital Flows”, Journal of Finance vol. 60, pp. 1791-1823
Kaplan S., Sensoy A., Stromberg P. (2002), “How well do venture capital databases reflect actual investments?”, SSRN
Kedrosky P. (2009), Right Sizing the U.S. Venture Capital Industry, Kaufmann Foundation
Kortoum S., Lerner J. (2000), “Assessing the Contribution of Venture Capital to Innovation”, The RAND Journal of Economics, vol. 31, pp. 674-692
Lahr H., Mina A. (2016), “Venture capital investments and the technological performance of portfolio firms”, Research Policy, vol. 45, pp. 303–318
Martin R. (2012), “Regional economic resilience, hysteresis and recessionary shocks”,
Journal of Economic Geography, vol. 12, pp. 1–32
Martin, R., Sunley P. (2014), “On the notion of regional economic resilience: conceptualisation and explanation”, Journal of Economic Geography, vol. 14, pp. 1–42 Martin, R., Sunley, P., Gardiner, B., & Tyler, P. (2016). How Regions React to Recessions: Resilience and the Role of Economic Structure. Regional Studies, 50(4), 561–585
Modica, M., & Reggiani, A. (2015). Spatial Economic Resilience: Overview and Perspectives. Networks and Spatial Economics, 15(2), 211–233
Mina A., Rocchetta S., (2017), “Technological Coherence and the Adaptive Resilience of Regional Economies”, Papers in Evolutionary Economic Geography, Utrecht: Utrecht University
Pendall R., Foster K. A., Cowell M. M. (2010), “Resilience and Regions: Building Understanding to the Metaphor”, Cambridge Journal of Regions, Economy and Society, vol. 3, pp. 71–84
Perrings C. (1998), “Resilience in the Dynamics of Economy-Environment Systems,”
Environmental and Resource Economics, vol 11, pp. 503–520
Pimm S. (1984), “The complexity and stability of ecosystems”, Nature, vol. 307, pp. 321-326
Reggiani A., de Graff T., Nijkamp P. (2002), “Resilience: an evolutionary approach to spatial economic systems”, Networks and Spatial Economics, vol. 2, pp. 211–229 Rodriguez-Pose A., Crescenzi R. (2008), “R&D, spillovers, innovation systems and the genesis of regional growth in Europe”, Regional Studies, vol.48, p. 51-67
Samila S., Sorenson O. (2011), “Venture Capital, Entrepreneurship and Economic Growth”, The Review of Economics and Statistics, vol. 93, pp. 338–349
Simmie J., Martin R. (2010), “The economic resilience of regions: towards an evolutionary approach”, Cambridge Journal of Regions, Economy and Society, vol. 3, pp. 27-43
Swanstrom, T. (2008), “Regional Resilience: A Critical Examination of the Ecological Framework”, Working Paper 2008-07. Institute of Urban and Regional Development, UC Berkeley
Teece D., Pisano, Shuen (1997), “Dynamic capabilities and strategic management”,
Strategic Management Journal, vol. 18, pp. 509-533
Ueda, M., Hirukawa, M. (2008), “Venture capital and industrial innovation”, CEPR Discussion Paper
Ueda M., Hirukawa M. (2011), “Venture Capital and Innovation: Which is First?”, Pacific Economic Review, vol. 16 pp. 421–465
Vale L. J., Campanella T. H. (2005), The Resilient City: How Modern Cities Recover
from Disaster, New York: Oxford University Press
Van Praag C. M., Versloot P. H. (2007), “What is the value of entrepreneurship? A review of recent research”, Small Business Economics, vol. 29, pp. 351-382
Walker B. H. (2002), “Ecological resilience in grazed rangelands: a generic case study”, in L.H. Gunderson and L. Pritchard Jr. (eds). Resilience and the Behavior of Large-Scale Systems, pp. 183–194. Washington, DC: Island Press.
Wagner J., Diller S. (1998) “Measuring the Effects of Economic Diversity on Growth and Stability”, Land Economics, vol. 74, pp. 541-556