A N O T E O N G O O D N E S S O F F I T TEST USING MOMENTS G . Li, A. Papadopoulos
An important problem in statistical applications is to test whether or not an as- sumed model gives good fit to the data. Among the most commonly used proce- dures for testing goodness of fit of a parametric family is the Pearson-Fisher chi- square test (see Fisher, 1922, 1924). The Pearson-Fisher chi-square test involves partitioning the real line into a number of cells and then comparing the observed cell frequencies with the expected cell frequencies using a chi-square test statistic. The chi-square test is easy to use and applies to almost any parametric family. O n the other hand, it also has the drawback that the selection of its partition is arbi- trary. Furthermore, for a given partition, the rejection power of the chi-squared test can change dramatically between different alternatives.
Another general approach to goodness of fit test is to use some distance statis- . -
tics such as the Kolmogorov-Smirnov statistic and Anderson-Darling statistic among others. Compared with chi-square tests, distance tests have the advantage that they do not involve subjective selection of a partition. O n the other hand, most distance tests are appropriate only for testing the simple hypothesis whether a set of observations are from some completely specified distribution function. When certain parameters of the distribution must be estimated from the sample, they no longer apply. Lilliefors (1967, 1969, 1973) studied the use of distance sta- tistics to test goodness of fit of the normal, exponential family, and gamma fami- lies. In recent years, considerable efforts have been made to extend distance tests to test the composite hypothesis of a general parametric family, using transforma- tions of sotne generalized empirical processes; see, e.g., Khmaladze (1993) and Sun (1997) among others. IIowever, the resulting tests have not been widely used in practice partly because they are often very complicated and not easy to use.
Many other goodness of fit tests have been proposed in the past for some spe- cific parametric families; see D'Agostino and Stephens (1986) for a comprehensive review of goodness of fit techniques. Among them are some tests of departure from norn~ality using the sample skewness ( L h, ) and the sample kurtosis ( h 2 ) For
tively. Moreover, the exact distributions of ,I?, and 17, are known in normal satn- pling (see Pearson and Hartley, 1970, table 34), which can be used for testing de- parture from normality. W e point out that the ( l
6,
, bl) method is moment-based and applies only to normality testing. Very tew results are lcnown for the distribu- tions of ,h, and h, in nonnormal sampling.The main purpose of this article is to introduce a simple moment approach to testing goodness of fit based on some moment structure of a parametric distribu- tion family. This approach has some appealing features For example, the idea is very simple since it only involves comparison of sampling nmnents with population moments. It is applicable to a variety of discrete or continuous parametric families, \xrhile the ( ,hl , bL) method is only known for testing normality. The proposed tests only use the standard normal (or chi-square) table and thus are easy use in practice. Compared with chi-square tests, the moment b;ised nietllod docs nor in- volve subjective selection of a partition. Tt also demonstratcci superior and more stable rejection power than chi-square tests for different alternatives in our limited simulation studies.
In section 2 we describe the general tnoment-based method. \Ne also illustrate this approach by deriving moment based goodncss of tests of some cotntnon para- metric familics. I n section 3 we report results from a simulation study to compare the of the moment based tests with some chi-square ,md distance tests.
Assume that X,,
. .
. , X, are independent idcnticiilly distributecl 1 aridom variables iron1 a cumulative distribution tunction F. (hnsidcr the problem of testing the null hypothesisU,, : F is a nlember of a parametric family Fo, 8 E 0 , where 6) is a subset of R".
T.et in, = jx' &FB(%) denote the L-t11 m.onlcnt of P,,. The iolloiving basic assump-
tion will be 11sed throughout this paper.
Assumption A, Assume that m,, exists for some pwitivc integer r and tllat m , , ....
rxz, satisfy the following equation
for some function g : R'
-+
R.In many situations, it is easy to find a function g satisfying Assumption A. For in- stance, if a parametric distribution is symmetric about its mean, then
E(X
- m,)'=
0.In general, existence of g satisfying Assumption A is feasible given the fact that m,, m?,
.
. . all depend on a common finite dimensional parameter 0.2 . 2 .
?h
test1:
Let &, = X ; / n bc the sample moment of i-th order,
i
= I , 2, ...
/ = l
Thewcm I . Assume that Assumption A holds. Assume further that g is continu-
ously differentiable. Then, under E l o ,
m ) c (. r , ) ( g ( m , , . . . , 2 p, .d g ( q ,..., m , )
c h z , ' " ' dm, &E, ,..., (3rnT
-ilror,l: By the central limit theorem, i n conjunction with the (:ramdr-\%'old device,
the random vvctor
convergrs in distribution to ~ - v ~ r i a t c normnl with mean vector ( 0 , .., O ) and covxidnce rndtrix E. 'This, togethcr with tlic delta ~nethoci, irnplivs that
where I!(@) i i s tietined h! 12 l)
Let CI= O(X,, , X<) be a consistent estimate, of H under II,,. Assurr~e that m , ,
.. , m,, <Ire continuous functtona of 0. 'Shen. 1'10) i~ a con&tent estimate ol \'(Q) under [ I , , Define
7' == n g ( G , , .. , h, )/ , \'(H)
'l'hcn, it follows frorn Theorem L that under /lo,
,L
A
Y(0, l las n X . This lcads to thc lollowing level U test of H,,: Reject H,, ii
l
T /
> z,,/~.where is tllc upper 4 2 pcrcentile of the standald normal distrihltion.
R e m a d I .
A
consistent estimate O of O under H,, c m usually be obtained using either the method of rnoments or the method of' maximum likelihood (see Bickel and Doks~rm, 1979, chaptcr 3 ) . It would be difticult to say in general whether one method is preferred to the other. Only one method is used in each of the examples in section 2.3 for the purpose of illustration.7 4 C . Li, A. I'apadopouh
Remark 2. There may exist several functions, say g,, . . . , gk, satisfying Assumption A and, sometimes, one may wish to combine these functions to test goodness of fit. One may conduct several tests based on gl,
...,
gk, separately. W e refer the readers to Mardia et al. (1979, pp. 127-131) for the Roy union-intersection princi- ple and Pallini (1994) for combinations of dependent tests and their optimality. O n e may also derive a chi-square test using the multidimensional function g = (g1,...,
gklT. With g being k-dimensional, Theorem 1 still holds with the limiting distri- bution being a k-variate normal distribution with m:an O and covariance q a t r i x V(6) given by (2.1). Define Q = ng7'(hl, ...,h,)
V-'(@) g(&,,...,
A,),
where 8 is aconsistent estimate of 8 under
HQ.
Then, underI-l;
and some regularity conditions, Q has a chi-square limiting distribution with k degrees of freedom. Therefore Q can be used to test H,, in the usual manner.W e note that the ~ r o ~ o s e d test may not have good power to distinguish between certain prametric families such as normal and logistic distributions. A related ques- tion is whether or not there exists a test function g(.) which maximizes the rejection power against a given parametric alternative. W e have not been able to find a satis- factory solution to this problem so far, and future research is warranted.
2.3. Application to some common distribution families
To illustrate the proposed approach, we derive some moment-based goodness of fit tests for some common parametric distribution families. Although one may ob- tain more than one g satisfying Assumption
A
in the examples considered below, for simplicity, we only give a test based on a single function g in each example. Note that to obtain the test statistic T defined by (2.2), we need to find a function g satisfying Assumption A. In addition, we need to express m l ,...,
m2, in terms of8 in order to find V(%) defined in (2.1).
2.3.1. Test for exponential distribution
T o test
I-I,,
: F(x) = l - exp(- X/$), X > 0, we take r = 2 and g(x, y) = y - 2x2. Because m, = 8 and m, = 202, we have g(ml, m,) = 0 for all 8 0. After some alge- braic calculations, it is shown that V(8) = 48'. Estimate 8 by 8 = h , . Then, the teststatistic
T
defined by (2.2) reduces toThis can be further written as
n n
where
X
= C X , / n and s2 =C ( x 2
- X)'/n are the sample mean and samplei = l i=l
2.3.2. Test for normality
To test the null hypothesis that the sample X,,
...,
X, are from a normal di- stribution N ( p , 0 2 ) , where p ando2
are unknown, we take r = 3 and g ( ~ , y ,z)
=z - 3xy
+
2%'. It can be verified that g ( m l , m,, m , ) = 0 for all 8 = ( p , 0 2 ) . Estimaten rj
8 = ( p , 0 2 ) by 8 =
(X,
5') whereX
=C
X , / n and s2 =C ( X ,
- % ) ' / n are the2=1 2=1
sample mean and sample variance, respectively. Then the test statistic ?'is given by
where V ( 8 ) is defined by (2.1) with
and
2.3.3. Test for gamma dist~ibution
To test the null hypothesis that the sample XI, ..., X,, are from a gamma distri- bution with the following probability density
where t3=
(a,
p),
a
> O and,B
> 0, we take r = 3 and g(x,y,
z ) = xz+
x2y - 2 3 ~ ~ . Itcan be shownA that &zl, m2, m,) = O for all 8 =
( a ,
p),
(X > 0 andp
> 0. Estimate 8 = ((X,p)
by $ = ( x 2 / s 2 , X / s2) . Thcn, our test statistic ?'is given by, \ n
+
&:?h2
- 2 h 31 = - - . ..
\
,
76 G. Li, A Pupadopouios
and
mi=,@ia(a+ 1)
...
( " + l - l ) , f o r j = 1,...,
6 .2.3.4. Test for beta distribution
T o test the null hypothesis that the sample XI,
...,
X, are from a beta distribu- tion with the following probability densitywhere 8 = (a, h ) , a > O and b > O are unknown, we take r = 3 and g(x, y,
z )
= z(2x2 -X - y ) - y(x2 + x y - 22). It can be verified that g(m,, m,, m,)
=
0 . Therefore, thetest statistic for
H.
is2
T = \n(m3(2m: - m,
-
m 2 ) - m2(m,+
mlm2 - 2 m 2 ) ) / \V(%) ,where
i)=
(2,
b) = ( & , ( h z - r ; ~ ~ ) / ( h : -h z ) ,
2(1 -;,/h,)
and V ( @ ) is defined by (2.1)with
= (4m1m3 - m, - 2m1m2 - mi,4m2 - m, - m: - 2m1m,,2m: - m, - m,),
and
2.3.5. Test for uniform distribution
T o test the null hypothesis that the sample X,,
..., X,
are from an uniform dis- tribution with the following probability density1
f*(x) = -
b - a '
where 8 = (a, b ) , - a, < a < b < are unknown, we take r = 3 and g ( X , y ,
z )
=z
- 33cy+
2x3. It can be verified that g(m,, m,, m,)=
0 . Therefore, the test statistic for H. is, \ n
(A3
- 3 4 A 2+
2A; )r =
,
V ( @ ),
where 8 = (2, b) = (min ( X , ) , max {X,)) and V ( 8 ) is defined by (2.1) with c3g(ml,m2,mi) dg(mI,m2,m3) &(ml,m2,m3)
1
= (-3m,+
6m:, -3m1, l ) :I am, ' h 3
A note on goodncsi offit test U J Z M ~ m ~ m c n h 7 7
2.3.6. Test for extremc-ualue distribution
To test the null hypothesis that the sample X , ,
..., X,
are from an extreme-value distribution with the following probability densitywhere 6 = ( a , p ) , - m < a < and /3 > 0 are unknown, we take r = 3 and g(x, y ,
z )
= (Z - 3xy+
2 x 3 ) , - y:(y - x2)', where y, = E(Xl - ~ , ) ' / [ E ( x , - m1)21312 1.29857is the coefficient of skewness. It can be verified that &vl, m,, m , ) 0. Therefore, the test statistic for
H.
is- -
where 0 =
(&,B)
= (m, -y,p,,
6 ( h 2 -A:)
[ K ) and V($) is defined by (2.1) withand
K? =
(-Br
4"-
"(1) for r 22
.
2.3.7. Test for logistic distribution
To test the null hypothesis that the sample X,,
...,
X, are from a logistic distri- bution with the following cumulative distribution functionF&x) = [ l
+
exp { - (X - a)/P}]-' - W < X < m ,where 0 = (a,
P),
- m <a
< c-, andp
> 0 are unknown, we take r = 3 and g(x, y,z )
=z
- 3xy+
2x'. It can be verified that g(m,, m,, m,)=
0. Therefore, the test statistic forH.
is--P
where
6
=(&,B)
= ( m 1 , ~ - ' 3(h, -h ; ) )
and V(@) is defined by (2.1) withand
m, = m , K j + 2 m 2 ~ + + ~ m , K i + ? n + K 2 + 6 m 2 m , + 2 m , m , ,
m6 = m,K6
+
2m,ti5+
5m3x,+
3mlKj+
6m:+
8m2m4+
2m,m,,~ ~ , _ , = 0 , 1*= 1, 2, ...; ~ , , = 6 ( 2 ' " - 1)P2'R2,, 1 * = 1, 2,
...
.Here B,, is a Bernoulli nunlber (sec Kendall and Stuart, 1958, p. 80).
2.3.8. Test for I,uplme distribution
To test the null hypothesis that the sample X,,
...,
X , are from a Laplace distri- bution with the following probability density functionwhcrc @ = (a,
P),
-
<a
< 0 3 , and j3 > 0 are unknown, we take I * = 3 and g(x, y ,2) = Z - 3x31
+
2 ~ ' . It can be verified that g(m,, m,, m,)=
0. Thcrelorc, the test statistic for H,, isA note on foodnns o f f t t test u s q tnoinenh 7 9
where
e
=( G ,
B)
=(h,,
\(h2 - % ) / 2 ) and V ( @ ) is defined by (2.1) withand
2.3.9. Tests for Poisson distribution
T o test the null hypothesis that the sample X,, ..., X, are from a Poisson distri- bution with the following probability frequency function
where 8 > 0 is unknown, we take r = 2 and g(x, y) = y - x - x2. For Poisson distri-
bution, m , = 8 and m, = 8
+
0 2 . Hence, g(m,, m2)=
0. After some algebraic calcula- tions, it is seen that V(O) = 202. Let O= A l . Therefore, the test statistic for E-fo is given byT = \ n g ( h ,,..., &,)/\V($) = \ n ( & ,
- A ,
- A;i)/\2h, ,which can be further written as
where X and s2 denote the sample mean and the sample variance.
It is worth noting that the above statistic T can be written as T = ( X * - n)/d% where = ns2/X is the well known Fisher index of dispersion statistic (see Fisher, 1970, p . 58).
2.3.10. Test for binomial distribution
To test the null hypothesis that the sample X,, ..., X, are from a binomial
( m , 8) distribution where 0 < 6 < 1 is unknown, we take r = 2 and
g(x, y ) = y - X - ( ( m - l ) / m ) x 2 . It is easy to verify that g(ml, m,)
=
O for binomial distribution. Therefore, the test statistic for H,, iswhcre
b=
X/m andV(@
is defined by (2.1) withand
7'0 test the null hypothests t h a ~ the sample
X I ,
, X,, are from a rlcgative binomial ( m , 0) distribution where O O < 1 is unknov-11, we i , k e r = 2 andy k , y) = y X - ( ( Y M t 1 ) / m ) x L It IS c ; i s ~ t u verify I h ~ t g i m , , m,)
--
0 ior i ~ c g ~ i t i i e b i n o n ~ i d distribution Theretore, the test statistic for [I,, iiwhere
6 -
m / ( m + X ) and Tit)) i i detiried b r (2.1) withYvl, = 1 4 1 - C))
+
m'(1 - C ) ) 'C)'
4
fl note on jioodness o f f i t tect u s i q ~ l ' o m e ~ t s 8 1
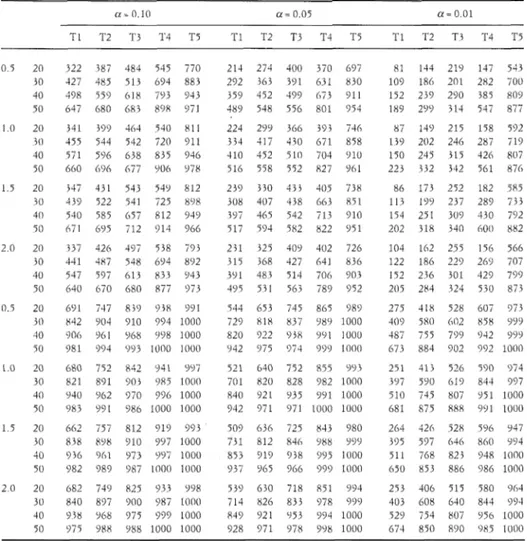
W e conducted a Monte Carlo study to compare the performance of the pro- posed test for exponential family with some existing goodness-of-fit tests. Specifi- callv, we consider the moment based test (T5) derived in Section 2.3.1, the 1,illiefors test (T4), and three chi-squared tests ( T l , T 2 , and T3) with partitions (6,13,20), (4, 8, 12, 16, 20), and (3, 6, 9, 15, 18, X ) , respectively. Each entry in the tables is based on 1,000 Monte Carlo sanlples and represents the simulated re- jection probability nlultiplied by 1,000.
Table 1 reports results of simulations to estimate the s i ~ e (probability of type I error) of goodness-of-fit tests lor exponential family for various combinations of nominal levels ( a ) , sample sizes ( E ) , and unclcrlying cspo~lcntial (6)) distributions. It is seen that the simulated sizes of 1,illiefors's test are verv closc to the tloininal levels. 'She simulated sizcs of the moment-based test are reasonablr closc to the nominal lcvcls when cx- 0 . 1 and 0 0 5 , but may require a larger sample size when
a =
0.01. The three chi-square test5 '1'1-7'3 did not perform as well as T4 ancl T5. Table 2 reports sirniilatecl rejection power of the five aforcnmlrioncd goodness- of-fit tests for exponential fanrilv for various cornbirlationr of norninal levels ( ( A ) , wmplc sizcs ( n ) and Wcibull (a,i?!
rdterti,itilw. F(x) = I - cup(- . X ' / / ) )'l'ablc 3 rcports simulated rcjuction power ot the five tests for rxpotleritial f ~ m - ily ior v x i o u s cotnbin,~tions of ~ l n ~ n i n a l lerels ( U ) , s m ~ p l c sizes ( 1 2 ) m d lognor1r1:11 J t e r ~ i a t i v e s l i i , l l j 115 120 I t ) > 1 2 1 10-' 7x h!, 8 9 73 66 , L ) 22 i $ &>.l 1; $ 8 x i 76 ' 1 $ 7 V 0 l ? j l 49 ch 13 )ii ji, ri 28 4 2 4 1 1 1 0 L8 7 1.)
.Yak 'l'lie ~ e b t s '1'1, r2, m d T 3 CIW clii-sqiixc r r \ t c , x i t h p m i ~ i o ~ ~ > 16, l ? , 201, (4, $,, 12, 16, 201, L ~ [ i d ( 3 , 0. %l, Li, l%, 2111. rc\peiti\r.lr. T-+ rcptcwnr, thc 1,illichir~ t r , i , l i rcpii.~tiit, rlie i ~ ~ o n i c l i l bascd r c ~ r iieiix. ed iil St.ctilin 1.3 1. I Cjr c . d i 5clccicd 0. tiic d.~i.i wcrc ; x i ~ c r o ~ c d Lrotli tlic eipoileiitial d i i t r i b ~ i t i o ~ 1.is1 = 1 - I.>F(- ~ / @ i . 1 ,il<!ll h l m t r ( h l c
82 G. Li, A. Pupudopoulos
Xute: 'l'l, 'l'2, and T3 are the same chi-square tests as thosc in Table 1 . 7'4 represents the L,illiefors test. T5 represents the nionierlt b ; w d tcst derived in Section 2.3.1. For each given ( U , b ) , the data were generated i r o m the W e i b d l distri- butiori [:(X) = 1 - e q - x d / h ) . 1,000 Xlonre Carln samples were iised t o obtain each entry.
Table 4 reports simulated rejection power of the five tests for exponential fam- ily for various combinations of nominal levels
(a),
sample sizes (n) and truncated normal alternatives.It is observed from tables 2, 3 and 4 that the proposed moment based test (T5) demonstrared better rejection power than the chi-square tests (Tl-T3) and the Lilliefors test (T4) in almost every situation considered.
A note on goodness offit test usiwfi m0mC~ih 83 1000 939 L000 1000 1000 998 1000 1000 996 971 1000 993 1000 994 I000 997 939 873 993 901 999 937 1000 945 1000 999 l000 999 I000 l000 1000 1000 995 970 1000 994 1000 988 1000 1 iIO0 ~ $ 3 X i ( , 990 871 1000 922 1000 372
Xotc: 7 1 , '1'2, ulid 1 ' 3 ;ire the same chi-square tcsts as rhose in Tahlc I . T4 reprcwnti the 1.illieiorc test. T5 rcprtsciiti the moiiienr b ~ s c c l test derived in Section 2.3. I. For each given ( p , cr), ttic data a c r c gcricrntcd from the l o g ~ i o ~ ~ i i . i l distribution with lncan jr and 7randal.d deviation cr. 1,000 hlonie Carlo \arriplc, \wre iiscii t o obtain ench entry.
inonlent based test (Tj) (see table 3) being slightly better. Under Weibull and trun- cated normal alternatives, however, substantially increased reject power is achieved by the proposed moment based test (1'5) compared with the other four tcsts
(Tl-
T4) (see tables 2 and 4). This is true especially for small samples. For example, it is seen from table 4 that the simulated rejection probabilities for the five tests T I , T2, T3, T4, and T j are 0.196, 0.278, 0.329, 0.422, and 0.909, respectively, when
TABLE 3
Simulated rejection power (twltiplietl by 1,000) ofgoodness-oJ-fit teslsfor c,xl1o?2entialfat~ily t d e r t?uncateci nosmal altcunatit~es
n = 0 . 1 0 cw = 0.05 a = 0.01
Sotr,: T1, 7 2 . and 'S3 arc the same chi-square tests as those in Table l . 1'4 represents the L,iliiefors test. T 5 represents the ~noment based test cierivcd in Section 2.3.1. For each given (p. G), the data were genera~ed iron1 the truncated normal distribution by tru~icatitig the normal distrihurion .isit11 nienn p and standard deviation LT a t 0 . 1,000 M m t c
<:ark \amplcs were used to obtain each entry.
ACKNOWLEDGEMENT
The authors are grateful to the referees for their constructive comments and suggestions that led to substantial improvement of this paper.
REFERENCES
r.J. RI(:KEI., K . A . I ~ K S U M (1979), iZlathematicalStatistics, Ilolden-Day, Inc., San Francisco. R . H . D ' A ( ; O S ~ W , n r . ~ i , s ~ ~ ~ ~ r w e n . s (1986), Goodness-oJ-fit techniques, Marcel Dekker, New
York.
K . A . P L S I I E K (1922), On the intetpretation of x 2 f i o m contingency tables, and the calculation of l',
"Journal of the Royal Statistical Society", 85, pp. 87-94.
K.A. I:ISIILIII (1924), The conditions under which X 2 measures the discrepancy between obsemation
and hypothesis, "Journal of the Royal Statistical Society", 87, pp. 442-450.
R.A. I.ISIILR (1970), Statistical methods for research workers, IIafner Publishing Company, Darien.
K G . K E N U A I . I . , A. STUART (1958), The uduancecl themy of Statistics, IIafner Pub. C o . , New York.
F.V. K I I M A I . A D Z E (1993), Goodness of fit problem and scanning innovation martingales, "Annals of Statistics", 21, pp. 798-829.
t 1 . w . I.II.I.IEFOKS (1967), On the Kolmogorou-Smirnov testfor normality with mean and variance unknown, "Journal of the American Statistical Association", 62, pp. 339-402.
tr.ucf. I . L L . I . I E ~ O K S (1969), On the Kolrnogorov-Smimou test for the exponential dist~ibution with mean unknown, "Journal of the American Statistical Association", 64, pp. 387-389.
rr.ucJ. LILLIIXIRS (1973), 7%e Kolmogorov-Smirno and other distance tests for the gamma distri- bution and /or thc ex/reme-value distribution when puramettm must be estiimatcd, Unpub- lished manuscript, Department of Statistics, George Washington University.
K . W . MARL)IA, J.T. KENT, J.M. RIRRY (1979), Multivariatt~ analysis, Academic Press, London. A . M . nroou, F.A. GRAYRII.I., D.(:. ROF.S (1974), Introduction to the theoty of statistics, McGraw-
IIill Book Co., New York.
A. PAISJNI (1994), Bahadur exact slopes for a class of combinations of dependent tests, "Metron", 52, pp. 53-65.
E . S . PEARSON, H.O. HAK?.l.EY (1970), Biometrzka tables for statisticians, The University Press, Cambridge.
Y.O. S U N (1997), Weak convergence of the gcncralized parametric empirical processes and good- ness-ofifit tests for parametric models, "Communications in Statististics - Theory and Methods", 26, pp. 2393-2413.
RIASSUNTO lina nota sui test di bonti delI'adattamento basati sui momenti
Lo scopo del presente articolo 6 di introdurre un metodo generale, basato sui momenti, per derivare formalmente un test di bonth dell'adattamento di una famiglia parametrica. Si mostra come, in generale, un test approssimato gaussiano o chi-quadrato possa essere deriva- to analizzando la struttura dei momenti di una famiglia parametrica, sotto I'ipotesi che i mo- menti fin0 ad un dato ordine esistano. L'idea i. semplice e i test ottenuti possono essere im- plementati facilmente. A1 fine di illustrare l'uso della metodologia proposta sono derivati, per alcune famiglie parametriche discrete e continue note, i test di bonth dell'adattamento basati sui momenti. I test proposti sono inoltre confrontati con l'usuale test chi-quadrato di Pearson e Fisher e con alcuni test di distanza mediante uno studio di simulazione.
86 C; Lt, A. Pupadrq~oulos
SUMMARY
The purpose of this article is to introduce a general moment-based approach to derive formal goodness of fit tests of a parametric family. W e show that, in general, a n approxi- mate normal test or a chi-squared test can be derived by exploring the moment structure of a parametric family, when moments up to certain order exist. The idea is simple and the resulting tests are easy to implement. T o illustrate the use of this approach, we derive mo- ment-based goodness of fit tests for some common discrete and continuous parametric fami- lies. W e also compare the proposed tests with the well known Pearson-Fisher chi-square test and some distance tests in a simulation study.