1
Measuring Pedestrian Accessibility
to Public Transport in Urban Areas:
a GIS-based Discretisation Approach
Silvia Rossetti
1, Michela Tiboni
2, David Vetturi
3, Michele Zazzi
1,
Barbara Caselli
11DIA – Università degli Studi di Parma 2DICATAM – Università degli Studi di Brescia
3DIMI – Università degli Studi di Brescia
Abstract
The paper presents a GIS-based approach that can help practitioners in assessing pedestrian accessibility in urban areas, with a focus on accessibility to public transport stops and stations (nodes).
This methodology represents an attempt to set up integrated approaches to urban planning and mobility planning, and provides a support in the decision-making process, with the dual aim of encouraging sustainable and non-motorised mobility and of improving public transport attractiveness.
The proposed methodology is divided into three main steps:
1) Map the pedestrian permeability/impermeability of urban spaces around public transport nodes; 2) Discretisation of the map in a grid of 3m x 3m cells which attributes derive from the Topographic Database informative layers (DBT), and application of an algorithm to calculate the pedestrian access time to the public transport node;
3) Map of access times to create detailed pedestrian isochrones, and calculate how many residents (or how many opportunities and facilities) in the neighbourhood are well served by the public transport system to measure accessibility levels.
The approach is applied to the case study of some metro stations in the city of Brescia, focusing on the different results obtained for the different urban forms that constitute the city (the modern city with open urban forms, the historical city centre and a residential neighbourhood).
Finally, the paper provides a first comparison with similar results that can be obtained through vector-based tools that create isochrones from the road graph (e.g. Network Analyst tools).
Keywords: Pedestrian Mobility; Isochrones; Accessibility; GIS
Corresponding author: Silvia ROSSETTI ([email protected])
The authors jointly designed and contributed to the paper. Silvia ROSSETTI conceived the research, defined the GIS methodology and structured the manuscript; Barbara CASELLI developed the comparison with network-based isochrones models, David VETTURI developed the mathematical algorithm and supervised the measure-related issues of the research; Michela TIBONI and Michele ZAZZI supervised urban and mobility planning issues.
2 1. Introduction
Nowadays it is more than ever necessary a focus on the individuals and a re-affirmation of a people-centred planning vision, to create smart strategies for a sustainable and inclusive urban environment. Within this framework, this paper presents a GIS-based approach that can help practitioners in assessing pedestrian accessibility in urban areas, with a focus on accessibility to public transport stops and stations (nodes).
Many authors agree that a shift from Mobility-Oriented to Accessibility-Based Transport Planning is nowadays the key towards sustainable and energy efficient transport planning (see, i.a., Banister, 2008; Handy, 2002; Marshall, 2001; Ignaccolo et al., 2016). Accessibility is an essential feature of a well-functioning city or region, and represents a fundamental principle, because it provides a framework for understanding the reciprocal relationships between land use and mobility (Hull, Silva & Bertolini, 2012). In the context of urban and transport planning, accessibility expresses the interactions between the activities located in a region and the transportation system serving it. There are many definitions of accessibility available in the scientific literature, and there is no universally used definition. According to Litman (2011), «accessibility refers to the ease of reaching goods, services, activities and destinations, which together are called opportunities». Bertolini and Le Clercq (2003) define accessibility as «the number and diversity of activity places that can be reached within an acceptable travel time...; what acceptable travelling time is depends on the purpose of the trip». But, among the firsts and most quoted definitions of accessibility from the urban planning perspective there is probably the one of Hansen (1959), that refers to accessibility as «the potential of opportunities for interaction». In the ‘50s, the first efforts were made in the USA to study the interrelationship between transport and the spatial development of cities. Hansen, in his paper “How accessibility shapes land use” (Hansen, 1956), proposed the first mathematical formulations of accessibility and, hence, he was able to demonstrate for the city of Washington that locations with good accessibility had a higher possibility of being developed, and at a higher density, than remote locations. The theory of accessibility within the framework of land-use and transport interactions was, subsequently, developed by Wegener & Fürst (1999). Their research is based on the recognition that trip and location decisions co-determine each other and thence, transport and land-use planning need to be coordinated. This is schematised in the so called “land-use transport feedback cycle”.
More recently, Susan Handy (2002) suggested a radical shift from planning for mobility, to planning for accessibility. Handy defines mobility as the potential for movement, the ability to get from one place to another, and accessibility as the potential for interacting among different and distributed urban activities. In Handy’s view, the final aim of accessibility planning is to increase the number of opportunities, within a fixed time, while mobility aims at increasing the number of kilometres travelled.
What people need is not a generic mobility but, rather, the opportunity to participate in spatially disjointed activities (Bertolini & Le Clercq, 2003). In other words, while mobility represents the “ease of movement”, accessibility describes the “ease of reaching the desired activities”. Mobility-enhancing strategies generally focus on improving the flow of traffic and improving the performance of the road system: e.g. the level of service is measured in terms of average speed and traffic intensity. Therefore, the construction of new roads and the expansion of existing roads represent the dominant transportation strategy.
3
Rather than to increase by any means the potential for movement, often without taking into account the externalities of mobility, accessibility enhancing strategies aim to increase access to needed and desired activities, by bringing activities closer to people, enhancing the alternative for reaching those activities, and expanding the choices among activities. Accessibility, encapsulates more than a measure of vehicle speed: the concept incorporates a focus on the proximity of origins to destinations, the concentration or spatiality of activities, the quality of mobility systems available to overcome spatial separation, and the perceptions, interests and preferences of people who live and work there (Handy & Clifton, 2001; Hull et al., 2012; Zazzi, 2006). According to accessibility principles, a destination is more optimally accessible if it can be reached with a wider range of means of transport. Transport planning and location of attraction points, like public services, should take into account the whole sequence of movements that constitute a journey, identifying appropriate solutions in close collaboration with urban planning.
For these reasons, it is not mobility, but accessibility that should be identified as the transportation system's inherent goal, and against which its negative external effects have to be balanced (Le Clercq & Bertolini, 2003). A focus on accessibility instead that on mobility stresses, once again, the fact that land use has major impacts on transportation issues.
2. Methodology
Within this framework, the proposed methodology represents an attempt to set up an integrated approach to urban planning and mobility planning, and provides a support in the decision-making process, with the dual aim of encouraging sustainable and non-motorised mobility and of improving public transport attractiveness.
The proposed methodology refers and refines some suggestions already proposed in a previous work (see Rossetti et al., 2015), and it is divided into three steps:
1) Map the pedestrian permeability/impermeability of urban spaces around the public transport nodes analysed;
2) Discretisation of the map and application of an algorithm to calculate the pedestrian access time to the public transport node;
3) Map those access times to create detailed pedestrian isochrones, and calculating how many residents and/or opportunities in the neighbourhood are well served by the public transport system.
The first step of the analysis consists in building a map that associates the characteristics of the urban space and of land use to the possibility and the speed of pedestrian movement: how is it possible to map pedestrian permeability/impermeability of an urban space?
In the last decade, Geographic Information Systems (GIS) based approaches for the assessment and management of accessibility have grown considerably (see. Hull, Silva & Bertolini, 2012), and the crucial role of GIS techniques for the analysis of accessibility is now consolidated.
First of all, there is a need to collect many cartographic information and GIS informative layers regarding pedestrian mobility for the study area, with particular reference to the road network, the location of pedestrian paths and sidewalks as well as the presence of physical barriers in the area that prevent pedestrian permeability (e.g. barriers, buildings, railway lines, water ...).
In this sense, GIS and the introduction of Topographical Databases in cartography are extremely useful as they allow us to have a homogenous and very detailed cartographic
4
map, made up of a multitude of geo-referenced and self-consistent informative layers. For example, in the Lombardy Region (Italy) the technical specifications approved by D.G.R. n. 6650 of 20th February 2008, constitute the standard for the production of the Topographic Database at municipal level (DBT), based on national specifications defined in 2006 by Intesa GIS between the state, regions and local authorities.
Particularly, from a Municipal DBT it is possible to extract all those informative layers useful to determine whether a pedestrian can cross an area or not. Furthermore, other useful information can be added to those layers from the municipal masterplan (for example, in the analysed case study, informative layers from the Services Plan of the Piano di Governo del Territorio – PGT), as the location of green areas and public services.
Then, the proposed assessment methodology bases on the detailed discretization of the area being analysed in a uniform grid of cells. The grid is created using the ET-Geowizard tool, a free extension of the ArcGIS software. The Vector grid tool of the ET-Geowizard automatically creates a polyline or polygon vector grid using user defined extents and cell size. In this case, a polygonal shapefile was created around each public transport node analysed, using a cell size of 3x3 m. In the attribute table of the vector grid, the ET-Geowizard tool creates two types of Identifiers for each record: a field named ‘ET_ID’ containing the identification number of each cell, and a field named ‘ET_Index’ that contains the field and the record of the cell in the matrix. This is a crucial field, because it makes possible the link between the shapefile and the computation algorithm that is described later in this paragraph.
Therefore, the next step of the methodology is the discretization of the study areas in a grid of 3mx3m square cells: each cell has been connected to the information of the land use informative layers (from DBT and PGT) contained in it. On the basis of those layers a pedestrian permeability value (with the relative pedestrian crossing speed) was associated to each cell.
Within the grid, a calculation algorithm can be applied. This algorithm, on the basis of the informative layers that overlap each cell, assigns each cell a pedestrian crossing time and evaluates the existing connections between the cell in question, and the cells adjacent to it. This model allows the creation of thematic maps that show the timing of pedestrian access to each cell.
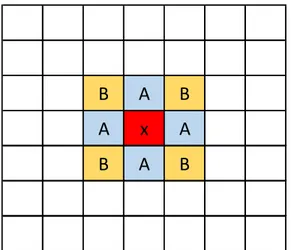
The model is based on a uniform grid of squared cells, interconnected according to the following scheme: from the X cell it is possible to move to the A cells (using the time needed to cross that cell) and to the B cells (with the cell crossing time plus a √2 factor). The crossing time is an attribute of each cell, assigned according to the pedestrian permeability previously defined.
5
Figure 1: Scheme of the adopted cell model
The mathematical algorithm, which is reported in the following lines, determines the time needed to reach each cell of the matrix, starting from an assigned cell, and determining the path with the shortest travel time. The algorithm is used to search for access time to the destination cell, and bases on a group of recursive algorithms known as 'Backtracking algorithms' (Wirth, 1976), widely applied within the Information Sciences to solve optimization problems. The method applies a kind of floodfill starting from the destination cell and following a backwards path, and tracing the total time as a strategy to exit the recursive procedure.
procedure TryNext(i,j:integer;TotalTime:real); begin
if Matrix[i,j].time> TotalTime then begin
Matrix[i,j].tempo:= TotalTime; // destinazioni di tipo “A”
if i>1 then TryNext(i-1,j,TotalTime+Matrix[i,j].CrossingTime); if j<ny then TryNext(i,j+1,TotalTime+Matrix[i,j].CrossingTime); if i<nx then TryNext(i+1,j,TotalTime+Matrix[i,j].CrossingTime); if j>1 then TryNext(i,j-1,TotalTime+Matrix[i,j].CrossingTime); // destinazioni di tipo “B”
if (i<nx) and (j>1) then TryNext(i+1,j-1,tempo+Matrice[i,j].CrossingTime*1.41); if (i<nx) and (j<ny) then TryNext(i+1,j+1,tempo+Matrice[i,j].CrossingTime*1.41); if (i>1) and (j>1) then TryNext(i-1,j-1,tempo+Matrice[i,j].CrossingTime*1.41); if (i>1) and (j<ny) then TryNext(i-1,j+1,tempo+Matrice[i,j].CrossingTime*1.41); end;
end;
Importing the algorithm's results again in the GIS, and joining them to the GIS grid through the ET-index field, it is possible to map the results, highlighting the pedestrian isochrones to access Public Transport node from each point of the map.
Finally, an optimal catchment area from the Public Transport node can be defined (literature values – e.g. Bonotti et al., 2015 - suggest a 5-minute walking isochron), or, better, contour or potential accessibility measures (see i.a. Curtis and Scheurer, 2010; Geurs and Van Eck, 2001) can be applied. Contour measures define catchment areas by drawing one or more travel time contours (i.e. isochrones) around a node and, then, adding up the number of opportunities (jobs, residents, facilities, ...) within each contour.
B A B
A x A
6
Potential measures are very similar to contour measures although accessibility levels are considered to decay with distance of opportunities from origin. Thus, potential measures reflect the distance deterrence of accessibility.
For the analysed case study, demographic data were considered. Data from the Civil Register of the Municipality were geo-referenced and linked to each cell of the grid, by linking the address of each inhabitants to a GIS based street map that include point-shaped building numbers.
3. Application to the metro station of Brescia
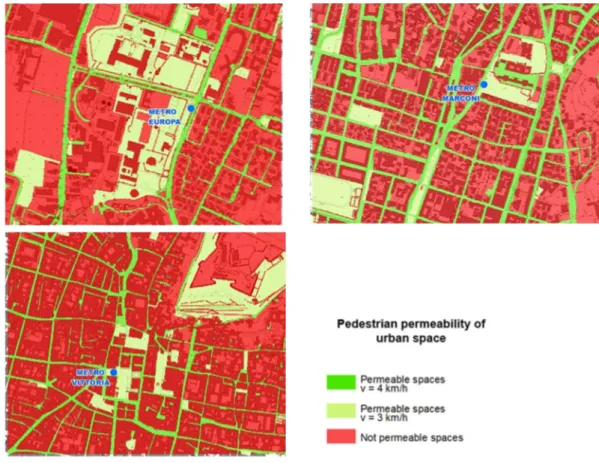
The methodology was applied to three case studies related to three metro stations, which belong to different urban morphologies, in the city of Brescia: Vittoria station (located in the ancient city centre), Marconi station (located in a mixed residential and service area very close to the city centre) and Europa station (a more recent neighbourhood, where the university campus is located).
Obviously, pedestrian permeability varies considerably depending on the urban morphology. Each study area was discretized in a grid of 296x385 cells of 3 meters each side, and to each grid, the whole methodology previously described was applied.
Figure 2 presents the permeability map of the urban space surrounding the three metro stations, assigning each cell of the grid a pedestrian permeability value and the related crossing speed.
7
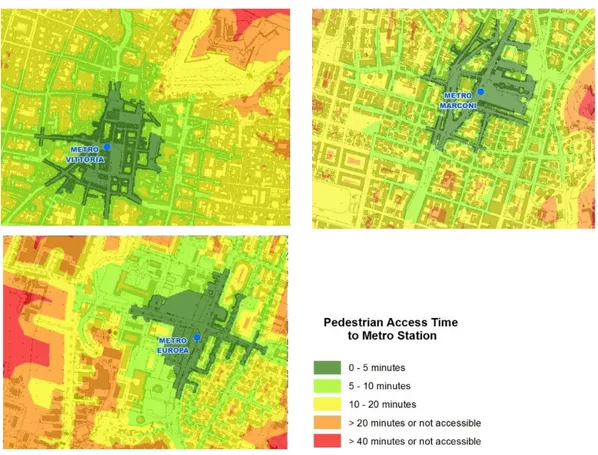
Figure 3 presents the resulting maps, in terms of pedestrian access time to each metro station. It emerges clearly how the isochrones shape changes according to the diverse urban morphology of the site.
Figure 3: Pedestrian Isochrones around the three metro stations analysed. The creation of isochrones allows to link to each cell of the grid an "access time" to the metro station. Furthermore, we can define the accessibility considering the ability of each station to attract metro users (in terms of resident population). Similarly, we could have analysed the same station's ability to provide access to opportunities and services (schools, pharmacies, doctors' offices, public offices).
In the analysed case studies, we linked to each cell of the grid its number of inhabitants, after having geo-referenced the demographic registry of the Municipality of Brescia. The following graphs (Figure 4) analyse the inhabitants distribution by distance from the attraction point (metro station). The graphs highlight with a dotted line the distribution according to the Euclidean distance, while the continuous line shows the distribution of the population according to the access time calculated by the model.
8
Figure 4: Inhabitants Distribution around the Vittoria metro Station according to the discretization of the study area with the cell model
4. Comparison with Network-based methods
The results obtained with the proposed raster-based methodology can finally be compared to traditional, and more common, network-based methods to create isochrones.
As a first example, fig.5 shows isochrones centered in the metro station of Europa and created using the on-line tool ISO4App1 and the Network-Analyst tool of ArcGIS. Both
those tools bases on a vectorial graph of the road network, applying therefore a method that is quite different from the one proposed in this paper. Obviously, also those kind of network based methods can be further implemented: for example, as suggested by Zazzi et al. (2018), the ArcGIS road network graph can be improved with qualitative and quantitative indicators collected through an accurate urban survey, and consider “slowdown factors” (e.g. at pedestrian crossings).
Figure 5: 5 and 10 minutes walking isochrones from Europa metro station in Brescia, created using the ISO4App on-line tool (left picture) and using the ArcGIS
Network Analyst tool (right picture).
9
5. Discussion and further developments of the research
In the context of this paper, accessibility was assessed developing a methodology to create raster-based and very detailed isochrones developed in a Geographical Information System (GIS) environment around public transport nodes, and considering the inhabitants distribution within those isochrones.
Isochrones represent the simplest accessibility measure and aim at identifying the area that is within a certain distance or time of a given origin or destination. An isochron is a line on a map connecting points having equal travel times, distances or costs. To realise precise isochrones the mobility infrastructure (e.g. road network, public transport lines...) is needed, in terms of road network, public transport routes, stops and stations, and walking and cycling paths depending on the transportation mode for which the isochrones map is built (Brainard et al., 1997; Calderon et al., 2014, Dovey et al., 2017). Otherwise, it is possible to use a “buffer” tool to realise simple or multiple-ring circular isochrones implemented using an average speed or distance for the chosen transportation mode. However, the outcomes of a buffer analysis demand an attentive consideration, because buffers are not capable to consider barriers like rivers, railways...
Isochrones are particularly suited for representing catchment areas: e.g. public transport catchment areas, as the portion of a given territory served by public transport facilities, or catchment areas of any important public service, like schools, hospitals, public gardens.... In this second case it is important to distinguish between “local” services, which should be reachable by foot, and other services. Isochrones can also be used to compare catchment areas based on different transportation modes.
A development of isochrones draws on the so called contour measures. Contour measures define catchment areas by drawing one or more travel time contours (i.e. isochrones) around a node and, then, adding up the number of opportunities (jobs, facilities,...) within each contour (Curtis & Scheurer, 2010; Geurs & van Eck, 2001; Papa & Angiello, 2012). Contour measures appraise the amount of opportunities reachable in a given time, distance or cost. The location of the opportunities is needed.
Finally, potential measures are very similar to contour measures although accessibility levels are considered to decay with distance of opportunities from origin. Thus, potential measures reflect the distance deterrence of accessibility.
In the literature, there are many other examples of increasingly more complex accessibility measures, that include competition measures, utility measures and network measures (see, i.a., Curtis & Scheurer, 2010; Delamater et al., 2012; Yairi et al., 2016). And, in the last decades many and complex accessibility instruments and mathematical models have been built: a collection and description of just some of them is presented in Hull, Silva & Bertolini, 2012.
The methodology proposed in this paper applies isochrones, but also include the spatial distribution of the inhabitants, therefore coincide contour and potential measures.
Further improvements of the research may include the customization of the analysis to the needs of particular types of pedestrian and vulnerable road users: e.g. providing a focus on accessibility for elderly people (see, i.a., Gargiulo et al., 2018; Papa et al., 2018) or for the disabled.
Finally, both the algorithm and the methodology could be generalized by the creation of ‘virtual links’ among two different cells outside the base matrix, even far from each other. Those virtual links can be applied to model public transport links between two cells.
10 6. Conclusive remarks
To sum up, the proposed methodology is based on a very punctual and detailed discretisation of the analysed territory in a uniform grid of cells. In this grid a calculation algorithm is applied. The algorithm, basing on the land use informative layers which intercept each cell, assigns each cell a pedestrian travel time and assesses the existing connections between the considered cell and the cells adjacent to it. This model allows the creation of thematic maps that highlight the pedestrian access time from each cell to the Public Transport node, to define optimal catchment areas, which are more accurate than those created through conventional isochrones based on vectorial network models. Accessibility was then assessed considering the number of inhabitants (or the number of other opportunities) served by those catchment areas. The proposed methodology was applied and calibrated on the case study of three stations of the light railway in Brescia (Vittoria, Europa and Marconi).
These kinds of accessibility analysis may be performed both ex-ante and ex-post. Ex-ante analysis aim at evaluating which is the optimal location of an attraction point or of a new urban development in relation to a given transportation network, and how the accessibility may change according to the transportation offer variation (in this case the accessibility analysis may be seen as a decision support system). On the other hand, ex-post assessments can be used to evaluate if the current transportation system provides enough access to a given territory. Accessibility analysis should consider different means of transport (see, i.a., Tira et al., 2016), with particular regard to non motorised mobility (walking and cycling) and collective transport. The results could provide a framework in the planning practice (see, i.a., Papa et al., 2017; Ingnaccolo et al., 2017) for decision-making support, for example within the context of the Sustainable Urban Mobility Plans (SUMP), instruments that guide the strategies identified by the European Commission to achieve results in the field of sustainable mobility.
References
Banister D. (2008). The sustainable mobility paradigm. Transport Policy, Elsevier, 15, pp. 73-80.
Bertolini, L. (2012). Integrating Mobility and Urban Development Agendas: a Manifesto. DisP – The Planning Review, Routledge, 48(1), pp. 16-26.
Bertolini L., Le Clercq F., 2003. Urban Development without more mobility by car? Lessons from Amsterdam, a multimodal urban region. Environment and Planning, 35(A 2003), pp. 575-589
Bonotti R., Rossetti S., Tiboni M., Tira M. (2015). Analysing Space-Time Accessibility towards the Implementation of the Light Rail System: The Case Study of Brescia. Planning Practice & Research. 30:4, 424-442.
Brainard J.S., Lovett A.A., Bateman I.J. (1997), Using isochrone surfaces in travel-cost models. Journal of Transport Geography, 5(2), pp. 117-126, ISSN 0966-6923, http://dx.doi.org/10.1016/S0966-6923(96)00074-9.
Calderon E.J., Arce Ruiz R.M., Henar S.-O. M., Ortega E. (2014). Isochrones and contour measures for leisure facility in Madrid. In Te Brömmelstroet M., Silva C., Bertolini L. (eds.), Assessing Usability of Accessibility Instruments. COST office, Brussels.
11
Curtis C., Scheurer J. (2010). Planning for sustainable accessibility: developing tools to aid discussion and decision-making. Progress in Planning, 72(2), pp. 53-106.
Delamater P., Messina J., Shortridge A., Grady S. (2012). Measuring geographic access to health care: raster and network-based methods. International Journal of Health Geographics, 11(15).
Dovey, K., Woodcock, I., Pike, L. (2017). Isochrone mapping of urban transport: Car-dependency, mode-choice and design research. Planning Practice and Research, 32 (4), pp. 402-416.
Gargiulo, C., Zucaro, F., Gaglione, F. (2018). A Set of Variables for the Elderly Accessibility in Urban Areas. TeMA - Journal of Land Use, Mobility and Environment, 53-66. https://doi.org/10.6092/1970-9870/5738
Geurs K., Eck J. (2001). Accessibility measures: review and applications, RIVM Report for the Directorate-General for Environment Protection of the Ministry of Housing, Spatial Planning and the Environment, Utrecht.
Handy S. (2002). Accessibility vs Mobility. Enhancing Strategies for Addressing Automobile Dependence in the U.S. Institute for Transportation Studies, UC Davies. Handy S., Clifton K. (2001). Evaluating neighborhood accessibility. Possibilities and
practicalities. Journal of transportation and statistic, 4(2), pp. 67-78.
Hansen W.G. (1959). How Accessibility Shapes Land Use. Journal of the American Institute of Planners, 25(2), pp. 73-76.
Hull A., Silva C., Bertolini L. (eds) (2012). Accessibility Instruments for Planning Practice in Europe. COST Office, Brussels.
Ignaccolo M., Inturri G., Giuffrida N., Le Pira M., Torrisi V. (2017). Structuring transport decision-making problems through stakeholder engagement: the case of Catania metro accessibility. In Dell'Acqua, G. and Wegman, F. (eds.) “Transport Infrastructure and Systems: Proceedings of the AIIT International Congress on Transport Infrastructure and Systems”, CRC Press, pp. 919-926.
Ignaccolo M., Inturri G., Le Pira M., Caprì S., Mancuso V. (2016). Evaluating the role of land use and transport policies in reducing the transport energy dependence of a city. Research in Transportation Economics, 55, 60-66.
Marshall S. (2001). The challenge of sustainable transport. In Layard A., Davoudi S., Batty S. (editors), Planning for a sustainable future. Spon, London, pp. 131-147. Papa E., Coppola P., Angiello G., Carpentieri G. (2017). The learning process of
accessibility instrument developers: Testing the tools in planning practice, Transportation Research Part A: Policy and Practice, Volume 104, pp. 108-120 Papa, E., Carpentieri, G., & Guida, C. (2018). Measuring walking accessibility to public
transport for the elderly: the case of Naples. TeMA - Journal of Land Use, Mobility and Environment, 105-116. https://doi.org/10.6092/1970-9870/5766
Rossetti S., Tiboni M., Vetturi D., Calderòn E.J. (2015). Pedestrian mobility and accessibility planning: some remarks towards the implementation of travel time maps. CSE Journal, issue 1-2015.
Tira M., Rossetti S., Tiboni M. (2016) Managing Mobility to Save Energy through Parking Planning. In: Papa R., Fistola R. (eds.) Smart Energy in the Smart City. Green Energy and Technology. Springer, Cham
Wegener M., Fürst F. (1999). Land-Use Transport Interaction: State of the Art. IRPUD, Dortmund.
12
Yairi, I., Igi, S. (2006). Mobility support GIS with universal-designed data of barrier/barrier-free. Terrains and facilities for all pedestrians including the elderly and the disables. In IEEE International Conference on Systems, Man and Cybernetics, 4, Curran Associates, Taipei, pp. 2909-2914
Zazzi, M. (2006). Localizzazione e accessibilità dei servizi di prossimità nelle periferie della città contemporanea. In International Conference Living and Walking in Cities. The Outskirts, Brescia-Bergamo, 9/10 June 2005, Tipografia Camuna, Brescia, pp. 262-278.
Zazzi M., Ventura P., Caselli B., Carra M. (2018). GIS-based monitoring and evaluation system as an urban planning tool to enhance the quality of pedestrian mobility in Parma. In Tira M., Pezzagno M. (eds.), Town and Infrastructure Planning for Safety and Urban Quality: Proceedings of the XXIII International Conference on Living and Walking in Cities (LWC 2017), CRC Press, Taylor and Francis group, London, pp. 87-94.