D
ETECTION ANDQUANTIFICATION OFCOMPOSITE SURFACECONTAMINANTS WITH AN E
-
NOSE FORFAST AND RELIABLE PRE-BONDQUALITY ASSESSMENT OFAIRCRAFT COMPONENTS
.
Saverio De Vito°*, Ettore Massera°, Mara Miglietta°, Paola Di Palma°, Grazia Fattoruso°, Kai Brune§, Girolamo Di Francia°
°ENEA, Centro Ricerche Portici, 80055 Portici (NA), Italy
§Fraunhofer IFAM, Wiener Straße 12, 28359 Bremen, Germany
Abstract
Composite Fiber Reinforced Polymers (CFRP) are at the basis of the so called green aircraft production. In order to exploit the full potential of CFRPs for lightweight structures in aeronautic industry, there is a strong need to apply adhesive bonding as the appropriate joining technology to load-critical CFRP primary structures. Up to now, it is not possible to reach this important goal because of the unavailability of an adequate quality assurance concept (e.g. pre-bond surface inspection) which guarantees the safety of the adhesive joint and therefore enables certification. Surface contamination is a primary concern for joint quality severely limiting the robustness of the adhesion.In this work we show how an electronic nose solution could be designed and used as a non-destructive tool for pre-bond surface inspection. An ad-hoc pattern recognition system is also devised for ensuring a fast and reliable assessment of contamination status by combining real time classifiers and implementing a reject option. Results show that e-nose can be a reliable choice for a first line low cost NDT tool in aerospace CFRP assembly and maintenance scenarios.
Keywords: Electronic Noses, Industrial Applications, Aerospace, Hybrid sensor arrays,
Ion Mobility Spectrometers, Surface analysis, Classifiers combination, Reject Option.
1. Introduction
Electronic noses have been applied to several application fields whenever chemical mixture detection, identification and quantification are concerned [1].These include medical diagnostic [2] and environmental monitoring [3][3]. However, industrial application of electronic nose is limited to a small number of highly vertical scenarios, usually related with food industry (e.g. food contamination detection, spoilage detection or anti-fraud for highly valued productions) (see [5],[6]). Sensors drift, lack of specificity, sensibility to environmental conditions, and failing to meet the operative requirements of the application market scenario, seem to represent the major hampering factors (see [7] and [8]). Despite a few contributions (e.g. [9] and more recently [10]), most of the e-nose applicative research was targeted to liquid/solid samples headspace analysis in controlled environment actually underestimating the challenges of on-field applicative scenarios.
Nonetheless, e-noses characteristics make them a suitable choice for developing industrial Non Destructive Test tools (NDT). In these scenarios, a short response time is usually needed. Futrhermore, the tool should be operated in uncontrolled or even harsh environment by personnel that is not specifically trained for artificial olfaction tools operation. Transport industry and in particular Aerospace industry strongly rely on NDT tools to guarantee safety and efficiency of their production and maintenance operations. Currently, major stakeholders of this industry are focused on the development of green technologies in order to limit costs and carbon footprint of air transport. European
Commission actively contributes to these efforts, by means of its Research Framework Programme and CleanSky Joint Technical Initiative for a total amount of funds that exceeds several billion Euros [11]. In this view, the adoption of light weight composite materials (CFRP – Carbon Fiber Reinforced Polymers) for primary structural components, is a major milestone and may account for a reduction of per-mile-passenger transport costs of up to 15%. A significant fraction of these savings come from the assembly procedure of CFRP panels. Actually they do not rely on rivet assembly. Instead, they are assembled by adhesive bonding.
One of the main concerns limiting a wider adoption of such materials is the lack of validated methodologies for the evaluation of the CFRP panels assembly quality. In particular, surface cleanliness is essential to guarantee the correct bonding. Surface contamination significantly affects the mechanical strength of the CFRP panels adhesive bond either limiting adhesion performance by physical screening and/or chemical action on the surfaces. Contamination may occur in different phases of aircraft assembly process or during operative life by means of different liquid contaminants such as hydraulic fluids, runway deicing fluids, moisture, release agents, etc. Recent findings show that contamination by hydraulic fluids severely hampers mechanical strength of the bonds. Markatos et al. have measured mechanical parameters of contaminated CFRP panels adhesive bonds [1]. They have shown reduction in the mode I fracture toughness (GIC) in excess of 25% for Skydrol500-B contamination up to more than 60% with regards to relevant release agent contamination. Contamination levels seem also relevant in predicting mechanical strength of the bond. Markatos et al. have shown that a percentage of 7% of Si remaining on the surface after a contamination event with release agents, can be responsible of total lack of adhesion Errore: sorgente del
riferimento non trovata. The development of a NDT capable to assess contamination state of the surface in terms of identification and quantification of contaminants, is therefore a significant step towards the development of the green aircraft technology. Several technologies are under investigation for their suitability and needed adaptations to the above mentioned task including Electronic Nose technology. E-noses seem particularly promising for their low cost, relative responsiveness and potential portability that enable them to be used in assembly or maintenance scenario. On the other hand, several adaptations and careful sensor selection should be applied to obtain results in this rather unusual scenario for an electronic nose. As a further requirement, it should be able to rapidly check wide CFRP surfaces. Quantification capability is also relevant to understand if the panels under analysis could qualify for adhesive bonding or should undergo a further cleaning process or even being discarded. To the best of our knowledge, our group is the first to deal with this task. Actually, surface analysis in an open environment is itself rarely addressed by artificial olfaction researchers Errore: sorgente del riferimento non trovata.
In this paper, we describe the efforts and results of screening, adapting and testing electronic nose technologies for their application in the non-destructive testing of CFRP bonding in aerospace industry. Specifically, an e-nose solution, developed for pre-bonding identification of relevant contaminants on CFRP surfaces, is presented. Section two describes the experimental setup including relevant contaminant, experimental contamination conditions as well as the e-nose platform, signal processing and pattern recognition procedures. To this regards, interesting performances have been obtained by relying on a commercial hybrid multisensory device also relying on IMS technology. The use of a low cost IR emitter has been exploited for enhancing the low volatiles
uptake towards the sensor chamber. Adequate pattern recognition techniques have been selected and tuned so to allow for a rapid on-line classification and quantification of the contaminant. A combination approach with reject option is presented for enhanced reliability. Section three describes the results of the applied methodologies while in the final section, conclusions are drawn.
2 Experimental Setup
2.1 Chemical characteristics of the contaminants and samples contamination procedures
In order to keep consistency with the sought application, experimental conditions and the actual version of the CFRP material as well as the operational requirements and the contamination scenarios have been determined by an analysis performed by domain ex-perts [15]. The CFRP material used in this study is actually a thermoset matrix with carbon fibres arranged in unidirectional layers (HexPly© M21 matrix from Hexcel and
T700 low density carbon fibers).
Three different contamination scenarios in, at least, three different contamination levels were investigated by using hydraulic fluids, release agents and moisture. It is worth to note that the contaminant interaction dynamics with the CFRP panels is still under investigation and still needs to be fully clarified. Just as an example, most hydraulic fluids is known to migrate inside the panel just to surface once the panel is scarfed for application of a patch in a maintenance scenario. Its formulation allow for a rapid evaporation of volatiles with a limited fraction of high boiling volatiles persisting on the
surface for months. Moisture, instead, get trapped by the CFRP structure determining a panel mass uptake.
As regard the contamination levels, we considered those that had been shown to affect the composite bonded joints with a significant reduction of the mode-I fracture tough-ness.
The selected hydraulic fluid was Skydrol® (version 500B4), one of the most popular fire resistant aviation fluid. It is made up of a group of chemical additives dissolved into a firesistant phosphate ester base. Should it come in contact with water, Skydrol® re-leases phosphoric acid and alcohols that can undermine the CFRP structure. In this case, the contamination levels were referred to the pH of an aqueous extract of Skydrol®/Wa-ter mixture. CFRP samples were actually immersed in different Skydrol®-waSkydrol®/Wa-tery phase solutions at pH 2, pH 3 and pH 4 for 672 hours in an oven at 70 ºC with lower pH levels corresponding to higher contamination levels.
Release agents containing silicon are used for the moulding process of composite pan-els. The silicone contamination, which can penetrate up to hundreds of nm into the CFRP panel matrix, prevents any further adhesive bonding. For this reason, it must be carefully determined before bonding. To this purpose, clean CFRP samples were dip coated with solutions of release agent (Frekote 700NC) at four different loadings (from 1% up to 20%). After this process, the silicon concentration on the CFRP surface has been measured by X Ray Fluoroscopy and found to be in the range of 2.1 to 10.4 as atomic % level. Four classed of contamination level have been hence obtained [(2.1-2.7%), (6.5-6.8%), (8.2-9.5%), (10.1-10.4%)].
CFRP adhesive joints have also been found to be sensitive to the presence of moisture and thus four different levels of moisture uptakes were considered in this work. These
were obtained by means of panels exposure to four relative humidity conditions (RH 100%, 95%, 75%, 30%). Actually, panels were exposed to demineralised water and to saturated aqueous solutions of K2SO4, NaCl and MgCl2 for 672 hours at 70 °C. The wa-ter uptakes were then evaluated by the mass increase of CFRP samples with respect to the dry ones. The recorded relative mass uptake was 0.29%, 0.79%, 1.08% and 1.26%, respectively.
2.2 Sensor Array, E-Nose Platform and measurement procedure
For this study, the Airsense GDA2 electronic nose platform was selected [16]. The GDA2 is a continuous sampling, forced flow, e-nose platform designed to operate in harsh environment for the quantification of dangerous chemical compounds. It features an hybrid sensor array including 2 Metal Oxide (MOX) sensors, 1 Electrochemical (EC) sensor, 1 Photo Ionization Detector (PID) sensor and an integrated Ion Mobility Spectrometer (IMS) sensor. This array composition thus joins the volatile quantification capabilities of the PID to the discriminative power of the IMS sensor complemented by the broad sensitivities of MOX sensors [17]. Actually, the sensing platform provides for 8 instantaneous response channels named virtual sensors. These include the above mentioned 4 solid state sensors response and the 4 Area under the Curve (AuC) computations of the left and right sections (with respect to the water response peak) of the positive and negative spectra of the IMS. Several adaptations have been performed to customize the overall system to the specific task. In particular, the most significant affected the sampling architecture and measurement methodology. An IR emitter (20W Halogen Lamp), directly assembled on the e-nose inlet, has been chosen to slightly increase the temperature of the CFRP sample thus improving volatiles desorption and
their uptake by the e-nose. During the measurement, the CFRP panel is coupled to the e-nose inlet by means of a small bell-shaped adapter also encasing the IR emitter. This setup keeps the distance between the surface and the inlet to a minimum (less than 3 cm). Furthermore, the measurement methodology has been modified to resemble the typical e-nose sampling procedure including a baseline acquisition phase, a sensor exposure phase and a flushing/desorption phase. During the baseline acquisition phase, the e-nose sensor array response is sampled while being exposed to filtered ambient air. This enters the sensor chamber coming from a specific inlet located in the rear portion of the e-nose. In the exposure phase, the sensor array chamber is gradually filled and fed with air coming from the measurement bell hence carrying the volatiles desorbed by the CFRP surface. Practically, the IR emitter is active during the first 15 seconds of the sensor exposure phase, while being switched off during the remaining stages of the measurement cycle. Finally, during the flushing phase, the sensors are againexposed to filtered air. The GDA2 e-nose provides for different dilution options so to tune the clean, filtered tovolatile enriched air ratio during exposure. In our setup, no dilution have been applied. Sensor responses have been acquired and saved by means of SD memory card while a custom software component have been developed for extraction of raw sensor data for the pattern analysis purposes. In fig. 1 and 2, the typical response of the original 8 virtual sensors array to an uncontaminated sample and a pure Skydrol contaminated panel has been reported. Details on the feature extraction phase are provided in the next sections.
2.3 The Pattern Recognition design
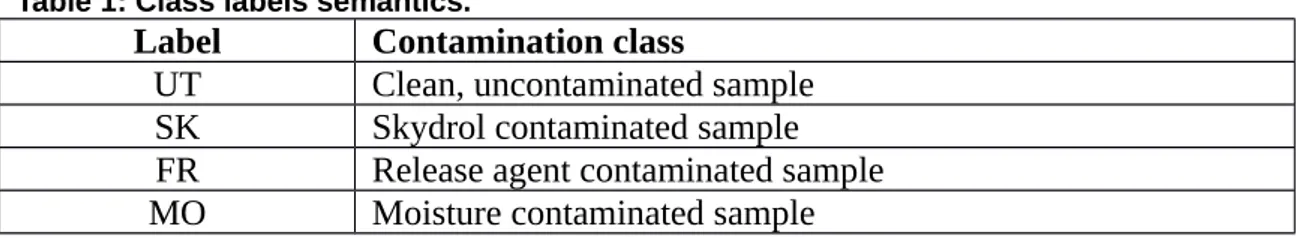
The requested contamination detection and identification task can be described as a classification problem. In this way, the electronic nose architecture is bound to produce a classification estimation, allocating the CFRP sample under analysis to a specific label within the set depicted in table 1.
Table 1: Class labels semantics.
Label Contamination class
UT Clean, uncontaminated sample SK Skydrol contaminated sample FR Release agent contaminated sample MO Moisture contaminated sample
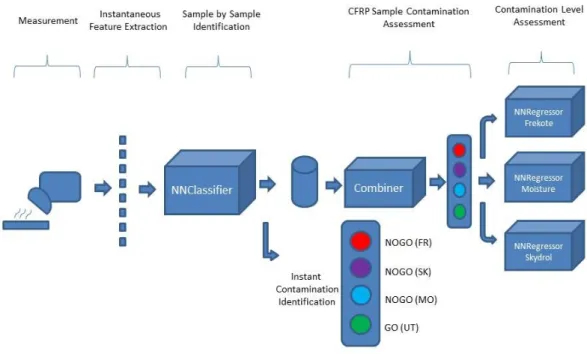
In order to fulfill the scenario requirements, the electronic nose architecture should be able to provide a fast response on the contamination state of the surface under analysis. At the same time, accuracy should be keep at the highest level. For this reason, our design encompass a two stage pattern recognition system (see Fig. 3). The first one is concerned with a rapid, instantaneous response analysis and subsequent identification of the contamination state, i.e. with the detection and discrimination of the contaminants. Each instantaneous e-nose response sample is analyzed and a running estimation of the contamination state, based on the sensor readings, is hence produced. The second one is concerned with the assessment of the overall response using the combined response of the previous stage throughout the measurement cycle.
Figure 3: Pattern Analysis and Recognition Architecture
The core of the computational intelligence system is based on an Artificial Neural Network (ANN) classifier designed for real time identification of the contaminants and on a neural regressor designed to estimate the contamination quantitatively.
Actually, the olfactive pattern recognition system was designed to rely on a three layers multilayer perceptron (MLP) architecture. All neurons transfer function was chosen to be sigmoidal. The number of hidden neurons was set to five in order to limit the complexity of the model limiting possible overtraining issues by design. The MLP was designed to use an expanded class encoding scheme representing the single output data with a vector of 4 output neurons (ONs) each one associated to a specific class among
the above mentioned. This structure reflects typical guidelines for classification oriented MLP architectures. As such, for each of the unseen test samples, the network is expected to express a high activity level (corresponding to ON values approaching 1) on only one of the output neurons, and low activity level (close to zero) for the others . However, this is not often the case. More frequently, significant activity levels are found in all the ONs. In this case, the ON expressing the maximum activity level is selected ( and named WON-Winning Output Neuron) and the associated class is chosen as the network best estimation.
ONs activity level should not to be considered as a class posterior probability measure
p(Label,x). However, if normalized to the sum of all ONs activity level, it can be
exploited as one of the possible measures of the confidence (also referred as reliability) with which the classification act take place [18].
Specifically, our real time classifier can provide a simple measure of the instantaneous classification confidence relying on the analysis of a single response pattern. However, by averaging these values throughout all the measurement cycle, at the end of it we can provide an overall classification estimation and an associated reliability measure. An alternative approach could exploit the percentage of the instantaneous measurements that have been classified as belonging to each of the contamination specie during the entire measurement cycle. The normalized maximum value obtained among all the classes may actually represent an alternative overall classification reliability index. Summarizing, the operator will be able to obtain a fast, running, response from the electronic nose architecture considering that a first response could be quickly dispatched as soon as the baseline acquisition phase ends. Provided that a stable identification of the contaminant can be obtained, the operator can quickly assess the panel status by
looking at the instantaneous responses. In the doubtful cases when the instantaneous and running response is oscillating among multiple labels, the operator could wait to the end of the measurement cycle to obtain a combined, high accuracy, response. The combination approaches have been described in detail in chapter 2.5.
2.4 Feature extraction and Dataset generation
In order to efficiently train the supervised real time classifier and regressor, the sensor responses of the labelled measurement dataset have been collected and the relevant samples have been extracted. Practically, a single measurement cycle response have been divided in different time intervals, i.e. the injection-transient phase corresponding to samples belonging to the [20s, 35s], the steady state response phase corresponding to [36s, 90s] and the desorption phase corresponding to [91s, 120s] interval. Samples belonging to injection-transient and steady state intervals have been selected to become part of the pattern recognition (PARC) dataset. The total number of measurement cycles was 44, and specifically 9 belonging to untreated panels, 13 belonging to Frekote® contaminated samples, 9 belonging to Skydrol® contaminated samples and 13 belonging to moisture contaminated samples. Hence our dataset was built up by 3080 instantaneous e-nose responses. Collected samples have been labelled and samples belonging to a percentage of measurement cycles have been extracted to become part of the training set. The remaining samples have been used for testing purposes. In this way, the test set is composed by samples belonging to measurement cycles (and corresponding CFRP samples) that do not contributed to the training set. This avoid any positive bias in performance estimation. Specifically, a leave-one-cycle-out procedure
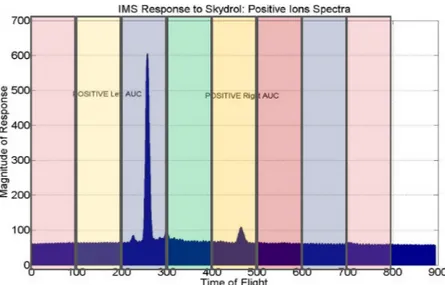
Figure 4: Example of AuC feature extraction from IMS spectra buckets. According to our feature extraction procedure, the IMS spectra have been divided in 8 buckets of the same size, then the area under the curve (AuC) within each bucket has been computed (blue color). As an example of a discriminant characteristics, in the time of flight (ToF) window of [400,500] ms it is possible to identify a response peak that shown specific to Skydrol 500-B. Conversely, in the ToF [200,300] range, we can spot the water related peak
2.5 Combination Approach
The real time classifier provides an instantaneous assessment of the contamination status based on a single response pattern. These patterns are extracted in a running fashion from the stream of sensor responses as soon as they become available. Of course, a single classification act has a limited robustness to noise-like effects affecting e-nose measurements. In order to obtain an overall robust estimation of the contamination status, we tested for the execution of two different combination strategies. Both combines the results of classification acts performed during an entire measurement cycle. The two strategies can be described as a majority voting and a reliability weighted majority voting.
For majority voting, a hard class labelling reliability AClass '
has been computed by summing up the number of instantaneous classification votes obtained by each class
Class for the number of total relevant samples in the measurement cycle (named as T).
AClass ' =
∑
t =1 T ζClass t with ζClass t=
{
1 if Class=arg maxClassONt , Class 0 otherwisewith Class in [1,2,3,4] corresponding to [UT,RE,SK,MO]. In the end, the CFRP sample under analysis is hence labeled with the class label obtaining the maximum A 'Class .
Panel Label=arg maxClassA 'Class
Labeling confidence= max Class A 'Class
∑
Class A 'ClassAs regards as the second approach, a soft labeling confidence have been computed for each class by using the following equation:
AClass ' ' =
∑
t=1 T(
ζClass t ∗ONt ,Class∑
l=1 4 ONt , l)
with l in [1,2,3,4] -> [UT,RE,SK,MO]where ONt , Class is the i-sample neural network output value for the neuron corresponding to the class under estimation.
The CFRP sample under analysis is hence labeled with label obtaining the maximum
A ' 'Class .
The corresponding labelling confidence measure is hence:
Labeling confidence= max Class A ' 'Class
∑
Class A ' 'ClassNote that both measure can be computed with a running real time approach providing an on-line approximation of the cycle-wide classification reliability. This can be obtained by updating the running estimation as soon as new real time classifications take place.
3.1 Real Time Classifiers Performances
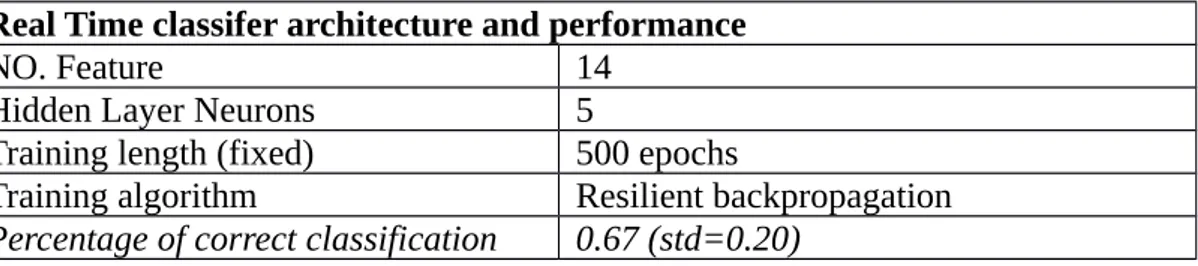
Real time classification performances have been estimated and reported in table 2. Estimation have been carried out following the leave one cycle out procedure described in previous chapters. Obtained instantaneous performance values are in the range to be defined encouraging from the end user point of view. However, a naive projection of these results on a cycle-wide scale could be misleading.
Table 2: Real time classifier performance estimation Real Time classifer architecture and performance
NO. Feature 14
Hidden Layer Neurons 5
Training length (fixed) 500 epochs
Training algorithm Resilient backpropagation
Percentage of correct classification 0.67 (std=0.20)
Specifically, we could wrongly assume that, by using a majority voting combination, a correct classification rate of almost 70% on a single sample basis would lead to approach 100% correct classification rate on a cycle-wide basis. Of course, this is generally false. In our case, the distribution of wrongly classified samples across different CFRP panels is significantly skewed, with these samples being mostly related with only a subset of the CFRP samples of the dataset. This is also reflected by the high value of correct classification rate standard deviation. For example, a very significant number of real time misclassification occurs among Skydrol and Moisture contaminated CFRP samples, specifically when low contamination are concerned. Specifically, the worst correct classification rate occurs with Skydrol contamination at ph=4. In this case, only 35% of the instantaneous samples were correctly classified while over 60% of them were classified as Moisture contaminated samples. As a comparison, for
Skydrol at pH=2 level, the correct classification rate was found to be in excess of 84%. Significant amount of misclassification errors also occurs with Moisture contaminated samples at the lowest mass uptake levels. In this case, instantaneous classification rate has found only to be slightly over 35%, the remaining samples have been equally classified as Skydrol or Untreated. Instead, instantaneous classification rate at highest mass uptake level exceeds 95% of correct classification rate. These figures are compatible with an hypothesis of lower detection limit of the e-nose being under pH=3 contamination level for Skydrol/Water mixture. A significant influence of environmental humidity in causing lowest mass uptake level MO samples misclassification is also postulated.
3.2 Cycle wide performances
Adopting a a majority vote combination scheme led us to obtain a cycle wide correct classification rate of 71.5%. Instead, the accuracy mediated majority vote methodology allowed to reach for a 72.2% correct classification rate. Statistically, the results obtained by the two approach did not differ significantly.
In the second case, a false negative performance of 6.1% has been reached. This is interesting considering the high cost of such a misclassification in the safety critical scenario to which this work is aimed. However, the false positive rate is still too high to be considered as satisfactory (30.2%). It is worth to note that the results are obtained with original priors in the training set. This could be actually determining the classification bias towards positive (contaminated) cases highlighted by the high false positive (FP) rate. For a complete performance evaluation, we report the confusion matrix related to accuracy mediated majority vote in table 4.
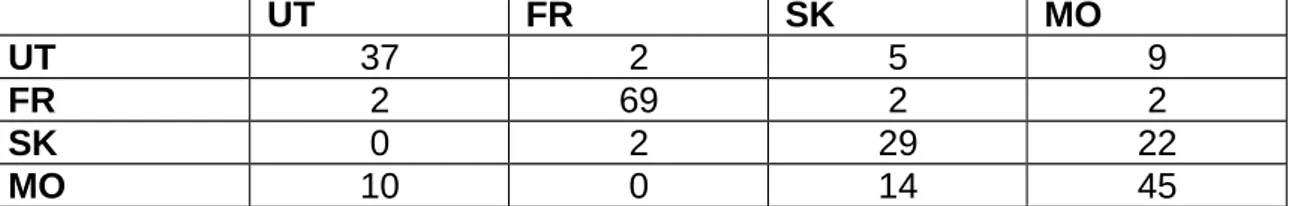
Table 4: Confusion matrix obtained on test samples by a 250x crossvalidation of a random leave one cycle out training-test procedure. Combination of instantenous responses has been performed by accuracy mediated procedure. Note that class occurrence unbalance among contaminated and uncontaminated samples reflects original priors unbalance in the dataset.
UT FR SK MO UT 37 2 5 9 FR 2 69 2 2 SK 0 2 29 22 MO 10 0 14 45 3.3 Reject Option
Further improvement in both false negative and true positive could be achieved by introducing a reject option, i.e. the possibility for the cycle wide classifier to refuse to cast a labelling estimation for those CFRP panels that it cannot classify confidently. Such a reject option can actually help to reduce the costs associated to misclassification accepting the costs of rejecting “suspicious” panels. In these cases, the electronic nose will refuse to express a definitive answer to their presentation. Rejection options have been considered significant in pattern recognition research. In facts, the cost of a rejection occurrence is generally considered lower than the one associated to a misclassification [19]. In our scenario, false negatives are a potential significant safety threat while false positives retain a cost associated to the further cleaning process to be implemented.
In artificial olfaction research , however, the impact of the use of reject option has been largely underestimated with the exception of a few contributions (see [20],[21]) in which they have been used only for novelty detection purposes. For a reject option to
be implemented, a classification confidence/reliability measure is needed, and, to this regard, AClass
' '
can be profitably exploited.
Assuming that misclassification occurs more frequently at low confidence levels, it is possible to empirically set up a threshold on computed confidence below which to refuse to label suspicious panels. In this way, we can practically identify CFRP panels that are difficult to classify (i.e. panels with a high probability to lead to a misclassification error).
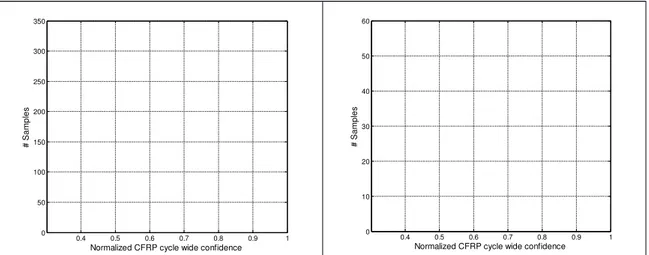
An analysis of the distribution of cycle wide classification confidence both for correct classification events and misclassification (see Fig. 5), confirmed our hypothesis.
0.4 0.5 0.6 0.7 0.8 0.9 1 0 50 100 150 200 250 300 350 Normalized CFRP cycle wide confidence # S am pl es 0.4 0.5 0.6 0.7 0.8 0.9 1 0 10 20 30 40 50 60 Normalized CFRP cycle wide confidence # S am pl es
Figure 5: Crossvalidated Cyclewide Reliability/Confidence A’’ histogram among analyzed CFRP panels (left: Correctly classified samples, right: Uncorrectly classified samples)
Of course, too high a threshold level could lead to the rejection of an unbearable number of panels including a relevant fraction that would have resulted in a correct classification outcome. On the other hand, a too low threshold level could cause a drop of achievable correct classification rate. It is worth to note that an increase in the size of the available dataset could allow for the implementation of a procedure for optimal and unbiased choice of the threshold level [22][23].
Once the reject threshold is set up, the performance estimators change their values significantly (see table 4 and Fig. 6). For example, setting the threshold level value (TL) at 0.55 corresponds to a correct classification rate of 77% with a reject rate of 20%. This represents a very interesting improvement in the overall cycle-wide classification performance. Moreover, false negative (FN) rate becomes null while false positive rate sets at 17% level.
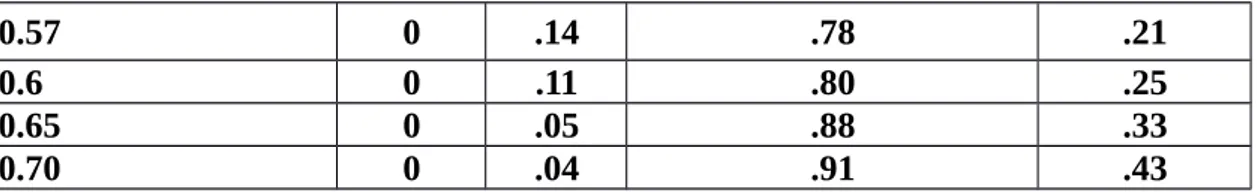
At TL=0.57 the FP rate reaches values as low as 0.14 with no FN at all with only a small increase of the reject rate (21%). The correct classification rate in this case has been computed to be 78%. It is worth to note that, at this threshold level, Skydrol pH=2 panels were rejected more than 50% of the times they were presented to the combination algorithm. Similarly, Moisture lowest mass uptake panels were rejected at 68% rate but if processed, more than 60% of these rejected panels presentations would have resulted in a misclassification.
By raising the threshold value to 0.6, we obtain an increase of the reject rate to 25% while FP rate set at 11% and correct classification rate reach 80%. At a threshold value of 0.65, we obtain a fp rate of 5% and a correct classification rate of 88% while the reject rate set at a value of 33%. As an extreme, for a reject threshold value of 0.8 we can achieve a 90% correct classification rate with a FP rate of 4%, however these performances can only be achieved at an unbearable 45% reject rate.
Table 4: Performance indexes values at different reject threshold levels. Increasing threshold values cause the Correct classification rate and FP rate to improve at the cost of an increase of reject rate.
Threshold Level FN rate FP rate Correct Classification rate Reject Rate
- .6 .30 .71 N/A
0.4 .5 .28 .70 .02
0.57 0 .14 .78 .21 0.6 0 .11 .80 .25 0.65 0 .05 .88 .33 0.70 0 .04 .91 .43 0 0.1 0.2 0.3 0.4 0.5 0.6 0.7 0 0.1 0.2 0.3 0.4 0.5 0.6 0.7 0.8 0.9 1
Treshold Value
P
er
fo
rm
an
ce
In
de
x
va
lu
e
Influence of threshold level on perfomance
Figure 6: Threshold level value impact on performance indexes (red: Correct classification rate, green: reject rate, blue: false positive rate).
3.4 Contamination Quantification
In order to obtain an estimation of contamination level, we have designed a quantification layer based on three regression neural networks in their universal functional estimator setup. Each neural network has been designed and trained to estimate the surface contamination level by one of the three different relevant contaminants once the previous layer has identified it. As previously mentioned, each contaminant has a different range of relevant concentration levels identified with a different physical or chemical entity that is related with it. Skydrol concentration level is
obtain a more robust estimation of the contamination state. The proposed introduction of a reject option, based on combined classification confidence, allowed to further increase the performances by detecting and ruling out suspicious CFRP panels whose classification could possibly lead to an error. Identification of suspicious panels can eventually trigger the use of more cost intensive analytical tools. It is worth to note that the overall PARC architecture, by relying on the combination of multiple issues of the same real time neural classifier, could be easily implemented on board for an easy adoption in real world scenario.
However, quantification capabilities should be further improved in order to achieve satisfactory performance.
In order to refine the performance with regards to low moisture contamination levels we plan to study an improvement in sampling/processing stages aiming to reduce the influence of environmental humidity that still appears as a major threat for measurement reliability.
An accurate feature selection analysis should be explored since it may lead to improved performance. In addition, an alternative approach could be analysed for the classification task based on a three class classifier (contaminated, uncontaminated, don’t know) so to include the suspicious case identification.
Acknowledgments.
This work has been partially founded by European Commission Seventh Framework Programme under Project ENCOMB (Extended Non Destructive Tests for Composite Bonding), Call FP7-AAT-2010-RTD-1 Grant no. 266226.
The authors are indebted with Mr. Ernst Rau, formerly with EADS (Airbus Group) for uncontaminated CFRP panels preparation.
References
[1] TC Pearce, SS Schiffman, HT Nagle, JW Gardner, Handbook of Machine Olfaction, Wiley Press, 2007.
[2] C. Di Natale, A. Macagnano, E. Martinelli, et al. Lung cancer identification by the analysis of breath by means of an array of non-selective gas sensors, Biosens. Bioelectron. 18, 1209-18(2003).
[3] Mead MI, Popoola OAM, Stewart GB, Landshoff P, Calleja M, Hayes M, Baldovi JJ, McLeod MW, Hodgson TF, Dicks J, Lewis A, Cohen J, Baron R, Saffell JR,Jones RL, The use of electrochemical sensors for monitoring urban air quality in low-cost, high-density networks,
[4] S. De Vito, E. Massera, M. Piga, L. Martinotto, G. Di Francia, On Field Calibration of an electronic nose for benzene estimation in an urban ollution monitoring scenario, Sensros and Actuators B: Chemical, Vol. 129, (2), (2009), pp 750-757 [5] F. Bianchi, M. Careri, A. Mangia, M. Mattarozzi, M. Muscia, I. Concina, M.
Falasconi, E. Gobbi, M. Pardo, G. Sberveglieri. Differentiation of the volatile profile of microbiologically contaminated canned tomatoes by dynamic headspace extraction followed by gas chromatographyÐmass spectrometry analysis, Talanta 2009, 962-970.
[6] A. D. Wilson, M. Baietto, Applications and Advances in Electronic-Nose Technologies, Sensors 2009, 9, 5099-5148; doi:10.3390/s90705099
[7] M. Padilla, Improving the Robustness of Artificial Olfaction Systems by Multivariate Signal Processing, Phd Thesis, available at
[8] F. Rock, N. Barsan, U. Weimar, Electronic noses: Current Status and Future Trends, Chem. Rev. 2008, 108, 705-725
[9] H. Ishida, K. Suetsugu, T. Nakamoto, T. Moriizumi, Study of autonomous mobile sensing system for localization of odor source using gas sensors and anemometric sensors, Sensors and Actuators A: Physical 45 (2), 153-157
[10] Javier G. Monroy, Achim J. Lilienthal, Jose-Luis Blanco, Javier Gonzalez-Jimenez, Marco Trincavelli, Probabilistic gas quantification with MOX sensors in Open Sampling Systems—A Gaussian Process approach, Sensors and Actuators B: Chemical, Volume 188, November 2013, Pages 298-312, ISSN 0925-4005,
http://dx.doi.org/10.1016/j.snb.2013.06.053.
[11] CleanSky Website - URL: http://www.cleansky.eu
[12] N. Markatos, K.I. Tserpes, E. Rau, S. Markus, B. Ehrhart, Sp. Pantelakis, The effects of manufacturing-induced and in-service related bonding quality reduction on the mode-I fracture toughness of composite bonded joints for aeronautical use, Composites Part B: Engineering, Volume 45, Issue 1, February 2013, Pages 556– 564.
[13] D. N. Markatos, K. I. Tserpes, E. Rau, K. Brune, Sp. Pantelakis, Degradation of Mode-I Fracture Toughness of CFRP Bonded Joints Due to Release Agent and Moisture Pre-Bond Contamination, Accepted for publication in Journal of adhesion, available on line since February 2013.
[14] A. D'Amico, R. Bono, G. Pennazza, M. Santonico, G. Mantini, M. Bernabei, M. Zarlenga, C. Roscioni, E. Martinelli, R. Paolesse, C. Di Natale, Identification of melanoma with a gas sensor array, Skin Research and Technology, Vol.4, No. 2, 2008, 226—236
[15] Encomb Project Website – URL: http://www.encomb.eu
[16] Airsense GDA Website http://www.airsense.com/en/products/gda-first-response
[17] M. Utriainen, E. Kärpänoja, H. Paakkanen, Combining miniaturized ion mobility spectrometer and metal oxide gas sensor for the fast detection of toxic chemical vapors, Sensors and Actuators B: Chemical, Volume 93, Issues 1–3, 1 August 2003, Pages 17-24
[18] L.P.Cordella, et al. Neural network classification reliability: Problems and applications. Image Processing and Pattern Recognition, 1998, 5: 161-200.
[19] T. Denoeux, Analysis of evidence-theoretic decision rules for pattern classification, Pattern Recognition, Volume 30, Issue 7, July 1997, Pages 1095-1107
[20] S. Marco, A. Gutierrez-Galvez. Signal and data processing for machine olfaction and chemical sensing: a review. Sensors Journal, IEEE, 2012, 12.11: 3189-3214 [21] L. Carmel, N. Sever, D. Lancet, D. Harel, An eNose algorithm for identifying
chemicals and determining their concentration, Sensors and Actuators B: Chemical, Volume 93, Issues 1–3, 1 August 2003, Pages 77-83
[22] F. Tortorella, An optimal reject rule for binary classifiers. In:Advances in Pattern Recognition. Springer Berlin Heidelberg, 2000. p. 611-620.
[23] P. Foggia, C. Sansone, F. Tortorella, M. Vento, Multiclassification: reject criteria for the Bayesian combiner. Pattern Recognition, 32(8), (1999),1435-1447.
Biographies
Saverio De Vito received his degree in Computer Engineering from University of Naples “Federico II” in 1998 and his Ph.D. in Information Engineering from University of Cassino. Previously involved in biomedical image processing research, from 1999 to 2004 he was R&D technical manager for satellite based telemedicine and distance learning projects in a software house. In June 2004, he joined ENEA, as a researcher. His research interests include artificial olfaction, wireless and intelligent sensing, air quality monitoring, statistical pattern recognition, and computer aided diagnosis. Involved in several national and international research projects and member of several committee in cooperative research efforts, He is author of more than 70 scientific contributions. Since 2005 he is adjunct professor of Computer Science and Parallel Computing at University of Cassino. He was member of XXVIII Italian research expedition in Antarctica.
Ettore Massera received his degree in Physics from the “Federico II” University of Naples in May 1997. Previously he was involved in non-linear optical characterization of Liquid Crystals and nanostructured Porous Silicon at the Physics Department in Naples. He is in charge as Researcher at ENEA research center from 2003. His research interests and expertise include more than ten years on electrical and optical characterization in controlled environment of advanced materials for gas sensing application; artificial olfaction; embedded and intelligent sensing; air quality monitoring. Involved in several national and international research projects, He is author of more than 70 scientific contributions.
Mara Miglietta received the B.S. degree in Chemistry from the Università degli Studi di Bari in 1997. In 1999 she joined ENEA as a Researcher working on environmental monitoring and on liquid and solid state NMR (HR-MAS, CP-MAS) of foodstuffs and polymers for food packaging. Since 2007 she works in the fields of nanotechnologies, specifically on polymer nanocomposites and conductive polymers for VOC sensing applications and physico-chemical characterization of nanomaterials.
Paola Di Palma received her MS in Electrical Engineering from University of Cassino in 2009. She was a research fellow of CNR-ISAFOM and ENEA pursuing research on artificial olfaction and wireless sensor networks with applications to distributed olfactive nuisance detection, indoor air quality and power management in wireless sensor networks. She is now with a private engineering firm specializing in wireless sensor networks solutions.
Girolamo Di Francia received his degree in Physics from the University of Naples “Federico II”. In 1985 he started his research activity in the field of fabrication and characterization of semiconductor solar cells (c-Si, GaAs), formerly in the Ansaldo comp. in Genova, and then in the ENEA research center of Rome, where he was
appointed full time researcher in 1988. From 1991 he joined the ENEA research center of Naples where, starting from 1992, he investigated porous silicon based devices. In 1996 he established there the Gas Sensor Laboratory mainly devoted to the fabrication and characterization of devices based on nanomaterials and on polymers nanocomposites.