RICERCA DI SISTEMA ELETTRICO
Analisi di scenari energetici: scenario italiano, introduzione di
reattori termici
V. Barbara, G. Forasassi
Report RdS/2011/114 l’Energia e lo Sviluppo Economico Sostenibile
ANALISI DI SCENARI ENERGETICI: SCENARIO ITALIANO, INTRODUZIONE DI REATTORI TERMICI
V. Barbara, G. Forasassi - CIRTEN
Settembre 2011
Report Ricerca di Sistema Elettrico
Accordo di Programma Ministero dello Sviluppo Economico – ENEA Area: Governo, Gestione e sviluppo del sistema elettrico nazionale
Progetto: Nuovo nucleare da fissione: collaborazioni internazionali e sviluppo competenze in materia nucleare
Responsabile Progetto: Paride Meloni, ENEA
CIRTEN
Consorzio Interuniversitario per la Ricerca TEcnologica Nucleare
Lavoro svolto in esecuzione della linea progettuale LP1 punto F2
UNIVERSITA’ DI PISA
DIMNP
Analisi di Scenari Energetici:
Scenario italiano, introduzione di reattori termici
Autori
B. Vezzoni
G. Forasassi
CERSE-UNIPI RL 1078/2011
Analisi di Scenari Energetici:
Scenario italiano, introduzione di reattori termici
Con il presente lavoro si vuole fornire un contributo all’analisi dello scenario italiano fornendo
alcune considerazioni preliminari in vista della re-introduzione degli impianti nucleari sul
territorio.
Il lavoro e’ stato sviluppato precedentemente all’incidente di Marzo 2011 at Fukushima NPPs e
dunque precedente al referendum del Giugno 2011. Ulteriori valutazioni successive a questa data
non sono state sviluppate.
Il lavoro fa parte di una piu’ estesa attivita’ (attivita’ di dottorato di ricerca) sviluppata presso
l’Universita’ di Pisa in stretta collaborazione con il Karlsruhe Institute of Technology (KIT),
Germany.
Attraverso l’analisi sono stati individuati alcuni punti critici relativi allo sviluppo dello scenario
italiano, andando ad evidenziare le differenze rispetto agli scenari ipotizzabili per altri Stati dove
la produzione nucleare non ha subito nessun arresto.
Il presente lavoro va ad aggiungersi al rapporto CIRTEN - CERSE 2008 (RL 1051-2008) [1] e al
rapporto CIRTEN - CERSE 2010 (RL 1052-2010) [2] in cui e’ stata descritta nel dettaglio la
rational adottata per le analisi di scenario presso l’Università di Pisa e le prime applicazioni dello
studio.
Il punto di partenza e’ il concento di sviluppo sostenibile applicato alle fonti energetiche (ed in
particolare al nucleare), dove per sviluppo sostenibile si intende l’accordo di un insieme di fattori
eterogenei quali l’economia, l’ambiente e gli aspetti sociali. Tale approccio (lo studio
dell’energia nucleare in ambito di sviluppo sostenibile) e’ in accordo con le posizioni assunte
dalla Comunità Europea in materia di sviluppo energetico: vedasi ad esempio lo Strategic Energy
Technology Plan (SET) del 2007 [3] o la piattaforma tecnica Sustainable Nuclear Energy
Technology Platform (SNE-TP) [4] , lanciata anch’essa nel 2007.
Come indicato in [1,2], la scelta delle ipotesi alla base dello scenario e’ fondamentale per il
grande impatto sui risultati ottenuti.
In modo da quantificare, l’impatto di ogni singolo parametro, uno studio parametrico e’ stato
sviluppato [5,6].
La presente nota fa riferimento ai risultati ottenuti relativamente all’introduzione dei reattori
termici (LWRs) nello scenario italiano. L’impatto di parametri quali il burnup allo scarico e la
domanda energetica (quest’ultima importante condizione al contorno come indicato in [1,2]) e’
stato quantificato relativamente agli indicatori scelti a priori relativi alla sostenibilita’ del settore
nucleare. Tali indicatori descritti in [1] sono: le risorse coinvolte, la radiotossicita’ del materiale
mandato a deposito, il calore di decadimento del materiale mandato a deposito, e l’inventory dei
rifiuti.
I risultati qui riportati, sono stati presentati all’ 11th IEMPT meeting della NEA/OECD
(November, 2010) [5,7]. Il testo dell’articolo presentato in via di pubblicazione come
proceedings della conferenza e’ allegato alla presente nota (Appendice A) ed e’ considerato parte
integrante del lavoro.
Ulteriori studi relativi alla transizione da una flotta termica ad una flotta veloce sono stati
sviluppati [6]. Di particolare interesse e’ il confronto fra varie tipologie di reattori veloci, nella
fattispecie reattore ELSY (configurazione HEX-z [8]) refrigeratoa piombo, il reattore ESFR
(oxide fuel [9]) refrigerato a sodiu e il reattore EFR [10] anchesso refrigeratoa sodio ma con
diverse caratteristiche di breeder.
Seppur la base di riferimento presa fosse il casdo italiano, il lavoro e’ generalizzabile su scala
Europea.
Reference
[1]
B. Vezzoni and G. Forasassi. Analisi di Scenari Energetici: Introduzione di Reattori
Nucleari Innovativi. Technical Report CIRTEN-CERSE-UNIPI RL 1051-2008, 2008.
[2]
B. Vezzoni and G. Forasassi. Analisi di Scenari Energetici: studio preliminare dello
scenario italiano. Technical Report CIRTEN-CERSE-UNIPI RL 1052-2010, 2010.
[3]
EC. A European Strategic Energy Technology Plan (SET-PLAN). Towards a low carbon
future. Technical Report COM(2007), 723 final, EU, 2007.
[4]
EC. Sustainable Nuclear Energy Technical Platform, SNE-TP. Technical report, EU,
2008.
[5]
B. Vezzoni, F. Gabrielli, A. Schwenk-Ferrero, V. Romanello,W.Maschek, and M.
Salvatores. Analysis of a perspective Italian Fuel Cycle: LWRs Introduction and Advanced Fuel
Cycles. In 11thIEMPT, San Francisco, USA, November 1-4, 2010.
[6] B. Vezzoni, M. Salvatores, F. Gabrielli, A. Schwenk-Ferrero, V. Romanello, W. Maschek, and G. Forasassi. Analysis of a Hypothetical Italian Fuel Cycle: Transition to Fast Reactors. In ICENES2011, San Francisco, USA, May 15-19, 2011.
[7] NEA/OECD. 11th IEMPT conference,
San Francisco, USA, November 1-4, 2010.
http://www.oecd-nea.org/pt/iempt11/
[8]
V. Sobolev, E. Malambu, H.A. Abderrahim, and F. Rosatelli. Deliverable D5 - Preliminary design variants for fuel rod, assembly and core of ELSY-600. Technical Report DEL/07/005, EU, 2007.[9] EC EURATOM. Collaborative Project on European Sodium Fast Reactor, CP-ESFR, FP7-EURATOM, Contract N. 232658, 2009.
[10] J.C. Lefevre, C.H. Mitchell, and G. Hubert. European Fast Reactor Design. Nucl. Eng. Des., 162:133–143, 1996.
APPENDIX A- 11th IEMPT paper
This appendix includes the paper presented at 11
thIEMPT.
ANALYSIS OF A PERSPECTIVE ITALIAN FUEL CYCLE:
LWRs INTRODUCTION AND ADVANCED FUEL CYCLES
B. Vezzoni1, M. Salvatores1,2, F. Gabrielli1, V. Romanello1, A. Schwenk-Ferrero1, W. Maschek1, G. Forasassi3
1
Karlsruhe Institute of Technology (KIT),
Hermann-von-Helmholtz-Platz 1, 76344 Eggenstein-Leopoldshafen, Germany
2
Commissariat à l’Energie Atomique (CEA), Cadarache, St-Paul-Lez-Durance 13108, France
3
University of Pisa (UNIPI), via Diotisalvi 2, 56122, Pisa, Italy E-mail: [email protected]
Abstract
The present study has its origin in the Italian renewed interest in nuclear energy production and the declared intent of the government to install a nuclear capacity to cover 20% of the country’s electricity needs. Several scenarios have been proposed as part of a PhD activity performed in collaboration between the University of Pisa (Italy) and KIT (Germany).
In order to investigate the sustainability of the nuclear renaissance in Italy the complete fuel cycle associated to each scenario has been analyzed by means of the
COSI6 code, a dynamic scenario code
developed at CEA (France)
.For a country like Italy that is going to re-start the nuclear energy production, the analysis of the whole fuel cycle can help to evaluate the impact on critical issues like the resources and fuel cycle facilities needs (fabrication and enrichment capacity to sustain the cycle).
The reference scenario adopted for Italy is the so-called “once-through” scenario, where only Light Water Reactors (LWRs) are deployed to cover the energy demand for the period 2020-2200.
In order to optimize the use of the resources and to reduce the wastes produced (in term of quantity and radiotoxicity), the introduction of advanced fuel cycles that envisage the transition between LWRs to fast
systems has been analyzed too: by this approach the Pu from LWRs is considered to be a resource and not a waste.
In this paper, the main attention has been devoted to the analysis of the reference scenario (only LWRs installed up to 2200) underlining the impact of different parameters like burn-up, energy demand variation and introduction rate) on the resources utilization, the amount of wastes produced and the facilities needs. Preliminary results concerning the transition scenario to fast reactor (ELSY-oriented) have been included too.
Introduction
In the current century, the world energy demand is expected to grow at a rate of 4% per year [1], principally due, in the short term, to the increasing request of energy coming from China and India but also from the African Continent towards the end of the century.
To cope with this growing energy demand and limiting the burden on the natural resources market (oil, natural gas and uranium) and on the environment concerns, an optimized energy mix being sustainable in the long term, is envisaged.
In this mix, nuclear energy will play a central role for the electricity production. In fact, a renewed interest in this energy source (indicated by the energy policies adopted by several countries around the world [2]) is justified by the fact that nuclear energy is the only source that can produce a considerable amount of energy (to cover the base-load demand) essentially without greenhouse gases emissions.
Of course, similar to other natural resources, uranium supply is not unlimited; therefore, in the longer term use of nuclear energy, an optimization process in terms of resources and wastes is envisaged.
In fact, the current nuclear fuel cycles implemented world-wide are open (the so called “once
through” scenarios) or partially closed fuel cycles where the spent fuel (SF) extracted from thermal
reactors is directly sent to the disposal (at least after the Pu recovering for the production of Mixed Oxide (MOX) fuel). In this kind of fuel cycles, the use of uranium is not optimized because considerable amounts of fissile material (mainly Pu239 and Pu241) produced during the irradiation for energy production, is left in waste and sent to disposal (therefore part of the potential of the natural resource is lost).
In order to deal with these problems, advanced fuel cycles, that envisage the transition to fast systems, are investigated by several organizations at the international level (e.g. the NEA/OECD Expert group on Fuel Cycle transition scenario study is analyzing at the world scale the relevant technology requirements for the transition between the open or partially closed fuel cycles towards future sustainable fuel cycles [3,4]). In fact, the adoption of cycles where plutonium (Pu) and Minor Actinides (MA) are recycled (homogenously or heterogeneously) in a fast spectrum reactor gives a favorable effect on the resources optimization and on the reduction of the long term impact of wastes.
For a world nuclear scenario, the major constraint is related to the availability of uranium to sustain the nuclear fuel cycles up to the end of the next century. The availability of uranium becomes the central crucial issue when the development of nuclear energy world-wide (e.g. in Asia) is taken into account [4].
Different constraints exist when the scenario is limited to a country (see e.g. [5]) or to a region like Europe [6]. In fact, in this kind of scenarios the critical issues are more related to the fuel cycle back-end than to the resources availability. Therefore, key points are the quantity (and the quality) of the waste produced in the country, because they impact on the repository size, on the acceptability of nuclear energy, and on the infrastructures needed for sustaining the whole cycle (e.g. whether or not enrichment and fuel fabrication plants to be installed in a country).
In this paper, the focus has been directed to the analysis of a perspective Italian fuel cycle where the country-oriented approach has been applied. As the results will show, the influence on U resources due to the Italian scenario is negligible (~0.7% of the total resources estimated [7,8]). Wastes produced and their management is on the contrary an open issue.
The starting point of the analysis is the Italian renewed interest on nuclear energy production and the declared intent of the government to install a nuclear capacity to cover 20% of the country’s electricity needs. In order to give a fairly global picture of the introduction of the nuclear reactors (and fuel cycle facilities) in Italy, two sets of scenarios have been analyzed. As reference case, the “once-through” fuel cycle has been considered. In this case, only Light Water Reactors (LWRs, e.g. European Pressurized Reactors, EPR-oriented) have been deployed to cover the energy needs up to 2200. Alternatively, in order to achieve a more optimized use of uranium and Pu resources and to reduce the radiotoxicity of wastes, the transition to “closed” fuel cycles has been analyzed too. In these scenarios, the introduction of fast systems (e.g. lead cooled fast reactors, oriented to the European Lead cooled SYstem, ELSY [9]) starting at the earliest date in 2040 have been considered correlating the transition to fast neutron spectrum reactors to the availability of Pu1 in the country (assuming that Italy will install FRs in isolation, i.e. without buying fissile material from another country).
In this paper, the results of a parametric study concerning the LWR scenarios and focusing on the impact on characteristic parameters of the scenarios concerning fuel burn-up, energy demand and introduction rate, will be presented in detail, whereas only preliminary results concerning fast reactors scenarios are indicated here.
All the results have been obtained by means of the COSI6 code [11], a dynamic scenario analysis code originally developed at CEA (France), and now largely adopted at the European level.
1
The Pu availability for the future development of FRs refers only to the Pu quantity that will be produced in Italy by the restarting of nuclear energy production. The SF generated in the past by the shut down nuclear fleet, has been sent to “La Hague” (Fr) for reprocessing. According to this contract, Italy cannot use the separated plutonium and uranium and it will have to find a foreign utility willing to take over the materials [10].
The Italian scenario: hypotheses on energy demand and on reactors considered
In order to set up the boundary conditions for the Italian scenario, the assumed starting point is the declared intent of the government to install fairly soon a nuclear capacity to cover 20% of the country’s electricity needs.
According to the Eurostat 2009 [12], the net electric energy produced in Italy in 2007 has been of the order of 300 TWhe. To that amount ~50 TWhe has to be added, to take into account the electricity imported from neighboring countries (mainly France). Almost the same figures are valid for 2008 and 2009.
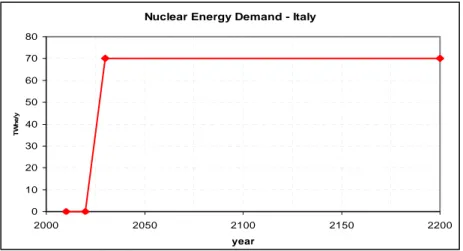
The total needs are then fixed at ~ 350 TWhe, and according to the governmental declaration (the 20% of total electricity production) 70 TWhe should be supplied by nuclear energy production.
For the scenarios presented in this paper, in the period 2010-2200 a constant nuclear energy production (equal to 70 TWhe) has been assumed, as indicated in Fig. 1.
On the basis of the energy demand depicted in Fig. 1, several scenarios for Italy have been set-up. The differences among them are principally related to the kind of facilities adopted for the nuclear energy production (e.g. thermal versus fast reactors) and on the fraction of these technologies during the transition period.
As previously indicated, the focus has been directed to the “once through” scenario where only LWRs are deployed. To set up the scenario, the reactor considered as reference LWR is oriented to the European Pressurized Reactor (EPR-oriented), the only advanced LWR currently under construction in Europe. The major data adopted in the simulations are listed in Table 1 and they are in agreement with data adopted by recent CEA studies [13].
For the scenarios adopting fast reactors, a lead-cooled fast system (ELSY-oriented) has been modeled by means of the ERANOS neutronic code [14] and the related COSI6 library (by means of the APOGENE code developed by CEA [15]) has been created. The detailed description of the ERANOS mode of the ELSY-oriented system is beyond the aim and scope of this paper. Anyway, the main parameters adopted for the COSI6 simulation of a typical Nuclear Power Plant (NPP) of smaller unit size have been listed in Table 1 too, for a comparison with the thermal system.
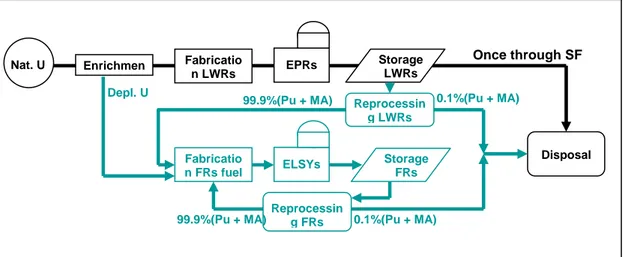
A simplified flow scheme of the “once through” scenario and of the fast reactors scenario is shown in Fig. 2. In the “once through” cycle the SF is sent directly to the repository, otherwise in the FRs closed cycle only losses (0.1% Pu and MA) are sent to the repository.
Nuclear Energy Demand - Italy 0 10 20 30 40 50 60 70 80 2000 2050 2100 2150 2200 year TW he /y
Figure 1. Nuclear Energy demand (TWhe/y) assumed for the Italian scenario: period 2010-2200 Table 1. Reactors characteristics
EPR-oriented ELSY-oriented
Thermal Power (MWth) 4500 1500
Electric Power (MWe) 1550 600
Load factor (%) 81.76 85
Cycle length (efpd) 4*366.6 4* 300
Efficiency (%) 34.44 40
Ave. Burn-up (GWd/tHM) 55 60
Initial HM mass (tons) ~120 ~30
Enrichment [U235, Pu239], (%) 4.6 16.4 (Ave.)
Fuel (S/A geometry) UOX (17x17) MOX (HEX)
COSI6 library, spectrum UOX, 14, Thermal RNR GEN4, 2316, Fast
The Italian scenario: “once through” study
As reference case the Italian “once through” scenario has been analyzed in detail. In order to obtain an overview about the impact and importance of parameters like burn-up, introduction rate and reactor lifetime on characteristic parameters of the scenarios, a parametric study has been performed and the results are compared in the following section.
To set up the reference case, the energy demand represented in Fig. 1 has been assumed. In this scenario, the nuclear reactors needed to cover the 70 TWhe per year have been introduced (as an optimistic2 presupposition) in a limited period of time, from 2020-2030. Then the constant energy
2
For the current analysis, an optimistic approach has been adopted. In fact, owing to the current situation in Italy, where NPPs have been shut-down more than 20 years ago, the country when relying only on its own resources could not sustain alone the fuel complete cycle (no industrial capacity to realize this introduction rate is available, no
demand (2030-2200) has been covered by EPR-oriented systems (modeled in agreement with Table 1) with a discharge burn-up of 55 GWd/tHM. The capacity needed to produce the energy demand chosen (70 TWhe) is about ~9.8GWe (taking into account the load factor listed in Table 1) and it corresponds to ~6 EPR-type Nuclear Power Plants (NPPs).
Figure 2. A simplified flow scheme for the Italian scenarios: the “once through” scenario (in black) and the fast reactors scenario (in blue)
Based on these assumptions, the total accumulated amount of natural uranium needed to sustain the cycle amounts to 1.1E05 tons in 2100 and 2.6E05 tons in 2200. As expected, the influence of the Italian U demand on the uranium market is very small, e.g. in 2100 ~0.3% of the worldwide estimated uranium resources [7,8]. In order to have a practical idea of the uranium needed to sustain the Italian scenario for 200 years, it can be estimated to correspond to the production of Australian mines (~8500 tons per year) [16] for 30 years of operation (that becomes 13 years for the U needed in Italy up to 2100). Of course, these values are affected by the assumptions made in terms of energy demand and reactor type, as it will be shown later on by the parametric study performed.
As indicated above, in a scenario focused on the country’s scale, the key points are the waste produced (in terms of quantity and quality) and the fuel cycle facilities needs.
The total amount of SF sent to the repository is about 10900 tons in 2100 and 26400 tons in 2200, the quantity of Pu in waste is, respectively, 135 tons in 2100 and 328 tons in 2200 (in both cases, representative for a burn-up of 55 GWd/tHM, it is ~1% of the associated fuel values; of course this percentage is dependent on the burn-up adopted). As for the resources, these values are strongly influenced by the scenario assumptions.
fabrication plants exist). Anyway, the analysis performed can provide some useful information about the country’s fuel cycle needs.
Enrichmen Fabricatio n LWRs EPRs Disposal Storage LWRs Once through SF Reprocessin g LWRs Fabricatio n FRs fuel ELSYs Storage FRs 99.9%(Pu + MA) Reprocessin g FRs 0.1%(Pu + MA) 0.1%(Pu + MA) 99.9%(Pu + MA) Depl. U Nat. U
Another interesting parameter is related to the facilities belonging to the fuel cycle. To maintain the Italian scenario, the annual fabrication capacity needed is around 189 tons (1/7 of the annual capacity of the currently existing French fabrication plant [17]), that corresponds to an enrichment capacity of 1780 tons per year (where the U235 enrichment required for the target burn-up is 4.6%).
As previously indicated, the scenario results are affected by the assumptions made. In order to quantify this influence, a parametric study has been undertaken. The main parameters considered are the average discharge burn-up, the introduction rate of reactors and the reactor lifetime.
The parametric study: influence of the discharge burn-up
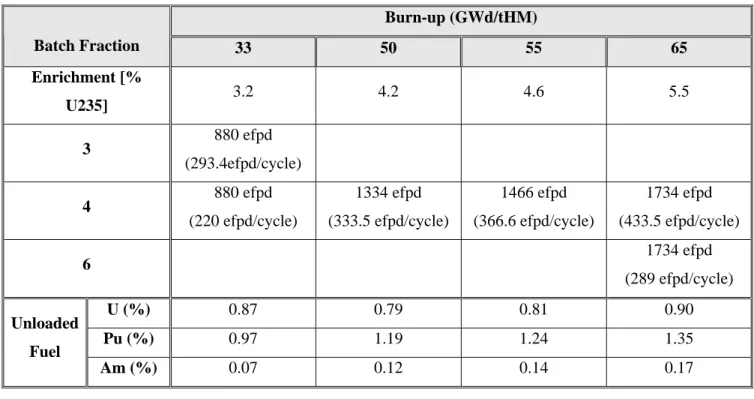
The first parameter analyzed is the average discharge burn-up. Four different discharge burn-ups have been considered for the comparison. For each burn-up, assuming that the energy demand in Fig. 1 is delivered by the same type of reactor (i.e. same mass of the core and same thermal power), the relative irradiation cycle lengths (taking into account also the fraction of fuel discharged from the core during a refueling outage) and the U235 enrichments have been evaluated and summarized in Table 2.
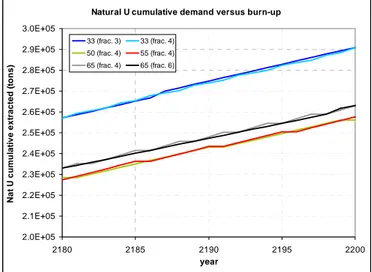
The influence of the discharge burn-up on the natural uranium demand has been summarized in Table 3. As expected, the natural uranium cumulative mass extracted (expressed in tons) doesn´t change significantly with the burn-up. Assuming 55 GWd/tHM as reference burn-up, the variation on U demand is between ~12% more for 33 GWd/tHM and ~2% more for the case with 65 GWd/tHM. This behavior, with the minimum U demand for a burn-up in the range of 50-55 GWd/tHM, is due to a balance between the enrichment required and the amount of energy produced by the differently enriched fuels. It is obvious that for higher enrichment a higher burn-up and a higher energy output can be achieved. Owing to the increased in-situ fission of Pu its contribution to the total energy production is higher than in the case of lower enrichment. However, at the same time an increasing fraction of neutrons is absorbed in fission products and MAs already introduced and, thus, is removed from the fission chain so that the unloaded fuel still contains a larger fraction of fissile material (U235, Pu) than remaining in the unloaded fuel for lower enrichment (see Table 2). This behavior could be seen in Fig. 3, where the cumulative natural U demand is represented for the period 2180-2200. From Fig. 3 it is clear that the impact of the batch fraction reloading scheme is completely negligible in the framework of this study (e.g. see the 33 GWd/tHM case with batch fraction equal to one-third and one-quarter of the core).
For what concerns the cumulative spent fuel, the maximum quantity is produced with a discharge burn-up of 33 GWd/tHM (44,500 tons) and the minimum quantity for a discharge burn-up of 65 GWd/tHM (22,200 tons), respectively, i.e. 68% more and 16% less with respect to the reference value (55GWd/tHM). Even in this case, the contribution of the batch fraction reloading scheme is negligible.
Equivalent trends have been obtained for the depleted uranium3 (minimum in the case of 50 GWd/tHM and equal to 228,800 tons in 2200) and for the Pu and MA cumulative amount in the interim storage. For what concerns the fabrication plant, different burn-ups with the same batch fraction reloading scheme (e.g. one-quarter of the core) requires the same annual capacity (the same core fraction is substituted every cycle) otherwise if the batch fraction is changed (e.g. from 4 to 3) the annual demand will vary accordingly (e.g. from 189 tons, one-quarter of the cores, to 253 tons, one-third of the cores).
Table 2. Parameters adopted for the burn-up study
Burn-up (GWd/tHM) Batch Fraction 33 50 55 65 Enrichment [% U235] 3.2 4.2 4.6 5.5 3 880 efpd (293.4efpd/cycle) 4 880 efpd (220 efpd/cycle) 1334 efpd (333.5 efpd/cycle) 1466 efpd (366.6 efpd/cycle) 1734 efpd (433.5 efpd/cycle) 6 1734 efpd (289 efpd/cycle) U (%) 0.87 0.79 0.81 0.90 Pu (%) 0.97 1.19 1.24 1.35 Unloaded Fuel Am (%) 0.07 0.12 0.14 0.17
Table 3. Cumulative natural uranium demand versus burn-up
Burn-up (GWd/tHM) 33 50 55 65 Batch Fraction 3 4 4 4 4 6 year Tons 2100 126,400 126,400 111,900 111,500 114,500 113,800 2200 290,900 290,900 256,100 257,700 263,100 263,100 % change 12.9 12.9 -0.6 Ref. 2.1 2.1
3
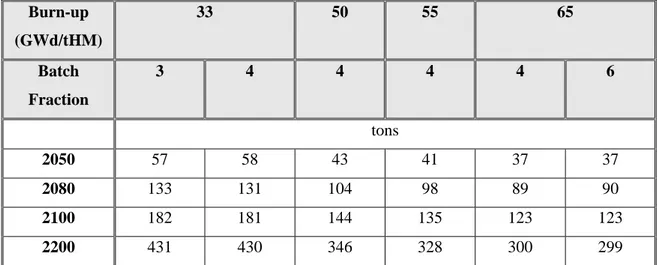
One of the more interesting and important parameter is the Pu availability in the cycle, because it affects the future development of fast systems. This parameter significantly varies with the burn-up. Table 4 shows the Pu availability in 2050 (early development of FRs), 2080 (after a 60 years reactor lifetime), 2100 and 2200 for all the burn-ups considered. As expected, increasing the discharge burn-up which means in-situ contribution of Pu to energy production inevitably reduces the availability of Pu for the future development of fast systems; in 2080, changing the burn-up from 33 to 65 GWd/tHM induces a reduction of the Pu available of ~30%. In addition, high burn-ups worsen the Pu quality. As indicated in Table 5 (Pu vector in 2050) the percentage of fissile material (Pu239, Pu241) decreases with increasing burn-ups. The values summarized in Table 5 have been derived assuming that the fuel is unloaded from the reactor and sent directly (without reprocessing or any other treatment) to the repository.
Another parameter changing with the burn-up is the Pu and MA content in the reactor unloaded fuel. In Table 6, the Pu and MA fractions over the initial Heavy Metal (HM) loaded in core (considering any cooling time after the discharge) have been summarized.
Other parameters related to the waste produced and to the long term impact on the repository are the SF radiotoxicity and the heat load. In Fig. 4 the SF specific ingestion radiotoxicity (on the left side) and the specific heat load (on the right side) evolutions up to 10 million years are shown for different burn-ups. Both figures lead to the same conclusion: for the time period between 300 and 1.0E05 years (where the Pu isotopes are the most important ones) a fuel with 33 GWd/tHM gives the higher contribution, whereas after 1.0E05 years (where MA and long-lived fission products are most important) it is the 65 GWd/tHM burn-up fuel that gives the higher contribution.
As for the Pu fraction on the SF, also the MA fraction is in accordance with the expected value. As an example, Fig. 5 and Table 7 show the MA cumulative amount for SF with 55 GWd/tHM.
Natural U cumulative demand versus burn-up
2.0E+05 2.1E+05 2.2E+05 2.3E+05 2.4E+05 2.5E+05 2.6E+05 2.7E+05 2.8E+05 2.9E+05 3.0E+05 2180 2185 2190 2195 2200 year N a t U cum u lat iv e e xt ract ed ( to n s) 33 (frac. 3) 33 (frac. 4) 50 (frac. 4) 55 (frac. 4) 65 (frac. 4) 65 (frac. 6)
Table 4. Pu availability during the scenario versus burn-up Burn-up (GWd/tHM) 33 50 55 65 Batch Fraction 3 4 4 4 4 6 tons 2050 57 58 43 41 37 37 2080 133 131 104 98 89 90 2100 182 181 144 135 123 123 2200 431 430 346 328 300 299
Table 5. Pu vector in 2050 versus burn-up
2050 Weight % Burn-up (GWd/tHM) Batch Fraction
Pu238 Pu239 Pu240 Pu241 Pu242
3 1.48 56.02 23.46 13.63 5.41 33 4 1.48 56.02 23.46 13.63 5.41 50 4 2.88 50.37 24.06 14.81 7.87 55 4 3.32 49.52 23.93 14.97 8.26 4 4.18 48.36 23.53 15.20 8.73 65 6 4.18 48.36 23.53 15.20 8.73
Table 6. Pu and MA content in the unloaded fuel vs. burn-up (no cooling time after discharge has been considered)
Burn-up (GWd/tHM) 33 33 50 55 65 65
Batch Fraction 3 4 4 4 4 6
Initial HM per batch (tons) 252.1 189.1 189.2 189.0 189.1 126.1
Pu/HM (%) 0.97 0.97 1.19 1.24 1.35 1.35
(a) (b)
Figure 4. SF Specific radiotoxicity (a) and heat load (b) evolutions [where 2200 is fixed as t0] versus time
Pu and MA in interim storage
0 50 100 150 200 250 300 350 2000 2050 2100 2150 2200 year C um ul at ive Pu and M A i n S tor age ( tons) Pu Am Cm
Am and Cm in interim storage
0 1 2 3 4 5 6 7 8 9 10 2000 2050 2100 2150 2200 year C um al ti ve v al ues ( tons) Am Cm
Figure 5. Pu and MA cumulative masses in interim storage (55 GWd/tHM) Table 7. Pu and MA cumulative masses in interim storage (55 GWd/tHM)
2050 2200
tons
Pu 41.2 327.9
Am 1.11 8.87
Cm 0.53 4.20
The parametric study: influence of the energy demand Radiotoxicity for different burn-ups
1.E+04 1.E+05 1.E+06 1.E+07 1.E+08 1.E+09
1.E+00 1.E+01 1.E+02 1.E+03 1.E+04 1.E+05 1.E+06 1.E+07
year
Sv/TWhe
33 (frac. 3) 55 (frac. 4) 65 (frac. 6)
Heat load for different burn-ups
1.E-01 1.E+00 1.E+01 1.E+02 1.E+03 1.E+04
1.E+00 1.E+01 1.E+02 1.E+03 1.E+04 1.E+05 1.E+06 1.E+07
year
W/TWhe
33 (frac. 3) 55 (frac. 4) 65 (frac. 6)
Considering the EPR-oriented system (main data listed in Table 1) as the basis for the Italian scenario, it is clear that the energy demand previously considered (70 TWhe per year) could not be covered by an integer number of reactors. In fact, 70 TWhe indeed correspond to ~6.3 EPR-oriented systems of 1.55 GWe each.
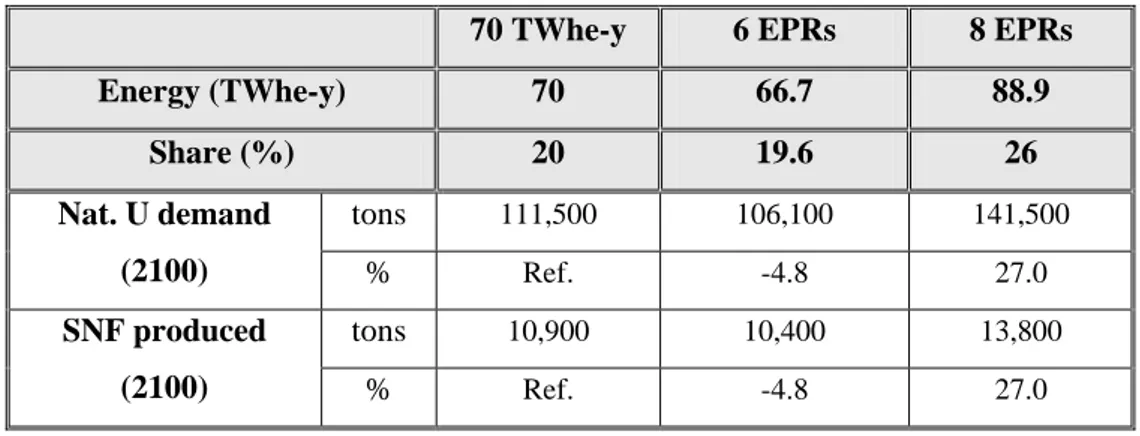
In order to make the Italian scenario more realistic, considering a finite number of reactors installed in the country, two cases have been considered: 1) the introduction in 10 years of 6 EPR-oriented systems, capable to cover the 19.6 % of the energy needs by the production of 66.65 TWhe per year; and 2) the introduction in 10 years of 8 EPR-oriented systems, able to cover the 26 % of the energy needs by the production of 88.87 TWhe per year.
The results show that considering the energy produced by 6 EPRs instead of the 70 TWhe doesn’t impact dramatically on the U demand and on the mass waste produced (see Table 8). The same small differences are founded for the facilities needs (e.g. annual fuel fabrication needs are respectively 180 tons instead of 189 tons). Therefore, in the following part of the analysis the energy produced by 6 EPR-oriented systems becomes the reference energy demand for the Italian scenario.
Another alternative, not studied in this paper, is to consider systems with a lower capacity (e.g. ~9 NPPs of 1.0 GWe each), that can allow more redundancy of supply and may better cope with the grid capacities.
Table 8. Influence of the energy demand: 20% vs. 19.6% vs. 26%
70 TWhe-y 6 EPRs 8 EPRs
Energy (TWhe-y) 70 66.7 88.9 Share (%) 20 19.6 26 tons 111,500 106,100 141,500 Nat. U demand (2100) % Ref. -4.8 27.0 tons 10,900 10,400 13,800 SNF produced (2100) % Ref. -4.8 27.0
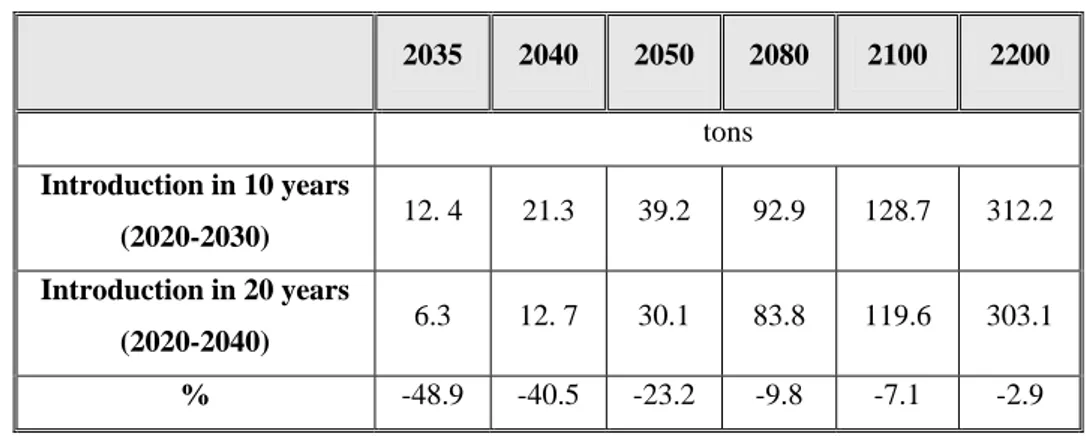
Concerning the energy demand, an additional parameter that has been analyzed is the reactors introduction rate. Starting from the 6 EPR-oriented systems (55 GWd/tHM ave. burn-up), two introduction rates have been compared: 1) introduction in 10 years (period 2020-2030); 2) introduction during20 years (period 2020-2040). An introduction in 20 years seems more realistic for a country like Italy where the nuclear energy production has been stopped more than 20 years ago.
The results show that the differences in terms of uranium demand and SF amounts are negligible (~2.8% between the two cases). Obviously, the introduction rate of the thermal systems can influence the Pu availability for the transition to fast reactors. Table 9 shows the Pu available in the two cases over the rest of the century. The difference is much higher for dates close to 2030-2040 (i.e. close to the thermal reactors introduction) and it could significantly adversely affect the early deployment of fast reactors, imposing some limitations on the FR introduction rate. Of course in 2100 at the end of the century this difference becomes rather small and, furthermore, even in 2035 plenty Pu will be available outside of Italy (probably at a reasonable prize).
An introduction rate of 20 years has been considered also to take into account the possible delays correlated to the site licensing and all the other official approvals needed to restart the energy production in Italy.
Table 9. Availability of Italian Pu versus reactor introduction rate
2035 2040 2050 2080 2100 2200 tons Introduction in 10 years (2020-2030) 12. 4 21.3 39.2 92.9 128.7 312.2 Introduction in 20 years (2020-2040) 6.3 12. 7 30.1 83.8 119.6 303.1 % -48.9 -40.5 -23.2 -9.8 -7.1 -2.9
The parametric study: influence of the reactor lifetime
Different ways to model the reactors exist within the COSI6 code[11] (e.g. by a theoretical single equivalent reactor or reactor by reactor and with or without the start-up core). Up to now, the more common way (theoretical single equivalent reactor without modeling of the start-up core) has been adopted as a reference case, because it provides, with a relatively simplified model, significant parameters with reasonable reliability for the scenario.
In order to evaluate the uncertainties related to this approach, the analysis of the Italian scenario (6 EPRs and constant energy demand up to 2200) has been repeated taking into account the contribution of the start-up core and the reactor lifetime.
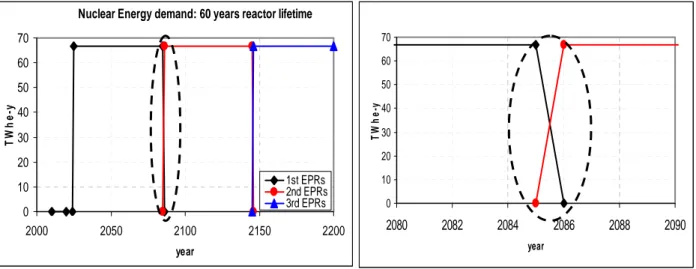
Even in this analysis, two cases have been considered: 1) 60 years reactor lifetime and 2) 40 years reactor lifetime. In both cases a theoretical single equivalent reactor (representative of the 6 EPRs) has been assumed as for the previous analyses but the reactor lifetime model has been added. Fig. 6 shows
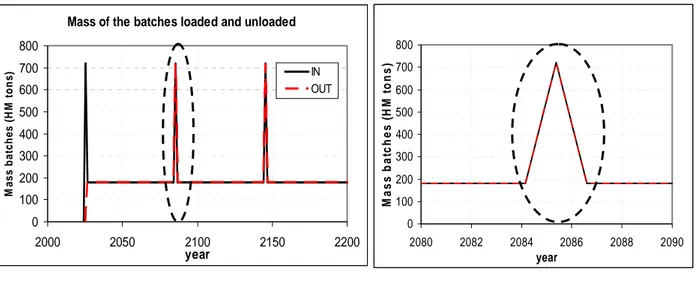
how the reactor lifetime of 60 years has been modeled in COSI6. In addition, for each reactor, the core start-up (full mass of core) and the core discharged (full mass of core) have been considered respectively at Beginning of Life (BOL) and End of Life (EOL). This model can be seen in Fig. 7, where the peaks of 720 tons (equivalent mass of 6 EPR full cores of 120 tons each) are represented (in Fig. 7b it is clear that the two peaks are overlapped).
The influence of the start-up cores and the reactor lifetime on main parameters of the scenario is not high (see Table 10). The influence on the U demand has been evaluated to be of the order of ~6% for a lifetime of 60 years and ~10% for 40 years. This small difference could be neglected for a scenario oriented to a single country (the error made is less important of the uncertainty on the energy demand) but it becomes important for world scenarios dealing with the U availability and very high growing energy demand (10% at world level corresponds to ~1.0E06 tons of natural U) [4].
The reactor lifetime affects also the Pu availability in the cycle (see Table 11). The difference in 2080 is roughly 6 tons more in the case of 40 years lifetime and 2 tons more in the case of 60 years lifetime. These values have relative low impact on the fast reactor development and as a first approximation can be neglected.
Additionally, a “reactor by reactor” model of the 6 EPRs has been set up. The results are fully comparable with the single big equivalent reactor model (e.g. assuming 60 years lifetime, the U demand in 2200 becoming 260,500 tons instead of 259,700 tons).
Figure 6. Nuclear energy demand taking into account the reactor lifetime (e.g. 60 years) Nuclear Energy demand: 60 years reactor lifetime
0 10 20 30 40 50 60 70 2000 2050 2100 2150 2200 year TW h e -y 1st EPRs 2nd EPRs 3rd EPRs 0 10 20 30 40 50 60 70 2080 2082 2084 2086 2088 2090 year TW he -y
(a) (b)
Figure 7. Mass of batches loaded and unloaded form the reactors (6 EPRs case). Table 10. Natural U and SF mass for different reactor lifetimes
6 EPRs 6 EPRs (60 years lifetime) 6 EPRs (40 years lifetime) tons 245,300 259,700 269,900 Nat. U demand (2200) % Ref. 5.9 10.0 tons 25,100 26,800 27,900 SNF produced (2200) % Ref. 6.8 11.1
Table 11. Pu availability during the scenario versus reactor lifetime
2050 2080 2100 2200 tons 6 EPRs 41.2 97.6 135.2 327.9 6 EPRs (60 years lifetime) 43.4 99.4 139.3 326.8 6 EPRs (40 years lifetime) 43.4 103.5 139.3 335.0 Mass of the batches loaded and unloaded
0 100 200 300 400 500 600 700 800 2000 2050 2100 2150 2200 year M ass b a tch es (H M t o n s) IN OUT 0 100 200 300 400 500 600 700 800 2080 2082 2084 2086 2088 2090 year M ass b at ch es ( H M t o n s)
The Italian scenario: transition to fast reactors
The transition to fast reactors has been analyzed too. This transition can be justified both from the point of view of resources utilization and from the point of view of waste minimization.
As first case, the replacement of all the EPR-oriented systems after 60 years of operation has been considered. According to Table 11, the total replacement is not possible. In fact the Pu available in 2080 in Italy according to the assumed scenario enables to replace only the 60% of the total energy demand (~ 40 TWhe per year) by means of fast systems. On the other hand an abrupt switching to a fairly different technology is not very probable and not very plausible.
In order to load a fast reactor with the characteristics of the ELSY-oriented system (see Table 1) about 9 tons of Pu are needed (value in agreement with the data provided by [3]) that means that the Pu available in 2080 (97.6 tons) will be sufficient to cover the start-up needs of only ~10 reactors (of 600 MWe each) instead of the 15 reactors needed (taking into account the load factor listed in Table 1) to cover the total energy demand (~66.65 TWhe per year).
In addition, when practical Pu needs are taken into account to maintain in operation the fast systems, the fraction that can be covered with the 97.6 tons decreases to ~ 40 % (corresponding to 26.82 TWhe per year).
The contribution to natural U saving coming from the introduction of fast reactors (for the possible fraction of 40 %) is represented in Fig. 8. Evidently, the contribution of fast systems to the U saving is not negligible: in 2100, adopting 40% of fast reactors, the U resources saved are of the order of ~9% and in 2200 they become ~27%.
As just indicated above, the favorable effect on the resources optimization due to the adoption of fast systems becomes more and more important in world scenario [4]. In fact, as also indicated in Fig. 2, the cycle including FRs is a “close cycle” and only reprocessing losses (indicated in Fig. 2 as 0.1% of Pu and MA) are sent to the repository.
As for the scenario based on thermal reactors, in this case too the assumptions made are of considerable importance for the results derived. One of the most important assumptions is related to the breeding characteristics of the fast systems considered. In the scenario presented, the ELSY-oriented reactor is able to produce fissile material only for sustaining its own cycle (breeding gain ~0) and the Pu available coming from the thermal system is the major limitation parameter for the introduction rate of the fast fleet. More detailed studies (e.g. adoption of breeder reactors, different introduction rates) concerning the transition to fast systems are under way.
Natural U cumulative demand 0.0E+00 5.0E+04 1.0E+05 1.5E+05 2.0E+05 2.5E+05 2000 2050 2100 2150 2200 year N a t U c u m u la tiv e e x tr a c te d (to n s ) once through EPRs + ELSY (40%)
Figure 8. Natural U demand: influence of fast reactors introduction
Conclusions
The parametric study concerning the introduction of nuclear reactors in the Italian electricity production mix has been performed starting from the government declaration to cover 20% of the electricity needs by nuclear energy.
The reference scenario, the “once through” scenario where only EPR-oriented systems are inserted, gives first indications on the natural U demand, waste produced and facilities needs to sustain the cycle up 2200. In terms of resources, the nuclear renaissance in Italy will demand, in 2100, only a tiny amount (~0.7%) of the total conventional resources world-wide estimated (~16 Mtons by the NEA-OECD Red Book [7,8]).
Other interesting parameters, like the total waste produced and the Pu availability in the cycle, have been investigated and underlined too. The reference scenario has provided some significant indication of the fuel cycle needs related to the nuclear renaissance in Italy (in terms of resources, waste, and facility needs), which could be a technical support to the decision processes. By the parametric study carried out, some possible alternatives to the reference scenario have been considered in order to take into account the variation of presently unknown or uncertain parameters like a possible delay-time for the site licensing (e.g. considering different LWRs introduction rate).
A preliminary study for the transition towards the implementation fast reactors in NPPs pool has been performed. The results obtained in terms of substitution are in agreement with the results obtained by the “once through” scenario in terms of Pu availability in the cycle. Additional studies are ongoing as a part
of a PhD work performed in collaboration between Pisa University (Italy) and KIT (Germany), in particular in terms of waste minimization and fuel cycle impacts.
Acknowledgments
The authors would like to thank Dr. Edgar Kiefhaber, KIT/IKET, who, with his experience and his patience, contributed to the progress of the reported investigations.
References
[1] IEA/OECD, 2009. “World Energy Outlook, 2009”, ISBN 978-92-64-06130-9.
[2] International Nuclear Safety center: http://www.insc.anl.gov/.
[3] NEA/OECD, 2009. “Nuclear Fuel Cycle Transition Scenario Studies”, NEA No. 6194, ISBN: 978-92-64-99068-5.
[4] Schwenk-Ferrero A., et al., 2010. “World Transitions towards Sustainable Nuclear Fuel Cycle”, Proc. Int. Conf. IEMPT11, San Francisco (USA), November 1-5.
[5] Coquelet C., et al. “Comparison of Different Options for Transmutation Scenarios Studied in the
Frame of the French Law for Waste Management”, Proc. Int. Conf. GLOBAL2009, Paris (France),
September 6-11.
[6] NEA/OECD, 2009. “Nuclear Fuel Cycle Synergies and regional Scenarios for Europe”, NEA No. 6857, ISBN: 978-92-64-99086-9.
[7] NEA/OECD– IAEA, 2009. “Uranium 2009: Resources, Production and Demand”, NEA No. 6891, ISBN: 978-92-64-04790-7.
[8] Pool T.C., 1994. “Uranium Resource for Long-Term, Large-Scale Nuclear Power Requirements”, Oxford University Press 0961-1444.
[9] Alemberti A., 2009. “ELSY, The European Lead Fast Reactor”, Proc. Int. Conf. FR09, Kyoto (Japan), December 7-11.
[10] IPFM, 2008. “Spent Nuclear Fuel Reprocessing in France”.
[11] Boucher L., et al., 2006. “COSI: the complete renewal of the simulation software for the fuel cycle
[12] EC, Eurostat, 2009. “Electricity Statistics – Provisional data for 2009”.
[13] Boucher L., et al., 2008. “Scenarios for the Deployment of the Sodium Cooled Fast Reactors in
France”, Proc. Int. Conf. IEMPT10, Mito (Japan), October 6-10.
[14] Rimpault G., et al., 2002. “The ERANOS code and data system for fast reactor neutronic analyses”, Proc. Int. Conf. PHYSOR 2002, Seoul (Korea), October 7-10.
[15] Vidal, J. M., 2006. “Manuel d’Utilisation du Logiciel APOGENE_BBL (version 3.6)”, Tech. Note CEA, SPRC/LECy/06/349.
[16] WNA “Australia’s Uranium”, World Nuclear Association data, http://www.world-nuclear.org/info/inf48.html.
![Figure 4. SF Specific radiotoxicity (a) and heat load (b) evolutions [where 2200 is fixed as t0] versus time](https://thumb-eu.123doks.com/thumbv2/123dokorg/5605864.67936/16.892.120.802.108.416/figure-specific-radiotoxicity-heat-load-evolutions-fixed-versus.webp)