R E S E A R C H A R T I C L E
Open Access
The carotenoid biosynthetic and catabolic
genes in wheat and their association with
yellow pigments
Pasqualina Colasuonno
2, Maria Luisa Lozito
1, Ilaria Marcotuli
2, Domenica Nigro
1, Angelica Giancaspro
1,
Giacomo Mangini
1, Pasquale De Vita
3, Anna Maria Mastrangelo
3, Nicola Pecchioni
3, Kelly Houston
4,
Rosanna Simeone
1, Agata Gadaleta
2and Antonio Blanco
1*Abstract
Background: In plants carotenoids play an important role in the photosynthetic process and photo-oxidative protection, and are the substrate for the synthesis of abscisic acid and strigolactones. In addition to their protective role as antioxidants and precursors of vitamin A, in wheat carotenoids are important as they influence the colour (whiteness vs. yellowness) of the grain. Understanding the genetic basis of grain yellow pigments, and identifying associated markers provide the basis for improving wheat quality by molecular breeding.
Results: Twenty-four candidate genes involved in the biosynthesis and catabolism of carotenoid compounds have been identified in wheat by comparative genomics. Single nucleotide polymorphisms (SNPs) found in the coding sequences of 19 candidate genes allowed their chromosomal location and accurate map position on two reference consensus maps to be determined. The genome-wide association study based on genotyping a tetraploid wheat collection with 81,587 gene-associated SNPs validated quantitative trait loci (QTLs) previously detected in biparental populations and discovered new QTLs for grain colour-related traits. Ten carotenoid genes mapped in chromosome regions underlying pigment content QTLs indicating possible functional relationships between candidate genes and the trait.
Conclusions: The availability of linked, candidate gene-based markers can facilitate breeding wheat cultivars with desirable levels of carotenoids. Identifying QTLs linked to carotenoid pigmentation can contribute to understanding genes underlying carotenoid accumulation in the wheat kernels. Together these outputs can be combined to exploit the genetic variability of colour-related traits for the nutritional and commercial improvement of wheat products.
Keywords: Wheat, Carotenoids genes, SNP, Association mapping, Yellow pigments, Flour colour
Background
Carotenoids are organic pigments commonly present in plants, photosynthetic algae and some species of fungi and bacteria. They are normally associated with thylakoid membranes of chloroplasts and often provide the yellow, orange and red pigmentation to many flowers, fruits and roots [1]. In plants, carotenoids play an import-ant role in photosynthesis, photo-oxidative protection
[2], and represent the substrate for the synthesis of apocarotenoid hormones, such as abscisic acid and strigolactones [3, 4]. Carotenoid actions and their relation to human health and disease have been widely reviewed [5]. Carotenoids and some of their metabolites are suggested to play a protective role in a number of reactive oxygen species (ROS)-mediated conditions, such as, i.e., cardiovascular diseases, several types of cancer or neuro-logical, as well as photosensitive or eye-related disorders.
Carotenoids are typically divided into two classes: carotenes, which are tetraterpenoid hydrocarbons, and xanthophylls that contain one or more oxygen groups
* Correspondence:[email protected]
1Department of Soil, Plant and Food Sciences, University of Bari‘Aldo Moro’,
Via G. Amendola 165/A, Bari, Italy
Full list of author information is available at the end of the article
© The Author(s). 2017 Open Access This article is distributed under the terms of the Creative Commons Attribution 4.0 International License (http://creativecommons.org/licenses/by/4.0/), which permits unrestricted use, distribution, and reproduction in any medium, provided you give appropriate credit to the original author(s) and the source, provide a link to the Creative Commons license, and indicate if changes were made. The Creative Commons Public Domain Dedication waiver (http://creativecommons.org/publicdomain/zero/1.0/) applies to the data made available in this article, unless otherwise stated.
[6]. The carotenoid biosynthesis has been almost com-pletely elucidated due to work in Arabidopsis thaliana, rice, maize and in some ornamental plants [6, 7]. Briefly, the first stage of the biosynthetic process, medi-ated by phytoene synthase (PSY), involves the conden-sation of two molecules of geranylgeranyl diphosphate to produce phytoene, which normally does not accu-mulate in tissues (Fig. 1). In higher plants, the phytoene undergoes a series of four desaturation reactions, mediated by phytoene desaturase (PDS), zeta-carotene isomerase (Z-ISO), zeta-carotene desaturase (ZDS) and carotenoid isom-erase (CRTISO) that lead to the production of lycopene. Double lycopene cyclization can produce α-carotene (branch β-ε) or β-carotene (branch β-β). Subsequent modifications transform α-carotene to zeinoxanthin and lutein, and the β-carotene to β-cryptoxanthin, zeaxanthin, antheraxanthin, violaxanthin and neoxanthin. The oxidative cleavage of violaxanthin and neoxanthin form xanthoxin, which is converted to the phytohormone
abscisic acid via ABA-aldehide [3]. Strigolactones derive fromβ-carotenoids via a pathway involving the carotenoid cleavage dioxygenases CCD7, CCD8 and CYP711A1 [4].
Wheat is one of the most important crops worldwide and is the leading source of plant protein in human food, having a higher protein content than other major cereals, such as maize or rice [8]. In addition to their protective role as antioxidant and as precursors of vitamin A, carotenoids are commercially important as they confer whiteness vs. yellowness degree to the end products of wheat. Consumers usually prefer white bread made from common wheat (Triticum aestivum L. subsp. aestivum), while yellow semolina and pasta made from durum wheat (Triticum turgidum L. subsp. durum) are preferred by the market. Flour and semolina colour is mainly the result of carotenoid accumulation in the grain [9], but the final colour of end-finished products is also associated to losses during grain storage and to the carotenoid oxidative degradation by enzymes, such
as polyphenol oxidase, lipoxygenase and peroxidase, during processing [10, 11].
Flour and semolina colour in wheat is a quantitative trait controlled by several genes with additive effect, and influenced by environmental factors [12]. Mapping studies for yellow pigment content (YPC) and yellow index (YI), in several biparental populations have identified QTLs on all wheat chromosomes (reviewed in Additional file 1: Table S1). The major QTL on the long arm of chromo-some 7A, accounting for up to 60% of the phenotypic variation, was detected through all studies and attributed to allelic variations of the phytoene synthase (Psy-A1) gene [13–15]. Although there is an increased understanding of the mechanisms regulating carotenoid content and composition, only some carotenoid biosynthetic genes have been identified and cloned in wheat, such as phy-toene synthase (PSY) [13, 16, 17], lycopene ε-cyclase (LYCE) [18, 19], carotene desaturase (PDS) and zeta-carotene desaturase (ZDS) [20], carotenoid β–hydroxy-lase (BCH) [21], lycopeneβ-cyclase (LYCB) [22].
As an alternative to classical linkage-based QTL map-ping, the association mapping approach has received increased attention for detecting QTLs controlling com-plex traits [23]. One of the potential disadvantages of genome-wide association studies (GWAS) is the appear-ance of spurious marker-trait associations (false-positive associations) resulting from population structure and multiple testing of thousands of markers [24, 25]. As-sociation mapping can be simplified for some traits by the “candidate gene approach”, that is testing SNPs within a candidate gene for a significant association with the trait [26].
The objectives of the current study were to: a) iden-tify candidate carotenoid metabolic/catabolic genes in wheat by exploiting genomic resources and SNPs detected within the coding sequences of candidate genes; b) provide the precise map position of candidate genes on high-density SNP-based consensus maps; c) iden-tify the genetic loci controlling yellow pigments by GWAS and candidate gene approaches using a tetraploid wheat collection coupled with the 90 K iSelect SNP genotyping array. The identification of genetic loci controlling yellow pigment accumulation/degradation will provide infor-mation on the genetic resources available to breeders to improve commercial and nutritional properties of wheat products, as well as the opportunity to develop functionally associated markers to be used in marker-assisted selection (MAS).
Results
Identification of carotenoid biosynthetic and catabolic genes of wheat
The A. thaliana isoprenoid pathways and respective genes from AtIPD (http://www.atipd.ethz.ch/) were used to
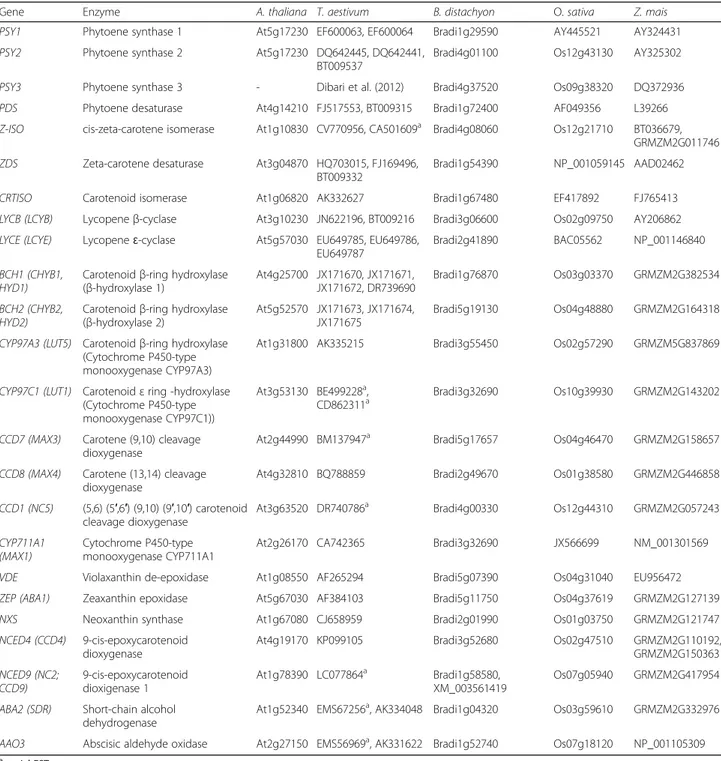
identify and download the Arabidopsis gene sequences from the TAIR database (http://arabidopsis.org/). In order to isolate the wheat carotenoid sequences, the 24 cDNAs corresponding to all identified genes from A. thaliana database were used as query to extract sequences of T. aestivum and of the monocots Brachypodium distach-yon, O. sativa and Zea mays (Table 1). The in silico analysis highlighted a lack of uniformity for acronyms and gene names/classifications used in literature be-tween different plant species (e.g. the carotenoid β-ring hydroxylases is named BCH in Arabidopsis, CRTR-B or HYDin maize, and BCH or HYD in rice, Brachypodium and wheat). For simplicity, we used the gene nomencla-ture of A. thaliana, whose isoprenoid genes have been well characterized and reported in public metabolic pathway databases.
The bootstrapped molecular phylogenetic tree (Fig. 2), based on 119 carotenoid cDNAs which correspond to orthologous sequences of the above-mentioned five plant species showed clear clustering of the orthologs by gene family. Additionally this analysis showed that these caroten-oid genes are generally highly conserved between species, with the minimum sequence similarity being between Arabidopsis and Brachypodium for NXS (70%), and the maximum similarity observed between Brachypodium and rice for CYP97C1 (89%). Sequence similarity helped to assign putative function to the identified wheat EST se-quences. Table 1 lists the genebank entries of the caroten-oid pathway genes of Arabidopsis, Brachypodium, rice, maize and wheat. The PSY gene family is tightly clustered based on the three paralogous genes, annotated as PSY1, PSY2 and PSY3, while in eudicots only the presence of PSY1and PSY2 homologs have been reported [17, 27]. The BCH characterization present in literature [21] was con-firmed by the phylogenetic tree: Ta_BCH1 clustered with Zm_BCH2, Os_BCH2 and Bd_BCH2, while Ta_BCH2 gene grouped with Os_BCH1.
The in silico gene expression analysis, using data from the publicly available Wheat 61 k GeneChip, revealed variation in transcription patterns for these carotenoid genes in a wide range of tissues and developmental stages in wheat (Additional file 2: Figure S1). Exploiting the PLEXdb database, the expression data was investi-gated to predict the genes’ impact on the final caroten-oid content. In general, all carotencaroten-oid genes were found to be expressed to some degree during all developmental stages, with minimum expression levels of 3.53 and 4.51 RMA normalization for Z-ISO and CCD7, respectively, and maximum levels of 12.55 RMA normalization for ZDS. In particular, PSY1, PSY2, PDS, ZDS, LYCB, CYP97C1, CCD1, VDE, ZEP and NCED4 showed elevated expression levels (values higher than the mean values ± 2 SD) in seedling leaf (phase 6) while LYCE, BCH1 and BCH2genes exhibited high level of transcripts in anthers
before anthesis (phase 10). AAO3 showed higher levels of expression in reproductive tissues including immature pistil before anthesis. ABA2 showed the highest expression during the caryopsis-embryo-endosperm growth (phase 11 to 13). Low expression values (mean values ± 2 SD) were detected for LYCE in roots, CYP97C1 in anthers before anthesis, CCD8 in 22 DAP endosperm stage and NXS in floral bracts before anthesis.
After the phylogenetic analysis, a BLASTn analysis (based on percentage identity) was performed between the 24 wheat carotenoid genes and the entire wheat SNP dataset [28], which provides a marker coverage of about 85% of the genome. A total of 75 SNP markers corre-sponding to the 19 carotenoid gene sequences were identified, with several genes containing multiple SNPs (Table 2). No SNP markers were identified within the
Z-Table 1 Genebank entries of the carotenoid metabolic/catabolic pathways genes of Arabidopsis thaliana, Triticum aestivum, Brachypodium distachyon, Oryza sativa and Zea mays
Gene Enzyme A. thaliana T. aestivum B. distachyon O. sativa Z. mais
PSY1 Phytoene synthase 1 At5g17230 EF600063, EF600064 Bradi1g29590 AY445521 AY324431
PSY2 Phytoene synthase 2 At5g17230 DQ642445, DQ642441,
BT009537
Bradi4g01100 Os12g43130 AY325302
PSY3 Phytoene synthase 3 - Dibari et al. (2012) Bradi4g37520 Os09g38320 DQ372936
PDS Phytoene desaturase At4g14210 FJ517553, BT009315 Bradi1g72400 AF049356 L39266
Z-ISO cis-zeta-carotene isomerase At1g10830 CV770956, CA501609a Bradi4g08060 Os12g21710 BT036679,
GRMZM2G011746
ZDS Zeta-carotene desaturase At3g04870 HQ703015, FJ169496,
BT009332
Bradi1g54390 NP_001059145 AAD02462
CRTISO Carotenoid isomerase At1g06820 AK332627 Bradi1g67480 EF417892 FJ765413
LYCB (LCYB) Lycopeneβ-cyclase At3g10230 JN622196, BT009216 Bradi3g06600 Os02g09750 AY206862
LYCE (LCYE) Lycopeneɛ-cyclase At5g57030 EU649785, EU649786,
EU649787
Bradi2g41890 BAC05562 NP_001146840
BCH1 (CHYB1, HYD1)
Carotenoidβ-ring hydroxylase (β-hydroxylase 1) At4g25700 JX171670, JX171671, JX171672, DR739690 Bradi1g76870 Os03g03370 GRMZM2G382534 BCH2 (CHYB2, HYD2)
Carotenoidβ-ring hydroxylase (β-hydroxylase 2)
At5g52570 JX171673, JX171674, JX171675
Bradi5g19130 Os04g48880 GRMZM2G164318
CYP97A3 (LUT5) Carotenoidβ-ring hydroxylase (Cytochrome P450-type monooxygenase CYP97A3)
At1g31800 AK335215 Bradi3g55450 Os02g57290 GRMZM5G837869
CYP97C1 (LUT1) Carotenoidε ring -hydroxylase (Cytochrome P450-type monooxygenase CYP97C1))
At3g53130 BE499228a,
CD862311a
Bradi3g32690 Os10g39930 GRMZM2G143202
CCD7 (MAX3) Carotene (9,10) cleavage dioxygenase
At2g44990 BM137947a Bradi5g17657 Os04g46470 GRMZM2G158657
CCD8 (MAX4) Carotene (13,14) cleavage dioxygenase
At4g32810 BQ788859 Bradi2g49670 Os01g38580 GRMZM2G446858
CCD1 (NC5) (5,6) (5′,6′) (9,10) (9′,10′) carotenoid cleavage dioxygenase
At3g63520 DR740786a Bradi4g00330 Os12g44310 GRMZM2G057243
CYP711A1 (MAX1)
Cytochrome P450-type monooxygenase CYP711A1
At2g26170 CA742365 Bradi3g32690 JX566699 NM_001301569
VDE Violaxanthin de-epoxidase At1g08550 AF265294 Bradi5g07390 Os04g31040 EU956472
ZEP (ABA1) Zeaxanthin epoxidase At5g67030 AF384103 Bradi5g11750 Os04g37619 GRMZM2G127139
NXS Neoxanthin synthase At1g67080 CJ658959 Bradi2g01990 Os01g03750 GRMZM2G121747
NCED4 (CCD4) 9-cis-epoxycarotenoid dioxygenase
At4g19170 KP099105 Bradi3g52680 Os02g47510 GRMZM2G110192,
GRMZM2G150363 NCED9 (NC2; CCD9) 9-cis-epoxycarotenoid dioxigenase 1 At1g78390 LC077864a Bradi1g58580, XM_003561419 Os07g05940 GRMZM2G417954
ABA2 (SDR) Short-chain alcohol dehydrogenase
At1g52340 EMS67256a, AK334048 Bradi1g04320 Os03g59610 GRMZM2G332976
AAO3 Abscisic aldehyde oxidase At2g27150 EMS56969a, AK331622 Bradi1g52740 Os07g18120 NP_001105309
a
ISO, CCD7, CCD8, CYP711A1 and NXS genes. Twenty-two and 32 SNP markers were located on the consensus durum [29] and bread wheat maps [28], respectively. This enabled us to assign genes to chromosomes groups; the CRTISO genes were mapped on chromosome group 1; BCH1 and VDE on homoeologous chromosome arms 2 L; LCYE on group 3; PDS on group 4; PSY2, PSY3,
CCD1 and ABA2 on group 5; LUT5 on group 6; PSY1 and AAO3 on chromosome arms 7 L.
Phenotypic variation for yellow pigment content and yellow index
The tetraploid wheat collection, including 233 accessions of modern and old durum cultivars, durum landraces,
Fig. 2 Phylogenetic tree of the carotenoid metabolic/catabolic genes from Arabidopsis thaliana, Brachypodium disticum, Zea mays, Oryza sativa and Triticum aestivum
Table 2 Chromosome localization of the identified wheat carotenoid bi osynthetic/catabolic genes on the durum [29] and bread wheat [28] consensus maps and allele frequency in the tetraploid wheat collection of 233 genotypes Gene Enzyme SNP name SN P id Wheat map positio n All ele frequ ency Chrom . D urum map Bread map Who le collection Duru m sub-po pulation PSY1 Phytoe ne syn thase 1 BS00 02213 7_51 IW B6923 A/G 7AL 20 3.2 -0. 26 –0. 74 0.12 –0.88 BobW hite_c4 483_6 03 IW B3406 A/G 7AL -226.1 mon omorp hic mon omorp hic CAP 7_c12 398_1 10 IW B1378 1 T/ G 7BL 20 0.1 164.2 fai led faile d BS00 01074 7_51 IW B6281 T/ G 7BL 20 0.1 164.2 fai led faile d BS00 08463 1_51 IW B1137 6 T/ G 7DL -Kuk ri_rep_c1 05287 _311 IW B4908 0 aa T/ C 7DL 208.1 PSY2 Phytoe ne syn thase 2 BobW hite_c3 39_24 7 IW B2660 G/ T 5AS -15.6 0. 83 –0. 17 0.84 –0.16 RAC 875_c 51670 _117 IW B5876 6 C/T 5AS -15.6 0. 77 –0. 23 0.87 –0.13 Excal ibur_c2922 _3416 IW B2480 5 a C/T 5AS 46 .6 15.6 mon omorp hic mon omorp hic Excal ibur_c3027 3_138 IW B2494 7 C/T 5BS -19.7 0. 29 –0. 71 0.13 –0.87 Kuk ri_c23 694_3 70 IW B4285 0 A/G 5BS -19.7 0. 75 –0. 25 0.87 –0.13 GEN E-32 07_61 0 IW B3328 9 C/T 5BS -19.7 0. 72 –0. 28 0.87 –0.13 GEN E-32 07_13 4 IW B3328 7 A/G 5BS -19.7 fai led faile d Excal ibur_c3948 _1315 IW B2605 1 a C/T 5BS 15 .8 19.7 0. 43 –0. 57 0.48 –0.52 GEN E-32 07_17 4 IW B3328 8 A/G 5DS -PSY3 Phytoe ne syn thase 3 CAP 7_c78 40_31 6 IW B1426 4 A/G 5 L -mon omorp hic mon omorp hic BS00 07785 5_51 IW B1096 5 a C/T 5AL 12 6.8 82.0 0. 74 –0. 26 0.88 –0.12 PDS Phytoe ne de saturase BobW hite_c3 609_3 61 IW B2819 A/G 4AS -0. 01-0.9 9 mon omorp hic Td urum_contig1 1560_ 383 IW B6715 1 C/T 4BL -mon omorp hic mon omorp hic IAC X725 IW B3618 8 A/G 4BL -mon omorp hic mon omorp hic Kuk ri_c20 125_2 81 IW B4226 4 a C/T 4BL 83 .1 75.6 0. 81 –0. 19 0.90 –0.10 Ra_ c72128_ 236 IW B5256 8 A/G 4DL -Z -ISO cis-ze ta-carotene isom erase -ZDS Zeta-c arotene de saturase CAP 11_c7 54_33 5 IW B1304 6 A/G 2AS -mon omorp hic mon omorp hic JD_ c5278 3_234 IW B3760 4 C/T 2BS -mon omorp hic mon omorp hic Kuk ri_c23 475_1 485 IW B4281 7 A/G 2BS -mon omorp hic mon omorp hic RFL_C ontig 3540_ 283 IW B6438 6 A/C 2BS -mon omorp hic mon omorp hic Ra_ c5594_5 69 IW B5226 5 A/G 2DS -D_c ontig2 2022_ 580 IW B1607 6 T/ G 2DS -CRTISO (CISO) Caroteno id isome rase IAA V5931 IW B3511 5 A/G 1AS -66.9 0. 98 –0. 02 mon omorp hic
Table 2 Chromosome localization of the identified wheat carotenoid bi osynthetic/catabolic genes on the durum [ 29 ] and bread wheat [ 28 ] consensus maps and allele frequency in the tetraploid wheat collection of 233 genotypes (Co ntinued) IAA V2888 IW B3463 1 a A/G 1AS 43 .3 66.3 0. 12 –0. 88 mon omorp hic CAP 11_c2 92_24 9 IW B1281 4 T/ C 1BS -mon omorp hic mon omorp hic LY CB (L CYB ) Lycopene beta-cyclas e CAP 7_rep_c 12997 _415 IW B1439 5 A/G 6S -mon omorp hic mon omorp hic Excal ibur_c9273 _1271 IW B2940 7 a T/ C 6DS -LY CE (L CYE) Lycopene epsilo n-cyclas e wsnp _Ex_ c4813 6_531 40385 IW A400 9 T/ C 3AL -85.4 mon omorp hic mon omorp hic RAC 875_c 2375_ 132 IW B5555 8 A/G 3AL -mon omorp hic IAA V4785 IW B3492 3 a G/ T 3AL 65 .9 85.4 0. 29 –0. 71 0.35 –0.65 Excal ibur_c3455 4_312 IW B2547 3 a C/T 3BL 67 .2 64.4 0. 31 –0. 69 0.16 –0.84 D_c ontig3 7716_ 635 IW B1673 9 A/G 3DL -Kuk ri_c19 6_184 IW B4216 0 AC 3DL -BCH1 (CH YB1, HYD1 ) Caroteno id β -ring hydro xylase (β -hydro xylase 1) BobW hite_c3 4273_ 67 IW B2683 A/nu lli 2AL 13 3.3 -0. 81 –0. 19 mon omorp hic Td urum_contig5 114_3 19 IW B7215 4 a C/T 2AL -112.1 0. 51 –0. 49 0.30 –0.70 RFL_C ontig 329_9 57 IW B6429 0 T/ nulli 2BL -0. 90 –0. 10 mon omorp hic RFL_C ontig 329_8 77 IW B6428 9 A/G 2BL -mon omorp hic mon omorp hic BCH2 (CH YB2, HYD2 ) Caroteno id β -ring hydro xylase (β -hydro xylase 2) Td urum_contig1 2547_ 293 IW B6764 3 T/ C 4BL, 4DL, 5AL -mon omorp hic mon omorp hic CYP97 A3 (L UT5) Caroteno id β -ring hydro xylase (Cytoc hrome P450-type monooxygenase CYP97A3) wsnp _JD_c 7795_ 88681 22 IW A618 2 C/T 6AL -138.3 0. 04 –0. 96 0.01 –0.99 wsnp _BF29 1974A_ Ta_2 _1 IW A441 a C/T 6AL 12 2.7 138.0 0. 58 –0. 42 0.55 –0.45 Td urum_contig5 69_26 3 IW B7254 0 A/G 6BL 14 5.3 108.9 0. 77 –0. 23 0.75 –0.25 CAP 11_c8 16_47 0 IW B1306 2 a A/G 6BL 14 5.3 -0. 54 –0. 46 0.33 –0.67 GEN E-39 88_63 1 IW B3371 1 A/G 6BL 14 5.8 -0. 04 –0. 96 mon omorp hic BobW hite_c1 2032_ 371 IW B293 T/ C 6DL -133.54 CYP97 C1 (L UT1) Ca rot enoid ε rin g -h ydr o xy la se (Cytochrome P 450-type monooxygenase C Y P 97C1) Kuk ri_rep_c1 11979 _282 IW B4953 2 T/ C 1AL -Excal ibur_c2940 1_543 IW B2483 2 A/G 1BL -C CD7 (MAX3) Carotene (9,10) cleav age dioxyg enase --C CD8 (MAX4) (13,1 4) cleav age diox ygenas e -C CD1 (NC5) (5,6) (5 ′,6 ′) (9,10) (9 ′,10 ′) carote noid cleav age dioxyg enase wsnp _Ex_ c6209 _1083 8456 IW B4445 A/G 5AS -CAP 11_c2 357_9 7 IW B1277 4 T/ C 5BS -TA00 4832-0 873 IW B6588 9 A/G 5BS 0. 7 8.7 BobW hite_rep _c537 18_10 3 IW B5053 T/ C 5DS
-Table 2 Chromosome localization of the identified wheat carotenoid bi osynthetic/catabolic genes on the durum [ 29 ] and bread wheat [ 28 ] consensus maps and allele frequency in the tetraploid wheat collection of 233 genotypes (Co ntinued) CYP71 1A1 (MAX1 ) Cytoch rome P450-t ype monoo xygen ase CYP711 A1 -ZEP (ABA1) Zeax anthin ep oxidase RAC 875_c 856_9 2 IW B6081 0 A/C 2DL -CAP 7_c43 49_24 3 IW B1410 3 A/G 2DL -D_G BF1XID0 1ASYXD_ 209 IW B1834 6 A/G 2DL -VDE Violaxant hin de-epo xidase wsnp _Ex_ c1172 8_188 62431 IW A153 3 A/G 2AL -0. 87 –0. 13 mon omorp hic wsnp _Ex_ rep_c6 9465_ 68405 569 IW A561 0 C/T 2BL -99.8 0. 08 –0. 92 0.02 –0.98 wsnp _Ex_ c3986 2_470 46812 IW A369 6 C/T 2BL -99.6 0. 01 –0. 99 mon omorp hic wsnp _Ex_ c9805 _1618 3499 IW A496 5 a C/T 2BL 94 .2 99.8 0. 07 –0. 93 0.02 –0.98 Kuk ri_c52 435_1 63 IW B4625 4 A/G 2BL -mon omorp hic mon omorp hic NXS Neoxant hin synthas e -NCED 4 (C CD 4) 9-cis-epoxyc aroteno id dioxige nase 4 wsnp _RFL_Co ntig442 4_519 3532 IW A859 2 a C/T 6AL 62 .8 82.4 0. 24 –0. 76 0.07 –0.93 CAP 11_c4 654_1 71 IW B1289 3 A/G 6DL -NCED 9 (NC2; C CD9) 9-cis-epoxyc aroteno id dioxige nase CAP 11_c5 699_1 07 IW B1296 6 T/ C 6DL -CAP 7_c63 72_32 9 IW B1419 4 A/G 6DL -ABA2 (SDR) Short-c hain alcoho l dehyd rogen ase Td urum_contig1 3608_ 72 IW B6802 9 T/ G 5AL -fai led faile d RFL_C ontig 4520_ 749 IW B6470 7 A/G 5BL 15 7.5 137.1 0. 70 –0. 30 0.54 –0.46 Td urum_contig1 3608_ 195 IW B6802 7 T/ C 5DL -AAO3 Abscisic aldehy de oxid ase RAC 875_c 64451 _465 IW B5987 5 C/T 7AL 18 0.3 -0 .7 6– 0. 24 0.70 –0.30 Kuk ri_c57 89_10 29 IW B4669 9 T/ C 7AL 18 0.3 -fai led faile d Ku_ c5789 _1180 IW B3966 0 G/ T 7BL 15 5.7 120.8 0. 37 –0. 63 0.24 –0.76 Excal ibur_rep_c1 12889 _341 IW B3060 3 A/G 7DL -184.18 aSNP comigrating or mapping in the same contig of the gene sequence
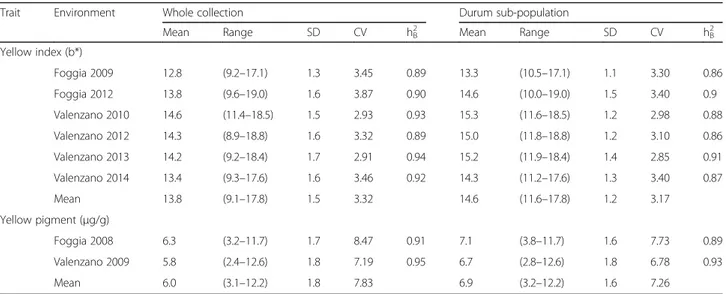
domesticated and wild tetraploid wheat accessions, was evaluated for yellow index (YI) in six environments, and for yellow pigment content (YPC) in two environments. The analysis of variance showed highly significant differ-ences among genotypes in each environment; environ-ments, genotypes and environment x genotype interaction were significant in the combined analysis across environ-ments (not shown). Mean, range, and heritability esti-mates (hB2) for YPC and YI of the whole collection, and of
the durum wheat sub-population in each trial are reported in Table 3. A normal frequency distribution (Additional file 3: Figure S2) was observed for both traits. Mean values of YI of the whole collection varied from 12.8 (F09) to 14.6 (V10), while mean values of the durum sub-population ranged from 13.3 (F09) to 15.3 (V10). The phenotypic variation in the whole collection (from 9.1 to 17.8) and in the durum sub-population (11.6–17.8) sug-gested that alleles for low and high YI were present in the T. turgidum subset of the collection. YPC in the whole collection ranged between 3.2 and 11.7μg/g at F08, and between 2.4 and 12.6μg/g at V09, with average values of 6.3 and 5.8μg/g, respectively. The durum sub-population showed higher mean values than the whole collection. This would indicate that in recent decades durum wheat breeders have paid special attention to the selection of new cultivars with grain colour that will be of higher (commercial) value [30].
Broad-sense heritability in the whole collection ranged from 0.89 to 0.94 for YI, and from 0.91 to 0.95 for YPC. The high heritability values and the correlation coeffi-cients among environments for YI and YPC (Tables 4 and Additional file 4: Table S2) indicated that both traits were stable, and that the phenotypic expression was mainly due to genotypic effects. Highly significant
(0.001P) and positive correlation (r = 0.89) was observed between YPC and YI mean values across environments.
Association of carotenoid genes to yellow pigments
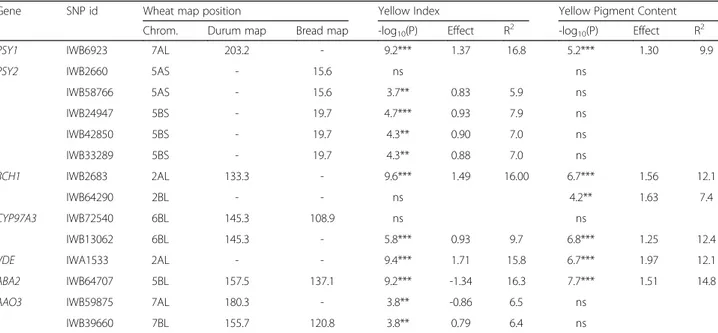
Out of 24 carotenoid candidate genes, 17 showed no SNPs in the coding sequences, failed in the array analysis, or had an allele frequency lower than 0.10 (Table 2) in the wheat collection. These genes were therefore removed from the Marker Trait Association (MTA) analysis. Seven candidate genes (PSY1, PSY2, BCH1, CYP97A3, VDE, ABA2and AAO3) had between 1 to 5 SNPs, and a linear regression analysis was carried out between each SNP, and YPC and YI (Table 4). Except for BCH1 on 2BL, one or more SNPs of each candidate gene mapped onto one or both homeologous chromosomes were found to be significantly associated to YI, indicating their involvement in the yellow pigment biosynthesis or catabolism. PSY1, BCH1, CYP97A3, VDE and ABA2 were also significantly associated to YPC. The pheno-typic variation (R2) explained by each of these markers varied from 5.9 to 16.3% for YI and from 7.4 to 14.8% for YPC. The estimated allelic effects for each marker ranged from −1.34 to 1.79 units for YI, and from 1.25 to 1.97μg/g for YPC.
Detection of QTLs by GWAS
The wheat collection had been genotyped using the 90 K iSelect array. After excluding SNPs on the basis described in the methods, 13,639 SNPs in the whole collection and 9,863 SNPs in the durum sub-population were used for the association analysis. All of these SNPs have locations on the durum consensus map [29]. MTAs were initially calculated by linear regression analysis (GLM) and by three more stat-istical models (GLM + PCs, MLM + K, MLM + K + PCs)
Table 3 Mean, range of variation, standard deviation (SD), coefficient of variation (CV) and heritability (h2B) in the whole collection
and in the durum sub-population evaluated for yellow index (b*) and yellow pigment content (μg/g) in six and two environments, respectively
Trait Environment Whole collection Durum sub-population
Mean Range SD CV h2 B Mean Range SD CV h2B Yellow index (b*) Foggia 2009 12.8 (9.2–17.1) 1.3 3.45 0.89 13.3 (10.5–17.1) 1.1 3.30 0.86 Foggia 2012 13.8 (9.6–19.0) 1.6 3.87 0.90 14.6 (10.0–19.0) 1.5 3.40 0.9 Valenzano 2010 14.6 (11.4–18.5) 1.5 2.93 0.93 15.3 (11.6–18.5) 1.2 2.98 0.88 Valenzano 2012 14.3 (8.9–18.8) 1.6 3.32 0.89 15.0 (11.8–18.8) 1.2 3.10 0.86 Valenzano 2013 14.2 (9.2–18.4) 1.7 2.91 0.94 15.2 (11.9–18.4) 1.4 2.85 0.91 Valenzano 2014 13.4 (9.3–17.6) 1.6 3.46 0.92 14.3 (11.2–17.6) 1.3 3.40 0.87 Mean 13.8 (9.1–17.8) 1.5 3.32 14.6 (11.6–17.8) 1.2 3.17 Yellow pigment (μg/g) Foggia 2008 6.3 (3.2–11.7) 1.7 8.47 0.91 7.1 (3.8–11.7) 1.6 7.73 0.89 Valenzano 2009 5.8 (2.4–12.6) 1.8 7.19 0.95 6.7 (2.8–12.6) 1.8 6.78 0.93 Mean 6.0 (3.1–12.2) 1.8 7.83 6.9 (3.2–12.2) 1.6 7.26
taking into account the confounding effects of population structure and relative kinship to minimize the occurrence of false-positive associations. In general, unsurprisingly the number of significant MTAs with GLM and GLM + PCs was much higher than with MLM + K and MLM + K + PCs (Additional file 5: Table S3). The strong deviation of the observed -log10(P) values from the expected
distri-bution (see Q-Q plots in Additional file 6: Figure S3) and the high number of significant MTAs clearly indi-cated the detection of numerous false-positives by GLM and GLM + PCs models. Observed P values were closer to expected distribution incorporating the K matrix only or the K matrix and the PCs into a MLM, providing more confidence in the associations for YI and YPC detected using this model. The MLM + K and MLM + K + PCs models gave similar results; to minimize possible false-positives we decided to focus on the results generated by the MLM + K + PCs model.
GWAS based on mean values of YI across environ-ments detected nine significant QTLs in the whole collection, and five QTLs in the durum sub-population (Table 5). The QTLs identified in the analysis of the whole population were on chromosomes 4A, 4B (two), 5B, 7A (four) and 7B. The QTLs identified in the durum sub-population were on 4B (two) and 7A (three). Four QTLs (two on 4B and two on 7A) were identical in both analysis (the whole collection and in the durum sub-population). Out of nine significant QTLs for YI across environments, the QTL on 7A at 102.3 cM fulfilled the more stringent FDR criteria. The phenotypic variation (R2) for each of these markers varied from 4.8 to 6.1% in
the whole collection and from 10.1 to 18.4% in the durum sub-population. The estimated allelic effects for each marker ranged from−1.25 to 1.33 units.
GWAS based on mean values of YPC over two envi-ronments (Table 6) detected three significant QTLs on chromosomes 4B (one) and 7A (two) both in the whole collection and in the durum sub-population, and one additional QTL on 4B (position 43.9 cM) in the durum sub-population. The QTL on 7A associated to the SNP marker IWB49295 located in the Psy-A1 coding se-quence was consistent in both the whole collection and the durum sub-population. Out of four significant QTLs for YPC across environments in the durum sub-population, the QTL on 7A at 102.3 cM passed the FDR criteria. The phenotypic variation (R2) explained for each of these markers varied from 5.3 to 22.1%, while the al-lelic effects for YPC ranged from−1.90 to 1.79 μg/g.
To investigate the environmental variations on detec-tion of significant QTLs by GWAS, the MTA analysis was carried out on the mean value over replicates for each of the six environments for YI and for each of the two environments for YPC (Tables 5 and 6). A high QTL-to-environment variation was observed for both traits as we identified 17 QTLs specific in single envi-ronments vs. common QTLs across envienvi-ronments. Considering the GWAS for YI in the whole collection, a minimum of 5 QTLs were detected at V12 and a max-imum of 11 QTLs at V10. Eleven different QTLs were only identified in one environment, 7 in two environ-ments, 4 in three environenviron-ments, 1 in four environments and only 1 in five environments. Notably, no QTL was
Table 4 Regression analysis between carotenoid genes and yellow index and yellow pigment content in a tetraploid wheat collection evaluated in six and two environments, respectively
Gene SNP id Wheat map position Yellow Index Yellow Pigment Content
Chrom. Durum map Bread map -log10(P) Effect R2 -log10(P) Effect R2
PSY1 IWB6923 7AL 203.2 - 9.2*** 1.37 16.8 5.2*** 1.30 9.9
PSY2 IWB2660 5AS - 15.6 ns ns
IWB58766 5AS - 15.6 3.7** 0.83 5.9 ns IWB24947 5BS - 19.7 4.7*** 0.93 7.9 ns IWB42850 5BS - 19.7 4.3** 0.90 7.0 ns IWB33289 5BS - 19.7 4.3** 0.88 7.0 ns BCH1 IWB2683 2AL 133.3 - 9.6*** 1.49 16.00 6.7*** 1.56 12.1 IWB64290 2BL - - ns 4.2** 1.63 7.4 CYP97A3 IWB72540 6BL 145.3 108.9 ns ns IWB13062 6BL 145.3 - 5.8*** 0.93 9.7 6.8*** 1.25 12.4
VDE IWA1533 2AL - - 9.4*** 1.71 15.8 6.7*** 1.97 12.1
ABA2 IWB64707 5BL 157.5 137.1 9.2*** -1.34 16.3 7.7*** 1.51 14.8
AAO3 IWB59875 7AL 180.3 - 3.8** -0.86 6.5 ns
IWB39660 7BL 155.7 120.8 3.8** 0.79 6.4 ns
**and *** = significant atP > 0.01and P > 0.001, respectively, using the Bonferroni threshold (P/28) to control for multiple testing; ns = not significant; R2=
Table 6 SNP markers significantly associated (−log10(P) ≥ 3) with yellow pigment content identified by GWAS (model MLM + K + PCs) in the whole tetraploid wheat collection and in the durum sub-population evaluated in two environments (F08, V09)
SNP marker SNP allele Chrom Position cM Whole collection Durum subpopulation
Allele frequency F08 V09 Mean R2(%) Effect Allele frequency F08 V09 Mean R2(%) Effect
IWB9815 A/G 3B 93.8 0.15–0.85 3.4 - - - - -IWB58319 A/G 4B 17.7 0.50–0.50 - 3.8 3.0 5.3 −0.84 0.55–0.45 - 3.8 3.3 10.9 −1.17 IWB72011 C/T 4B 43.9 0.67–0.33 - - - 0.84–0.16 - 3.3 3.0 10.9 1.79 IWB68046 A/G 5A 84.2 0.84–0.16 3.0 - - - - -IWB57337 A/G 5B 53.4 0.70–0.30 - 3.1 - - - -IWB72567 C/T 7A 102.3 0.53–0.47 6.0 5.5 6.1 13.6 −1.54 0.28–0.72 5.7 4.9 5.4 22.1 −1.90 IWB49295 A/G 7A 203.4 0.34–0–66 - 3.8 4.0 7.2 −1,10 0.19–0.81 - 3.2 3.2 10.4 −1.43 - = not significant R2
= Phenotypic variation explained by the QTL (%)
Chromosome and map position from Maccaferri [29] and -log10(P) value are reported for each marker in each environment and in the mean of the environments.
Phenotypic variation (R2
) and additive effect are reported only for markers significant in the mean of all two environments
Table 5 SNP markers significantly associated (−log10(p) ≥ 3) with yellow index identified by GWAS (model MLM + K + PCs) in the whole tetraploid wheat collection and in the durum sub-population evaluated in six environments (F09, V10, V12, F12, V13, V14) SNP
marker SNP allele
Chrom Position cM Whole collection Durum sub-population
F09 V10 V12 F12 V13 V14 Mean R2(%) Effect F09 V10 V12 F12 V13 V14 Mean R2(%) Effect
IWB73278 C/T 1B 12.8 - - 3 - - - -IWB4839 C/T 1B 150.9 3.4 - - - -IWB70428 A/C 2A 101.5 3.4 3 - - - -IWB42586 C/T 2A 176.5 - - - - 4.2 - - - -IWB55230 C/T 2A 196.5 - - - 3.2 - - - -IWB45885 C/T 2B 14.5 - 3.2 - - - 3.1 - - - -IWB1756 A/G 3B 33.2 3.2 - - - -IWB58482 C/T 3B 160.1 - - - 3.2 - - - -IWB43375 A/G 4A 80.5 - 3.4 3.3 - - - 3.0 4.8 −0.98 - - - -IWB58319 A/G 4B 17.7 - 3.1 3.3 - - - 3.0 4.9 −0.58 - 3.6 - - - 3.1 3.3 10.1 −0.8 IWB72011 C/T 4B 43.9 - 3.4 - - 3.1 - 3.4 5.5 0.72 - 3 - - 3 3.7 3.3 11.1 1.33 IWB72977 A/G 5A 113.7 - - - 3.1 - - - -IWB71274 A/C 5B 44 - - - 3.4 - - - -IWB43483 A/G 5B 120.1 - 3.5 3 - - - 3.1 5.1 −0.72 - - - -IWB62049 G/T 5B 167.5 - - - - 3.2 - - - -IWB14365 A/G 6A 93.4 - - - 3.2 - - - 3.1 - - -IWB73296 A/G 6A 115.3 - - - 3.2 - - - -IWB68640 G/T 7A 14.1 3.2 - - - 3.2 4.6 3.5 5.7 0.81 - - - -IWB8374 A/G 7A 61.6 3.5 3.1 - 3.4 - - - 3.9 - 3.2 3.2 - 3.5 3.7 12.6 1.08 IWB72567 C/T 7A 102.3 4.1 5.5 4.1 3.6 - 3.5 6.2 −0.74 3.4 4.9 4 4 4.5 3.5 5 18.4 −1.25 IWB20381 C/T 7A 168.8 3.1 - - - -IWB59875 C/T 7A 180.3 - 5.4 3.1 4.2 3.2 3.1 3.7 6.1 0.83 - 4.3 3.1 4 - - 3.8 12.2 0.92 IWB49295 A/G 7A 203.4 - 4.2 - - 3.1 3.9 3.5 5.8 −0.78 - - - -IWB72335 A/C 7B 58.3 - - - - 3.1 - - - -IWB9496 A/G 7B 185.2 - - - 4 3.5 5.8 −0.72 - - - - -- = not significant R2
= Phenotypic variation explained by the QTL (%)
Chromosome and map position from Maccaferri [29] and -log10(p) values are reported for each marker in each environment and in the mean of the
detected in all six environments. Genotype x environ-ment (QTL x E) interaction was lower in the durum sub-population: 2 QTLs were detected in two environ-ments, 3 in three environenviron-ments, 1 in four environments and 1 in all six environments. The same trend was ob-served for YPC: 5 QTLs were identified in only one en-vironment and 1 in both examined enen-vironments in the whole collection; out of 4 QTLs detected in the durum sub-population, 3 QTLs were consistent in one envir-onment and 1 in both envirenvir-onments.
Discussion
Identification and mapping of carotenoid genes in the wheat genome
The carotenoid biosynthetic pathway has been extensively studied in model plants and crop species due to their important roles in both development and photosynthesis [2], and their beneficial effects on human health [5]. The wheat genome has still not been completely sequenced due to its huge size and complexity, and the knowledge of metabolic and catabolic pathway of carotenoid com-pounds remains incomplete.
Comparative genomic analysis across different taxa allowed to transfer functional information from well-characterized model organisms, such as Arabidopsis, rice and Brachypodium, to another less-studied taxon, like wheat. This has been beneficial for BCH1, BCH2, CYP97C1, CCD7, CCD1, NCED9 and CCD7 genes, many of which have been well characterized in rice, Brachypodiumand Arabidopsis, but few of which have been studied in wheat. All the orthologues clustered by gene on the phylogenetic tree, sharing common conserved motifs in cDNA sequences. Unsuprisingly, the phylogenetic analysis revealed that the dicotyle-donous PSY1 and PSY2 groups were more distantly re-lated to those of the monocotyledonous groups, thus supporting the assumption that a single duplication event of the ancestor genes occurred before the diver-gence of the grass subfamilies [17, 27]. Differential duplication events took place in the BCH clade. A sep-aration of the Arabidopsis BCH paralogs suggested the same time frame as the other genes for functional diversification [21], but an unexpected separation oc-curred prior to the main grass subfamily divergence for rice BCH1. Further studies on the gene structure and intron-exon size facilitate a better understanding of the BCH group. The in silico expression analysis of the carotenoid candidate genes included in the present study in a wide range of tissues and developmental stages showed that many of these genes had similar ex-pression profiles. Additionally we observed that sometimes one or more genes were virtually unexpressed (such as Z-ISO and CCD7) or highly expressed (such as ZDS) in all the thirteen tissues/stages (Additional file 2: Figure S1).
LYCE, BCH1, BCH2, CYP97A3 and ABA genes exhibited high expression levels in the anthers prior to anthesis and in kernel tissues, indicating their potential involvement in kernel carotenoids accumulation.
With the objectives of both characterizing the carotenoid genes and investigating their relationships with the amber colour of grain and flour of wheat, we analyzed a tetraploid wheat collection with the recently developed genotyping array including 81,587 gene-associated SNPs [28]. The BLASTn analysis of the entire SNP dataset against the carotenoid gene sequences allowed to identifying 1–7 SNPs in the coding sequences of 19 out of 24 examined caroten-oid candidate genes (Table 1). In many cases, at least one SNP was identified for each of the three homeologous genes present in the wheat genomes (PSY1, PSY2, PDS, ZDS, LYCE, CYP97A3, CCD1, ABA2 and AAO3). The recent availability of the high-resolution consensus map of durum [29] and common wheat [28] allowed us to deter-mine the precise map position of most of the carotenoid genes (Table 1 and Fig. 3). The chromosomal location of 13 carotenoid genes determined by our strategy was consistent with results reported by Crawford and Francki (2013) [19], who identified the chromosomal locations based on survey sequence from the International Wheat Genome Sequencing Consortium (http://www.wheatgenome.org/). Map positions of a few carotenoid gene are reported in chromosome intervals as long as 5–20 cM in different SSR-based maps, such as PSY1 and PSY2 [16] and LYCE [31]. The carotenoid genes are distributed on 14 of the 21 chromosomes of bread wheat, and the identification of functional markers and map position can be particularly useful for breeders in MAS programs.
Association of carotenoid genes to yellow pigments
The allele frequency of SNP markers corresponding to carotenoid genes were found to be very variable in the examined wheat collection (Table 2). Several of these SNPs were either monomorphic, or had a MAF < 10% and therefore considered to be rare alleles. PSY1, PSY2, BCH1, CYP97A3, VDE, ABA2and AAO3 were significantly associated to YPC and YI (Table 4), and this validated pre-vious results obtained by using biparental mapping popula-tions for PSY1 [15, 16], LYCE [19, 31] and AAO3 [32]. The association of PSY2, BCH1, CYP97A3, VDE and ABA2 genes with YI and YPC is novel, and indicated that the SNP markers identified within the carotenoid gene sequences can represent a resource for developing genetic markers for use in marker assisted breeding.
Ten carotenoid metabolic/catabolic genes were mapped in corresponding chromosome regions with QTLs detected in the current work and/or in previous QTL studies (see review in Additional file 1: Table S1 and Fig. 3) in-dicating possible relations between candidate genes and grain colour-related traits. Six genes (CRTISO, VDE,
LYCE, PSY2, CYP97A3 and PSY1) are directly involved in the biosynthesis of carotenoid compounds [2]. Inter-estingly, the catabolic genes NCED9, ABA2 and AAO3, involved in the carotenoid cleavage to process violaxanthin and neoxanthin into abscisic acid, were located in chromosome regions influencing YPC [32–34]. These data are consistent with findings in other plant species such as Arabidopsis and maize [35, 36], demonstrating that carotenoid degradation is important in determining total carotenoid accumulation.
QTLs detected by GWAS and comparison with previous studies
In addition to the candidate gene approach, we conducted a GWAS by using the GLM and the MLM models taking into account the confounding effect of population structure and the relative kinship. Q-Q plots clearly indicated the MLM (K + PCs) as the most suitable model for the GWAS of YPC and YI, thus confirming other results of GWAS on quantitative traits carried out on crop plants [37]. Several QTLs for YPC and YI, distributed on 12 of the 14 chromo-somes of durum wheat, were detected (Tables 4 and 5 and Fig. 3). Four stable QTLs on 4B (two) and 7A (two) were associated with both YI and YPC, explaining the significant and positive correlation between the two colour-related traits found in the present and previous studies [38–40]. The higher number of QTLs for YI indicated that yellow pigments of wheat kernels are synthesized by different biochemical pathways, including that for the carotenoids, which interact in some way with the accumulation of ca-rotenoids, such as polyphenol oxidase (PPO), lipoxygenase (LPX) and other carotenoid oxidative enzymes [10, 11]. In addition, it is possible that the wider variability of the entire wheat collection is determined by more genes influ-encing colour-related traits, and that some yellow pigment genes have been fixed during the breeding programs for grain colour improvement and therefore not detected in the durum sub-population.
Several studies on QTL mapping of yellow pigments in wheat have been published during the past two decades. A detailed list of QTLs detected in 26 peer-reviewed papers is reported in Additional file 1: Table S1 and the majority of them are illustrated in Fig. 3. Except chromosome 1D,
QTLs for yellow pigments were detected on all wheat chromosomes. Results of QTL mapping studies indicated many differences in the number and map position of QTLs detected in the different experiments. This may be attributed to a high number of effective genes underlying QTLs coupled with: a) different contributions from parental genotypes of mapping populations; b) QTL x environment interactions; c) differences in the carotenoid extraction procedures and colour measurement, therefore different gene-to-trait associations revealed; d) marker density of linkage maps used in QTL analyses; e) differ-ences in the statistical procedures used for QTL detec-tion and threshold used for the statistical significance of MTAs.
While many of the QTLs for YI and YPC identified in the current study had been described previously (see Fig. 3 for a detailed comparison), 11 QTLs detected on 1AS, 2AL, 2BS, 3BL (two), 4BS, 5AS, 5BS (two) and 7AS (two) were new. Four of these QTLs were detected in more than one environment (Table 5 and Table 6), indi-cating that some wheat accessions of the examined col-lection possess new stable alleles potentially useful for improving colour and nutritional value of wheat grain. Additionally 16 QTLs detected in the present study (on chromosome arms 1BL, 2AL (two), 3BS, 4AL, 4BS, 5AL, 5BL, 6AL (two), 7AL (five), 7BL (two)) validated QTLs previously detected in different genetic backgrounds. Therefore these QTLs can be considered as stable and useful for MAS in breeding programs.
Genotype x environment interaction and QTL detection
With the aim to investigate if the results of GWAS were affected by environmental fluctuations, we conducted replicated trials for YI and YPC in six and two environ-ments, respectively. Comparing the GWAS results, large variations in the number and type of QTLs were observed for both traits in different environments, thus confirming the existence of genotype x environment interaction effects as indicated by the variance analysis. Stable associations for YI in at least three over six environments in the whole col-lection were detected for five QTLs corresponding to one genomic region on chromosomes 5B, and four regions on 7A. In many cases, the SNP-trait associations were
(See figure on previous page.)
Fig. 3 Schematic representation of wheat genome chromosomes. The map is a representation of A and B genome chromosomes of the durum consensus linkage map [29] and of D chromosomes of the consensus bread wheat map [28], with map positions of carotenoid candidate genes and QTLs for yellow index and yellow pigment content. Each chromosome map is represented by the first and the last SNP marker, and by a SNP marker every about 20 cM. SSR markers have been also inserted every about 20 cM to compare the consensus SNP map with published SSR-based maps. Markers are indicated on the right side and cM distances on the left side of the bar. Solid regions of the chromosome bars indicate regions identified as being significantly associated with YI and YPC in published QTL biparental mapping populations (black regions in at least two dif-ferent populations, grey regions in one population). QTLs are represented by bars on the right of each chromosome bar. QTL names indicate the trait (YI for yellow index and YPC for yellow pigment content) and the population in which the QTL was detected (Col = whole collection and Dur = durum sub-population); the closest SNP marker is indicated in red. Carotenoid genes are indicated after the corresponding SNP located in the gene sequence (in blue) or in the same map position of the co-migrating SNP marker located in the same contig
environment-specific, as 11 QTLs were consistent only in one environment and 7 in two environments. The same trend was observed for YPC evaluated in two environ-ments. Although the high values of heritability (from 0.89 to 0.94 for YI and from 0.91 to 0.95 for YP) in open field trials, the complexity of the genetic basis of the studied traits tends to confound the interpretation of GWAS re-sults. These findings are consistent with results obtained by association mapping and QTL linkage analyses experiments on complex traits with far lower heritability such as yield and yield components [41, 42]. The present study suggests that QTL analysis for agronomically important“true” quan-titative traits should be always conducted in a plurality of environments with different soil and climatic conditions. Fi-nally, the need to evaluate and take into account the G x E interaction is important in breeding programs to identify genotypes adapted in a wide range of environments.
Comparison between simple regression and MLM analysis for QTL detection
The SNPs located in the gene sequences PSY1, PSY2, BCH1, CYP97A3, VDE and ABA2 were significantly associated to YI and YPC by regression analysis but not by GWAS analysis. Only the SNP marker IWB59875 located in the coding sequence of the abscisic aldehyde oxidase (AAO3) on chromosome arm 7AL was consist-ent by both MTA analyses. The PSY1, PSY2, CYP97A3 and VDE genes were mapped on chromosome regions corresponding to QTLs for YI and YPC detected in the current study by GWAS or by previous studies using biparental mapping populations (see Fig. 3). NCED, CRTISO and LYCE, which were excluded from the regression analysis as they had allele frequencies lower than 0.05, were also mapped in chromosome regions corresponding to QTLs for YI and YPC. The same re-sults were obtained by Zhao [43], who detected several SNPs near height-controlling genes consistent only by the naïve approach, and suggested that mapping popu-lations derived from crosses between genetically distant parents could be needed to complement GWAS to reduce the rate of both false positives and false nega-tives. It is well known that GWAS carried out by the GLM model generally gives a high number of false-positives [44], and that it is necessary to take into account the confounding effect of population structure and relatedness among individual to control the overall probability of type I error [37]. However, reducing the number of false positives may lead to increasing the number of false negatives, and in some situation ignoring most of the important findings on the genetics and physiology of the traits of interest [45]. The combin-ation of populcombin-ation genetic models and molecular bio-logical knowledge into new QTL detection methods has been recently proposed to increase statistical
power of GWAS in human and agricultural research, as to reduce the overall probability of type II error (false-negative associations), and incorporate biological context in GWAS results [46].
Conclusions
GWAS analysis in wheat collections can contribute to validate QTLs previously detected in biparental popu-lations and to unravel new QTLs for colour-related traits. The MLM models can reduce the number of false positives, while the candidate gene approach can contribute to reduce the number of false negatives. How-ever, GWAS analysis should be carried out on phenotypic data measured in more environments to detecting stable QTLs and determining the genotype x environment inter-actions that tend to confound the interpretation of MTAs and the genetic dissection even of quantitative traits with high heritability values. The availability of markers within the coding sequences of candidate genes can allow to elucidating the mechanism of carotenoid accumulation in the wheat kernels and to exploiting the genetic variability of colour-related traits for the nutritional and commercial improvement of end-finished products of wheat.
Methods
Plant materials and phenotypic evaluation
A collection of 233 accessions of tetraploid wheat (Triticum turgidum L., 2n = 4× = 28; AABB genome) was grown at Valenzano (Bari, southern Italy, 41°02′46″N, 16°53′09″E, altitude 118 m a.s.l., annual average rainfall 586 mm, aver-age temperature 15,7 °C) for five years (2009, 2010, 2012, 2013 and 2014, hereafter reported as V09, V10, V12, V13, V14) and at Foggia (southern Italy, 41°32′11″N, 15°43′ 01″E, altitude 60 m a.s.l., annual average rainfall 469 mm, average temperature 15,4 °C) for three years (2008, 2009 and 2012, hereafter reported as F08, F09 and F12). The panel included accessions of seven T. turgidum subspe-cies: durum (124 accessions), durum var. ethiopicum (10), turanicum(20), polonicum (19), turgidum (16), carthlicum (14), dicoccum (18) and dicoccoides (12). The wheat col-lection has been extensively characterized in terms of genetic diversity and population structure [47], and has been used for the association mapping of loci controlling the resistance to stem rust [48] andβ-glucan content [49]. A detailed list of genotypes (number/name, year of release, country, pedigree) is provided by Laidò [47]. A random-ized complete block design with three replications was used with plots consisting of 1-m rows, 30 cm apart, with 50 germinating seeds per plot. During the growing season, standard cultivation practices were used. Grain samples were ground in a laboratory mill with a 1 mm sieve and the resulting whole flour stored at−4 °C for a maximum of 24 h before analysis. The determination of YPC was
made according to AACC Approved Method 14–50 [50] with slight modifications as described by Fares [51]. YI was determined using the reflectance colorimeter Chroma Meter CR-300 (Minolta) and the“b*” value indicating the yellow intensity was used in subsequent analysis.
DNA extraction and SNP genotyping
Genomic DNA was isolated from freeze-dried leaf tissue fol-lowing the protocol by Dellaporta [52]. A total of 50 ng/μL of genomic DNA of each accession was analyzed with the wheat 90 K iSelect array [28]. Genotyping was performed at TraitGenetics GmbH (http://www.traitgenetics.de) following the manufacturer’s recommendations as described in Akhunov [53]. The genotyping assays were carried out to the Illumina iScan reader and performed using Genome Studio software version 2011.1.
Identification of putative carotenoid biosynthetic and catabolic gene sequences
The Arabidopsis thaliana isoprenoid pathways and re-spective genes from AtIPD (http://www.atipd.ethz.ch/) were used to identify and download from the TAIR database (http://arabidopsis.org/) the cDNA sequences involved in the carotenoid biosynthetic and catabolic pathway. Orthologous genes for Brachypodium distach-yon, Oryza sativa, Zea mays and Triticum aestivum were retrieved from the UniGene Cluster database at NCBI (https://www.ncbi.nlm.nih.gov/) by carotenoid keyword searching. Phylogenetic analysis was carried out using the Neighbor-Joining method and a 1000 replication boot-strap test for significance [54]. In order to denote the plant species, a two-letter prefix was placed before each gene symbol considering At for A. thaliana, Bd for B. distachyon, Os for O. sativa, Zm for Z. mays and Ta for T. aestivum. The alignment of each cDNA was performed via Mega4 software [55]. The tree was generated with ClustalW2 (http://www.ebi.ac.uk/Tools/phylogeny/) and depicted with the program FigTree (http://tree. bio.ed.ac.uk/software/figtree/).
Wheat carotenoid gene sequences were blasted against the available dataset of SNP marker sequences reported by Wang [28], and markers aligned with 80% (IUM) identity were considered as markers within the coding sequences of the carotenoid genes. The BLASTn analysis was extended to contigs assembled in the chromosome survey-sequencing project (http://wheat-urgi.versailles.in ra.fr/Seq-Repository) to identify additional SNPs flanking the carotenoid genes. All the retrieved wheat carotenoid cDNA sequences were blasted against the Wheat 61 k GeneChip in PLEXdb database (http://www.plantgdb.org) for obtaining information on carotenoid gene expression variation in different development phases.
Statistical analysis and QTL detection
Each year-location combination was considered as an environment, and analysis of variance was carried out using the standard procedure with the software MSTAT-C. Genetic variance (σ2
G), environmental variance (σ2E) and
broad-sense heritability (h2B=σ2G/(σG +2 σ2E+σ2GxE) were
ob-tained using the variance component estimates.
Pearson correlation coefficients were calculated between YPC and YI. Details about genetic diversity and population structure of the tetraploid wheat collection as investigated with SSR and DArT markers are provided by Laidò et al. [47], and with SNP markers by Marcotuli et al. [49]. Using Bayesian clustering (K = 2), both sets of molecular markers distinguished the durum cultivars from the other tetraploid subspecies accessions; accordingly, GWAS was conducted on the whole collection and on the 124 durum varieties (hereafter referred to as durum sub-population). Mean values across replicates and mean values across repli-cates and years of YI and YPC were used in the GWAS for each environment and over environments, respect-ively. Prior to GWAS, markers that had >10% missing data points and markers with a minimum allele fre-quency (MAF) of less than 10% were removed from the data matrix. Unmapped markers on the consensus durum wheat map [29] were not used for association analysis. GWAS was carried out using TASSEL v.5 (http://www.maizegenetics.net) with and without cor-rection for population structure. Associations between SNP markers and YPC and YI were calculated using the following models: a) simple regression analysis (general linear model, GLM); b) GLM including popu-lation structure as a covariate by using the Q-matrix derived from the principal component analysis (PCA) as implemented in TASSEL (GLM + PCs); c) mixed linear model (MLM) based on the kinship-matrix (MLM + K); d) mixed linear model based on both Q-matrix and K-Q-matrix (MLM + K + PCs). The statistical models used in the present GWAS were extensively reviewed by Astle and Balding [25] considering the most widely used statistical approaches for controlling the confounding effects of population structure. The most appropriate GWAS method was chosen by in-spection Q-Q plots and Manhattan plots for evidence of P value inflation. A marker-trait association was considered significant when one or more markers were associated with YPC or YI at threshold –log10(P)≥ 3.0
determined by the modified Bonferroni correction as implemented in Genstat (GenStat, 2003). A false discovery rate (FDR) at 0.05P was calculated by the q-value package in R software [56]. For the associations between carot-enoid candidate genes and YPC and YI, the conserva-tive Bonferroni correction for multiple testing was calculated by dividing P < 0.01 with the number of markers used in the analysis. Chromosome localization
and map position of SNP markers were derived from the high-density linkage maps described by Maccaferri [29] for durum wheat and by Wang [28] for common wheat used as reference maps.
Additional files
Additional file 1: Table S1. List of detected QTLs for yellow index and/ or yellow pigment content in wheat. (DOCX 18 kb)
Additional file 2: Figure S1. Expression analysis from PLEXdb database of all key genes in carotenoid biosynthesis. (DOCX 83 kb)
Additional file 3: Figure S2. Frequency distributions of yellow index and yellow pigment content. (DOCX 28 kb)
Additional file 4: Table S2. Correlation coefficients of yellow pigment content and of yellow index. (DOCX 12 kb)
Additional file 5: Table S3. Number of significant marker-trait associations detected by four GWAS models. (DOCX 13 kb) Additional file 6: Figure S3. Genome-wide association analysis for yellow index and yellow pigment content: Q-Q plots. (DOCX 1809 kb)
Abbreviations
At:Arabidopsis thaliana; Bd: Brachypodium distachyon; Os: Oryza sativa; QTLs: Quantitative trait loci; SNPs: Single nucleotide polymorphisms; Ta: Triticum aestivum; YI: Yellow index; YPC: Yellow pigment content; Zm: Zea mays
Acknowledgements Not applicable. Funding
This research was supported by grants from MIUR, Italy, projects‘PON-01_01145 – ISCOCEM”. KH would like to acknowledge funding from the Rural & Environment Science & Analytical Services Division of the Scottish Government.
Availability of data and materials
Six additional files were uploaded in BMC Genomics website for supporting the results and findings found in this study.
Authors’ contributions
PC, IM, A. Gadaleta and AB designed the research; MLL, DN, A. Giancaspro, GM, PDV, AMM, NP, KH and RS performed the research and analyzed the data. PC and AB wrote the manuscript. All authors read and approved the final manuscript. Competing interests
The authors declare that they have no competing interests. Consent for publication
Not applicable.
Ethics approval and consent to participate
The manuscript does not report the use of any animal or human data or tissue. Data deposition
No data related to nucleic acid sequences and protein sequences need to be deposited since they were already available in NCBI database. Author details
1Department of Soil, Plant and Food Sciences, University of Bari‘Aldo Moro’,
Via G. Amendola 165/A, Bari, Italy.2Department of Agricultural and Environmental Science, University of Bari‘Aldo Moro’, Via G. Amendola 165/ A, 70126 Bari, Italy.3Council for Agricultural Research and Economics - Cereal
Research Centre, 71122 Foggia, Italy.4The James Hutton Institute,
Invergowrie, Dundee DD2 5DA, Scotland.
Received: 13 July 2016 Accepted: 7 December 2016
References
1. Hirschberg J. Carotenoid biosynthesis in flowering plants. Curr Opin Plant Biol. 2001;4(3):210–8.
2. Cazzonelli CI, Pogson BJ. Source to sink: regulation of carotenoid biosynthesis in plants. Trends Plant Sci. 2010;15(5):266–74.
3. Seo M, Koshiba T. Complex regulation of ABA biosynthesis in plants. Trends Plant Sci. 2002;7(1):41–8.
4. Xie X, Yoneyama K, Yoneyama K. The strigolactone story. Annu Rev Phytopathol. 2010;48:93–117.
5. Fiedor J, Burda K. Potential role of carotenoids as antioxidants in human health and disease. Nutrients. 2014;6(2):466–88.
6. Moise AR, Al-Babili S, Wurtzel ET. Mechanistic aspects of carotenoid biosynthesis. Chem Rev. 2014;114(1):164–93.
7. Ruiz-Sola MA, Rodriguez-Concepcion M. Carotenoid biosynthesis in Arabidopsis: a colorful pathway. The Arabidopsis Book. 2012;10:e0158. doi:10.1199/tab.0158.
8. Shewry PR, Halford NG. Cereal seed storage proteins: structures, properties and role in grain utilization. J Exp Bot. 2002;53(370):947–58.
9. Mares DJ, Campbell AW. Mapping components of flour and noodle colour in Australian wheat. Aust J Agric Res. 2001;52:1297–309.
10. Feillet P, Autran J-C, Icard-Vernière C. Pasta brownness: an assessment. J Cereal Sci. 2000;32(3):215–33.
11. Ficco DBM, Mastrangelo AM, Trono D, Borrelli GM, De Vita P, Fares C, et al. The colours of durum wheat: a review. Crop Pasture Sci. 2014;65:1–15. 12. Clarke B, Liang R, Morell M, Bird A, Jenkins C, Li Z. Gene expression in a starch
synthase IIa mutant of barley: changes in the level of gene transcription and grain composition. Funct Integr Genomics. 2008;8(3):211–21.
13. He XY, Zhang YL, He ZH, Wu YP, Xiao YG, Ma CX, et al. Characterization of phytoene synthase 1 gene (Psy1) located on common wheat chromosome 7A and development of a functional marker. Theor Appl Genet. 2008;116(2):213–21. 14. He XY, He ZH, Ma W, Appels R, Xia XC. Allelic variants of phytoene synthase
1 (Psy1) genes in Chinese and CIMMYT wheat cultivars and development of functional markers for flour colour. Mol Breeding. 2009;23(4):553–63. 15. Zhang W, Dubcovsky J. Association between allelic variation at the Phytoene
synthase 1 gene and yellow pigment content in the wheat grain. Theor Appl Genet. 2008;116(5):635–45.
16. Pozniak CJ, Knox RE, Clarke FR, Clarke JM. Identification of QTL and association of a phytoene synthase gene with endosperm colour in durum wheat. Theor Appl Genet. 2007;114(3):525–37.
17. Dibari B, Murat F, Chosson A, Gautier V, Poncet C, Lecomte P, et al.
Deciphering the genomic structure, function and evolution of carotenogenesis related phytoene synthases in grasses. BMC Genomics. 2012;13(1):1–14. 18. Howitt CA, Cavanagh CR, Bowerman AF, Cazzonelli C, Rampling L, Mimica JL,
et al. Alternative splicing, activation of cryptic exons and amino acid substitutions in carotenoid biosynthetic genes are associated with lutein accumulation in wheat endosperm. Funct Integr Genomics. 2009;9(3):363–76. 19. Crawford AC, Francki MG. Lycopene-ε-cyclase (e-LCY3A) is functionally
associated with quantitative trait loci for flour b* colour on chromosome 3A in wheat (Triticum aestivum L.). Mol Breeding. 2013;31(3):737–41.
20. Cong L, Wang C, Li Z, Chen L, Yang G, Wang Y, et al. cDNA cloning and expression analysis of wheat (Triticum aestivum L.) phytoene and zeta-carotene desaturase genes. Mol Biol Rep. 2010;37(7):3351–61.
21. Qin X, Zhang W, Dubcovsky J, Tian L. Cloning and comparative analysis of carotenoid beta-hydroxylase genes provides new insights into carotenoid metabolism in tetraploid (Triticum turgidum ssp. durum) and hexaploid (Triticum aestivum) wheat grains. Plant Mol Biol. 2012;80(6):631–46. 22. Zeng J, Wang X, Miao Y, Wang C, Zang M, Chen X, et al. Metabolic engineering
of wheat provitamin a by simultaneously overexpressing CrtB and silencing carotenoid hydroxylase (TaHYD). J Agric Food Chem. 2015;63(41):9083–92. 23. Rafalski JA. Association genetics in crop improvement. Curr Opin Plant Biol.
2010;13(2):174–80.
24. Korte A, Farlow A. The advantages and limitations of trait analysis with GWAS: a review. Plant Methods. 2013;9:29.
25. Astle W, Balding DJ. Population structure and cryptic relatedness in genetic association studies. Stat Sci. 2009;24:451–71.
26. Thornsberry JM, Goodman MM, Doebley J, Kresovich S, Nielsen D. Buckler Est. Dwarf8 polymorphisms associate with variation in flowering time. Nat Genet. 2001;28(3):286–9.
27. Gallagher CE, Matthews PD, Li F, Wurtzel ET. Gene duplication in the carotenoid biosynthetic pathway preceded evolution of the Grasses. Plant Physiol. 2004;135:1776–83.
28. Wang SW, Forrest D, Allen K, Chao A, Huang S, Maccaferri BE, et al. Characterization of polyploid wheat genomic diversity using a high-density 90,000 single nucleotide polymorphism array. Plant Biotechnol J. 2014;12(6):787–96.
29. Maccaferri M, Ricci A, Salvi S, Milner SG, Noli E, Martelli PL, et al. A high-density, SNP-based consensus map of tetraploid wheat as a bridge to integrate durum and bread wheat genomics and breeding. Plant Biotechnol J. 2014;13:648–63.
30. Blanco A, Colasuonno P, Gadaleta A, Mangini G, Schiavulli A, Simeone R, et al. Quantitative trait loci for yellow pigment concentration and individual carotenoid compounds in durum wheat. J Cereal Sci. 2011;54(2):255–64. 31. Qin X, Fischer K, Yu S, Dubcovsky J, Tian L. Distinct expression and function
of carotenoid metabolic genes and homoeologs in developing wheat grains. BMC Plant Biol. 2016;16(1):155.
32. Colasuonno P, Gadaleta A, Giancaspro A, Nigro D, Giove S, Incerti O, et al. Development of a high-density SNP-based linkage map and detection of yellow pigment content QTLs in durum wheat. Mol Breeding. 2014;34:1563–78. doi:10.1007/s11032-014-0183-3.
33. Tsilo TJ, Hareland GA, Chao S, Anderson JA. Genetic mapping and QTL analysis of flour colour and milling yield related traits using recombinant inbred lines in hard red spring wheat. Crop Sci. 2011;51(1):237.
34. Roncallo PF, Cervigni GL, Jensen C, Miranda R, Carrera AD, Helguera M, et al. QTL analysis of main and epistatic effects for flour colour traits in durum wheat. Euphytica. 2012;185(1):77–92.
35. Wurtzel ET, Cuttriss A, Vallabhaneni R. Maize provitamin a carotenoids, current resources, and future metabolic engineering challenges. Front Plant Sci. 2012;3:29. 36. Gonzalez-Jorge S, Ha SH, Magallanes-Lundback M, Gilliland LU, Zhou A,
Lipka AE, et al. Carotenoid cleavage dioxygenase4 is a negative regulator of beta-carotene content in Arabidopsis seeds. Plant Cell. 2013;25(12):4812–26. 37. Gupta PK, Kulwal PL, Jaiswal V. Association mapping in crop plants:
opportunities and challenges. Adv Genet. 2014;85:109–47.
38. Fratianni A, Irano M, Panfili G, Acquistucci R. Estimation of colour of durum wheat. Comparison of WSB, HPLC, and reflectance colorimeter
measurements. J Agric Food Chem. 2005;53(7):2373–8.
39. Digesù AM, Platani C, Cattivelli L, Mangini G, Blanco A. Genetic variability in yellow pigment components in cultivated and wild tetraploid wheats. J Cereal Sci. 2009;50(2):210–8.
40. Zhang KP, Chen GF, Zhao L, Liu B, Xu X-B, Tian JC. Molecular genetic analysis of flour colour using a doubled haploid population in bread wheat (Triticum aestivum L.). Euphytica. 2009;165(3):471–84.
41. Edae EA, Byrne PF, Haley SD, Lopes MS, Reynolds MP. Genome-wide association mapping of yield and yield components of spring wheat under contrasting moisture regimes. Theor Appl Genet. 2014;127(4):791–807. 42. Mora F, Castillo D, Lado B, Matus I, Poland J, Belzile F, et al. Genome-wide
association mapping of agronomic traits and carbon isotope discrimination in a worldwide germplasm collection of spring wheat using SNP markers. Mol Breeding. 2015;35(2):1–12.
43. Zhao K, Tung CW, Eizenga GC, Wright MH, Ali ML, Price AH, et al. Genome-wide association mapping reveals a rich genetic architecture of complex traits in Oryza sativa. Nat Commun. 2011;2:467.
44. Breseghello F, Sorrells ME. Association analysis as a strategy for improvement of quantitative traits in plants. Crop Sci. 2006;46(3):1323.
45. Donnelly P. Progress and challenges in genome-wide association studies in humans. Nature. 2008;456(7223):728–31.
46. Marjoram P, Zubair A, Nuzhdin SV. Post-GWAS: where next? More samples, more SNPs or more biology? Heredity. 2014;112(1):79–88.
47. Laidò G, Mangini G, Taranto F, Gadaleta A, Blanco A, Cattivelli L, et al. Genetic diversity and population structure of tetraploid wheats (Triticum turgidum L.) estimated by SSR, DArT and pedigree data. PLoS One. 2013;8(6):e67280. 48. Laidò G, Marone D, Russo MA, Colecchia SA, Mastrangelo AM, De Vita P, et
al. Linkage disequilibrium and genome-wide association mapping in tetraploid wheat Triticum turgidum L. PLoS One. 2014;9(4):e95211. 49. Marcotuli I, Houston K, Schwerdt JG, Waugh R, Fincher GB, Burton RA, et al.
Genetic diversity and genome wide association study ofβ-glucan content in tetraploid wheat grains. PLoS One. 2016;11(4):e0152590.
50. AACC International. Approved Methods of Analysis, Method 14–50.01. Determination of Pigments. AACC International, 11th Ed., St. Paul, MN, U.S.A. 1961. http://dx.doi.org/10.1094/AACCIntMethod-14-50.01.
51. Fares C, Platani C, Tamma G, Leccese F. Microtest per la valutazione del colore in genotipi di frumento duro. Molini d’Italia, Anno XLII. 1991;12:19–21.
52. Dellaporta SL, Wood J, Hicks JB. A plant DNA minipreparation: Version II. Plant Mol Biol Rep. 1983;1(4):19–21.
53. Akhunov E, Nicolet C, Dvorak J. Single nucleotide polymorphism genotyping in polyploid wheat with the Illumina GoldenGate assay. Theor Appl Genet. 2009;119(3):507–17. doi:10.1007/s00122-009-1059-5.
54. Felsenstein J. Confidence limits on phylogenies with a molecular clock. Syst Zool. 1985;34(2):152–61.
55. Tamura K, Dudley J, Nei M, Kumar S. MEGA4: Molecular Evolutionary Genetics Analysis (MEGA) software version 4.0. Mol Biol Evol. 2007;24(8):1596–9. 56. Dabney A, Storey JD, Warnes GR. qvalue: Q-value estimation for false
discovery rate control. R package version 1380. 2010.
57. Vranová E, Hirsch-Hoffmann M, Gruissem W. AtIPD: A curated database of Arabidopsis isoprenoid pathway models and genes for isoprenoid network analysis. Plant Physiol. 2011;156(4):1655–60.
• We accept pre-submission inquiries
• Our selector tool helps you to find the most relevant journal
• We provide round the clock customer support
• Convenient online submission
• Thorough peer review
• Inclusion in PubMed and all major indexing services
• Maximum visibility for your research
Submit your manuscript at www.biomedcentral.com/submit
![Fig. 1 The carotenoid metabolic/catabolic pathway (modified from Vranova [57])](https://thumb-eu.123doks.com/thumbv2/123dokorg/5483268.62537/2.892.93.804.520.1077/fig-carotenoid-metabolic-catabolic-pathway-modified-vranova.webp)