DEFENCE S&T TECHNICAL BULLETIN
CONTENTS
Electrochemical Characterisation of Hybrid Activators for Aluminium
Sacrificial Anodes in Natural Sea Water
Mohd Subhi Din Yati, Mohd Nazree Derman, Mahdi Che Isa, Mohd
Moesli Mohammad & Hasril Nain
Management of Naval Vessels’ Electromagnetic Signatures: A Review
of Sources and Countermeasures
Hasril Nain, Mahdi Che Isa, Mohd Moesli Muhammad, Nik
Hassanud-din Nik Yusoff, Mohd Subhi Din Yati & Irwan Mohd Nor
Bioweapons and Bioterrorism: A Review of History and Biological
Agents
Orlando Cenciarelli, Silvia Rea, Mariachiara Carestia, Fabrizio
D’Amico, Andrea Malizia, Carlo Bellecci, Pasquale Gaudio, Antonio
Gucciardino & Roberto Fiorito
Evaluation of the Repeatability of Global Positioning System (GPS)
Performance With Respect to GPS Satellite Orbital Passes
Dinesh Sathyamoorthy, Shalini Shafii, Zainal Fitry M Amin & Siti
Zainun Ali
75 - 92
93 - 110
111 - 129
130 - 140
Vol. 6
Num. 2
Year 2013
ISSN 1985-6571
Biometrics refers to the identification of humans by their characteristics or traits. It is used for user identification and access control for computer systems security, secure electronic banking, secure access to buildings, and health and social services. It is also used to identify individuals in groups that are under surveillance. Biometric identifiers are distinctive and measurable characteristics that can be used to label and describe individuals, and can be categorised into physiological and behavioural characteristics. Physiological characteristics are related to the shape of the body, such as fingerprint, face, DNA, palm print, hand geometry, and iris and retina. Behavioural characteristics (known as behaviometrics) are related to the behaviour of a person, such as typing rhythm, handwriting, gait, and voice. As biometric identifiers are unique to individuals, they are more reliable in verifying identity than token and knowledge-based methods (such as driver's license and passport). While the costs of implementation biometric systems are high, the benefits of increased security and increase of accessibility by people of variable abilities can justify the costs. However, the collection of biometric identifiers raises privacy concerns about the ultimate use of this information. The following are relatively interesting and useful websites on biometrics:
1) Biometrics.gov: Biometrics Overview
http://www.biometrics.gov/documents/biooverview.pdf 2) Caslon Analytics: Biometrics
http://www.caslon.com.au/biometricsnote.htm 3) How Stuff Works: How Biometrics Work
http://science.howstuffworks.com/biometrics.htm 4) Bromba Biometrics: Biometrics FAQ
http://www.bromba.com/faq/biofaqe.htm 5) A Survey of Biometric Recognition Methods
http://www.vcl.fer.hr/papers_pdf/A%20Survey%20of%20Biometric%20Recognition%20Methods .pdf
Websites and articles discussing on the operations of various types of biometric systems. 6) Fulcrum Biometrics: Glossary of Biometric Terms
http://climate.nasa.gov
Provides definitions for key biometric terms based on information derived from the US National Science & Technology Council (NSTC) Subcommittee on Biometrics.
7) Federal Bureau of Investigation’s (FBI) Biometric Center Of Excellence (BCOE) http://www.biometriccoe.gov
BCOE is the FBI's programme for exploring and advancing the use of new and enhanced biometric technologies and capabilities for integration into law enforcement operations.
8) University of Bologna: Biometric System Laboratory http://biolab.csr.unibo.it/home.asp
9) Carnegie Mellon University: Cylab Biometric Center http://www.cylab.cmu.edu/research/center-biometrics.html 10) Michigan State University: Biometrics Research Group
http://biometrics.cse.msu.edu
11) Multimedia University: Centre for Information Security (CIS) http://fist.mmu.edu.my/cis
EDITORIAL BOARD
Chief Editor
Dr Zalini bt Yunus
Deputy Chief Editors
Dr Mahdi bin Che Isa
Dr Dinesh Sathyamoorthy
Associate Editors
Halijah bt Ahmad
Masliza bt Mustafar
Secretariat
Norkamizah bt Mohd Nor
Siti Zainun bt Ali
The Defence S&T Technical Bulletin is the official technical bulletin of the Science & Technology Research Institute for Defence (STRIDE). The bulletin, which is indexed in, among others, Scopus, Index Corpenicus, ProQuest and EBSCO, contains manuscripts on research findings in various fields of defence science & technology. The primary purpose of this bulletin is to act as a channel for the publication of defence-based research work undertaken by researchers both within and outside the country.
WRITING FOR THE DEFENCE S&T TECHNICAL BULLETIN
Contributions to the bulletin should be based on original research in areas related to defence science & technology. All contributions should be in English.
PUBLICATION
The editors’ decision with regard to publication of any item is final. A manusript is accepted on the understanding that it is an original piece of work which has not been accepted for publication elsewhere. Contributors will receive two complimentary copies of the issue in which their work appears.
PRESENTATION OF MANUSCRIPTS
The format of the manuscript is as follows:
a) Page size B5 (JIS)
b) MS Word format
c) Single space
d) Justified
e) In Times New Roman ,11-point font
f) Should not exceed 20 pages, including references
g) Texts in charts and tables should be in 10-point font.
Please e-mail the manuscript to:
1) Dr. Zalini bt Yunus ([email protected])
2) Dr. Mahdi bin Che Isa ([email protected])
3) Dr. Dinesh Sathyamoorthy ([email protected])
The next edition of the bulletin is expected to be published in April 2014. The due date for submissions is 19 February 2014. It is strongly iterated that authors are
solely responsible for taking the necessary steps to ensure that the submitted manuscripts do not contain confidential or sensitive material.
The template of the manuscript is as follows:
EDITORIAL BOARD
Chief Editor
Dr Zalini bt Yunus
Deputy Chief Editors
Dr Mahdi bin Che Isa
Dr Dinesh Sathyamoorthy
Associate Editors
Halijah bt Ahmad
Masliza bt Mustafar
Secretariat
Norkamizah bt Mohd Nor
Siti Zainun bt Ali
Name(s) of author(s) Affiliation(s)
E-mail:
ABSTRACT
Contents of abstract.
Keywords: Keyword 1; keyword 2; keyword 3; keyword 4; keyword 5.
1. TOPIC 1 Paragraph 1. Paragraph 2. 1.1 Sub Topic 1 Paragraph 1. Paragraph 2. 2. TOPIC 2 Paragraph 1. Paragraph 2.
Content Content Content
Content Content Content
Content Content Content
Content Content Content
Equation 1 (1)
Equation 2 (2)
REFERENCES
Long lists of notes of bibliographical references are generally not required. The method of citing references in the text is ‘name date’ style, e.g. ‘Hanis (1993) claimed that...’, or ‘…including the lack of interoperability (Bohara et al., 2003)’. End references should be in alphabetical order. The following reference style is to be adhered to:
Books
Serra, J. (1982). Image Analysis and Mathematical Morphology. Academic Press, London.
Book Chapters
Goodchild, M.F. & Quattrochi, D.A. (1997). Scale, multiscaling, remote sensing and GIS. In Quattrochi, D.A. and Goodchild, M.F. (Eds.), Scale in Remote
Sensing and GIS. Lewis Publishers, Boca Raton, Florida, pp. 1-11.
Journals / Serials
Jang, B.K. & Chin, R.T. (1990). Analysis of thinning algorithms using mathematical morphology. IEEE T. Pattern Anal., 12: 541-550.
Online Sources
GTOPO30 (1996). GTOPO30: Global 30 Arc Second Elevation Data Set. Available online at: http://edcwww.cr.usgs.gov/landdaac/gtopo30/gtopo30.html (Last access date: 1 June 2009)
Unpublished Materials (e.g. theses, reports and documents)
Wood, J. (1996). The Geomorphological Characterization of Digital Elevation
Models. PhD Thesis, Department of Geography, University of Leicester,
ELECTROCHEMICAL CHARACTERISATION OF HYBRID ACTIVATORS FOR ALUMINIUM SACRIFICIAL ANODES IN NATURAL
SEA WATER
Mohd Subhi Din Yati1*, Mohd Nazree Derman1, Mahdi Che Isa2
Mohd Moesli Mohammad2 & Hasril Nain2
1School of Materials Engineering, University Malaysia Perlis (UniMap), Malaysia
2Materials Research Group, Maritime Technology Division, Science & Technology
Research Institute for Defence (STRIDE), Malaysia
*E-mail: [email protected]
ABSTRACT
This paper reports on the electrochemical behaviour of as-cast Al-Zn-Mg alloys activated by tin (Sn) and ruthenium dioxide (RuO2) in natural sea water. The potential and advantages of Sn and RuO2 as hybrid activators in Al-Zn-Mg alloys will be studied by using direct (DC) and alternating (AC) current electrochemical measurement techniques. The morphology of the alloys’ corroded surface was studied using a scanning electron microscope (SEM). This study showed that the addition of 1.5%wt. Sn as an alloying element gave a stable corrosion free process that can be achieved after 2 ks of immersion. The results also showed that RuO2 catalytic coating applied on the surface of Al-Zn-Mg-Sn alloy slightly shifted the values of open circuit potential (OCP) towards a more electropositive direction as compared to Al-Zn-Mg-Sn without RuO2. The morphology of the corroded surface of Al-Zn-Mg-Sn alloy coated with RuO2 showed a more uniform corrosion attack with the formation of porous and fibrous mud-like cracks on the outer layer. This type of corrosion morphology features were believed to facilitate ionic species adsorption and diffusion through corrosion product layer at solution-alloy interface. Electrochemical impedance spectroscopy (EIS) showed that both Sn and RuO2 are capable to activate Al-Zn-Mg-Sn alloy in sea water by modifying the electrical properties of the oxide layer, reducing resistance to polarisation Rp values and thus, activating and accelerating the aluminium alloy dissolution process.
Keywords: Aluminium sacrificial anodes; hybrid activators; electrochemical
impedance spectroscopy (EIS); open circuit potential (OCP); corrosion morphology.
1. INTRODUCTION
Sacrificial anode for cathodic protection (SACP) is one of the popular electrochemical means for corrosion mitigation in marine environments. The
application of aluminium sacrificial anodes for the cathodic protection of steel structures has been practiced since the early 1960s (Barbucci et al., 1997; Shibli et
al., 2005; Andrea et al., 2011). Aluminium (Al) is generally used in ports to protect
structures (e.g., docks and piles) because of its higher theoretical efficiency (Qingfeng & Niels, 2002; Jingling & Jiuba, 2010; Jiuba et al., 2011; Junguang et
al., 2011) and its merits, such as low density, vast availability, reasonable cost
(Shibli et al., 2008) and the capability to provide enough driving potential throughout its service life as compared to zinc sacrificial anodes (Qingfeng & Neils, 2002). The first practical use of catholic protection was proposed by Sir Humprey Davy in 1820 for the Royal Navy in preserving copper sheeting used for cladding the hulls of naval vessels with small quantities of iron or zinc. Towards the end of the 1990s, when marine engineers realised that stern drives and outboard motors required more protection than zinc anodes could provide, suitable candidates, such as aluminium anodes, started to be used widely because of their much higher current capacity (Ah/kg) (Idusuyi & Oluwole, 2012). Sacrificial anodes have a difficult task, since they have to protect what is already a very active aluminium assembly. Installing cheap or sub-standard anodes also will undoubtedly cause increased and potentially very expensive corrosion problems.
Problems such as long periods of potential stabilisation, domination of pitting aided dissolution and surface passivation are common for aluminium sacrificial anodes. Aluminium also has a natural tendency of forming a passive oxide layer, but this can be overcome by the addition of alloying elements (Umoru & Ige, 2007; Mahdi
et al. 2010, 2011) and catalytic coating (Shibli & Gireesh, 2003; Shibli et al., 2004;
Shibli & Gireesh, 2005; Shibli & Sony, 2007). Both methods are meant to generate surface modification, such as micro-structural electronic defects, that may lead to passive oxide film rupture. The alloying elements and catalytic coating will disturb
the alumina (Al2O3) bonding strength by placing impurities in between the
oxide-substrate layer (Jafarzadeh et al., 2008). The addition of alloying elements such as mercury (Hg), gallium (Ga), indium (In), tin (Sn) and bismuth (Bi) (Shibli & Gireesh, 2003; Bessone, 2006) may weaken the oxide layer by easing ion penetration from electrolytes through the defective oxide layer, thus generating localised corrosion, which is also known as pitting corrosion. Hybrid activators,
such as iridium dioxide (IrO2) and ruthenium dioxide (RuO2), have been extensively
used as catalytic coating for chlor-alkali production and dimensionally stable anodes (DSAs) due to it good catalytic activity (Shibli & Sony, 2007; Likun et al., 2009).
This paper will report on the electrochemical behaviour of as-cast Al- Zn-Mg alloys
activated by Sn and RuO2,because of their good characteristics in natural sea water
(Mahdi et al, 2010; Shibli et al., 2004). The potential and advantages of Sn and
RuO2 as hybrid activators in Al-Zn-Mg alloys will be studied by using direct (DC)
2. MATERIALS & METHODS
2.1 Sample Preparation and Alloy Composition
Cast aluminium alloy was prepared in a graphite crucible under the protection of argon gas (inert atmosphere). Pure metals were melted in the crucible at temperature
of 850 oC using aluminium beads (purity of 99.90%) as the primary component.
Rod shaped samples were made using a preheated mild steel mould. As for the Al-Zn-Mg-Sn alloy fabrication, 1.5%wt Sn was added into an aluminium melted
solution when approaching 650 oC to minimise Sn oxidation. At the same time,
argon gas was flowed into the surrounding chamber at increased rate from 5 to 8 L/min. The sample was then cooled down at room temperature. The as-cast aluminium was then cut using a low speed cutter at speed of 250 rpm. The samples were then polished using 400, 600, 800 and 1,000 grades emery paper for the final surface preparation. The samples were degreased and washed using acetone and
distilled water. In order to obtain an aluminium alloy coated with RuO2, the samples
were then dipped in 1,000 ppm RuCl3 solution, and then dried and heated at 400 oC
for 30 min. The composition of the prepared aluminium alloy samples are shown in Table 1.
Table 1: Aluminium alloy chemical compositions analysed using a wavelength dispersive x-ray fluorescent (WDXRF) spectrometer.
Sample Code Composition (wt %)
Zn Mg Sn Fe Pb Al
Al-Zn-Mg A 5.39 1.96 - 0.051 0.004 Bal.
Al-Zn-Mg-Sn B 5.38 1.87 1.42 0.013 0.0007 Bal.
Al-Zn-Mg-Sn coated with 1,000ppm RuO2 C 5.42 1.86 1.42 0.044 0.006 Bal.
2.2 Electrochemical Measurement
Open circuit potential (OCP), electrochemical impedance spectroscopy (EIS) and potentiodynamic polarisation measurement were conducted using a
three-electrochemical cell GAMRY Instruments Reference 3000
potentiostat/galvanostat/zero resistance ammeter (ZRA) controlled by GAMRY Framework V5.65, and the Echem Analyst software for data analysis. A saturated calomel electrode (SCE) was used as the reference electrode (RE), while high density graphite was used as the counter electrode (CE). The sample was cut from the as-cast cylindrical alloy and drilled. The samples (5 mm thick) were then polished up to grit 1,000 followed by ultrasonic cleaning and finally dried in warm flowing air prior to each experiment. Potentiodynamic polarisation measurement was started from cathodic potential of -250 mV and stopped at anodic potential of 1,600 mV, with the scanning rate set at 0.5 mA/sec. Each sample’s exposed area
was 2.54 cm2, embedded in cold mount resin with the copper wire stage-out for ease
of electrical contact later in the experimental process. The experiments were
conducted in sea water (natural chloride solution) at 27 oC (room temperature) and
pH 8.1 with chemical composition as shown in Table 2. The sea water was taken from Teluk Batik, Perak, which is located at the west coast of Peninsular Malaysia. Impedance spectra were generated for the OCP values of the samples over frequency range of 100 kHz to 0.01 Hz. An AC signal of 0.5 mV was used in this impedance measurement.
Table 2: Natural sea water composition at room temperature (27 °C).
Cation (mg/l) Anion (mg/l) Trace elements (mg/l)
(i) Natrium 9.247 x 10³ (i) Chloride 15.451 x 10³ (i) Barium 43.945 x 10⁻³
(ii) Calcium 3.647 x 10² (ii) Sulphate 5.786 x 10³ (ii) Manganese 38.451 x 10⁻³
(iii) Magnesium 1.117 x 10³ (iii) Fluoride 4.85 x 10² (iii) Copper <0.001
(iv) Kalium 3.557 x 10² (iv) Nitrate 6.34 x 10² (iv) Zinc 0.122
(v) Boron 5.13 x 10² (v) Bromide - (v) Argentum 291.222 x 10⁻³
(vi) Strontium 7.009 (iv) Plumbum <0.001
(vi) Cadmium <0.001
(vii) Chromium <0.001
(viii) Nickel 0.002
(ix) Mercury 0.003
(x) Arsenic 0.001
3. RESULTS AND DISCUSSION
3.1 Open Circuit Potential (OCP)
OCP measurement was recorded in sea water for a period of 15 h. As observed in
Figure 1, Al-Zn-Mg-Sn (c) and Al-Zn-Mg-Sn coated RuO2 (d) only took 2.5 ks of
immersion to reach a stable free corroding potential. However, for Al-Zn-Mg, a stable OCP was achieved at approximately 45 ks of immersion time. From the OCP plots, it is concluded that the addition of Sn had a very important role in stabilising the OCP readings and shortening the time of activation, which is consistent with the findings in Mahdi et al. (2010). This finding is also in good agreement with studies conducted by previous researchers which reported on the role of Sn in activating
magnesium anodes for battery applications (Feng et al., 2007; Feng et al., 2008).
For Al-Zn-Mg-Sn coated with RuO2, the OCP plot shifts towards an electropositive
direction as compared to Al-Zn-Mg-Sn. This is probably due to poor RuO2
movement. Both situations can be overcome using an annealing process as suggested by Shibli et al. (2004). The OCP values for the steel and aluminium alloy samples used in the experiment are shown in Table 3.
Figure 1: OCP values as a function of immersion time in sea water for aluminium alloys compared to steel.
Table 3: OCP values of the samples.
Alloys OCP (mV vs SCE)
Al-Zn-Mg -1096 ± 11
Al-Zn-Mg-Sn -1152 ± 9
Al-Zn-Mg-Sn coated RuO2 -1104 ± 9
Steel -741 ± 7
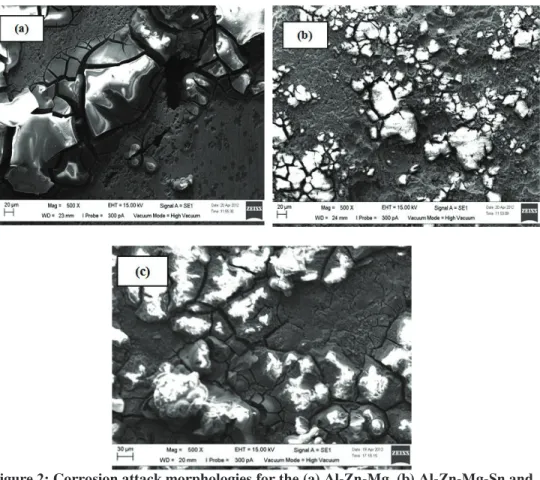
The corrosion attack morphologies for the Al-Zn-Mg, Sn and
Al-Zn-Mg-Sn coated RuO2 samples are shown in Figure 2. Localised corrosion attack was
observed for the Al-Zn-Mg sample (b) due to the active nature of Mg as compared to Zn and Al matrix (Mahdi et al., 2011). On the other hand, for the Al-Zn-Mg-Sn
(b) and Al-Zn-Mg-Sn coated RuO2 (c) samples, the attacks look more uniform. The
morphologies of corrosion products formed after 10 h of immersion is a mud-crack morphology, reported by (Shibli & Gireesh, 2003; Shibli et al., 2007). Severe corrosion attacks can be seen in Figures 2(b) and (c), which show that more surface disintegration occurs, which can be anticipated from the high surface uniformity in the Al-Zn-Mg-Sn sample based on the OCP plot.
Less severe corrosion attack was observed from the Al-Zn-Mg sample because of the limited surface activation at the alloy-solution interface. According to Orozco et
al. (2007), the activation of Al-Zn-Mg alloy depends on the formation and
dissolution of the intermetallic phase presence in the alloy. If the distribution of intermetallic or secondary phase is localised, corrosion attack will take place locally and will facilitate larger particles to disintegrate from the main material, which is known as the chunk effect. This phenomenon will in turn reduce the current capacity of the material.
Figure 2: Corrosion attack morphologies for the (a) Al-Zn-Mg, (b) Al-Zn-Mg-Sn and (c) Al-Zn-Mg-Sn coated RuO2 samples after 10 h of immersion in sea water.
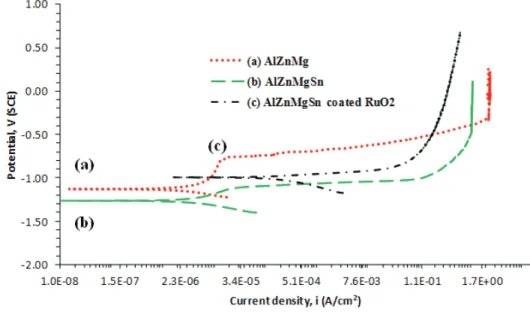
3.2 Potentiodynamic Polarisation
Figure 3 shows the polarisation curves for the aluminium alloy samples. After the
polarisation process, corrosion potential (Ecorr) for (c) was found to be more
electropositive than those of the (a) and (b) samples. This is due to the insufficient porosity ratio against the surface of substrate which impedes the charge movement, thus slowing down the electrochemical reaction at the alloy-solution interface.
However, this obstacle can be further improved or optimised by heating the RuO2 at
more electropositive corrosion potential value than that of the (b) sample, there is no indication of any passivation behaviour occurring in the dissolution process as shown by the potentiodynamic plot. This phenomena is due to the porous and loose
mud-like surface layer created by the RuO2 coating, facilitating ionic movement and
thus catalysing the active dissolution process (Shibli et al., 2007; Jingling et al., 2012).
The anodic curve for sample (a) showed a slight current plateau, which can be
ascribed from the existence of a thick passive oxide layer on the alloy surface that can restrain the ionic-electron movement. However, due to the addition of 1.5%wt Sn, both samples (b) and (c) showed a smooth anodic current, with no passivation occurring. This observation clearly shows that Sn can play a very important role in weakening the oxide layer properties of both alloys by promoting more defect sites to be attacked by aggressive anions. This observation was also in good agreement with a previous study conducted by Umoru & Ige (2007). Sample (c) showed a better anodic activation curve which indicates the systematic breakdown of the protective oxide layer on the surface of the aluminium alloy substrate. Table 4
shows that higher corrosion current (Icorr) density was observed for sample (c) as
compared to samples (a) and (b). The increase of corrosion rate for this sample is
believed to be contributed by the presence of metallic RuO2 coating on the
Al-Zn-Mg-Sn alloy surface, which has synergistic effect in mobilising the ionic species and enhancing ion-electron movement, and thus, catalysing the electrochemical process.
Figure 3: Potentiodynamic polarisation curves for the (a) Al-Zn-Mg), (b) Al-Zn-Mg-Sn and (c) Al-Zn-Mg-Sn coated RuO2 samples in sea water.
Table 4: Ecorr and Icorr values of the three aluminium alloys derived from the
potentiodynamic curves in Figure 3.
Alloys Ecorr (V vs SCE) Icorr (µA/cm2)
Al-Zn-Mg -1.130 3.00
Al-Zn-Mg-Sn -1.270 5.09
Al-Zn-Mg-Sn coated RuO2 -1.005 298.00
The higher corrosion current density for sample (c) indicates that active dissolution occurs in the system, which is usually dominated by uniform corrosion. The uniformity of corrosion attack morphology for Al-Zn-Mg-Sn has been reported by Mahdi et al. (2011), who found that Al-Zn-Mg-Sn alloys tend to form intermetallic
particles known as Mg2Sn. The presence of Mg2Sn particles in the alloy will
generate defects on the oxide layer by forming thin and weak oxide properties on the surface of the alloy. When exposed to aggressive chloride solution, this weak spot will became more vulnerable to chloride attack. This attack usually starts at the
outer passive layer on top of the Mg2Sn intermetallic particles (Jafarzadeh et al.,
2008).
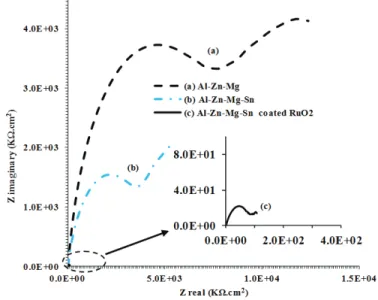
3.3 Electrochemical Impedance Spectroscopy (EIS)
EIS is a very popular method which has been increasingly employed by a number of investigators to study electrochemical properties of aluminium alloy materials (Fidel et al., 2006; Naseer & Khan, 2010; Mahdi et al., 2012). The Nyquist plots for the early stages of immersion for samples (a), (b) and (c) in Figure 4 show a similar capacitive and resistive behaviour, reflecting the characteristics of passive oxide layer at the alloy-solution interface (Shibli et al., 2007) with the plot for sample (c) exhibiting the lowest capacitive and resistive values. This means that the corrosion mechanisms of the samples are the same, except that their corrosion rates are
different.For sample (c), an active interaction of ionic species occurred at the alloy
solution interface, diffused through the alloy oxide layer (Mahdi et al., 2010). The EIS diagram in Figure 4 also shows the presence of an inductive loop in the low frequency region (from 1 to 0.01Hz) for both samples (a) and (b) which can be ascribed from high current density accumulation and aggression of ionic species at the oxide-metal interface. The activation of sample (a) was due to the presence of
fine intermetallics in the Al-Zn-Mg alloy, such as Al2Mg3Zn3 compound, which
later became active in the form of depolarisant sites that produce defective oxide film and enhance the alloy dissolution process (Bruzzone et al., 1997; Orozco et al., 2007).
For sample (b), the addition of Sn facilitated the alloy activation effect. Both samples (a) and (b) exhibited similar semicircle arc sizes, while sample (c) showed the smallest depressed capacitive loop features, which can be ascribed from the less resistive behaviour of the sample. Based on the EIS diagram, the presence of Sn in
sample (b) was found to be not very effective in contributing to the activation
process at the early stage of immersion. However, the presence of RuO2 coating
applied on the same alloy changed the impedance behaviour of the alloy by
exhibiting low resistance to polarisation (Rp).This characteristic was believed to be
due to the porous and cracked RuO2 outer layer morphology which can facilitate
and activate the electro-ionic movement process (Shibli & Gireesh, 2003; Shibli et
al., 2004, 2007). No inductive semicircle is observed for sample (c), which indicates
that the sample dissolved uniformly, without pitting attack (Hoang & Phan, 2006).
Figure 4: Nyquist plots obtained for the (a) Mg, (b) Mg-Sn and (c) Al-Zn-Mg-Sn coated RuO2 samples at initial immersion in sea water.
(Enlarged plot for sample (c) indicated by the arrow)
The Nyquist plot for sample (c) had a small distinctive capacitive loop at the high frequency region (from 10 to 100 kHz), which indicates the characteristics of the sample’s surface homogeneity. The application of catalytic coating has been
reported to suppress the formation of passive Al2O3 on aluminium alloy surfaces,
which in turn provides a suitable surface morphology for the uniform dissolution process to take place (Shibli et al., 2004, 2007, 2008).
At the low frequency region, the Nyquist plot showed a “Warburg like” behaviour, where the phase angle is constant at 45° and independent of frequency. The Warburg behaviour is the characteristic of diffusion or mass transport impedances of systems which traduce the ion penetration in the porous structure of the coatings. It also can be explained by the delay in progression of ionic movement through the
After 10 h of immersion in sea water, all three samples showed similar corrosion behaviour, but the corrosion process occurred at different rates. This can be clearly seen in Figure 5, where the smallest capacitive loop diameter was recorded by sample (c), followed by sample (b), with sample (a) having the biggest diameter. The Warburg tail behaviour was found to dominate in all three samples at the low frequency region (Liu et al., 2005). Such a situation is considered normal due to the thickening of corrosion product with incremental period of the sample exposed to aggressive chloride media. This in turn will increase electrolyte diffusion through the coated layer as stated by Skale et al. (2008).
Figure 5: Nyquist plots obtained for the (a) Mg, (b) Mg-Sn and (c) Al-Zn-Mg-Sn coated RuO2 samples at 10 h immersion in sea water.
(Enlarged plot for sample (c) indicated by the arrow)
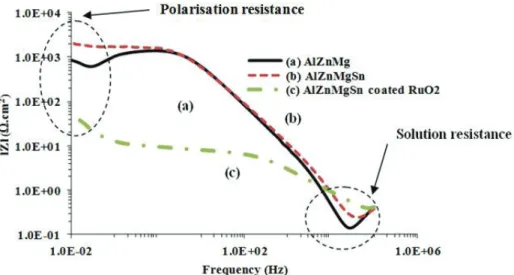
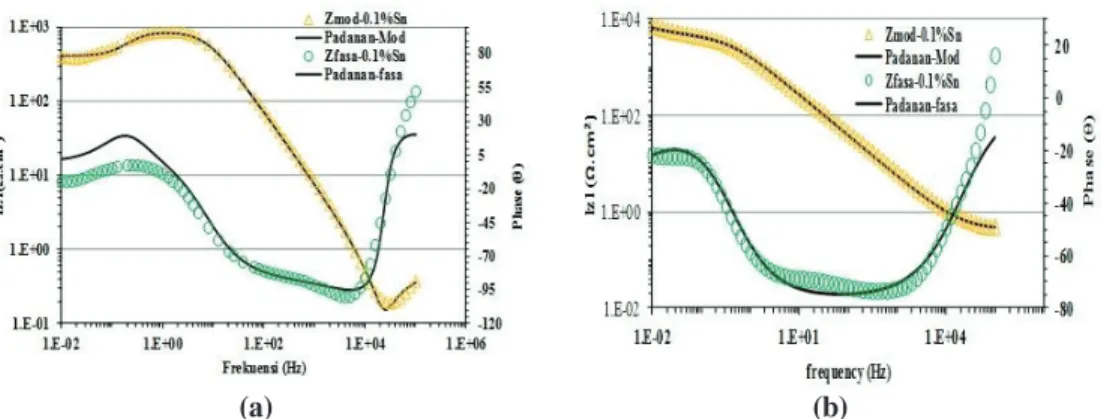
The resistive behaviour of the samples’ surfaces at initial and 10 h of immersion can be seen clearly from Bode plots shown in Figures 6 and 7 respectively. At the low
frequency region, sample (c) was found to exhibit the lowest Rp values as compared
to samples (a) and (b), as this sample is very reactive and dissolves easily in the chloride solution. This finding is in agreement with the potentiodynamic polarisation test and the corrosion morphology in Figure 2(c), which showed a loose and crack mud-like outer layer that can provide better ionic species movement and interaction for the corrosion process.
Figure 6: Bode plots obtained for the (a) Mg, (b) Mg-Sn and (c) Al-Zn-Mg-Sn coated RuO2 samples at initial immersion in sea water.
Figure 7: Bode plots obtained for the (a) Mg, (b) Mg-Sn and (c) Al-Zn-Mg-Sn coated RuO2 samples at 10 h of immersion in sea water.
Equivalent electrical circuit models (Junguang et al., 2011; Jingling et al. 2012) were proposed to simulate the electrical behaviour at the alloy-solution interface at initial and 10 h of immersion. A series of models, as shown in Figures 8-10, were employed and circuit elements, such as capacitance (C), inductance (L) and resistance (R), were introduced to ascribe the double-layer capacitance behaviour of the system. In order to obtain a more precise fitting, this capacitance element was replaced by a constant phase element (CPE). The impedance of a CPE is defined by following equation (Jingling & Jiuba, 2010):
Z(јω) = (Yo)-1 (јω)-n (1)
where Yo is the CPE constant, ј is the imaginary unit, n is the CPE power (0 < n <
1), and ω is the angular frequency (ω = 2πf, f is the frequency). The CPE is pure
capacitance when n is 1. For a capacitance element, the deviation of n from the units
is due to heterogeneous effects. In Figures 8-10, Rsol is the solution resistance used
as the electrolyte between the working and reference electrodes, CPEpo is the CPE
through pores on the RuO2 catalytic coating, Rp is polarisation resistance, CPEdl is
the CPE at substrate / passive layer interphase, Rpo is the pore resistance on the
catalytic coating, CPEpit is the CPE at pitting dissolution area, Lpit is an inductance
combined with Rpit ascribing pitting resistance due to corrosion product
accumulation at the pitted area opening, and Warburg Wpit ascribes the diffusion of
electrolytes through the catalytic coating.
(a) (b)
Figure 8: Proposed equivalent circuit model for the Al-Zn-Mg sample in sea water for (a) initial and (b) 10 h of immersion.
(a) (b)
Figure 9: Proposed equivalent circuit model for the Al-Zn-Mg-Sn sample in sea water for (a) initial and (b) 10 h of immersion.
Figure 10: Proposed equivalent circuit model for the Al-Zn-Mg-Sn sample coated with RuO2 in sea water for both initial and 10 h of immersion.
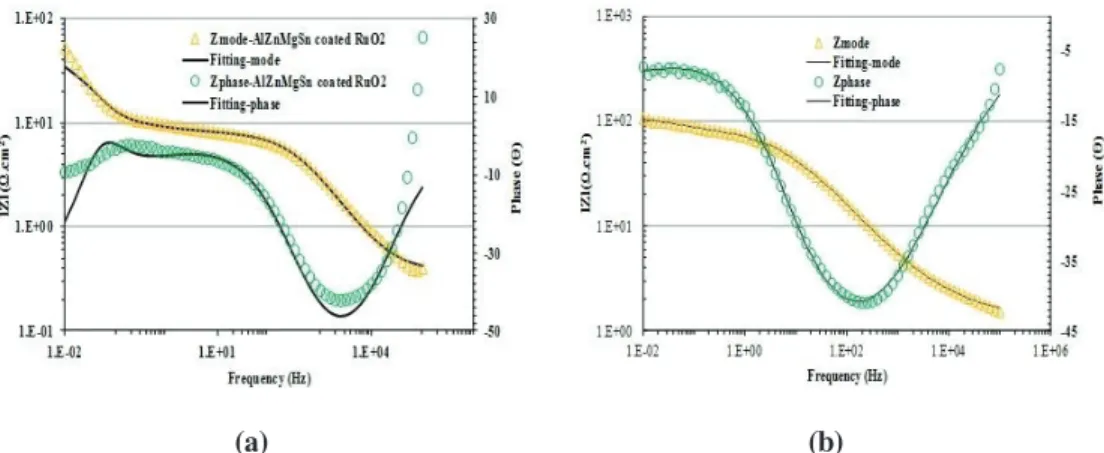
Figures 11-13 shows the experimental and fitted Bode plots for the samples exposed to sea water at initial and 10 h of immersion by using the proposed equivalent circuit models. It can be seen that there is a good correspondence between the experimental and simulated data, and it is possible to interpret that all circuit elements on the models produce significant information related to the electrical properties of the system.
(a) (b)
Figure 11: Simulated and experimental data in Bode plots for the Al-Zn-Mg sample in sea water for (a) initial and (b) 10 h of immersion.
(a) (b)
Figure 12: Simulated and experimental data in Bode plots for the Al-Zn-Mg-Sn sample in sea water for (a) initial and (b) 10 h of immersion.
(a) (b)
Figure 13: Simulated and experimental data in Bode plots for the Al-Zn-Mg-Sn coated RuO2 sample in sea water for (a) initial and (b) 10 h of immersion.
The optimised EIS modelling values for every circuit element in the circuit were obtained by using the non-linear least square (NLLS) fitting method as shown in
Table 5. The highest value of Rp was recorded for sample A. The Rp value is directly
associated with the electrochemical corrosion rate value (Jingling & Jiuba, 2010),
whereby higher Rp values indicate lower rate material dissolution occurring in the
system, which usually contributes to passivation behaviour. At initial immersion, an inductive loop at the low frequency region appears for samples A and B. The inductive loop may represent the pitting attack on corroded surface morphology (He
et al., 2011). The usage of Rpit and Lpit in the circuit is ascribed from the presence of
the pitting process in the system (Jingling & Jiuba, 2010; Jingling et al., 2012).
Table 5: Simulated EIS values for aluminium alloy in natural sea water for initial and 10 h of immersion.
Parameters Initial Immersion 10 h of immersion
A B C A B C Rsol(Ω.cm2) 1.5 2.55 0.37 0.41 0.96 1.1 Rpo(Ω.cm2) 0.66 0.14 7.77 82.7 45.5 70.8 CPEpo (µS.cm2) 1.15 6.84 0.04 0.16 2.88 0.001 npo 0.52 0.006 0.74 0.32 0.0001 0.61 Rp (Ω.cm2) 940 692 6.40 990 340 156 CPEdl (µS.cm2) 0.29 0.4 0.00003 0.58 0.01 0.05 np 0.94 0.87 0.55 0.89 0.82 0.30 Lpit 540 11200 - - - - Rpit (Ω.cm2) 615 857 - - - - W - - 0.16 0.09 0.21 2.82 CPE2 - - - - 0.22 - n2 - - - A: Al-Zn-Mg B: Al-Zn-Mg-Sn C: Al-Zn-Mg-Sn coatedRuO2
The preferred dissolution morphology was general attack rather than pitting, since pitting attack has been correlated to less than optimal performance (Ganesca & Juarez, 2000). From this study, it is clear that aggressive dissolution and uniform
attack can be achieved by using Ru as the coating material based on its low Rp value
as compared to the other samples (Table 5). The SEM image in Figure 2(c) further highlights the absence of pitting mechanism in the dissolution process by showing only a cracked surface rather than severe pitting morphology. This cracked surface further facilitates the charge movement, explaining the high corrosion current density as shown in Table 4.
4. CONCLUSION
In this study, both Sn and RuO2 have proved their role in activating aluminium
alloys in natural sea water. The presence of alloying element Sn (1.42%wt.) in the Al-Zn-Mg alloy produced voltage difference at the alloy surface due to the cathodic nature of Sn as compared to Al matrix and thus initiated corrosion attack by localised dissolution. The presence of Sn also reduced the stabilisation period of
OCP from 45 ks to only 2 ks. As for the RuO2 coated Al-Zn-Mg-Sn alloy, it
successfully overcame the tendency of localised attack or pitting corrosion on the alloy surface by acting as a good catalytic activator layer for producing uniform and continuous dissolution process with no sign of passive behaviour as indicated from the potentiodynamic measurement. The impedance study showed that the
presence of RuO2 on the alloy surface can be very useful in reducing polarisation
resistance Rp of Al-Zn-Mg-Sn alloy at the early stage of immersion and maintaining
ionic movement even after 10 h of immersion. The RuO2 coating has shown its
usefulness by modifying the electrical properties of Al-Zn-Mg-Sn oxide layer by forming a porous and loose outer layer at the surface of the alloy. Higher dissolution
rates as shown by low Rp values in this study are indicative that this type of alloy
(Al-Zn-Mg-Sn coated with RuO2) poses excellent electrochemical behaviour for
sacrificial anode material in cathodic protection systems.
ACKNOWLEDGEMENT
The authors would like to thank the Science and Technology Research Institute for Defence (STRIDE) for providing research facilities and technical assistance. We also acknowledge the academic and technical staff from the School of Materials Engineering, University Malaysia Perlis (UniMap), for technical assistance and a series of fruitful discussions. The authors also gratefully acknowledge officers and staff from the Ship Technology Branch, Maritime Technology Division, STRIDE, for their help and cooperation in completing this paper.
REFERENCES
Andrea, M., Marie-Laure, M., Samuel, P., Daniel, B. & Christille, C. (2011). Assessment of sacrificial anode impact by aluminum accumulation in mussel Mytilus edulis: A large-scale laboratory test. Mar. Pollut. Bull., 62: 2707–2713.
Barbucci, A., Cerisola, G., Bruzzone, G. & Saccone, A. (1997). Activation of aluminium anodes by the presence of intermetallic compounds.
Electrochim. Acta, 42: 2369-2380.
Bessone, J. B. ( 2006). The activation of aluminium by mercury ions in
non-aggressive media. Corros. Sci., 48: 4243 – 4256.
Bruzzone, G., Barbucci, A. & Gerisola, G.(1997). Effect of intermetallic compounds on the activation of aluminium anodes. J. Alloy Compd., 247: 210-216.
Feng,Y., Wang,, R., Yu, K., Peng, C.& Li, W. (2007). Influence of Ga and Hg on microstructure andelectrochemical corrosion behavior of Mg alloy anode materials. T. Nonferr. Metal Soc., 17: 1363-1366.
Feng, Y., Wang, R., Yu, K., Peng, C. & Li, W (2008). Influence of Ga Content on Electrochemical Behaviorof Mg-5 at%Hg Anode Materials. Mater T JIM:
Special Issue on Platform Science and Technology for Advanced Magnesium Alloys, IV, 49: 1077 - 1080.
Fidel, G., Juan, M., Ruben, D. & Genesca, J. (2006). Electrochemical study on
magnesium anodes in NaCl and CaSO4–Mg(OH)2 aqueous solutions.
Electrochim Acta, 51: 1820–1830.
He, J., Wen, J.,Li, X., Wang, G. & Xu, C.(2011). Influence of Ga and Bi on electrochemical performance of Al-Zn-Sn sacrificial anodes. T Nonferr
Metal Soc, 21: 1580-1586.
Hoang, T.B.T. & Phan, L.C. (2006). Performance of the zinc sacrificial anode in
concrete environment. 14th Asian-Pacific Corrosion Control
Conference,October 21-24, 2006, Shanghai, China.
Idusuyi, N. & Oluwole, O.O. (2012). Aluminium anode activation research - A review. Int. J. Sci. Tech., 2(8): 561-566
Umoru, L.E. & Ige, O.O. (2007). Effects of Tin on Aluminum – Zinc – Magnesium
Alloy as Sacrificial Anode in Seawater. J. Min. Mat. Charact. Eng., 7: 105-113.
Jingling, M. & Jiuba, W. (2010). Corrosion analysis of Al–Zn–In–Mg–Ti–Mn
sacrificial anode alloy. J. Alloy Compd., 496: 110–115.
Jingling, M., Jiuba, W., Wenxia, Z. & Quanan, L. (2012). In situ corrosion analysis of Al-Zn-In-Mg-Ti-Ce sacrificial anode alloy. Mater. Charact.,65: 86–92. Jiuba, W., Junguang, H. & Xianwen, L. (2011). Influence of silicon on the corrosion
behaviour of Al–Zn–In–Mg–Ti sacrificial anode. Corros. Sci., 53: 3861– 3865.
Genesca, J. & Juarez, J. (2000). Development and testing of galvanic anodes for cathodic protection. Contrib. Sci., 1: 331-343.
Junguang H., Jiuba, W. & Xudong, L. (2011). Effects of precipitates on the electrochemical performance of Al sacrificial anode. Corros. Sci., 53(5): 1948-1953.
Jafarzadeh, K., Shahrabi, T. & Hosseini, M.G. (2008). EIS Study on Pitting Corrosion of AA5083-H321 Aluminum-Magnesium Alloy in Stagnant 3.5% NaCl Solution. J. Mater. Sci. Technol., 24(2): 215-219.
Likun, X., Yonglei, X. & Juntao, W. (2009). A comparative study on IrO2–Ta2O5
coated titanium electrodes prepared with different methods. Electrochim.
Acta, 54: 1820-1825.
Liu, J., Gong, G. & Yan, C. (2005). EIS study of corrosion behaviour of organic
coating/Dacromet composite systems. Electrochim. Acta, 50: 3320–3332.
Jingling, M.A., Wen, J., Gengxin, L.I. & Chunhua, X.V. (2010). The corrosion
behaviour of Al–Zn–In–Mg–Ti alloy in NaCl solution. Corros. Sci., 52:
534–539.
Naseer, A. & Khan, A.Y. (2010). Electrochemical impedance spectroscopicstudies of thepassive layer on the surface of copper as a function of potential. Turk.
J. Chem., 34: 815 – 824.
Mahdi, C.I. Daud, A.R., Mohd Yazid, A., Daud, M., Shamsudin, S.R., Nik Hassanuddin, N.Y., Mohd Subhi, D.Y. & Mohd Moesli, M. 2012). An Electrochemical Impedance Spectroscopy Study of Al-Zn and Al-Zn-Sn Alloys in Tropical Seawater. Key Eng. Mat., 510-511: 284- 292.
Mahdi, C.I., Mohd Subhi, D.Y., Nik Hassanuddin, N.Y., Mohd Fauzi, M.N., Mohd Moesli, M., Osmera, I. & Irwan, M. (2011). Electrical characterization og As-Cast Al-Zn-Sn alloys for corrosion control application in tropical marine environment. Defence S&T Tech. Bull., 4:119-130.
Mahdi,C.I., Ahmad, M.Y. , Daud, A.R. & Daud, M. (2010). The Effect of Sn on the Impedance Behaviour of Al-Zn Alloys in Natural Chloride solution. Key
Eng. Mat., 442: 322-329.
Qingfeng, L. & Niels, J.B. (2002). Aluminum as anode for energy storage and
conversion: a review. J. Power Sources, 110:1–10.
Orozco, R. , Ganesca, J. & Juarez-Islas, J. (2007). Effect of Mg Content on the Performance of Al-Zn-Mg Sacrificial Anodes. J. Mater. Eng. Perform., 16: 229-235.
Shibli, S.M.A., Gireesh, V.S. & Sony, G. (2004). Surface catalysis based on ruthenium dioxide for effective activation of aluminium sacrificial anodes.
Corros. Sci, 46(4):819-830.
Skale, S., Dolecek, S. & Slemnik, M. (2008). Electrochemical impedance studies of corrosion protected surfaces covered by epoxy polyamide coating systems.
Prog. Or. Coat., 62: 387–392.
Shibli, S.M.A. & Gireesh, S. (2007). Electrochemical impedance spectroscopic
analysis of activation of Al–Zn alloy sacrificial anode by RuO2 catalytic
coating. Appl. Surf. Sci., 253: 7510–7515.
Shibli, S.M.A. & Gireesh, V.S. (2005). Activation of aluminium alloy sacrificial anodes by selenium. Corros. Sci., 47: 2091–2097.
Shibli, S.M.A., Gireesh, V.S. & Sony, G. (2004). Surface catalysis based on ruthenium dioxide for effective activation of aluminium sacrificial anodes.
Corros. Sci., 46: 819–830.
Shibli, S.M.A., Archana, S.R. & Muhamed Ashraf, P. (2008). Development of nano cerium oxide incorporated aluminium alloy sacrificial anode for marine applications. Corros. Sci., 50: 2232–2238.
Shibli, S.M.A. & Gireesh, V.S. (2003). Surface activation of aluminium alloy
sacrificial anodes by IrO2. Appl. Surf. Sci., 219: 203–210.
Shibli, S. M. A., Dilimon, V. S. & Saji, V. S. (2007). RuO2–TiO2 mixed oxide
composite coating for improvement of Al-alloy sacrificial anodes. J. Solid
MANAGEMENT OF NAVAL VESSELS’ ELECTROMAGNETIC
SIGNATURES: A REVIEW OF SOURCES AND
COUNTERMEASURES
Hasril Nain*, Mahdi Che Isa, Mohd Moesli Muhammad, Nik Hassanuddin Nik
Yusoff, Mohd Subhi Din Yati & Irwan Mohd Nor
Materials Research Group, Maritime Technology Division (BTM), Science & Technology Research Institute for Defence (STRIDE), Ministry of Defence,
Malaysia
*Email: [email protected]
ABSTRACT
This paper provides a broad overview of underwater electromagnetic signaturesthat are produced by naval vessels. There are four components of electromagnetic signatures on vessels, static (SE) and alternating electric (AE), and static (SM) and alternating magnetic (SM), that can be detected by sea mines.Effective measures for electromagnetic signature management are required to protect vessels from being detectedby sea mines.Techniquesthat are normally used in controlling, reducing and eliminating unwanted electromagnetic signature, including degaussing (DG), deperming, shaft grounding, cathodic protection,material choices for vessel construction and positioning of equipment in vessels,are also discussed.
Keywords: Sea mines; electromagnetic signatures; direct (DC) and alternating
(AC) current components; stray fields; electromagnetic countermeasures.
1. INTRODUCTION
One of the most effective weapons against naval vessels in littoral waters is sea mines. In the last 20 years, sea mines have damaged 17 US Navy vessels, whereas air and missile attacks have damaged only four. During the Korean War, mines laid by North Korean forces damaged 11 US naval vessels. Since World War II, sea mines have caused more damage to US warships than all other weapons systems combined (DOD, 2007). Surface vessel and submarine electromagnetic signatures have been exploited for over 80 years by mines, using both underwater and airborne surveillance systems (Holmes, 2006). This shows that seamines are an immanent threat to naval vessels. In addition to being effective, sea mines are relatively inexpensive and represent an asymmetric threat.
Seamines can be found throughout the water column and / or within seafloors, and comes in different types. Moored mines, which have been available in militaries since World War I, remains a potent weapon, having damaged the Samuel B. Roberts and USS Tripoli warships in 1988 and 1991 respectively (Morison, 1995). A moored mine floats beneath the surface of the ocean, tethered to the bottom by an anchor. It typically detonates upon direct physical contact with a vessel or through a relative influence signature mechanism. However, this type of mine has a weakness; for example, China’s EM 31and EM 32 models, are limited by the length of their mooring cables or chains to waters shallower than 200 m (Watts, 2005). This makes them easy to sweep, even by unsophisticated minesweepers, once their presence is known. Drifting mines, also known as free floating mines, are primarily used to attack medium and small surface vessels when sailing, or anchored at bridges or ports. It can be laid by military or civilian vessels. Drifting mines are not restricted by water depth or sea area, and may frequently float out of the maritime battle space, and can destroy nonbelligerent countries’ vessels. Therefore, international treaties ban the use of drifting seamines (Changsheng, 2005). Bottom mines are mines laid directly on the seabed and detonate when they sense influence signatures from vessels that satisfy their triggering criteria (Glosny, 2004). These mines are dangerous and very effective weapons,which can have vessel counting features. For
example, China’s Type 500 and 1,000 bottom mines can let up to 15 vessel
signatures pass before denoting. They also have activation delay mechanisms that allow their placement for up to 250 days before arming, and self destruction timers that can be set for up to 500 days (Hewson, 2005). This type of mine is difficult to detect and remove from waters as compared to moored mines (Hartmann & Truver, 1991). However, as these mines have limited sensing ranges and charges, they are only confined to oceans of 250 m and below (Watts, 2005).
Sea mines are often triggered by the electromagnetic field of a passing naval vessel. Simple sea mines use induction coils to sense the static magnetic field of an oncoming vessel. They have limited processing capability and hence, their ability to target specific vessels classes or avoid minesweeping measures is also very limited. Modern mines have greatly improved on the capabilities of these early mines with the introduction of thin film and fluxgate magnetometers. Modern magnetic sensors are more reliable and have a greater range (Castles, 1997). It is equipped with multichannel exploders fitted with sensors responding to such physical fields of vessels, including magnetic (induction), acoustic, hydrodynamic (pressure) and electric (Proshkin, 2011). Figure 1 shows a MR80/B sea mine which is used by the Royal Malaysian Navy (RMN) and its electronic module that consists of sensors to detect signatures of vessels. This mine is also equipped with facilities to detect and destroy underwater minesweepers that are normally operated ahead of vessels.
(a)
(b)
Figure 1: (a) A MR80/B sea mine and (b) its electronic module. LF and HF stand for low and high frequencies respectively.
(Source: RMN, 2011)
As all vessels emit electromagnetic fields, which are propagated through water, they are susceptible to being detected by underwater sensors or mines (Rodrigo & Sanchez, 1990). Therefore, electromagnetic signatures of vessels need to be kept below the safe level, which is the maximum level of electromagnetic signatures that a vessel can have in order for it to sail safely over sea mines. The safe level is dependent on sea mines’ sensitivity and distance of the vessel from seamines (RMN, 2005). Navies have been practicing various countermeasures to avoid their vessels from detected by sea mines, which take the form of devices to substantially eliminate static and alternating components of electromagnetic signatures, thereby
removing the mine’s ability to classify the vessel’s electromagnetic signatures
This paper will discuss the importances of the electromagnetic signature management for vessels. It will provide a broad overview of underwater electromagnetic signatures that are produced by naval vessels. The techniques normally used for controlling, reducing and eliminating unwanted electromagnetic signature by navies in order to protect vessels from sea mines are also discussed.
2. ELECTROMAGNETIC SIGNATURES FIELD
Underwater electromagnetic signature fields can be separated into four components (Figure 2): two direct current (DC) terms, static electric (SE) and magnetic (SM); and two alternating current (AC) terms, alternating electric (AE) and magnetic (AM).
Figure 2: Underwater electromagnetic signatures of a naval vessel. (Adapted from McElman (2007))
2.1 DC Components
SE is referred to as underwater electric potential (UEP) and is characterised by its amplitude, which as observed from a static sensor, is almost constant (while the SE field magnitude remains constant, the effect of variable distance for the vessel in movement implies that the magnitude of the field measured by the sensor varies slightly with time). The range of considered frequencies is typically lower than 2 Hz (Rodrigo & Sanchez, 1990). The SE signature is associated with electric currents in connection with the electric field caused by corrosion currents coupled with the magnetic field, which is called the corrosion related magnetic (CRM) signature (Birsan, 2010). SE signatures arise from the creation of electric dipoles along the hulls of vessels (bare steel, anodes and propellers) (Figure 3), as well as currents in seawater from the movement of ions from anodic sources of dissimilar metals (steel in hull and hull appendages) and impressed current cathodic protection (ICCP) anodes to cathodic sources of dissimilar metals (sodium bromide and other metals in propellers) (Diaz et al., 2001).
Figure 3: SE signatures on the hull of a vessel. (Source: Birsan (2010))
The SM field arises from the disturbance of the earth’s magnetic field when a vessel with significant ferrous content is placed in it. There are two major components of this SM field source (Holmes, 2006):
1. Induced magnetism from the ferrous content of the ship (permeability), the earth’s magnetic field, and the shape and orientation of the vessel in the magnetic’s field. If the magnetic permeability is very high, the material is ferromagnetic. These factors cause the ferrous material on
vessel to act as a magnet in the presence of the earth’s magnetic field.
The higher permeability and / or stronger the earth’s magnetic field, the
stronger the magnet. The shape and orientation of the vessel also tend to enhance induced magnetism. Longer vessels which are parallel to the earth’s magnetic field can also create stronger magnetism.
2. Permanent magnetism of the vessel which was created inadvertently
during construction of the ship, changed inadvertently during rough travelling and combat operations, and / or changed purposefully during the vessel’s magnetic treatments.
Another source of the SM field is hull structure magnetic signature due to currents returning through the hull structure. This SM signature arises from the return flow currents in the shaft and hull structure from the propeller to the anodic sources (steel in hull and hull appendages, sacrificial anodes, and / or ICCP power supplies) (Figure 4). The SM field is also caused by CRM signatures from the creation of currents in seawater from the of ions from anodic sources and ICCP anodes to cathodic sources.
Figure 4: SM signature created by return current flow. (Source: Mason (2009))
2.2 AC Components
The AE field, known as extremely low frequency electric (ELFE) field, arises due to the changing resistance between the shaft and hull as the propeller rotates. This resistance causes modulation of the current in the shaft and hull, with all of these components modulating at the same harmonic frequencies (Torrance, 2005). This source also contributes to AM signatures (Holmes, 2006).
The current ripple of the output of the ICCP’s power supply is also one of the
contributors of the AE and AM fields. These signatures arise from the modulating effect of the output current being injected into seawater from the ICCP anodes. The current modulation causes modulating AE and AM signatures at the same frequencies as the current ripple and harmonics (Diaz &Tims, 1999).
AM signatures occur when a vessel with significant continuous conductive surface areas is moving in the Earth’s magnetic field in a such a way as to change the conductive area perpendicular to the direction of the magnetic field. This creates eddy currents in the conductive surfaces, which in turn, creates magnetic fields much like current through coils. These currents are alternating, creating AM fields (Figure 5).
Figure 5: Eddy current flow induced in a vessel’s conducting hull due to its roll in the earth’s magnetic field.
(Source: Holmes (2008))
There are two major contributors to the AM field source (Holmes, 2006):
1. The rolling and pitching of the vessel. The pitching of the vessel causes the magnetic field in the vertical and longitudinal directions to change, where the vertical field increases and the longitudinal field decreases during bow upward pitching movement on a north heading. The rolling of the ship causes the magnetic fields in the vertical and athwartship directions to change as a function of the angle of the roll.
2. Orientation and location of the vessel in the earth’s magnetic field
(latitude and heading). The vertical magnetisation remains constant within the same degree of latitude during course tracking, provided that there is a calm sea. The athwartship magnetisation changes with the vessel’s course with maximum values for east and west headings, and zero crossings for north and south headings. On the other hand, longitudinal magnetisation has maximum values for north and south headings, and zero crossings for east and west headings.
2.3 Stray Fields
The last of electromagnetic sources on vessels is called the stray field. This field exists in entire fields of SE, AE, SM and AM. Stray field signatures are produced by any current carrying electric circuit found on board a vessel. Larger stray fields are produced by the electro-mechanical machinery and power distribution system of the vessel. High power electric generators, motors, switchgear and breakers, and distribution cables are also main contributors of the field (Holmes, 2006). These
equipment produce currents during operation and increase the vessel’s electromagnetic signatures.
3. ELECTROMAGNETIC SIGNATURE COUNTERMEASURES
One way to reduce the electromagnetic signatures of a vessel is to eliminate the respective sources or to provide a suitable system to protect them from unwanted electromagnetic influences (Holmes, 2006). A number of techniques exist that are designed to eliminate or reduce electromagnetic signatures of vessels in order to avoid detection or triggering a sea mine. This section will discuss the key methods to evade magnetic detection.
3.1 Degaussing (DG)
DG is the name given to the process of counteracting a vessel’s magnetic field by
using electromagnetic coils to generate a field equal but opposite to the natural magnetic signature (Davidson et al., 1998). The application of DG systems started during World War II to protect naval vessels from magnetic mines and torpedoes (BHE, 2009). Recovery of one of the mines confirmed that the firing mechanism
was triggered by a vessel’s magnetic field and hence, the race to develop signature
reduction technologies, such as DG systems, ensued within the British Admiralty and later, the US Navy. By the end of the war, more than 12,600 military and merchant vessels in the US fleet were equipped with DG systems (Poteete, 2010). Shipboard DG systems are composed of loops of electric cables that, when
energised with proper current, can cancel or reduce a vessel’s magnetic signature.
Initially, these systems were designed only to compensate induced and permanent magnetisation. A DG system must be able to compensate the three orthogonal components of vessel magnetisation, longitudinal (L), athwartship (A) and vertical (V) (Figure 6), independently from each other. There are two types of DG coils, VAL (vertical, athwartship, longitudinal) and MFQ (main, forecastle, quarter-deck). VAL DG coils are suitable for vessels that berth or sail in equatorial regions, while MFQ DG coils are suitable for the northern and southern regions. Advanced DG methods take this process one step further by increasing the number of on-board DG coils, and using sensors to measure the magnetic field of the vessel and actively eliminating it. In order to measure the magnetic field of a vessel at a DG range facility, the vessel is moved over the sensor arrays at constant speed at fixed headings. As the ship passes, the sensors are scanned at regular intervals and measurement data of magnetic signatures are obtained. Computer technology can therefore correct for the changes that occur over time to the magnetism of the vessel by adjusting the number of coils in on-board DG coils (MOD, 2008)
Figure 6: Coordinate system of a vessel’s magnetisation. (Source: Birsan (2008))
The Lumut RMN base has a DG range facility to counter the magnetic influence of warships (Figure 7). The DG range is designed with two overrun ranges, measuring at 9 and and 18 m. The 9 m range is used for small vessels, while the 18 m range is used for large vessels. The system can be divided into three main components; offshore, onshore, and communications and navigation system. The offshore components consist of six tri-axis underwater sensors, three magnetic sensors for the 9 m range with 9 m depth from the sea surface, and two magnetic sensors for the 18 m range with 18 m depth. A pressure sensor is placed at 5 m depth to measure the depth of ranging during measurements. The onshore equipment consists of an electronic cabinet and computer, including the DG software, while the communications and navigation system contains a differential Global Positioning System (DGPS) system with laptop and very high frequency (VHF) radio (RMN, 2003. 2005).
Before the degaussing process is started, the DGPS system has to be installed on the vessel to monitor the vessel’s movement over the sensors. The DG system onboard must be inspected by an authorised technician before performing magnetic measurement and treatment on the DG range. The magnetic signature of the vessel is captured by the sensors as the vessel passes over the sensor array. The vessel will pass over the sensor array from north to south and south to north headings in order to get the primary electromagnetic signature before the treatment process is implemented. Normally, the DG process takes a number of hours or days; for example, a newly built or refitted vessel will take about five days to complete. However, the availability of the DG system onboard is a main factor to achieve a minimum or required signature. Some vessels still using analog type DG systems instead of computerised systems. In this case, the DG technician needs to adjust the
coils at each junction box located at different places onboard the vessel as required during magnetic ranging. The DG officer will inform the technician on the locations and number of coils that need to be adjusted according to the DG software’s recommendation at the onshore laboratory. In comparion, for computerised DG systems, the technician only changes the number and current value of DG coils on the DG system controller that is located onboard the vessel. The underwater sensors need to be cleaned frequently due to marine borers, which can damage the sensors and affect the measurement results. The navigation system for the DG range is also of high concern, as the measurement cannot be implemented if the DGPS signal is too weak, such as due to poor weather conditions, such heavy rain or cloudy (RMN, 2003, 2005).
Figure 7:The DG range facility at the Lumut RMN base. (Adapted from RMN (2003))
The major drawback of DG systems is the requirement to monitor changes in the vessel’s magnetic source strength and to reoptimisethe compensation system’s settings. Once a vessel has been degaussed and leaves the facility, it must monitor
and maintain its magnetic level state throughout normal operations. Since a vessel’s
induced magnetisation changes with its orientation within the earth’s local magnetic field, a DG system controller must monitor its location and orientation. Changes in a vessel’s permanent magnetisation are the most difficult of the important magnetic field sources to monitor and keep well compensated within a DG system (Holmes, 2008). Frequent ranging of a DG system will prevent the permanent signature from drifting too far astray from specifications. The RMN requires that large vessels, such as frigates, should be degaussed every six months, and every three months for small vessels (RMN, 1986).
3.2 Deperming
All modern vessels, being constructed largely of steel, have permanent magnetic fields surrounding the vessels. Hence, simple induction coils in both older mines and magnetometers in modern mines are equipped to detect magnetic fields surrounding large vessels. Techniques exist to reduce the permanent magnetism of ships through deperming. Most countries typically perform deperming of their vessels by passing large currents through coils temporarily rigged over the exterior of the hull when alongside or docked (Figure 8). Deperming is a one-off treatment, performed once or twice a year that involves altering the permanent magnetism in ships, submarines or other military vehicles (MacBain, 1993). The aim of deperming a vessel is to erase any magnetic history, minimise permanent longitudinal (bow to stern) magnetisation (PLM) and optimise permanent vertical magnetisation (PVM) for the anticipated region of operation. The latter objective involves donating a specific PVM that is designed to counteract the induced vertical
magnetisation (IVM) in the relevant magnetic zone of the earth’s magnetic field
(Figure 9). This will aid the DG coils concerned with minimising vertical magnetisation, and consequently reduce the amount of power required. However, a deperm process, including the preparation, is time consuming, labour intensive and expensive.(Bayneset al., 2002).
Figure 8: A submarine being depermed at a magnetic treatment facility. (Source: Holmes (2008))
Figure 9: A submarine in a magnetic treatment facility being wrapped with an X coil to minimise PLM. The Z coil cable is used to minimise IVM.
(Source: Baynes et al.(2002))
3.3 Shaft Grounding
The presence of underwater SE and AE fields has been known for some time and it has been standard practice in many countries to fit their vessels with passive grounding systems. The system generally consists of a brush and slip ring assembly that connects the shaft directly to the hull of the vessel. It provides for a lower resistance to the ground for current passing through the shaft, thus eliminating some of the variations in resistance as the shaft turns (Figure 10). However, such passive systems do not eliminate all of the variations in the field. Furthermore, brush and slip ring assemblies tend to degrade greatly over time, particularly if maintenance is poor, and as a result, the benefits are lost (Birsan, 2009).
A more effective approach to managing current flow through the shaft of a vessel is through the use of an active shaft grounding (ASG) system (Figure 11). This system uses electronics to compensate for changes in shaft to hull resistance, thereby eliminating the modulation of the shaft current. It operates by using slip-ring sensors to measure the shaft to hull potential of the ship. By determining the variations in the current in the shaft, electronics in the ASG make use of a high current power supply to draw a proportional current through a second slip ring assembly. The ASG device therefore acts as a current bypass for the shaft bearings and seals. The fluctuations in the shaft current are thus eliminated and hence, the AE and AM portions of the electromagnetic signature due to shaft current modulation are eliminated (Thompson et al., 2000)