The SH2 Domain Interaction Landscape
Michele Tinti,1,10Lars Kiemer,1Stefano Costa,1Martin L. Miller,2Francesca Sacco,1Jesper V. Olsen,3,4
Martina Carducci,1Serena Paoluzi,1Francesca Langone,1Christopher T. Workman,2Nikolaj Blom,2,5Kazuya Machida,6 Christopher M. Thompson,6Mike Schutkowski,7,8Søren Brunak,2,4Matthias Mann,3,4Bruce J. Mayer,6Luisa Castagnoli,1 and Gianni Cesareni1,9,*
1Department of Biology, University of Rome Tor Vergata, I-00133 Rome, Italy
2Center for Biological Sequence Analysis, Technical University of Denmark, DK-2800 Lyngby, Denmark
3Department of Proteomics and Signal Transduction, Max-Planck Institute for Biochemistry, Am Klopferspitz 18, D-82152 Martinsried, Germany
4Novo Nordisk Foundation Center for Protein Research, Faculty of Health and Medical Sciences, University of Copenhagen, Blegdamsvej 3b, DK-2200 Copenhagen, Denmark
5Novo Nordisk Foundation Center for Biosustainability, Technical University of Denmark, Kogle Alle 6, DK-2970 Hørsholm, Denmark 6Department of Genetics and Developmental Biology, Raymond and Beverly Sackler Laboratory of Genetics and Molecular Medicine, University of Connecticut Health Center, Farmington, CT 06030, USA
7JPT Peptide Technologies GmBH, Volmerstrasse 5, 12489 Berlin, Germany
8Institute of Biochemistry and Biotechnology, Department of Enzymology, Martin Luther University Halle-Wittenberg, Kurt-Mothes-Strasse 3, 06120 Halle, Germany
9Istituto Ricovero e Cura a Carattere Scientifico, Fondazione Santa Lucia, Via Ardeatina, 306, 00179 Rome, Italy
10Present address: MRC Protein Phosphorylation Unit, Faculty of Life Sciences, University of Dundee, Dundee DD1 4HN, Scotland, UK *Correspondence:[email protected]
http://dx.doi.org/10.1016/j.celrep.2013.03.001
SUMMARY
Members of the SH2 domain family modulate signal
transduction by binding to short peptides containing
phosphorylated tyrosines. Each domain displays
a distinct preference for the sequence context of
the phosphorylated residue. We have developed
a high-density peptide chip technology that allows
for probing of the affinity of most SH2 domains for
a large fraction of the entire complement of tyrosine
phosphopeptides in the human proteome. Using
this technique, we have experimentally identified
thousands of putative SH2-peptide interactions for
more than 70 different SH2 domains. By integrating
this rich data set with orthogonal context-specific
information, we have assembled an SH2-mediated
probabilistic interaction network, which we make
available as a community resource in the PepspotDB
database. A predicted dynamic interaction between
the SH2 domains of the tyrosine phosphatase SHP2
and the phosphorylated tyrosine in the extracellular
signal-regulated kinase activation loop was validated
by experiments in living cells.
INTRODUCTION
Posttranslational modifications (PTMs) and modular protein domains underlie dynamic protein interaction networks and represent one of the key organizing principles in cellular systems (Pawson, 2004). In particular, kinases modulate cell response to growth signals by adding phosphate groups to short linear sequence motifs in their substrates. These
phos-phorylated residues in turn serve as docking sites for proteins containing phospho-binding modules such as the SH2, PTB, and BRCT domains (Yaffe, 2002). The SH2 domain family includes a total of 120 domains in 110 proteins and, as such, represents the largest class of tyrosine phosphopeptide recog-nition domains (Liu et al., 2006). The peptide recognition prefer-ence of each member of this large domain family has been the subject of a number of studies with genome-wide perspectives. The pioneering work of Cantley’s group exploited oriented peptide libraries to characterize the preference for specific resi-dues in the positions flanking the phosphorylated tyrosine in the targets of 14 SH2 domains (Songyang et al., 1993). Machida and collaborators used a far-western approach and a new strategy termed ‘‘reverse-phase protein array’’ to profile nearly the full complement of the SH2 domain family (Machida et al., 2007). This strategy allowed for the classification of SH2 domains according to their ability to bind classes of phosphor-ylated proteins, but lacked sufficient resolution to precisely define recognition specificity and to permit the identification of the targets of each SH2-containing protein. Another approach exploited OPAL, a variant of the oriented peptide library approach, to derive position-specific scoring matrices for 76 of the 120 human SH2 domains (Huang et al., 2008). Finally, the full complement of human SH2 domains was ar-rayed on glass chips and probed with a collection of phospho-tyrosine peptides from the ErbB receptor family (Jones et al., 2006). This latter strategy offers the advantages of directly ad-dressing the interactions with specific phosphopeptides from the human proteome and of being amenable to quantitative analysis. However, the throughput of its present implementa-tion does not permit screening of the entire human phospho-proteome. These approaches have represented a considerable advancement in our understanding of the recognition specificity within this domain family, and together they have contributed to
the characterization of approximately two-thirds of the SH2 domains.
We have addressed the problem from a different angle by developing and exploiting a new technology that permits us to probe the recognition specificity of each phosphotyrosine binding domain on a high-density peptide chip containing nearly the full complement of tyrosine phosphopeptides in the human proteome. In addition, we integrate these in vitro experimental data with orthogonal genome-wide data sets to propose an SH2-mediated probabilistic interaction network that takes into account both in vitro affinity data and in vivo contextual evidence. Finally, we have captured from the published literature more than 800 pieces of experimental evidence pertaining to SH2 recognition specificity, and we have used this information as a gold standard to benchmark our predictors.
Our strategy combines harnessing the strengths of a powerful experimental assay and integrating its quantitative output with a wide range of orthogonal genome-wide context information. The raw experimental data and the probabilistic network can be accessed and explored in the context of the SH2 domain interaction curated from the literature in a new publicly available resource, the Pepspot database (PepspotDB; http://mint.bio. uniroma2.it/PepspotDB/home.seam).
RESULTS AND DISCUSSION
Phosphotyrosine Peptide Chips: A Nearly Complete Complement of the Human Phosphotyrosine Proteome The SPOT synthesis approach (Frank, 1992) is based on the ability to synthesize a few thousand oligopeptides in an ordered array on a cellulose membrane. This approach has been used extensively to study protein interactions when one of the part-ners can be represented as a short unconstrained peptide. For this project, we have moved forward the approach by increasing by approximately one order of magnitude the number of peptides that can be tested in a single experiment (Figure 1). This is based on the ability to (1) synthesize several thousands of peptides by spatially addressed SPOT synthesis, (2) punch-press the peptide spots into wells of microtiter plates, (3) release peptides from the resulting cellulose discs, and (4) print them onto aldehyde-modified glass surfaces, which results in high-density peptide chips displaying the probes in three identical replicates.
The tyrosine phosphopeptide chip (pTyr-chip) used in this work was initially designed to represent most of the phospho-proteome known when this project started. At that time, the Phospho.ELM (Diella et al., 2008) and PhosphoSite (Hornbeck et al., 2004) databases contained 2,198 tyrosine phosphopep-tides. This collection of experimentally determined phospho-peptides was completed with approximately 4,000 additional peptides having a high probability of being phosphorylated ac-cording to the NetPhos predictor (Blom et al., 1999). Overall, 6,202 phosphopeptides, 13 residues long with the tyrosine phosphopeptide in the middle position, were printed in tripli-cate with the appropriate controls (Table S1). Each pTyr-chip can be used to profile the recognition specificity of a phospho-tyrosine binding domain fused to a tag and revealed with an anti-tag fluorescent antibody.
Profiling the Recognition Specificity of the SH2 Domain Family
The pTyr-chips were used to profile a collection of 99 human SH2 domains fused to glutathione S-transferase (GST) (Table S2) (Machida et al., 2007). Experimental reproducibility ranged from 0.7 to 0.99 Pearson’s correlation coefficient (PCC), with most results being well over 0.95, when two replica arrays are compared (intrachip reproducibility), and of approximately 0.95 in two independent experiments carried out with two different preparations of the same domain (interchip reproducibility) (see Figure S1;Table S3).
Among the 99 domains in the collection, 26 did not express as a soluble product and 3 gave a poor signal in the peptide chip assay. Only experiments with replica arrays having a PCC higher than 0.7 were considered for further analysis. Overall, 70 domains gave a satisfactory result by this approach. The speci-ficity of 15 of them had, to our knowledge, never been described before.
The sequences of the peptides whose binding signal ex-ceeded the average signal by more than two SDs (Z score > 2) were aligned and used to draw sequence logos illustrating the preferred binding motif of each domain (Figure 2).
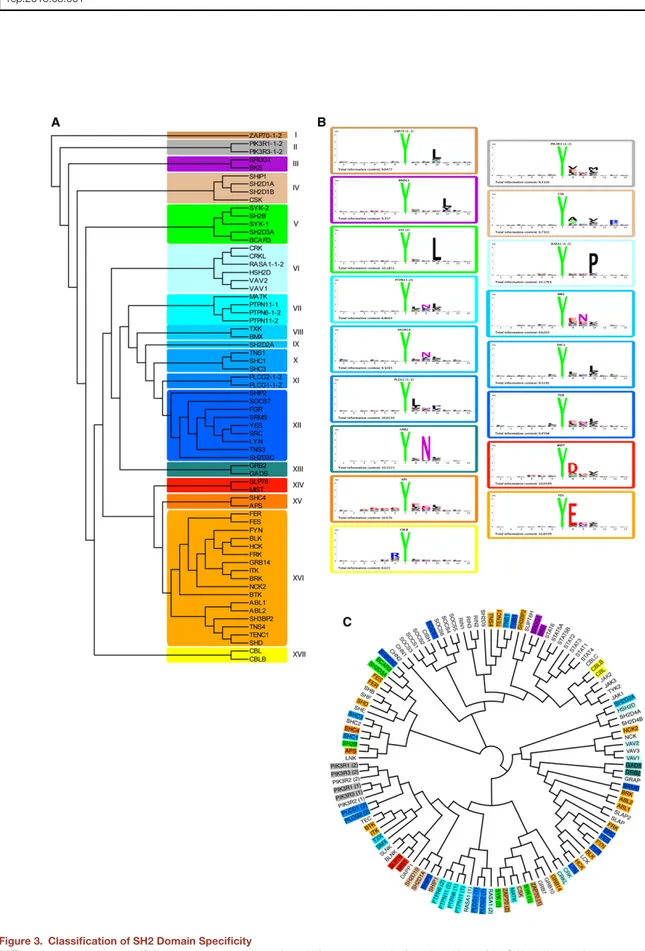
Differently from what has been recently described for PDZ, SH3, and WW domains (Gfeller et al., 2011), we could not find evidence for multiple specificities for any of the character-ized SH2 domains. The results of the profiling experiments were used to cluster the domains according to their preference for phosphotyrosine sequence context (Figure 3A). Based on the resulting tree, we arbitrarily define 17 specificity classes characterized by representative amino acid sequence logos (Figure 3B). InFigure 3C, we have drawn a second tree where SH2 domains are clustered according to homology in their primary sequence. Specificity class membership is illustrated by background colors matching the colors in Figure 3A. Although closely related domains tend to be members of the same class, the correlation between sequence homology over the whole domain and peptide recognition specificity is overall poor (PCC = 0.30;Figure S2). This is consistent with the results of Machida and collaborators (Machida et al., 2007), who failed to identify a correlation between domain sequence and band patterns in far-western type experiments. Attempts to identify diagnostic residues that would help assign uncharacterized domains to specificity classes using MultiHar-mony software (Brandt et al., 2010) have not been successful. The finding that little divergence in sequence homology can account for relatively large changes in binding specificity is consistent with the reported observations that a few amino acid changes are sufficient to induce a specificity shift in peptide recognition modules such as SH2, SH3, and PDZ (Ernst et al., 2009; Marengere et al., 1994;Panni et al., 2002) and has implications for the interpretation of the observed rapid evolution of protein interaction networks (Kiemer and Ce-sareni, 2007).
Liu and collaborators have proposed that nonpermissive amino acid residues that oppose binding could play a role in shaping SH2 domain recognition specificity (Liu et al., 2010). We have confirmed that some SH2 ligands dislike specific residues at specific positions (Figure S3). However,
our comprehensive analysis failed to confirm that negative selection could play a prominent role in modulating pep-tide recognition specificity within the defined specificity classes.
ANN Predictors of SH2 Binding
The pTyr-chip used in this work was initially designed to contain most of the human phosphotyrosine peptides that were known at the start of this project. However, recent developments in
Figure 1. Schematic Illustration of the Strategy Used to Draw an SH2-Mediated Protein Interaction Network
mass spectrometry-based technology have caused an explo-sion of information, and the collection of phosphorylated peptides contained in databases (Diella et al., 2008;Hornbeck et al., 2004) now significantly exceeds the number of experimen-tally verified peptides represented in our array. Thus, in order to be able to offer a resource that could reliably infer the SH2 ligands of any recently discovered phosphopeptide, we devel-oped artificial neural network (ANN) predictors (NetSH2) for each of the 70 profiled SH2 domains (see Experimental Procedures).
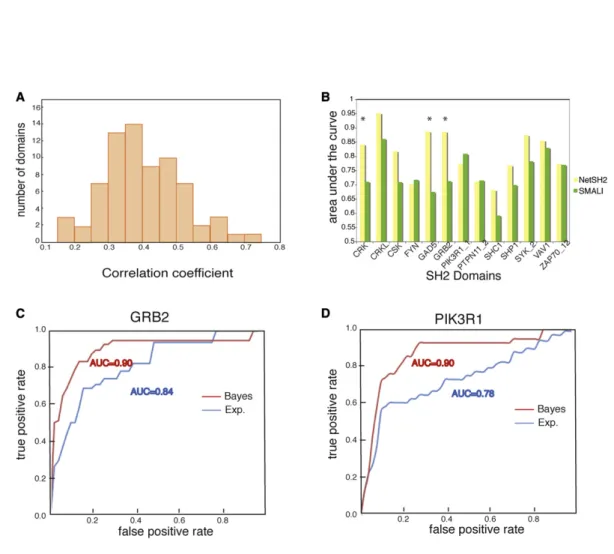
To utilize all the information from pTyr-chips, the peptide sequences and normalized log-ratio intensities were used as input for the ANN. In this way, we trained the ANNs to predict if a given peptide is a weak or strong binder of a specific SH2 domain. In total, 70 predictors were trained with an average PCC of 0.4 (Figure 4). These predictors have been integrated in the Netphorest community resource (Miller et al., 2008). Benchmarking the SH2 ANN Predictors
An independent large-scale effort has investigated the substrate specificities of SH2 domains using oriented peptide libraries (Huang et al., 2008). The results are available in a resource, termed SMALI (scoring matrix-assisted ligand identification), which uses position-specific scoring matrices (PSSMs) to predict ligands of 76 different SH2 domains. The main difference between PSSMs and ANNs is that the latter can capture nonlinear correlations between residues. In order to compare the performance of SMALI to the ANN developed here, we compiled an independent benchmark data set of the known in vivo ligands of SH2 domains. For this purpose, the information from the MINT database was supplemented with new interac-tions captured by an extensive search and curation of published information (see Experimental Procedures). The integrated interaction list (see Table S4andFigure S4) was used as the ‘‘positive’’ benchmarking data set, while the ‘‘negative’’ data set consisted of phosphotyrosine peptides from the Phos-pho.ELM database (Diella et al., 2008) that had not been shown to bind any SH2 domain. After discarding benchmark peptides that were more than 90% identical to the ANN training data (seeExperimental Procedures), we evaluated the performance of each predictor based on their receiver operating characteristic (ROC) curves, which show sensitivity as function of false-positive rate. We summarized each curve in a single number, the area under the receiver operating characteristic curve (AROC), which is a convenient performance measure because it does not depend on defining a threshold to separate positive predictions from negative ones. Provided that at least eight positive exam-ples were left, we were able to benchmark 13 ANN and SMALI predictors with an average AROC of 0.81 and 0.74, respectively (Figure 4B). Since random performance corresponds to an AROC of 0.5, both methods perform well in predicting in vivo ligands of SH2 domains, even though the data used to develop the methods were based on in vitro screens. However, NetSH2
has a competitive advantage because it is based on a larger experimental data set and exploits a higher-order machine learning, which in part can capture the complexity in the interac-tion motifs that guide SH2-ligand binding.
Functional Prediction by Integration of Contextual Information
While the ANN predictors of NetSH2 accurately capture and model the actual binding site in a narrow sequence window, they do not take into consideration evidence of the functional relevance of the inferred SH2-mediated complex in a physiolog-ical context. Thus, we integrated an additional prediction layer to accommodate functional information (Linding et al., 2007). To this end, we developed a ‘‘functional’’ confidence score that was obtained by integrating, by a naive Bayes approach, different contextual evidence. The contextual features that were considered included (1) cellular colocalization, (2) tissue coexpression, (3) predicted order/disorder, (4) degree of conser-vation of the sequence of the peptide target in related species, and (5) graph distance between the supposedly interacting proteins in the human interactome. All of the considered features contributed to a different extent to the performance of the predictor (seeFigure S5). The efficiency of the Bayesian predic-tors, as compared with the ANN predictor, was evaluated by drawing ROC curves and by calculating the AROC. Although this analysis is statistically meaningful only for the few SH2 domains for which the ‘‘gold standard’’ of bona fide in vivo inter-actors is sufficiently large, we can conclude that, in general, the Bayesian predictor performs better than or equally as well as the experimental score. The results of this analysis for two different domains are displayed in Figures 4C and 4D. In the case of PIK3R1 and GRB2, the Bayesian predictors clearly outperform the ‘‘experimental’’ predictors (p values of 0.0006 and 0.1, respectively). Bayesian functional scores were calculated for all possible SH2 domain-phosphopeptide pairs; a total of 955,010 scores were stored in PepspotDB, along with the information that was used to calculate the score.
PepspotDB: A Database for the Storage and Analysis of Experiments based on Peptide Chip Technology
The SH2 interactome project yielded a large number of experi-mental and computationally derived data points. To cope with the associated data management challenge and facilitate the fruition of the data and the integration with published information in a single integrated resource, we have developed a new publicly accessible database, PepspotDB (http://mint.bio.uniroma2.it/ PepspotDB/home.seam) (see alsoFigure S6;Table S6).
PepspotDB contains four main data types: (1) raw and pro-cessed experimental data points; (2) neural network predictions; (3) literature curated interactions; and (4) Bayesian context scores. In addition, PepspotDB is tightly integrated with the protein-protein interaction database MINT (Licata et al., 2012). All the neural network binding predictions on a set of !13,600
Figure 2. Sequence Logos Representing the Recognition Specificity of the SH2 Domain Family
For each SH2 domain, the peptides whose binding signal was higher than the average signal plus 2 SDs were aligned on the phosphorylated tyrosine. These peptides were used to draw the peptide logos by a logo drawing tool implemented in PepspotDB (seeExtended ResultsinSupplemental Information). Domain logos of the same specificity class are framed in identical colors. The logo total information content is also indicated in each frame. See alsoTable S2.
Figure 3. Classification of SH2 Domain Specificity
(A) To draw the recognition specificity tree, we computed the amino acid frequency at each of the13 positions of the SH2 binding peptides to compile a 73 (SH2 domains) 3 240 (12 positions 3 20 amino acids) matrix describing the domain specificity as amino acid frequencies at each of the 12 positions. We excluded from the analysis the peptide position corresponding to the invariant phosphotyrosine. This matrix was used as input for EPCLUST (http://www.bioinf.ebc.ee/EP/EP/ EPCLUST/) to cluster the domains by using the algorithm ‘‘linear coefficient based distance, Pearson centered.’’ We next chose an arbitrary branch depth to identify the 17 specificity classes highlighted with different colors in the figure.
phosphopeptides retrieved from the PhosphoSite (Hornbeck et al., 2004) and Phospho.ELM databases (Diella et al., 2008) are also stored in the PepspotDB. Among the nearly one million possible combinations of the 70 SH2-containing proteins and 13,600 phosphorylated tyrosine peptides, some 10,580 interac-tions are supported by some signal observed in the peptide chip experiment and 49,175 are computationally predicted by the neural network algorithm, the overlap being 4,207 interactions. This latter set of domain-peptide interactions with both experi-mental and computational support is enriched in interactions confirmed by published experiments (p value < 1.11$10"16by
the hypergeometric test) and can thus be deemed high confidence.
PepspotDB comes with a rich web application providing a user-friendly interface for easy information retrieval. The
infor-mation provided with each retrieved interaction includes exper-imental, computational and contextual evidence supporting the interaction, cross-references to MINT records describing an interaction between the domain-containing protein and the peptide-containing protein, and links to published articles re-porting the currently displayed domain-peptide interaction. Query results can be downloaded in text format for further anal-ysis. SeeExtended Resultsfor a more detailed description of the database and a guide to its use.
Experimental Validation by Phosphopeptide Pull-Down In order to validate the prediction based on peptide chip exper-iments, we used 57 synthetic phosphopeptides linked to magnetic beads to affinity-purify ligand proteins from extracts of HeLa cells stimulated with epidermal growth factor (EGF). (B) Amino acid logos for one representative domain for each specificity class.
(C) The SH2 domain sequences were aligned with the ClustalW algorithm (4) and the homology tree was drawn with the FigTree program (http://tree.bio.ed.ac.uk/ software/figtree1). Each domain name is highlighted with a background color corresponding to the specificity class in (A).
See alsoTable S3.
Figure 4. Benchmarking NetSH2 Predictors
(A) Distribution of the PCCs of the 70 NetSH2 predictors.
(B) Comparison of the AROC of 13 pairs of predictors tested against a literature-curated data set. Green bars represent the AROC of the SMALI PSSM predictors, while yellow bars are the AROC of the NetSH2 predictors presented here. *p < 0.05 (seeExperimental Procedures).
(C and D) ROC curve obtained by plotting true positives versus false positives at a varying experimental (blue) or Bayesian (red) score using as a gold standard a set of experimentally validated interactions extracted from the literature. The number of the gold standard interactions for PI3K and GRB2 were 31 and 24, respectively.
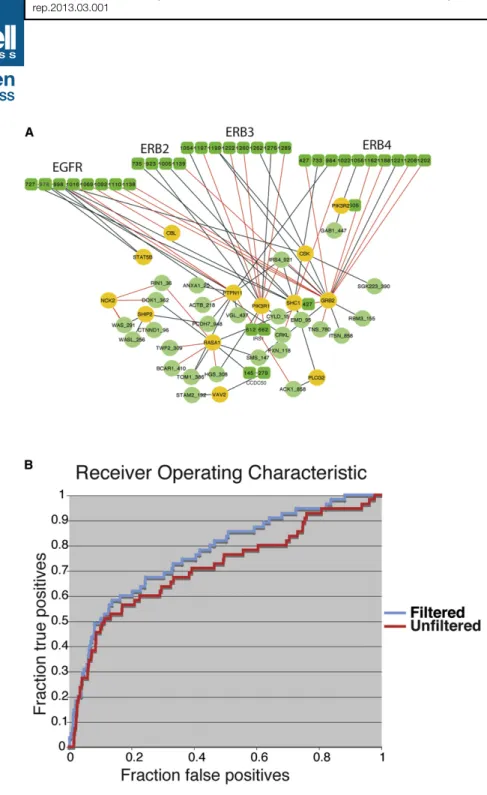
To increase the statistical significance of the analysis, we inte-grated already published data (25 phosphopeptide baits) (Schulze et al., 2005) with new experiments (32 phosphopeptide baits). This bait collection contains a large fraction of peptides (Table S5) that are phosphorylated on tyrosines upon stimulation of receptor kinases of the EGF receptor family. Affinity-purified proteins were identified by liquid chromatography coupled to high-resolution mass spectrometry. The recovered proteins mostly contain SH2 domains, with a few exceptions. Overall, these pull-down experiments define a network of 47 proteins linked by 85 interactions (Figure 5A). Unlike ‘‘traditional’’ protein interaction graphs, many proteins in this graph are represented as covalently linked nodes, where each node is an independent binding domain (Santonico et al., 2005). This representation is
Figure 5. Comparison between Experimen-tally Verified and Predicted Interactions
(A) The graph represents all of the interactions detected by pull-down experiments. Proteins are labeled with their gene names. SH2-containing proteins are represented as yellow circles, while proteins containing target phosphopeptides are in green. Proteins containing multiple SH2 target sites are represented as covalently linked multiple nodes labeled with the coordinates of the phos-phorylated tyrosines. Interactions that are also supported by the neural network predictors (Z score > 2) are drawn in red.
(B) ROC curve obtained by plotting true positives and false positives at varying neural network score. The red curve is obtained by using a ranked list limited to predictions of interactions with SH2 domains that have been identified in HeLa cells. See also Figures S4, S5, and Tables S4,S5, andS6.
made possible by the resolution of the interaction information obtained by this approach and allows us to distinguish whether the interactions engaged by a highly connected protein are mutually exclusive or rather involve different bind-ing regions and are mutually compatible. Only 45 of the 125 SH2-containing proteins have ever been identified by liquid chromatography mass spectrom-etry (LC-MS) experiments in HeLa cells (Blagoev et al., 2004;Wi!sniewski et al., 2009) (Table S6). For 28 of these we had an SH2 specific neural network predictor that could be used to rank the SH2 domains according to their preference for the phosphopeptide baits. Approxi-mately 33% of the interactions deter-mined experimentally were ranked high by the predictors developed in this work,
Z score higher than 2 (red edges in the
graph in Figure 5A). To measure the performance of our predictors by a more general approach, we plotted an ROC curve using the experi-mentally derived SH2 containing proteins as positive instances and the remaining as negative ones. The AROC was 0.81 with a precision (true/false positives) of approximately 0.11 at a recall of 50% (Figure 3B). However, there are a number of reasons why the performance of our predictors is underestimated by this analysis. First, some of the interactions that are predicted by the neural network might have been missed by the affinity purifi-cation experiment because of the low abundance of the corre-sponding SH2 protein partners. In addition, some of the proteins may bind to the bead-linked phosphopeptide by a domain that is different from SH2. For instance, the protein SHC1 has a second domain (PTB) that binds phosphopeptides containing the NPxpY motif. Indeed, more than 50% of the phosphopeptides that
affinity purified SHC1 contain this or related motifs. Finally, some of the interactions detected by pull-down could be indirect. For instance, SHC1 and GRB2 form a relatively stable complex upon EGF induction. The SH2 domain of GRB2 binds peptides containing a typical pYxN motif. The observation that SHC1 was detected in most of the pull-downs obtained with peptides
containing the pYxN GRB2 motif, despite having a different recognition specificity, suggests that SHC1 binds this phospho-peptide bead via a GRB2 bridge. Conversely, a SHC1 bridge could explain the indirect binding of GRB2 to peptides contain-ing an NPxpY motif. These considerations explain the relatively poor performance of our SHC1 (and to a lesser extent GRB2) SH2 domain predictor.
The EGF Dynamic Network
Protein interaction networks are typically pictured as static graphs lacking a time dimension. However, most biological processes are dynamic, and protein concentrations and modi-fications change in time in response to external or internal molecular cues. For instance, after addition of growth factors such as EGF, the signal is propagated from the receptor on the membrane to the nucleus via a cascade of modifications (mostly additions and removal of phosphate groups), which in turn promote the association and dissociation of enzymes and adaptors containing phosphopeptide binding domains. Olsen and colleagues (Olsen et al., 2006) have reported the global in vivo phosphorylation dynamics following activation of the EGF receptor in HeLa cells. Overall, they have identified 6,600 phosphorylation sites on 2,244 proteins containing at least one phosphorylated Ser, Thr, or Tyr. Of the 293 phospho-tyrosine peptides identified on 243 proteins, 53 dynamically change their phosphorylation state after incubation with EGF. We have combined this dynamic data set with our proteome-wide prediction of the SH2 target sites to come up with a description of the dynamic association and dissociation of proteins following the activation of the tyrosine kinase signaling cascade.
To this end, we downloaded from the HomoMINT database (Chatr-Aryamontri et al., 2007;Persico et al., 2005) all of the inter-actions where one of the partners is a protein participating in the EGF pathway according to the Reactome database (Vastrik et al., 2007). Only interactions with a MINT confidence score (Chatr-Aryamontri et al., 2008) higher than 0.4 were considered. This network represents the basal static interactions in the cell. We next downloaded from PepspotDB all the interactions between SH2-domain-containing proteins and the tyrosine-con-taining peptides whose phosphorylation varies with time after EGF stimulation. Interactions with a ‘‘final posterior probability’’ higher than 0.3, according to the Bayesian model developed here, were taken into consideration. This inferred dynamic network was superimposed onto the static literature-derived network. For network legibility, all of the proteins linked to the network by a single edge were removed. The predicted changes occurring in the dynamic interactome are illustrated inFigure 6A, where the proteins containing SH2 domains are in orange and the interactions mediated by peptides whose phosphorylation levels change after EGF stimulation are in red. Five minutes after receptor stimulation, several EGF receptor peptides are phos-phorylated and act as receptors for SH2-containing proteins. Many of these interactions are predicted to vanish at time 20 min while new ones, mediated by peptides that are phosphor-ylated late, appear. Some of the inferred interactions, such as the ones between the receptor and GRB2, SHC1, PLCG, or PI3K, already have plenty of support in the literature. Some others
Figure 6. Dynamic EGF Network
(A) The four time-resolved graphs combine the information about (1) the kinetic of tyrosine peptide phosphorylation following incubation with EGF (Olsen et al., 2006), (2) protein-protein interaction data mined from the literature, and (3) the prediction of SH2 phosphopeptide interactions. Edges representing dynamic interactions mediated by SH2 domains are in red, while orange and green circles represent proteins containing or not containing SH2 domains, respectively.
(B) GST fusions of three different SH2 domains (PI3K, GRB14, and SHP2) were used in pull-down experiments after incubation of 500 mg of a HeLa cell extract preincubated for 5 min with EGF. Affinity-purified proteins were analyzed by SDS-PAGE and, after staining with Coomassie blue, transferred to mem-branes and revealed with anti-phospho-ERK antibodies.
(C) After 16 hr starvation (time 0), HeLa cells were induced with EGF for 5, 10, and 30 min. Protein extracts were incubated with the tandem SH2 domains of SHP2 expressed as a GST-fusion protein. The affinity-purified SH2 ligands were resolved by SDS-PAGE and revealed with anti-phospho-ERK antibody. (D) After starvation, HeLa cells were treated with EGF for 5, 10, and 30 min. Cellular lysates were separated by SDS-PAGE and transferred onto a nitro-cellulose membrane. The blot was incubated with phospho-ERK and anti-ERK antibodies.
(E) The whole protein extract (1 mg) of HeLa cells treated with EGF was immunoprecipitated with anti-SHP2 antibody. Beads were washed with lysis buffer and the immunoprecipitation (IP) was revealed with anti-phospho-ERK and anti-SHP2 antibodies.
(F) HeLa cells were starved (00min) or induced for 5, 10, and 30 min with EGF. After cell lysis, 1 mg of protein extract was immunoprecipitated with anti-ERK antibody and protein complexes (IP) were separated by SDS-PAGE and re-vealed with anti-ERK and anti-SHP2 antibodies.
have never been reported and might represent new functionally important protein links.
We focused on the interactions mediated by the SH2 domains of the phosphatase SHP2/PTPN11. SHP2 is known to be acti-vated by binding to phosphorylated GAB1 (Holgado-Madruga et al., 1996). This interaction releases the autoinhibitory binding between the N-terminal SH2 domain and the phosphatase domain, activates the phosphatase enzymatic activity, and, via an incompletely understood mechanism, promotes a sustained activation of extracellular signal-regulated kinase (ERK). Our dynamic network recapitulates the interaction between the SH2 domains of SHP2 and GAB1, but in addition predicts a previ-ously unrecognized interaction between the SH2 domains of SHP2 and the phosphorylated Tyr204 in the activation loop of extracellular signal-regulated kinase 1 or 2 (ERK1/2). The results of the pull-down and coimmunoprecipitation experiments in Figure 6B clearly show that SHP2 forms a dynamic complex with ERK, starting 5 min after incubation with EGF. After 30 min, we observe a sharp decrease in the amount of immunoprecipitated ERK, which parallels the reduction in ERK phosphorylation levels.
The validation of the predicted dynamic interaction of SHP2 with ERK1/2 attests that the new experimental data presented here, combined with orthogonal genome-wide context informa-tion, contribute useful hints of new interactions to be experimen-tally tested for functional relevance. The PepspotDB provides easy access to these data and related predictions and thus represents a useful resource to shed light on mechanisms that rely on the formation of complexes mediated by phosphotyro-sine peptides.
For a further explanation, please see theExtended Results.
EXPERIMENTAL PROCEDURES Peptide Arrays
The 13-mer phosphotyrosine peptides were selected by combining the 2,198 peptides that were annotated in the Phospho.ELM (Diella et al., 2008) and PhosphoSite databases (Hornbeck et al., 2004) at the time we started this project and approximately 4,000 additional peptides from the human proteome that received a high score by the NetPhos predictor (Blom et al., 1999). Overall, 6,202 phosphopeptides, 13 residues long, were synthesized and printed in triplicate identical arrays with appropriate controls (Table S1).
Amino-oxy-acetylated peptides were synthesized on cellulose membranes in a parallel manner using SPOT synthesis technology according toFrank
(1992)andWenschuh et al. (2000). Following side-chain deprotection, the
solid-phase-bound peptides were transferred into 96 well microtiter filtration plates (Millipore, Bedford, MA, USA) and treated with 200 ml of aqueous trie-thylamine (2.5% by volume) in order to cleave the peptides from the cellulose membrane. Peptide-containing triethylamine solution was filtered off and used for quality control by LC-MS. Subsequently, solvent was removed by evapora-tion under reduced pressure. Resulting peptide derivatives (50 nmol) were redissolved in 25 ml of printing solution (70% DMSO, 25% 0.2 M sodium acetate [pH 4.5], 5% glycerol; by volume) and transferred into 384 well micro-titer plates. Different printing procedures (noncontact printing versus contact printing) were tested for production of final peptide chips. The best results were reached using contact printing with ceramic pin tools (48 in parallel) on aldehyde-modified slides (enhanced surface; Erie Scientific). Printed peptide microarrays were kept at room temperature for 5 hr, quenched for 1 hr with buffered ethanolamine, washed extensively with water followed by ethanol, and dried using microarray centrifuge. Resulting peptide microarrays were stored at 4#C.
A Large Manually Curated Data Set of Human SH2-Mediated Interactions
Since the discovery that SH2 domains mediate binding to peptides containing phosphorylated tyrosines (Anderson et al., 1990;Moran et al., 1990), several reports have appeared in the literature describing the sequence of peptide ligands for several SH2 domains. We have made an effort to recapture this valuable information, organize it in a computer readable format, and store it in a database. To this end, we have developed a simple text-mining approach to recover from the Medline database abstracts containing the text ‘‘SH2’’ and a ‘‘Y’’ followed by a number in a protein-interaction textual context. The recov-ered abstracts were examined by expert curators, and whenever the abstract hinted that the manuscript was reporting evidence for an interaction between an SH2 domain and a specific phosphorylated peptide, the manuscript was read through to extract the relevant information. Approximately 50% of the abstracts recovered by text mining were deemed relevant by the curators.
When this work was in progress, we learned of a similar effort by Gong and collaborators (Gong et al., 2008). The data curated by this group, including 489 SH2 related articles, are available in a public database. A total of 141 of the arti-cles in our curation effort were not present in the PepCyber database, while 124 were in common. Among the entries in this latter collection, we found 20 discrepancies in the information extracted by the curators. These entries were re-examined and the discrepancies fixed. Finally, the PepCyber data-base contained 365 articles that were not yet curated in our effort. We analyzed these 365 articles, and for 135 of them we could not find any experimental evidence supporting an interaction between an SH2 domain and a specific phosphorylated peptide. The remaining 230 articles were recurated by MINT curators according to the Proteomics Standards Initiative molecular interac-tion standards and controlled vocabularies (Hermjakob et al., 2004) (see vent diagram inFigure S4).
Training and Benchmarking ANNs
In order to build predictors to infer if a given peptide is a weak or a strong ligand of a particular SH2 domain, we employed ANNs of the standard three-layer feed-forward type and encoded the amino acids as previously described (Niel-sen et al., 2003). Only peptides with a length of 13 and with the phosphotyro-sine residue centrally placed were taken into account. To avoid overfitting, the data set was homology reduced using CD-HIT (Li and Godzik, 2006) with default values and 90% sequence identity threshold. These operations reduced the total data set from 6,202 peptides to 3,896. For each SH2 domain, we normalized the log-ratio intensity values to range between 0 and 1, where higher numbers correlate with stronger binding affinity. The data set was divided into four subsets by random partitioning. We trained an ANN on two subsets, determined the optimal network architecture and training parameters on the third subset, and obtained an unbiased performance estimate from the fourth subset. This was repeated in a round-robin fashion to utilize all data for training, test, and validation. For each test set, the number of hidden neurons in the ANN (0, 2, 4, 6, 10, 15, 20, and 30) was optimized according to the PCC. The reported PCC performance measure of each ANN was based on the inde-pendent validation subsets.
To validate the performance of developed ANNs, we used the data set of known in vivo ligands of SH2 domains specifically curated for this work (referred to the gold standard data set). This training-independent data set served as the positive instances, while the negatives comprised 1,307 phos-photyrosine peptides from Phospho.ELM (Diella et al., 2008) that have not previously been shown to bind any SH2 domains. In order not to validate on instances that are identical or highly similar in sequence to what was used to train the ANNs, we used the BLAST algorithm to discard benchmark peptides that were more than 90% identical to the training set. To compare the performance of the ANNs with previously published methods, we ran the benchmark data set through the SMALI method that employs position-specific scoring matrices to predict ligands of SH2 domains (Huang et al., 2008). We tested each predictor on its respective validation set and calculated the AROC for the SH2 domains for which we had at least eight positive instances in the benchmark data set. To test if the observed performance of the PSSMs was significantly different from the ANNs, we constructed bootstrap estimates of the uncertainty associated with each AROC by resampling the score distri-butions for positive and negative examples.
Contextual Score Ranking Interactions according to Likelihood of Functional Significance
The Bayesian model supporting the contextual score is based on a number of independent genome-wide features describing the probability that the peptide is exposed to the solvent or in a disordered part of the parent protein, that the SH2 domain protein and its predicted partner are expressed in the same tissues, and that they are close in the protein interaction network and conserved in evolution. Finally, we have added the neural network score as a property in the Bayesian inference scheme to give an overall probability of interaction between the SH2 domain and the protein from which the peptide in question was derived.
For each set of possible interactors (SH2-domain-containing protein and peptide-containing protein), we retrieved information that could help deter-mine whether that particular interaction is likely to take place under physiolog-ical conditions.
The ‘‘tissue-specific expression’’ data were taken fromSu et al. (2004), and the subcellular localization was extracted partly from CellMINT (G.C., unpub-lished data) and partly from Gene Ontology annotations. Both of these sets of data were scored by counting the number of co-occurrences of organelle terms and dividing by the highest number of occurrences for either the SH2 domain containing protein or the peptide containing protein, thus obtaining a score between 0 and 1.
‘‘Structural disorder’’ was determined using IUPred by running the predic-tion method on the full sequences and then cutting out the relevant part (Dos-zta´nyi et al., 2005). A score between 0 and 1 was obtained by taking the average score of all the residues constituting the peptide.
‘‘Degree of conservation’’ of the binding site in related species was evalu-ated by inspecting it in multiple alignments of orthologs and paralogs from ENSEMBL (Flicek et al., 2012). The relevant peptides were cut out of the related sequences and evaluated for binding by the neural networks. The score contribution for each orthologous sequence with the particular domain was calculated by multiplying the neural network score with the overall sequence distance from the original sequence obtained from a neighbor-joining tree. This procedure was followed to award more to binding-site conservation in distant sequences than to that in close sequences. The scores obtained from all the orthologous sequences were added up to produce a single score for each binding site/SH2 domain combination.
Conservation score = Sidist_sequencei* ANN_sequencei, where i runs through all orthologous sequences in the alignment for that particular peptide. Finally, the ‘‘raw neural network scores’’ were incorporated in the Bayesian framework as a feature on its own.
To assess the importance of contextual evidence, we applied the naive Bayes algorithm:
PðIjEÞ =PðIÞ & PðE1jIÞ & PðE2jIÞ:::PðExjIÞ PðE1Þ & PðE2Þ:::PðExÞ
This computes the probability of interaction given the evidence [P(IjE)]. The components of this calculation are the probabilities of seeing each piece of evidence given interaction (PExjI) and the probability of seeing this evidence in the full set of combinations of domain-containing proteins and peptides P(Ex). In practice, this latter probability is calculated by evaluating both the probability of the evidence given interaction and the probability of the evidence given noninteraction (seeFigure S5).
The parameters for the model are determined from a set of known SH2 inter-actions that was collected and curated manually, deemed ‘‘the foreground set,’’ as well as the full range of possible combinations of SH2-domain-con-taining protein and peptides (‘‘the background set’’), assuming that most of these combinations are noninteracting in vivo.
Assembly of the EGF-Dependent Dynamic Network
The EGF-dependent dynamic network is a graph with a temporal dimension. This is assembled via the following steps.
We first downloaded from the MINT database all of the interactions involving as a partner one of the proteins that participate in signal transduction in the EGF pathway, as described in the Reactome pathway database. Only interac-tions with a MINT confidence score greater than 0.4 were considered. Next, we inferred all the possible interactions between SH2-containing proteins and the
peptides described byOlsen et al. (2006)as phosphorylated in tyrosines following EGF stimulation.
Phosphotyrosine Peptide Pull-Downs and Mass Spectrometric Analysis
SILAC Cell Culture and Lysis
Adherent human cervix carcinoma cells (HeLa; ATCC number CCL-2) were SILAC encoded in Dulbecco’s modified Eagle’s medium deficient in arginine (Arg) and lysine (Lys) and supplemented with 10% dialyzed fetal calf serum and antibiotics. One cell population was supplied with normal L-Arg and L-Lys (‘‘light SILAC’’) and the other one with the stable isotope-labeled heavy analogs 13C615N4-L-arginine and 13C615N2-L-lysine (‘‘heavy SILAC’’). After five cell doublings, the cells were lysed in an ice-cold buffer consisting of 1% NP-40, 150 mM NaCl, 50 mM Tris-HCl (pH 7.5), 1 mM dithiothreitol, protease inhibitor mixture (Roche complete tablets), and 1 mM sodium ortho-vanadate as tyrosine phosphatase inhibitor. Following centrifugation at 16,000 3 g for 15 min, the supernatant was used for peptide affinity pull-down experiments. Peptide Synthesis
Peptides were synthesized as pairs in phosphorylated and nonphosphorylated forms on a solid-phase peptide synthesizer using an amide resin (Intavis, Germany) as previously described (Hanke and Mann, 2009). Briefly, an amino acid sequence stretch of 13 residues surrounding the central in vivo tyrosine phosphorylation site that we have previously identified by mass spectrometry (Olsen et al., 2006) was synthesized with an terminal SerGly-linker and a N-amino-modified desthiobiotin moiety for coupling to streptavidin-coated beads and efficient elution via biotin. The purity of the all synthetic peptides was confirmed by mass spectrometric analysis.
Peptide Pull-Down
Peptide pull-downs were performed automatically on a TECAN pipetting robot using the peptide pull-down protocol described previously (Schulze et al., 2005). The synthetic peptides were bound to streptavidin-coated magnetic beads (Dynal MyOne, Invitrogen), and cell lysate corresponding to 1 mg of protein (!5 mg/ml protein) was added to 75 ml of beads containing an esti-mated amount of 2 nmol of synthetic peptide. Heavy-SILAC-labeled lysate was incubated with the phosphorylated version of the peptide, whereas light-SILAC-labeled lysate was added to the nonphosphorylated counterpart. After rotation at 4#C for 4 hr, the beads were washed three times with lysis buffer. Beads from each peptide pair were combined and bound proteins were eluted using 20 mM biotin. Eluted proteins were then precipitated by add-ing 5 vol ethanol together with sodium acetate and 20 mg glycoblue (Ambion). In-Solution Protein Digestion
The precipitated proteins were resuspended in 20 ml of 6 M urea, 2 M thiourea, and 20 mM Tris-HCl (pH 8.0) and reduced by adding 1 mg of dithiothreitol for 30 min, followed by alkylation of cysteines by incubating with 5 mg iodoaceta-mide for 20 min. Digestion was started by adding endoproteinase Lys-C (Wako). After 3 hr, samples were diluted with 4 vol 50 mM NH4HCO3, and trypsin (Promega) was added for overnight incubation. Proteases were applied in a ratio of 1:50 to protein material, and all steps were carried out at room temperature. Digestion was stopped by acidifying with trifluoroacetic acid, and the samples were loaded onto homemade StageTips packed with reverse-phase C18 disks (Empore, 3M, MN) for desalting and concentration prior to LC-MS analysis.
Nanoflow LC-MS/MS
Digested peptide mixtures were separated by online reverse-phase nanoscale capillary liquid chromatography and analyzed by electrospray tandem mass spectrometry (MS/MS). Experiments were performed with an Easy-nLC nano-flow system (Proxeon Biosystems) connected to an LTQ-Orbitrap XL or 7T-LTQ-FT Ultra mass spectrometer (Thermo Fisher Scientific, Bremen, Germany) equipped with a nanoelectrospray ion source (Proxeon Biosystems, Odense, Denmark). Binding and chromatographic separation of the peptides took place in a 15 cm fused silica emitter (75 mm inner diameter) in-house packed with reverse-phase ReproSil-Pur C18-AQ 3 mm resin (Dr. Maisch GmbH, Ammerbuch-Entringen, Germany). The mass spectrometer was oper-ated in the data-dependent mode to automatically switch between high-reso-lution orbitrap full scans (R = 60 K at m/z = 400) and LTQ ion trap CID of the top ten most abundant peptide ions. All full scans were automatically recalibrated in real time using the lock-mass option.
Peptide and Protein Identification and Quantification
Peptide and proteins were identified by using Mascot and the MaxQuant soft-ware suite (Cox and Mann, 2008) and filtered for an estimated false-discovery rate of less than 1%. All SILAC pairs were quantified by MaxQuant, and the corresponding protein ratios were calculated from the median of all peptide ratios and normalized such that the median of all peptide ratios (log trans-formed) was zero.
For further details, please refer toExtended Experimental Procedures. ACCESSION NUMBERS
The domain-peptide interaction data have been deposited into a new publicly available resource, the Pepspot database (PepspotDB; http://mint.bio. uniroma2.it/PepspotDB/home.seam).
SUPPLEMENTAL INFORMATION
Supplemental Information includes Extended Results, Extended Experimental Procedures, six figures, and six tables and can be found with this article online
athttp://dx.doi.org/10.1016/j.celrep.2013.03.001.
LICENSING INFORMATION
This is an open-access article distributed under the terms of the Creative Commons Attribution-NonCommercial-No Derivative Works License, which permits non-commercial use, distribution, and reproduction in any medium, provided the original author and source are credited.
ACKNOWLEDGMENTS
Tony Pawson provided some SH2 expression plasmids, and Claudia Dall’Armi prepared some SH2 domains. This work was supported by the EU FP6 Inter-action Proteome integrated project, the FP7 Affinomics project, and the Italian Foundation for Cancer Research (AIRC). M.T. was supported by a donation by Cesira Perazzi. Work at C.P.R.’s lab is supported by a grant from the Novo Nor-disk Foundation. Received: December 7, 2012 Revised: February 28, 2013 Accepted: March 1, 2013 Published: March 28, 2013 REFERENCES
Anderson, D., Koch, C.A., Grey, L., Ellis, C., Moran, M.F., and Pawson, T. (1990). Binding of SH2 domains of phospholipase C gamma 1, GAP, and Src to activated growth factor receptors. Science 250, 979–982.
Blagoev, B., Ong, S.-E., Kratchmarova, I., and Mann, M. (2004). Temporal analysis of phosphotyrosine-dependent signaling networks by quantitative proteomics. Nat. Biotechnol. 22, 1139–1145.
Blom, N., Gammeltoft, S., and Brunak, S. (1999). Sequence and structure-based prediction of eukaryotic protein phosphorylation sites. J. Mol. Biol.
294, 1351–1362.
Brandt, B.W., Feenstra, K.A., and Heringa, J. (2010). Multi-Harmony: detecting functional specificity from sequence alignment. Nucleic Acids Res. 38(Web Server issue), W35-40.
Ceol, A., Chatr Aryamontri, A., Licata, L., Peluso, D., Briganti, L., Perfetto, L., Castagnoli, L., and Cesareni, G. (2010). MINT, the molecular interaction data-base: 2009 update. Nucleic Acids Res. 38(Database issue), D532–D539. Chatr-Aryamontri, A., Ceol, A., Palazzi, L.M., Nardelli, G., Schneider, M.V., Castagnoli, L., and Cesareni, G. (2007). MINT: the Molecular INTeraction data-base. Nucleic Acids Res. 35(Database issue), D572–D574.
Chatr-Aryamontri, A., Ceol, A., Licata, L., and Cesareni, G. (2008). Protein interactions: integration leads to belief. Trends Biochem. Sci. 33, 241–242, author reply 242–243.
Cox, J., and Mann, M. (2008). MaxQuant enables high peptide identification rates, individualized p.p.b.-range mass accuracies and proteome-wide protein quantification. Nat. Biotechnol. 26, 1367–1372.
Diella, F., Gould, C.M., Chica, C., Via, A., and Gibson, T.J. (2008). Phos-pho.ELM: a database of phosphorylation sites—update 2008. Nucleic Acids Res. 36(Database issue), D240–D244.
Doszta´nyi, Z., Csizmok, V., Tompa, P., and Simon, I. (2005). IUPred: web server for the prediction of intrinsically unstructured regions of proteins based on estimated energy content. Bioinformatics 21, 3433–3434.
Ernst, A., Sazinsky, S.L., Hui, S., Currell, B., Dharsee, M., Seshagiri, S., Bader, G.D., and Sidhu, S.S. (2009). Rapid evolution of functional complexity in a domain family. Sci. Signal. 2, ra50.
Flicek, P., Amode, M.R., Barrell, D., Beal, K., Brent, S., Chen, Y., Clapham, P., Coates, G., Fairley, S., Fitzgerald, S., et al. (2012). Ensembl 2012. Nucleic Acids Res. 40, D222–D229.
Frank, R. (1992). Spot-synthesis: an easy technique for the positionally addressable, parallel chemical synthesis on a membrane support. Tetrahe-dron 48, 9217–9232.
Gfeller, D., Butty, F., Wierzbicka, M., Verschueren, E., Vanhee, P., Huang, H., Ernst, A., Dar, N., Stagljar, I., Serrano, L., et al. (2011). The multiple-specificity landscape of modular peptide recognition domains. Mol. Syst. Biol. 7, 484. Gong, W., Zhou, D., Ren, Y., Wang, Y., Zuo, Z., Shen, Y., Xiao, F., Zhu, Q., Hong, A., Zhou, X., et al. (2008). PepCyber:P!PEP: a database of human protein protein interactions mediated by phosphoprotein-binding domains. Nucleic Acids Res. 36(Database issue), D679–D683.
Hanke, S., and Mann, M. (2009). The phosphotyrosine interactome of the insulin receptor family and its substrates IRS-1 and IRS-2. Mol. Cell. Proteo-mics 8, 519–534.
Hermjakob, H., Montecchi-Palazzi, L., Bader, G., Wojcik, J., Salwinski, L., Ceol, A., Moore, S., Orchard, S., Sarkans, U., von Mering, C., et al. (2004). The HUPO PSI’s molecular interaction format—a community standard for the representation of protein interaction data. Nat. Biotechnol. 22, 177–183. Holgado-Madruga, M., Emlet, D.R., Moscatello, D.K., Godwin, A.K., and Wong, A.J. (1996). A Grb2-associated docking protein in EGF- and insulin-receptor signalling. Nature 379, 560–564.
Hornbeck, P.V., Chabra, I., Kornhauser, J.M., Skrzypek, E., and Zhang, B. (2004). PhosphoSite: A bioinformatics resource dedicated to physiological protein phosphorylation. Proteomics 4, 1551–1561.
Huang, H., Li, L., Wu, C., Schibli, D., Colwill, K., Ma, S., Li, C., Roy, P., Ho, K., Songyang, Z., et al. (2008). Defining the specificity space of the human SRC homology 2 domain. Mol. Cell. Proteomics 7, 768–784.
Jones, R.B., Gordus, A., Krall, J.A., and MacBeath, G. (2006). A quantitative protein interaction network for the ErbB receptors using protein microarrays. Nature 439, 168–174.
Kiemer, L., and Cesareni, G. (2007). Comparative interactomics: comparing apples and pears? Trends Biotechnol. 25, 448–454.
Li, W., and Godzik, A. (2006). Cd-hit: a fast program for clustering and comparing large sets of protein or nucleotide sequences. Bioinformatics 22, 1658–1659.
Licata, L., Briganti, L., Peluso, D., Perfetto, L., Iannuccelli, M., Galeota, E., Sacco, F., Palma, A., Nardozza, A.P., Santonico, E., et al. (2012). MINT, the molecular interaction database: 2012 update. Nucleic Acids Res. 40(Database issue), D857–D861.
Linding, R., Jensen, L.J., Ostheimer, G.J., van Vugt, M.A., Jørgensen, C., Miron, I.M., Diella, F., Colwill, K., Taylor, L., Elder, K., et al. (2007). Systematic discovery of in vivo phosphorylation networks. Cell 129, 1415–1426. Liu, B.A., Jablonowski, K., Raina, M., Arce´, M., Pawson, T., and Nash, P.D. (2006). The human and mouse complement of SH2 domain proteins-establish-ing the boundaries of phosphotyrosine signalproteins-establish-ing. Mol. Cell 22, 851–868. Liu, B.A., Jablonowski, K., Shah, E.E., Engelmann, B.W., Jones, R.B., and Nash, P.D. (2010). SH2 domains recognize contextual peptide sequence infor-mation to determine selectivity. Mol. Cell. Proteomics 9, 2391–2404.
Machida, K., Thompson, C.M., Dierck, K., Jablonowski, K., Ka¨rkka¨inen, S., Liu, B., Zhang, H., Nash, P.D., Newman, D.K., Nollau, P., et al. (2007). High-throughput phosphotyrosine profiling using SH2 domains. Mol. Cell 26, 899–915.
Marengere, L.E., Songyang, Z., Gish, G.D., Schaller, M.D., Parsons, J.T., Stern, M.J., Cantley, L.C., and Pawson, T. (1994). SH2 domain specificity and activity modified by a single residue. Nature 369, 502–505.
Miller, M.L., Jensen, L.J., Diella, F., Jørgensen, C., Tinti, M., Li, L., Hsiung, M., Parker, S.A., Bordeaux, J., Sicheritz-Ponten, T., et al. (2008). Linear motif atlas for phosphorylation-dependent signaling. Sci. Signal. 1, ra2.
Moran, M.F., Koch, C.A., Anderson, D., Ellis, C., England, L., Martin, G.S., and Pawson, T. (1990). Src homology region 2 domains direct protein-protein inter-actions in signal transduction. Proc. Natl. Acad. Sci. USA 87, 8622–8626. Nielsen, M., Lundegaard, C., Worning, P., Lauemøller, S.L., Lamberth, K., Buus, S., Brunak, S., and Lund, O. (2003). Reliable prediction of T-cell epitopes using neural networks with novel sequence representations. Protein Sci. 12, 1007–1017.
Olsen, J.V., Blagoev, B., Gnad, F., Macek, B., Kumar, C., Mortensen, P., and Mann, M. (2006). Global, in vivo, and site-specific phosphorylation dynamics in signaling networks. Cell 127, 635–648.
Panni, S., Dente, L., and Cesareni, G. (2002). In vitro evolution of recognition specificity mediated by SH3 domains reveals target recognition rules. J. Biol. Chem. 277, 21666–21674.
Pawson, T. (2004). Specificity in signal transduction: from phosphotyrosine-SH2 domain interactions to complex cellular systems. Cell 116, 191–203.
Persico, M., Ceol, A., Gavrila, C., Hoffmann, R., Florio, A., and Cesareni, G. (2005). HomoMINT: an inferred human network based on orthology mapping of protein interactions discovered in model organisms. BMC Bioinformatics
6(Suppl 4), S21.
Santonico, E., Castagnoli, L., and Cesareni, G. (2005). Methods to reveal domain networks. Drug Discov. Today 10, 1111–1117.
Schulze, W.X., Deng, L., and Mann, M. (2005). Phosphotyrosine interactome of the ErbB-receptor kinase family. Mol. Syst. Biol. 1, 2005.0008.
Songyang, Z., Shoelson, S.E., Chaudhuri, M., Gish, G., Pawson, T., Haser, W.G., King, F., Roberts, T., Ratnofsky, S., Lechleider, R.J., et al. (1993). SH2 domains recognize specific phosphopeptide sequences. Cell 72, 767–778. Su, A.I., Wiltshire, T., Batalov, S., Lapp, H., Ching, K.A., Block, D., Zhang, J., Soden, R., Hayakawa, M., Kreiman, G., et al. (2004). A gene atlas of the mouse and human protein-encoding transcriptomes. Proc. Natl. Acad. Sci. USA 101, 6062–6067.
Vastrik, I., D’Eustachio, P., Schmidt, E., Gopinath, G., Croft, D., de Bono, B., Gillespie, M., Jassal, B., Lewis, S., Matthews, L., et al. (2007). Reactome: a knowledge base of biologic pathways and processes. Genome Biol. 8, R39. Wenschuh, H., Volkmer-Engert, R., Schmidt, M., Schulz, M., Schneider-Mergener, J., and Reineke, U. (2000). Coherent membrane supports for parallel microsynthesis and screening of bioactive peptides. Biopolymers
55, 188–206.
Wi!sniewski, J.R., Zougman, A., Nagaraj, N., and Mann, M. (2009). Universal sample preparation method for proteome analysis. Nat. Methods 6, 359–362. Yaffe, M.B. (2002). Phosphotyrosine-binding domains in signal transduction. Nat. Rev. Mol. Cell Biol. 3, 177–186.
Reproducibility of Chip Experiments
The correlation coefficient of the results of the triplicate arrays represents a good measure of the quality of the experiment. InTable S2, we have reported the Pearson correlation coefficients between the results of triplicate arrays or between independent experi-ments carried out at different times with different preparation of the same domain. Typical correlation graphs are reported in Figure S1.
PepspotDB: Motivation and Brief Description
PepspotDB is a new database, specifically designed to store in a single integrated resource the results of experiments exploiting molecular array technology. We decided to develop a brand new database, because readily available alternative solutions were either too broad (Ceol et al., 2010;Ceol et al., 2007), or too narrow (Gong et al., 2008) in scope.
Although PepspotDB has been developed primarily to support research activities within our group, we have opened it to the community as a key reference for the storage and retrieval of peptide chip data.
PepspotDB contains five main data types:
(a) Experimental evidence supporting SH2 peptide interaction (b) Computational predictions
(c) Binary interactions
(d) Bayesian integration of contextual evidence (e) Phosphorylation sites
Among all domain-peptide pairs that have either experimental or computational support, only those with signal intensity or predic-tion score above a certain threshold are considered. These candidate binary interacpredic-tions are singled out and stored in the database in a separate table for easy visualization and retrieval. The Bayesian integration of experimental data with orthogonal contextual evidence provides a Bayesian score for each tested domain-peptide pair.
Since SH2 domains bind to phospho-tyrosine containing peptides, and since other families of interaction domains also recognize phosphorylated residues, we imported into the database information on experimentally determined phosphorylation sites, as anno-tated in the two most comprehensive publicly available databases hosting phosphorylation data, PhosphoSite (Hornbeck et al., 2012) and Phospho.ELM (Diella et al., 2008). Information on protein sequences was also imported from an external database, UniProtKB (UniProt Consortium, 2009), the reference repository for protein records. Furthermore, PepspotDB is tightly integrated with the MINT protein interaction database (Chatr-Aryamontri et al., 2007).
PepspotDB: Requirements and Guidelines
The key requirement for PepspotDB was flexibility to ensure the database could grow smoothly, with no need for major redesign steps, as the number and diversity of projects increased.
The integration of external data sources was another issue. The two most common alternative integration strategies are ‘‘deep’’ and ‘‘shallow’’ integration. Deep integration basically consists in replicating the information stored in an external data source into the in-house database; it requires the translation or mapping of the external database data model to the data model of the destination database and periodic updates to bring the local copy of the data in line with the original source. Shallow integration is much easier to accomplish: the data remain in the primary data source (no replication occurs) and some sort of hyperlink pointing to them is created in the secondary data source. The advantage of the first solution lies in the superior performance achievable in terms of response times since no additional network traffic is generated. On the other hand, deep integration involves a considerable design effort to work out a more complex unified schema and comes with major maintenance issues. Shallow integration imposes a much lighter burden on the database design, often involving nothing more than the storage of a Unified Resource Locator (URL) in the proper table column. However, this second solution presents serious drawbacks in terms of performance, due to network latency and possibly failure. Maintenance issues are also not completely absent (URLs should be updated once in a while as broken links may occur).
Our design choices were oriented toward the achievement of the most suitable trade-off between flexibility and performance. PepspotDB is not yet another protein interaction database but focuses on experiments based on peptide array technology. As for integration of external data sources, we did not fully commit ourselves to either to a deep or a shallow strategy, but we decided on a case by case basis which one was most appropriate to gain performance without losing too much flexibility. Hence, for instance, we chose deep integration to import protein data from UniProtKB (UniProt Consortium, 2009) and phosphorylation data from Phos-pho.ELM and PhosphoSite (Diella et al., 2008;Hornbeck et al., 2004), whereas shallow integration seemed to us more effective for linking binary interactions stored in PepspotDB with relevant records in the general purpose Molecular INTeraction database. PepspotDB: Data Model
Although the database was originally conceived as a repository of experiments employing peptide arrays to detect domain-peptide interactions, we aimed at making the database structure as general as possible, to be able to accommodate virtually any kind of
identifying a group of Measures, each of which is related to a single ArraySpot (seeFigure 1). ArrayChips are composed of ArraySpots and represent a particular array layout. ArraySpots correspond to positions in the array and can be either control spots, marker spots (used by the scanner software to align the quantization grid), blank spots or spots containing an Interactor. A Measure object encap-sulates most of the data produced by the scanner software upon quantization of a particular array spot. Experiments are often performed in duplicate or in triplicate: different replicates of the same array layout within the same experiment are modeled by different ArrayAssay objects, one for each replicate, referring to the same ArrayChip and Experiment. Thus, in an experiment performed in triplicate, three Measures for each ArraySpot will be associated to the respective ArrayAssay object representing one replicate of the same ArrayChip. The Interactor class conveys the general idea of a molecule that can interact with some other molecule, abstracting from the actual type of molecule we are talking about (e.g., a protein, a region of a protein, a nucleic acid, etc...). ModifiableMolecule is a particular class of Interactor provided with a sequence to which one or more PTM (Post-Translational Modification) objects can be attached. ModifiableMolecule is further specialized into Peptide, Domain and Protein. A Peptide can be associated to many proteins through PeptideProteinAssociation entities (most often a peptide matches the sequence of several homologous proteins); a Protein in turn can be composed of many domains. These layers of abstraction allow PepspotDB to deal with experiments of different nature exactly in the same manner: since experiments are modeled as interaction assays testing, in one-versus-all fashion, a generic Interactor against one or more arrays composed of ArraySpots containing also generic Interactors, domain-peptide, domain-domain, antibody-antigen or protein-protein interaction assays are viewed as perfectly equal.
Furthermore, PepspotDB foresees the possibility that an Interactor may participate in different experiments in modified forms, e.g., it could be mutated in one experiment and phosphorylated in another: InteractorForm objects signify the particular configurations assumed by Interactors in the context of a specific experiment and are used to create experiment-wise variants of an Interactor by associating to it one or more Features (the only implemented one so far being PTM, Post-Translational Modification). This is the reason why the ArraySpot class is associated to the Interactor class through the InteractorForm class and not immediately. The same is true for the Experiment class. To illustrate this concept with an example: let’s suppose we wanted to capture the fact that protein A participates in experiment X in its canonical form and in experiment Y in a phosphorylated form and no InteractorForm class was present; we would have to create two distinct Protein objects, one representing A in its canonical form and another rep-resenting A in its phosphorylated form and link them to the respective experiments, thus unnecessarily duplicating information. With the introduction of the InteractorForm class, we can now create two InteractorForms, associate one of them to the proper post-trans-lational modification (PTM), and link both forms to the same Protein object corresponding to protein A.
Besides raw data, i.e., the figures output by the laser scanner, encapsulated by the Measure object, PepspotDB’s data model allows the storage also of experimental data after processing, a procedure during which filters are applied to the data to attenuate noise and the redundant information contained in the two or more replicates is collapsed into one figure. In a typical triplicated exper-iment, the three Measures associated to a particular spot undergo processing and are merged into a single NormalizedMeasure instance relative to the spot. As was mentioned earlier, PepspotDB encompasses not only experimental observations, but also computational predictions obtained from neural network predictors. The NeuralNetworkPrediction class models such computational predictions, linking the target Interactor for which the prediction was made to the Experiment whose data were used to train the neural network predictor.
Finally, scanned images (Image class) of the chip may be stored in the database and linked to their respective experiment. PepspotDB: Web Interface
On top of the relational database, we have built a user friendly web interface, with the aim of facilitating data access and retrieval to non-computer experts (http://mint.bio.uniroma2.it/PepspotDB/home.seam). Access to the web site is open to anyone using the ‘‘guest’’ account, which comes with reading privileges only. Authenticated users are granted different privileges in accordance with their assigned role(s): Reader, Writer, Curator or SuperUser. Since the PepspotDB short term goal was to support the research projects carried out in our lab, an entire section of the web site is dedicated to presenting these projects: the aim of each project is briefly described and its final results can be browsed through direct links. The SH2 specificity data can be explored from an interac-tive homology tree obtained by hierarchical clustering of the human SH2 domains according to sequence homology. Node color reflects the domain target recognition specificity, as established from the results of our experimental and computational analysis. Domains similarly colored have similar consensus sequences, as apparent from the logos popping up upon mouse hovering, whereas white nodes indicate a SH2 domain that we have not profiled yet. A click on a tree leaf forward the user to the search page, where the candidate domain targets we have identified for that particular SH2 domain are listed.