Università degli Studi di Ferrara
DOTTORATO DI RICERCA IN
ECONOMIA
CICLO XXVII
COORDINATORE Prof. Massimiliano Mazzanti
Linking emissions, innovation and competitiveness. The
European path towards sustainability
Settore Scientifico Disciplinare SECS-P/01
Dottorando Tutore
Dott. Marianna Gilli Prof Lucio Poma _____________________ ____________________ Cotutore Prof Massimiliano Mazzanti _________________________
1
Table of contents
Introduction ... 6
1. Environmental Innovation Adoption and Economic – Environmental Performances. Sector Perspective on the EU: Structural Change and Dynamic Issue... 11
1.1. Introduction ... 11
1.2. Conceptual Background ... 13
1.3. Environmental innovation adoption, economic and environmental performance 14 1.3.1. Comparing major economies in a meso perspective ... 16
1.3.2. Sector composition and joint performances ... 19
1.4. Decomposition of environmental performance differentials: a shift-share analysis 28 1.5. Conclusion ... 32
Appendix ... 35
2. Innovation complementarities and environmental productivity effects: evidences from the EU ... 38
2.1. Introduction ... 38
2.2. Environmental productivity and complementarity among innovations: concepts and methods ... 40
2.3. The data ... 45
2.4. Econometric evidence: complementarity analysis ... 49
2.4.1. Model specification and methodology ... 49
2.4.2. Results ... 49
2.5. Conclusions ... 56
Appendix ... 58
3. Carbon dioxide emissions-innovation relation: Evidences from the European countries ... 66
3.1. Introduction ... 66
3.2. Factors affecting CO2 emissions ... 67
3.2.1. Technological Change ... 67
3.2.2. Economic growth ... 68
3.2.3. Environmental Policy and its interactions with Technological Change ... 70
3.3. Data description ... 71
3.3.1. Environmental policy index... 72
3.3.2. Data description ... 74
2 3.4.1. Model specifications ... 77 3.4.2. Estimation ... 78 3.5. Results ... 78 3.6. Conclusions ... 82 Appendix ... 84 Conclusion ... 96 References ... 101
3
List of Tables Chapter 1
Table 1. 1 Adoption of Environmental Innovation in years 2006-2008. ... 17
Table 1. 2 Main sectors. Share of value added (2008). Italy and Germany: ... 22
Table 1. 3 Main sectors. Share of value added (2008). France and Netherlands ... 23
Table 1. 4 Main sectors. Share of value added (2008). Sweden... 23
Table 1. 5 Top expanding and top shrinking sectors. 2000-2008. Italy ... 24
Table 1. 6 Top expanding and top shrinking sectors. 2000-2008. Germany ... 25
Table 1. 7 Top expanding and top shrinking sectors. 2000-2008. France ... 26
Table 1. 8 Top expanding and top shrinking sectors. 2000-2008. Netherlands ... 27
Table 1. 9 Top expanding and top shrinking sectors. 2000-2008. Sweden ... 27
Table 1. 10 Shift-Share Analysis ... 31
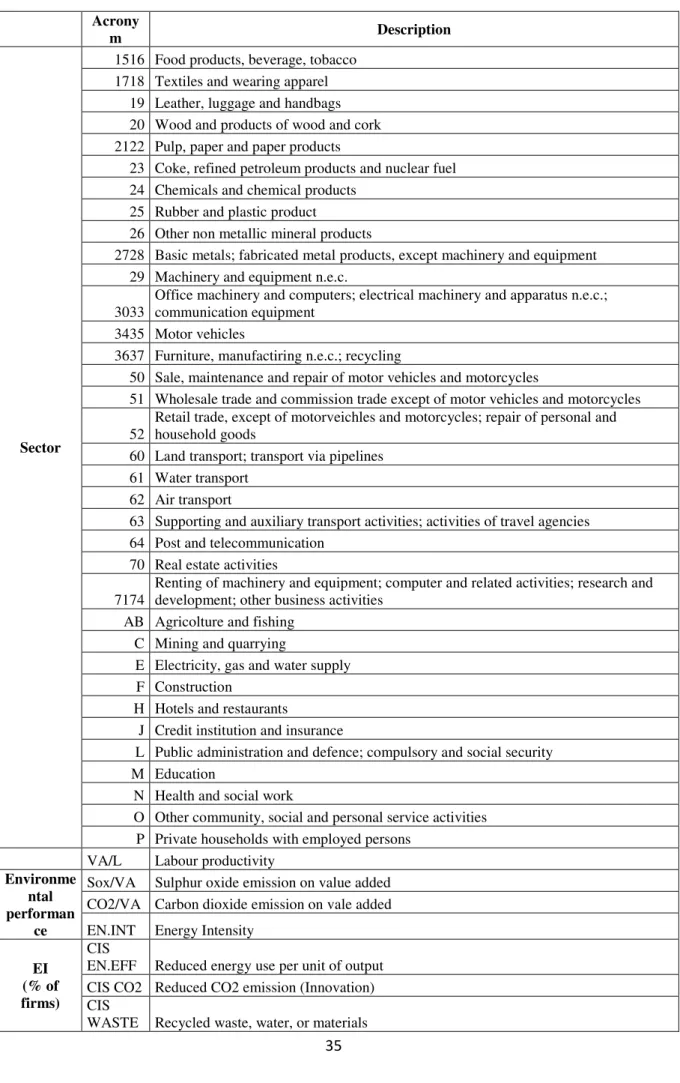
Table 1. 11 Table of acronyms ... 35
Table 1. 12 Average values for the EU sectors ... 36
Chapter 2 Table 2. 1 Description of variables ... 48
Table 2. 2 Complementarity test; all sectors (mean value variable dichotomisation) ... 53
Table 2. 3 Complementarity test; manufacturing sector (mean value variable dichotomisation) ... 53
Table 2. 4 Complementarity test; ETS sector (mean value variable dichotomisation) ... 54
Table 2. 5 Complementarity test; all sectors; northern Europe (mean value variable dichotomisation) ... 54
Table 2. 6 Complementarity test; manufacturing sector; northern Europe (mean value variable dichotomisation) ... 55
Table 2. 7 Complementarity test; ETS sectors; northern Europe (mean value variable dichotomisation) ... 55
Table 2. 8 Correlation matrix ... 58
Table 2. 9 EI and Organisational Innovation. States of the world... 59
Table 2. 10 EI and Product Innovation. States of the world ... 60
Table 2. 11 EI and Process Innovation. States of the world ... 61
4
Table 2. 13 Complementarity test; manufacturing sector; (first quartile variable
dichotomisation) ... 62
Table 2. 14 Complementarity test; ETS sector; (first quartile variable dichotomisation) ... 63
Table 2. 15 Complementarity test; all sectors; southern Europe ... 63
Table 2. 16 Complementarity test; manufacturing sector; southern Europe ... 64
Chapter 3 Table 3. 1 Description of variables ... 73
Table 3. 2 Fixed effect regression results. Total patent used as technological change indicator. ... 79
Table 3. 3 Fixed effects regression results. Green patents used as technological change indicator. ... 81
Table 3. 4 Policy adoption by category of instrument. ... 90
Table 3. 5 Random effects regression. Total patents used as technological change indicator. ... 92
Table 3. 6 Random effects regression. Green patents used as technological change indicator. ... 92
Table 3. 7 Fixed effect regression results including time and sectorial interaction (left column) and individual trend (right column). Total patents used as technological change indicator ... 93
Table 3. 8 Fixed effect regression results including time and sectorial interaction (left column) and individual trend (right column). Green patents used as technological change indicator ... 94
List of Figures Figure 3. 1 Aggregated CO2 emissions and Value Added variation in 1995-2009 ... 75
Figure 3. 2 Aggregated total patents and green patents variation in 1995-2009 ... 76
Figure 3. 3 CO2 variation by country. 1995-2009. (1) ... 84
Figure 3. 4 CO2 variation by country. 1995-2009. (2) ... 84
Figure 3. 5 CO2 variation by sector. 1995-2009. (1) ... 85
Figure 3. 6 CO2 variation by sector. 1995-2009. (2) ... 85
Figure 3. 7 CO2 variation by sector. 1995-2009. (3) ... 86
5
Figure 3. 9 CO2 and Value added scatterplot by sector (2) ... 87
Figure 3. 10 CO2 and Value added scatterplot by sector (3) ... 88
Figure 3. 11 CO2 and Value added scatterplot by sector (4) ... 88
Figure 3. 12 CO2 and Value added scatterplot by sector (5) ... 89
Figure 3. 13 Total patents application in ETS and non-ETS sectors. 1995-2009 ... 89
Figure 3. 14 Green patents application in ETS and non-ETS sectors. 1995-2009 ... 90
Figure 3. 15 Policy adoption by instrument and sector ... 91
6
Introduction
At the end of the ‘90s, 186 countries were signing the international agreement known as Kyoto protocol, which commited its participants to the achievement of a binding emission target throughout its different phases. Within this international framework Europe played its role by setting up a multitude of policy programmes to support innovation, investment and the development of the right infrastructure towards a low-carbon economy together with the defense of the economic growth.
As it is commonly acknowledged in the literature (Popp et al. 2009a; Jaffe et al. 2002; Porter & Linde 1995) environmental policy can help firms to reduce polluting emissions by helping them to identify weaknesses and wastefulness in their production processes, incentivizing the adoption of new practices and simultaneously reducing their environmental impacts. Along with other factors, policy turned to be pivotal in the adoption of environmental innovation (Ambec et al. 2013; Carson 2009), which have been defined as a particular kind of innovation which can significantly lower pollution, environmental risk and other negative impacts of resources use (Kemp & Pearson 2007)
However, even if both the drivers and the effects of innovation and environmental innovation can be considered of relevance to address the policy decision-making process, the literature mostly focused on the factors which incentivize the adoption of innovation. Therefore, researches in the field of the environmental effects of innovation are still rather scarce.
The aim of this dissertation is thus to contribute to this emerging stream of research.
The analysis of the existing contribution, highlighted the presence of at least three mechanism through which innovation spreads its effect on the environment.
A first mechanism through which green technological change can affect environmental but also economic performances, is by inflating the effect of other key variables; for example in a paper by Mazzanti & Zoboli (2009), which analyses data for 29 manufacturing sectors in Italy and 6 pollutants between 1991-2001, innovation effects are not observed directly but are entangled into an increased labour productivity (i.e., labour productivity increases due to the introduction of new products or processes). In Marin & Mazzanti (2010), which analyses the relation between environment and labour productivity in Italy between 1990 and 2007, innovation efforts are disentangled from environmental productivity including data on R&D; results show that innovation efforts are weakly
7
economically relevant, indicating that these efforts alone cannot yet be considered as a driver of an improved environmental performance.
A second relation between innovation and environmental performance is driven by administrative and geographical features: local government and regulation as well as local industrial specialization and innovative capabilities, act by influencing decisions of firms in neighbouring territories. Mazzanti & Montini (2010), analyses environmental performance of a set of ten pollutants in Rome and in the Lazio region with respect to the average Italian performance. Regional environmental performance resulted to be better than the national one, especially due to structural and present economic conditions which makes Lazio a less emission intensive and energy intensive region; however, other factors have been found significant in abating emission: first the role of both private and public expenditure in R&D and particularly their interaction; second and most important , innovation appears to be predominant to assume an higher importance than policies targeted on environmental externalities in reducing emissions. Costantini et al. (2013), consider the role of sectorial innovation, regional environmental spillovers and environmental policies to investigate the determinants of sectorial environmental performance in Italy. Results show that innovation spillovers and environmental spillovers can drive regional and sector-specific environmental outcomes; according to the authors, this may indicate the presence of both a sectorial agglomeration in restricted areas and the presence of a common innovation pattern within regions (i.e., common choices in the adoption of cleaner or dirtier technologies, within geographical areas). Finally, they argue that spillovers may also play a greater role than innovation itself in defining environmental performances.
The third and final channel through which innovation affects environmental sustainability is industrial spillovers. As underlined by Dopfer (2012) it is at the “meso” level, which indicates a sectorial level of analysis, that innovation diffuses. Therefore, industrial spillovers may allow a wider adoption of innovation and consequently may contribute to enhance some potential environmental benefit. Corradini et al. (2014), who investigates the link between environmental protection and innovation, analyses 23 manufacturing branches in the EU15 from 1995 to 2006, and find a positive relation between investment decision in innovation by one sector and pollution abatement efforts of other sectors (for examples, investment in R&D in a sector, positively reacts to pollution abatement choices in other sectors). Moreover, the authors underline how also in this case, environmental spillovers appear to be more important than knowledge spillovers in determining environmental performances.
8
Beside these contributions, there exist other analysis which highlighted some environmental effect of innovation, even though their main focus is not on the investigation of this relation. For example, Ghisetti & Quatraro (2013), examined endogenous factors inducing intra-sectorial diffusion of innovation and found the introduction of green technologies as a response to environmental performance; in other words, polluting firms often commit resources to environmental-friendly technologies as a response to an increased awareness of their social and environmental responsibility as well as a precautionary action towards future regulation. Wang et al. (2012) analyses the impact of both fossil fueled technologies and carbon free technologies on CO2 emissions across 30 Chinese provinces between 1997 and 2008; the authors find that while fossil fueled technologies do not appear to affect CO2 levels, carbon free technologies have a significant influence on pollution abatement, particularly in western China. Carrión-Flores & Innes (2010), studies the bi-directional link between environmental innovation and air pollution for 127 American manufacturing industries over the period 1989-2004. Their findings show a negative and significant bi-directional relation, namely innovation reduces the cost of meeting pollution targets while tightened pollution targets elevate the potential cost-saving benefits of environmental R&D, enhancing more innovation.
Given the scarcity of contribution in this field and consequently, the lack of a framework of reference, there are rooms to extend and deepen the analysis. First, the majority of the articles collected focused on the Italian context which certainly represents a heterogeneous economic and environmental context. However, similar studies carried across the European Union would be of greater interest, in the light of the strongly different economic and institutional conditions among its countries, as well as its very heterogeneous environmental responsibility awareness. Moreover, also papers which consider extra-European countries are not numerous. A possible reason behind the lack of European and worldwide analysis in this sense might be a scarcity of adequate and relevant data. Second, the majority of the articles presented in this section uses an indicator of environmental productivity (Repetto 1990), which beside being informative from an economic point of view, may not be adequate alone to evaluate the effects of innovation or policies, for four main reason: first, both policies and innovation are targeted to affect a physical level of emission; second, variation of the environmental productivity indicator may be due to change in value added rather than changes in emission; third, econometric analysis can lead to biased estimates and inflated levels of significance because regressors
9
might be more correlated with value added than with emissions; fourth, endogeneity issues may arise due to the presence of value added1. Therefore, there is the need to consider also effects of innovation and other relevant variables on the physical level of emissions other than on the environmental productivity indicator. Finally, papers in this stream of research often consider only the sectorial level of analysis. Even if this is certainly the most appropriate dimension for this studies because of its importance in the diffusion of innovation, from one side efforts should also be directed towards firm level analysis to better understand microeconomics dynamics behind the achievement of a better environmental outcome; from the other side, also analysis at country level would be informative of the macroeconomic dynamics which drive the aggregated environmental performances.
The purpose of this thesis is to provide new insight on the effect of innovation along with other factors, on environmental performance. Economic, innovative and environmental performances of various European countries are considered, to the extent to enrich the literature by providing a European perspective; the unit of analysis is the sectorial level. Moreover, to enrich the analysis CO2 emissions level is included beside indicator of emission intensity and environmental productivity.
Environmental performances, innovation and competitiveness are then broken down in three different aspects. Chapter 1 provides a descriptive analysis of the economic innovative and environmental performances of five main European countries, representing very diverse economic and institutional contexts2. Following a rich strand of literature ( for example: Mohnen & Röller 2005; Antonioli et al. 2013; Cainelli & Mazzanti 2013) Chapter 2, analyses the interactions between different categories of innovation practices and their effect on environmental productivity. Finally, Chapter 3 analyses the dynamic relation between innovation and CO2 performances using a panel of 14 branches of the manufacturing sector in 13 European countries through fifteen years. Finally, a general conclusive section will collect and summarize the most important remarks.
.
1
The same reasoning applies to the emission intendity indicator, computed as
2
11
1. Environmental Innovation Adoption and Economic – Environmental
Performances. Sector Perspective on the EU: Structural Change and Dynamic Issue
1.1. Introduction
The main aim of the work is to draw a picture of the EU countries performances at the sector level in terms of eco-innovation (EI), economic specialization, economic productivity and environmental efficiency (Kemp 2000). The question is in a nutshell whether the EU economy has moved towards sectors that lead the way in terms of EI, and primarily whether there is a correlation between innovation (adoption), economic and environmental performances at a meso level of the analysis (sectors).
The rich information stemming from the CIS (Community Innovation Survey) 2008 is exploited. It covers all innovation adoptions by EU firms over 2006-2008, and for the first time includes EI along various types: CO2 reduction, energy efficiency, material and waste reduction, emission reductions, EMS/ISO adoptions among others.
The development and application of EI is the key issue around which the all reasoning on the green economy may revolve, and it is becoming the conceptual reference point for many regional and international public policies and management strategies. One of the most recent definitions of eco-innovation defines it as the production, application or use of a product, service, production process or management system new to the firm adopting or developing it, and which implies a reduction in environmental impact and resource use (including energy) throughout its life-cycle. This definition includes innovations whose environmental effects are not intentional. A relevant distinction can be made between end-of-pipe technologies and clean technologies integrated in the production process (for more insights around this definition see Kemp & Pontoglio 2011).
The wide dataset and array of information on EI allows describing in depth EI and its links with major factors that characterize the EU competitiveness and innovation potential. The aim is to integrate the EUROSTAT sector based CIS2008 data for EI with data on environmental performance by sector on waste and emissions and economic productivity, namely labour productivity as main indicator of economic performance
12
(WIOD3 sources), thus a meso economics perspective is taken, in line with the evolutionary thinking on innovation. Micro and meso levels are key to the understanding of innovation and economic-environmental performances (Dopfer 2012). The meso level is conceptually robust to analyse the diffusion of innovation and furthermore allows an easier comparison across sectors and countries, similar to that characterizing patent based analyses.
The empirical analysis is aimed at comparatively shedding light on the performances of EU sectors over the last decade. I first compare EI performances for key EU countries (Germany, Italy, France, and Netherlands, Sweden) that represent diverse economic and institutional settings. Leader and laggards are drawn out for the overall economy. It is of interest to associate EI diffusion performances with economic and environmental trends that characterize the EU economy in the way to possible changing specializations (within services and industry). Consequently, the focus is on analysing main sectors in terms of value added, and the most dynamic sectors, namely those that have greatly increased and diminished their value share over the recent past. One can thus have a look at both a static and a dynamic picture of the EU economic system.
The integrated analysis aims at shedding light mainly on:
• Whether and how ‘EI adoption intensity’ (by sector, by country) matches country environmental performances.
• Whether and how ‘EI adoption intensity’ matches country (changing) specialization, namely as example whether a country is specialized (ing) in sectors which shows high/low intensity of EI.
The analysis takes into account industry and services on the view of the structural/composition changes that are occurring in the EU economy. Finally, a decomposition of countries environmental performance differentials through the use of a shift-share analysis is proposed. This final exercise seeks to investigate if infra-countries environmental differentials are more related to different market structures (for instance specialisations in greener sectors) or depend on sectorial emission efficiency. In addition to extend the picture to all EU countries, chapter 2 tests whether EI and other typologies of ‘normal’ innovations are integrated or not, namely whether they are jointly adopted / positively correlated in major EU sectors. Finally, the productivity and employment effects of EI and joint innovations can be ascertained by more refined quantitative models. Here, a robust preliminary overview that sketches main factors and may offers food for thought to policy makers and innovation practitioners is offered. The last two sections propose two
3
13
additional exercises aimed at providing a clearer picture of intra country differential in both sectorial environmental and innovative performances.
In the following, Section 2 develops the conceptual background, Section 3 presents the results of the main analysis, Section 4 reports evidence for the shift-share decomposition exercise and Section 5 concludes.
1.2. Conceptual Background
The generation of new Input Output (I-O) tables at European Union (EU) level in recent EU FP7 projects, such as EXIOPOL and WIOD, is a good development towards more effective production and analysis of hybrid economic-environmental accounts, as well as the excellent releases by EUROSTAT of a first National Accounting Matrix including Environmental Accounts (NAMEA) for EU in 2011 (Costantini et al. 2011). Efforts in economic-environmental accounting offer rich extensions and potential links to many fields, such as innovation studies, but also mounting studies on international trade effects on the environment according to both consumption and production sustainability. The dynamic framework is intrinsically related to ongoing transformations of the economic and environmental systems, with innovation and policy as main levers of changes. Analysis of such a constantly transformed environment is what makes broad and hybrid approaches different from static, very narrow fields. The real challenge today is a deeper analysis and broader understanding of the dynamic world that presents many methodological, theoretical and empirical challenges. After consolidation of static environmental economics theory, dynamic thinking has increasingly emerged since the mid ‘90s.
A few more words on sector analyses and innovation should be added. Specific sector performances (innovative, environmental, and economic) are crucial to the future competitiveness and achievement of environmental targets in the EU.
Then, given the relevance of sector interdependences, the manufacturing sector cannot be the only focus of analysis when looking at innovation effects in open innovation systems. The increasing role of vertical integration makes it necessary to look at both industry and service industry innovation dynamics. The increasing role of vertical integration makes necessary to look at both within industry and industry-service innovation dynamics, especially for the case of ‘producer services’, in the standard OECD classification (sectors
14
from 50 to 74 in ISIC, especially financial, communication and business services, which also highlight the role of ICT in relation to environmental performances).
Moreover, the effects of environmental policy on the innovation system should take into account the increasing share of imported intermediate inputs implies that emissions associated to domestic output are partly leaked abroad through trade. By itself this can improve sectorial direct resource efficiency (RE) indicators. The ‘technology effect’ in this trade related perspective is important since it makes necessary to study both sides of the coin: how emissions are relocated abroad, but also how trade drives technology shifts/spillovers and how green technology can enhance the competitiveness of the EU. A multi-sector country based specific perspective is thus needed to discover weakness and strengths under the overall macroeconomic performance and strengthen future innovation trajectories in the EU. A meso/micro level perspective goes directly into the centre of innovation generation, diffusion, including the relevant technological spillovers occurring within industry, between services and industry, between innovators and adopters located in different sectors/countries. The heterogeneity of national policies, associated with the economic and technological interdependencies occurring between actors in various countries, also emphasizes the possibility of other ways of inter country policy transmissions.
1.3. Environmental innovation adoption, economic and environmental
performance
I use available data at sectorial level from both European Community Innovation Survey and WIOD database, to compare the economic and eco-innovative performance of five main European countries, namely Italy, Germany, France, Netherlands and Sweden. Five major countries are considered, that at the same represent different economic-institutional features to offer food for thought for further analyses.
WIOD database allows using data on value added, employment and CO2 and SOx emission; CIS data concern here three environmental innovation indicators out of the complete set: increasing energy efficiency, emissions reduction and waste reduction. The World Input Output Database (WIOD) is a result from a European Commission funded project as part of the seventh Framework Programme and has been developed to analyse the effects of globalization on socio-economic variables and trade, in a wide range of countries (the 27 EU Member States and other 13 major counties in the world, from 1995 to 2009). WIOD is made up of four different accounts (World Tables, National
15
Tables, Socio Economic Accounts and Environmental Accounts) For the purpose of this work, Socio-Economic and Environmental Accounts are used, both providing a wide range of economic variables such as value added and environmental variables as CO2 and Sox emission4.
Community Innovation Survey (CIS) are a series of surveys produced by the national statistical offices of the 27 European Union member states, also covering the European Free Trade Association countries and the EU candidate countries. The surveys have been implemented since 1993, on a two-yearly basis and are designed to obtain information on innovation activities of enterprises, including various aspects of innovation process, as innovation effects, cost and sources of information used. Data are collected at micro level, using a standardized questionnaire developed in cooperation with the EU Member States to ensure the comparability across countries.
The sixth CIS (2006-2008) collects data on environmental innovation for the first time5. Though it is a cross section dataset, it captures a 3 years time span of EI and is the first CIS survey that has included EI at EU level ever. Community Innovation statistics based data are the main data source for measuring innovation in Europe and are used in academic research as in Horbach et al. 2012, Borghesi et al. (2012) and Veugelers (2012) which exploit data for Germany, Italy, Belgium respectively. Micro and meso aggregation are available.
From a conceptual point of view, I refer to the integrated concepts of sectorial and national systems of innovation which have consolidated in the innovation oriented evolutionary theory (Malerba 2004).
I specifically capture in the following analysis economic sector performances by labour productivity (the economic productivity, labour units per value added) and environmental performance by the ratio of emissions on value added. The environmental performance is namely ‘economic’ in nature, and differs from other proxy indicators such as emissions per employee or emissions themselves. Analyses with those indicators are scope for possible further research.
4
The WIOD Database is available at: http://www.wiod.org/database/index.htm
5
16
1.3.1. Comparing major economies in a meso perspective
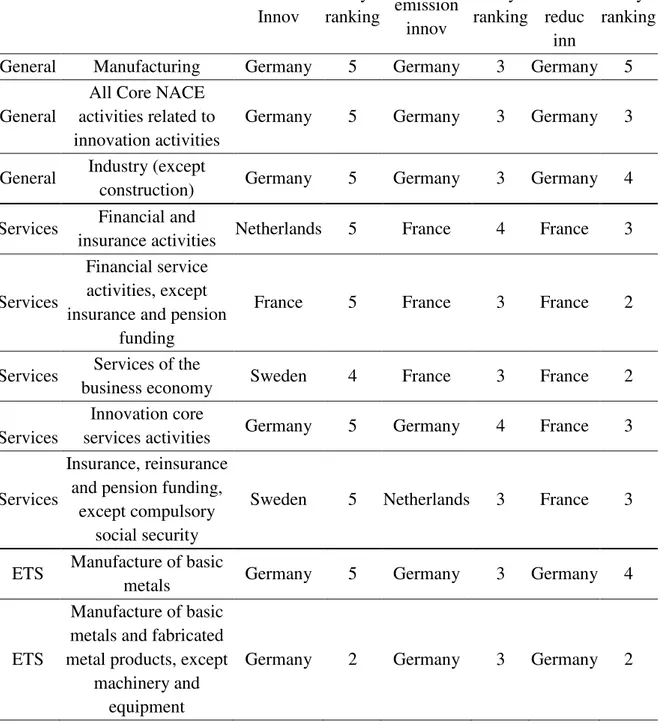
Table 1.1 exhibits the ranking of the five main countries (Germany, France, Italy, Sweden, Netherlands, the selection of which depends upon relevancy, heterogeneity, data availability) by percentage of adoption of environmental innovation. To provide various insights, some general economic categories are sketched and more specific ones such as some key services, utility sectors that are important insofar they manage natural resources, and heavy industrial sectors that for that reason are under the EU ETS policy aimed at cutting CO2 (potentially inducing innovation).
Looking at the three main eco-innovation indicators mentioned before, it is clear that leaders are Germany and France. Italy achieves the worst performance in most sectors of the five countries, except some ETS sector (manufacture of metal products, manufacture of paper, air transport) and a few services sector (financial services, services for the business economy).
Table 1.12 on the impact of innovation shows that services are plagued even in the EI realm by lower innovation intensity (the well-known ‘cost’ disease linked to lower productivity). This is relevant both for analyzing sustainability performances along the economy restructure towards services, and for understanding the extent to which increasing vertical integration affects innovation adoption on both sides. The key issue is that mere composition effects, due to innovation weaknesses in some branches and complex transmission of EI across sectors, do not automatically lead to lighter environmental impacts. Marin et al. (2012) show that the total (indirect and direct) emission of services might be close or equal to that of manufacturing.
Table 1.1 shows the expected dominance of Germany in EI adoption, which adds to its highest position in the ranking related to green patents. Germany leadership is driven by the superiority of its industrial core sectors.
The evidence for services is more mixed. Germany does not lead. France is on average the country which presents the best performance, with Sweden and Netherlands also appearing leaders in some cases. In services that are more integrated with industry Germany nevertheless appears to lead in some cases, thus showing the relevance of vertical integration. Though Italy presents a consistent gap concerning CO2 innovation, its role is not negligible in waste technological adoption. The role of packaging waste systems that have been effectively implemented by firms through covenants and schemes that fund recycling and recovery might be investigated in the future.
17
A final look at ‘utility’ related sectors shows that while the Germany strength is plausibly confirmed in (highly regulated) areas such as waste management and collection, France plays a major force as well. The gap between France and Italy in this field, where big utilities and public-private company are important players in the production of mixed public services, is worth being further investigated. The role of the (typology of) ‘decentralization’ of public services (higher in Italy in general terms) and related policies is a possible key issue. Its relationships with environmental innovations have been an overlooked fact.
Table 1. 1 Adoption of Environmental Innovation in years 2006-2008.
leader CO2 Innov Italy ranking leader emission innov Italy ranking leader waste reduc inn Italy ranking
General Manufacturing Germany 5 Germany 3 Germany 5
General
All Core NACE activities related to innovation activities
Germany 5 Germany 3 Germany 3
General Industry (except
construction) Germany 5 Germany 3 Germany 4
Services Financial and
insurance activities Netherlands 5 France 4 France 3
Services
Financial service activities, except insurance and pension
funding
France 5 France 3 France 2
Services Services of the
business economy Sweden 4 France 3 France 2
Services
Innovation core
services activities Germany 5 Germany 4 France 3
Services
Insurance, reinsurance and pension funding,
except compulsory social security
Sweden 5 Netherlands 3 France 3
ETS Manufacture of basic
metals Germany 5 Germany 3 Germany 4
ETS
Manufacture of basic metals and fabricated metal products, except
machinery and equipment
18
ETS
Manufacture of chemicals and chemical products
Germany 5 Germany 5 Germany 5
ETS
Manufacture of coke and refined petroleum
products
Germany 3 Germany 4 Germany 4
ETS Manufacture of fabricated metal products, except machinery and equipment
Germany 2 Germany 2 Germany 3
ETS
Manufacture of other non-metallic mineral
products
Germany 4 Germany 5 France 5
ETS Manufacture of paper
and paper products Germany 5 Germany 5 Germany 4
ETS Air transport Germany 4 Germany 5 France 2
Utility Sewerage France 4 Germany 4 Germany 4
Utility
Sewerage, waste management, remediation activities
Sweden 5 Germany 5 France 5
Utility
Waste collection, treatment and disposal
activities; materials recovery
Germany 4 Germany 3 France 4
Utility Water collection,
treatment and supply Germany 4 France 3 France 4
Utility
Water supply; sewerage, waste management and remediation activities
Sweden 5 Germany 5 France 5
Source: CIS Data estracted from Eurostat on line database (in May 2012)
Results of this ranking, prove a relative weakness of Italy in adoption of environmental innovation. The lens with a focus on Italy is relevant insofar it presents one element behind the current problematic unbalances in the EU. The ‘debt crisis’ is largely a problem of diverging economic productivities. Being Italy a big player in the EU, and second industrial country after Germany, one might state that this productivity gap, which certainly has as one of the main driving element a gap in extensive innovation adoption across sectors and regions.
19
1.3.2. Sector composition and joint performances
The following tables show economic, environmental6 and eco-innovative performances of (i) main economic sectors (§ 1.3.2.1), (ii) expanding and (iii) shrinking sectors (§ 1.3.2.2). The rationale is to offer a dynamic perspective.
The focus is on main sectors and the most expanding and shrinking ones, to offer a ‘structural change and dynamics’ perspective of the EU economy.
Selected variables for this analysis are labor productivity (Value Added in 1995 US Dollars / Numbers of employees), CO2 and SOx emissions per unit of Value Added, Energy Intensity (Total consumption of sectorial energy inputs), and the three eco-innovation adoption indicators (increasing energy efficiency, emissions reduction and waste reduction, taken from the CIS).
1.3.2.1. Main sectors
Tables from 1.2 to 1.9 refer to the five major countries selected (Tables 1.2 – 1.4 for main sectors, Tables 1.5 – 1.9 for expanding and shrinking sectors). The appendix shows summary values for all countries (Table 1.12) as well as a table of acronyms (Table 1.11). Generally speaking, the analysis of figures shows that economic and environmental ‘productivities’, value per labor and emissions per value, are likely to positively correlate in a dynamic perspective7. A positive correlation does not assure sustainability itself. This really depends upon the pace of the decrease. In the cases where value increases more than emissions, relative decoupling is achieved. Only if emissions decrease while the economy (or a sector) grows absolute decoupling is reached. In both cases emissions per value decrease. A descending emissions / value path thus only assure that decoupling is present. Absolute decoupling necessitates emissions to shrink. Radical inventions, innovation diffusion and structural decomposition are needed for this to come by.
The ‘Main’ sector are selected considering the generated sectorial value added in 2008 (Source: WIOD). Top expanding and top shrinking sectors are chosen by considering the
6
That capture ‘economic efficiency’, thus indicators of emissions per unit of value added.
7
In other terms, this means that one should expect sectors characterised by an high economic productivity (Value added per unit of labour) are also characterised by a low level of emissions (emission per unit of value added). This is a possibility over dynamic scenarios (Mazzanti and Zoboli, 2009), with innovation at the core and behind the correlation.
20
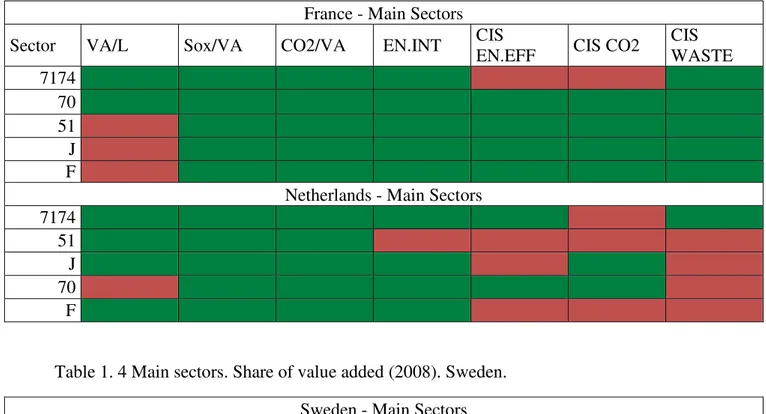
variation of the generated sectorial value added over 2000 – 2008. The first criterion allows analyzing the country’s industrial structure (before the 2009 recession), while the second allows identifying the ongoing transformation in the same economic structure. In this exercise, sectorial performances by country are compared with the European average: the corresponding cell in the tables below is ‘green’ if the sector/country performance is better than the European average; while a ‘red’ cell means that sector/country performs worse than the average. In all the tables of the present section, the calculations refer to the year 20088.
Table 1.2 first exhibits main sectors in Italy and Germany, two main industrial players9. Both countries are logically mainly composed by services sector, though Germany interestingly presents a still strong and possibly increasing manufacturing sector, that highlights the ‘heaviness’ of its competitive advantage (which is compensated by higher EI intensity).
Particularly in Italy the larger share of the value added is generated by real estate, which has a higher productivity than Europe and performs better for CO2 and SOX emissions too: this is an example of ‘joint’ performances. Though not over the average in Europe, we must highlight that the sector is not performing bad in EI terms.
A large share of value added is held also by the construction sector, which performances are generally above the European average. Significant areas are also credit and insurance and wholesale trade. The columns showing the environmental innovation indicators, corroborate the conclusion drawn from table 1 about the weakness in the introduction of environmental innovation in Italy, which is weaker than the EU average.
The German industrial structure is composed mostly by areas related to services but has a large proportion of value added generated by a manufacturing sector, namely the manufacture of computer and electrical machinery which, as will be shown later, turns out to be one of the growing sectors in German economy. It is clear that the adoption of technologies for energy efficiency and reduction of waste generation is widespread in all sectors and above the European average in most cases.
8
The European mean value is calculated as the un-weighted average of the different variable of interest, at sectorial level for EU27 countries. Other analyses might compare sectors to more specific average benchmarks (e.g. West EU, Euro area, etc..). Preliminary assessments have shown that results are somewhat robust to such sensitivity tests.
9
In terms of share within EU27, Germany is at 20% in both 2008 and 2011, while Italy shrinks from 13 to 12%. They account for 1/3 of GDP in the extended EU. France share rose from 15 to 16%, while Sweden and The Netherlands are respectively at 3 and 5%. The 5 countries considered, quantitatively amount at more than 50% of EU27 GDP.
21
Tables 1.3 and 1.4 report the sectorial composition of the economies of France, The Netherlands and Sweden for additional insights.
While the French and the Dutch industrial structure are constituted mainly by services sectors and construction, Sweden shows a great importance of manufacturing sectors as witnessed by computers and electrical machinery in the first row of Table 4. Even if Swedish environmental innovation performances are somewhat unexpectedly below the European average in many cases10, Sweden confirms to be a case where win win economic environmental performances may jointly appear. Though some more in depth investigations of the EI evidence related to CIS is needed, this is certainly a case where the policy-innovation-performance chain might emerge even at macro scale (Costantini et al. 2013; Costantini & Mazzanti 2012). One should recall that Sweden presents one of the highest environmental taxation share worldwide and an historically high carbon tax. On the contrary, the productivity of the French main five sectors is lower than the average; on the positive side, emissions and energy intensity are better than in Europe.
The adoption of eco-innovation is widely above the European average (with the exception of sector 717411), confirming the French leadership among the selected countries, as it was evident from Table 1.
Similarly to the French ones, the Dutch sectors obtain better productivity, energy intensity and emissions performance than Europe. In innovation terms, Real estate and renting, R&D and other business activity are above the average.
To sum up, the majority of the value added in the considered economies is produced by the services sector and by construction, as clearly expected. An interesting exception is Germany, which has a large proportion of its value added generated by manufacturing. The electrical machinery sector shows a very good overall performance. Besides the penalization in terms of ‘productivity’, which partially depends upon some outliers, if table 1.1 and 1.2 are linked the signal is that joint innovation-economic-environmental performance are feasible even at macroeconomic scale. Nevertheless, the German productivity is positive and correlated with very good performance for emission, energy intensity and CO2 abatement.
10
This is partly due to some missing observation in the CIS data for this country.
11
The sector 7174 is “Renting of machinery and equipment; computer and related activities; research and development; other business activities”
22
This case is anecdotal of the EU core specialization in export oriented industry branches. For the green economy to spread over the EU, those leading examples are to be imitated and followed by laggards.
The same comment applies on the leading performances of real estate in France and The Netherlands, and finally construction in France. An even better picture is being highlighted by the service branch ‘rent, R&D’ and ‘credit and insurance’ in Sweden, that matches positive trends over the average for economic, environmental and innovation factors. In the small group of five countries, Germany and France are confirmed leaders in the introduction of environmental innovation, reaching over the European average. Italy not only obtains lower results in economic-environmental performances in most sector branches, but shows an overall weakness in the introduction of environmental innovation compared to the other countries and the European average.
Further analyses are necessary to investigate (i) key eastern emerging players that are on the transition phase, (ii) more micro based data through specific focuses on sectors/countries.
Table 1. 2 Main sectors. Share of value added (2008). Italy and Germany: Italy - Main Sectors
Sector VA/L Sox/VA CO2/VA EN.INT CIS
EN.EFF CIS CO2
CIS WASTE 70 7174 J 51 Not available Not available Not available F
Germany - Main Sectors 70 Not available Not available Not available 7174 51 3033 J
23
Table 1. 3 Main sectors. Share of value added (2008). France and Netherlands France - Main Sectors
Sector VA/L Sox/VA CO2/VA EN.INT CIS
EN.EFF CIS CO2
CIS WASTE 7174 70 51 J F
Netherlands - Main Sectors
7174
51
J
70
F
Table 1. 4 Main sectors. Share of value added (2008). Sweden. Sweden - Main Sectors
Sector VA/L Sox/VA CO2/VA EN.INT CIS
EN.EFF CIS CO2
CIS WASTE 3033 7174 70 51 Not available Not available J
1.3.2.2. Expanding and Shrinking sectors performances
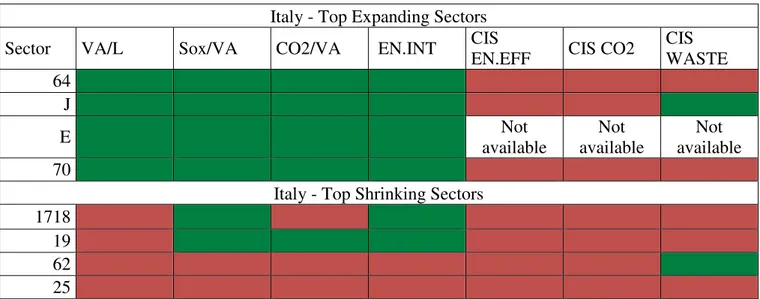
Tables to 1.5 to 1.9 present results for the top 5 expanding and the top 5 shrinking sectors at country level. They have been defined according to the increase/decrease in their share of sectorial VA to total VA between 2000 and 2008. This procedure helps pointing out the ongoing transformation in the economic structure of the five European counties.
In Italy (Table 1.5) the major growing industry in the time span considered is telecommunication, followed by credit and insurance, electricity supply and real estate, each showing better labour productivity, energy intensity and emission performances than Europe. Looking at the columns showing the environmental innovation indicators, we see that once again, Italy is below the European average in every sector. Focusing on the top shrinking sectors, we can see they are mostly related to the manufacturing industry and that
24
the productivity performance and emission have not been very brilliant when compared to the European one.
If attention is held to the shrinking sectors, it is clear that economic-environmental-innovation deficient performances go hand in hand. Failing to address the challenges of environmental policy and the necessary changes posed by the greening of the economy is one of the possible causes of decline. Even historical sectors can in fact reposition themselves in international markets by greening their strategies and processes through innovation investments.
Table 1. 5 Top expanding and top shrinking sectors. 2000-2008. Italy Italy - Top Expanding Sectors
Sector VA/L Sox/VA CO2/VA EN.INT CIS
EN.EFF CIS CO2
CIS WASTE 64 J E Not available Not available Not available 70
Italy - Top Shrinking Sectors
1718
19
62
25
Germany (Table 1.6), has witnessed a great expansion of water transport sector, which can boast higher productivity than Europe and a lower level of CO2 and SOx emissions; eco-innovation performances too are very good when compared to the EU average, as previously noted in the comparison with major countries. More broadly, transport activities have increased over time and have performed well in the adoption of environmental innovation, as it can be seen in the fourth row of the upper part of table 1.6. Among the expanding sectors computer and electrical equipment is in the second row; one may conclude that Germany’s industrial structure differs from other countries since manufacturing not only hold a large amount of value added but is increasing its share over time. Among the shrinking sector manufacturing of wood products, construction, air transport and petroleum products are present. Even if these sectors have progressively reduced their share within the German economy, the adoption of environmental innovation is widespread and up above the European average. The structural re-composition of the
25
economy shows almost a full integration of good innovation-economic and environmental performances.
Innovation is a key issue in the strategy associated to the sectors that are more exposed to the challenges of competitiveness by emerging countries. Their share can shrink due to somewhat natural economic changes, but productivity and wages can be sustained through innovation efforts.
Germany is thus emerging out of the EU average regarding both major and more dynamic sectors. This outstanding performance we know all is part of the EU problem, in the sense that the consequential current account surplus is paradoxically too high at the moment, larger than the Chinese one. Notwithstanding the fact that Germany should probably compensate
Table 1. 6 Top expanding and top shrinking sectors. 2000-2008. Germany Germany - Top Expanding Sectors
Sector VA/L Sox/VA CO2/VA EN.INT CIS
EN.EFF CIS CO2
CIS WASTE 61 3033 64 63
Germany - Top Shrinking Sectors
20 F Not available Not available Not available 62 23
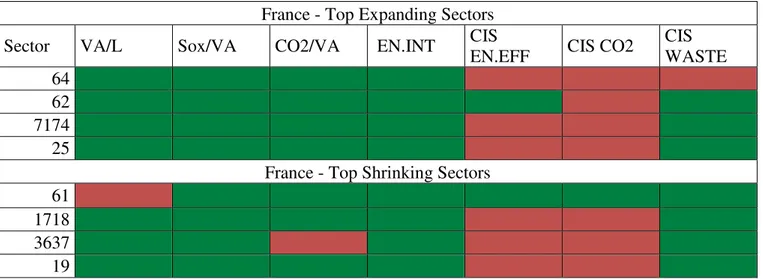
The French situation is shown in table 1.7: expanding sectors are telecommunication, air transport, R&D and other business activities and rubber and plastics. Labour productivity and emission performances are above the European average, even if EI adoption appears to be lower than in Europe, particularly in expanding sectors. Sectors decreasing the generated value added over time belongs to the manufacturing sector (furniture, leather, textiles); despite that, adoption of environmental innovation is higher than European average, particularly for waste reduction. With respect to manufacturing of electrical apparatus and manufacturing of petroleum products, innovation has been introduced for increasing energy efficiency and CO2 abatement.
26
Linking this picture to the past economic performance of France, it can be said that the real strength of Germany is really the high value added export oriented manufacturing. On average, manufacturing produces higher value added per employee with respect to most services. Despite the problematic macro performance of France over the recent years, its strength in services seems a strong pillar of the future EU economic development.
In addition, it has to be noticed that the adoption of EI is not an isolated phenomenon, but something that is intrinsically integrated with technological development and organizational change in a broad meaning. The future economic power of the EU and the possibility to effectively integrate economic and environmental for a green sustainable economy depends upon the diffusion of EI in firms and sectors as key assets that complement other techno-organizational innovations, not just end of pipe technologies.
Table 1. 7 Top expanding and top shrinking sectors. 2000-2008. France France - Top Expanding Sectors
Sector VA/L Sox/VA CO2/VA EN.INT CIS
EN.EFF CIS CO2
CIS WASTE 64 62 7174 25
France - Top Shrinking Sectors
61
1718
3637
19
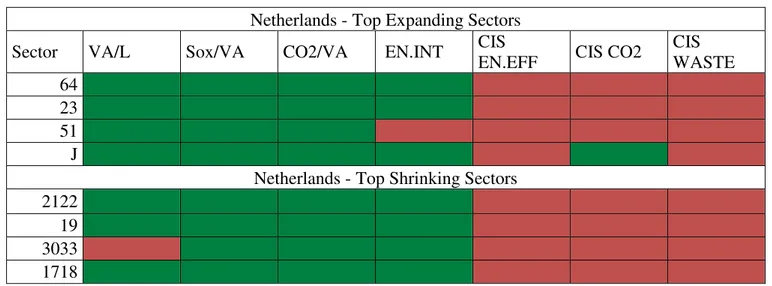
The Netherlands has seen a greater expansion of services sector (telecommunication, wholesale trade, credit and insurance) as it can be seen in table 1.8. Manufacture is also present, with petroleum products. Expanding and shrinking sector performances are generally below the EU average in terms of eco-innovation adoption. The only exception is credit and insurance, which exhibits an above than average level of CO2 reduction innovation. Despite that, labour productivity and general environmental performances (SOx/VA; CO2/VA) are well above the EU27 level
Overall, The Netherlands performance seems relatively weaker than that of the two major countries Germany and France. Cases of full economic-environmental-innovation joint performances are not observed.
Table 1.9 shows the Swedish situation: as it can be seen, both top expanding and top shrinking sectors are generally better than Europe in terms of productivity and emission.
27
As in Germany, Sweden is experiencing a growing importance of some manufacturing sectors (petroleum products and electrical machinery) followed by water transport and textiles. Among the shrinking sectors, one can count land transport, pulp and paper, air transport and textiles. Generally speaking, all sectors have introduced some type of eco-innovation with the exception of telecommunication, which performs worse than the EU average as regarding EI. Among shrinking sectors, for instance, ‘land transport presents a very good integrated performance, and similarly to Germany, many shrinking sectors appear to position themselves in competitive niches.
Table 1. 8 Top expanding and top shrinking sectors. 2000-2008. Netherlands Netherlands - Top Expanding Sectors
Sector VA/L Sox/VA CO2/VA EN.INT CIS
EN.EFF CIS CO2
CIS WASTE 64 23 51 J
Netherlands - Top Shrinking Sectors
2122
19
3033
1718
Table 1. 9 Top expanding and top shrinking sectors. 2000-2008. Sweden Sweden - Top Expanding Sectors
Sector VA/L Sox/VA CO2/VA EN.INT CIS
EN.EFF CIS CO2
CIS WASTE 23 3033 61 64 Not available
Sweden - Top Shrinking Sectors
60
2122
62
1718
In summary, in the selected countries, manufacturing industry has been expectedly shrinking while the services have risen. As seen above, this general trend is not completely followed by Germany, which sees an expansion in some manufacturing sector, namely the
28
manufacture of machinery and electronic apparatus. It is important to notice that these expanding manufacturing sectors are a case where win-win economic-environmental performances appear achievable through the adoption of innovation. Sweden also shows cases in non-manufacturing expanding sectors and in manufacturing shrinking sectors where win-win performances are likely to emerge if EI is strongly diffused. Moreover, Netherlands and Sweden are bounded to the industry of petroleum products, which increased over time and adopted a significantly share of environmental regulations. Though the less pronounced manufacturing role of France is possibly now penalizing the economy for GDP growth, the good economic-environmental-innovation performance of its services sectors are good signs for the EU, in light of a stronger integration and of a future EU overall competitiveness based on the country’s natural and established sector specializations.
For what concerns Italy, both economic, environmental and eco-innovative performances are weak; this is true for both major, top expanding and shrinking sectors. The relative weaker performance is perceivable even if looking at tables in the appendix. Though the ratio GHG/ value added had decreased (recall that decreases, thus improvements of economic efficiency, are driven by cut in emissions and/or increases in economic value), the improvement is lower than that observed for other countries. The productivity weakness matches the difficulty of cutting emissions. This is another point for stressing that sustainable paths towards a greener economy are better achievable if economic and environmental productivities dynamically correlate with the action of (process and product) innovation diffusion behind the scene.
1.4. Decomposition of environmental performance differentials: a shift-share
analysis
The evidence proposed in the previous paragraph, show how the selected countries tend to be more environmental efficient than the EU27 average, with respect to the chosen indicators (namely Emission intensity; CO2/Va and SOX/VA). However, this narrative evidence do not account for the overall environmental efficiency differential between the selected countries and the European average, which will be addressed here thanks to a shift-share decomposition analysis12. One of the main advantage of such a technique, which has a long history in growth and urban economics (see among others: Dunn 1960;
12
Shift share analysis can also be conducted on single sectors, but an aggregate index of the overall country performances is preferred.
29
Garcia-Milà & McGuire 1993; Esteban 2000) relates to its ability to decompose the factors characterizing different growth differential between a single region or country and a benchmark (for instance the country in which the region is contained or, as in This case, the EU27). In these traditional studies the essential idea was to decompose the growth differential between each regional and the national average, in its two main factors: the region performing generally better than average or a regional specialisation in fast growing sectors. Starting from this approach, Mazzanti & Montini (2009) adopted the shift-share analysis to decompose the total emission efficiency differentials in three components, generally called structural (μ), differential (π) and allocative (α).
If, for instance one consider as indicator of emission intensity E/VA for EU27 (the benchmark), and EDE/VADE for Germany, the total indicator can be decomposed as the sum
of (ES/VAS)*(VAS/VA), where ES is sectorial emission level and VAS/VA is the share of sectorial Value Added on Total Value Added for sectors s, where s range from 1 to j (j are the number of sector included in the WIOD accounts, see table 10 in the appendix for the full list of sectors included in the analysis Finally, in the following equations, I use the following notation:
• X is the emission intensity index (where X=E/VA for EU27 and XDE=EDE/VADE
for Germany13), and XS is the sectorial emission intensity. In other term =
∑ ; = ∑ .
• PS is the sectorial value added and is define as PS=VAS/VA.
On this basis, the emission efficiency differential between Germany and the EU27 average can be decomposed and written as XDE-X, in three different components:
1. The structural factor (μ) or industry mix, which indicates the environmental efficiency share attributable to the particular industry mix of the country with respect to the EU average. This effect is given by:
= ( − )
and assume positive (negative) value if the region is specialised in more (less) polluting sectors (according to the chosen indicator).
2. The differential factor (π), which measure that part of differential due to the country being more efficion in abating emissions than the EU average, which is derived as:
= ( − )
13
30
And assume on positive (negative) values when the country is less (more) efficient in terms of emissions, under the assumption that the country industry mix coindices with the EU one.
3. Finally, the last factor, called allocative (α), is given by the covariance between the previous two components, and represent the contribution to a country energy efficiency given by its specialisation in greener than average countries. It is calculated as:
= ( − )( − )
A positive (negative) value of the αDE factor would mean that Germany is
specialised in more (less) polluting sectors, in which is less (more) efficient respectively to the EU average.
Interestingly, the sum of these three factors give the exact emission efficiency differential, or in other term XDE-X= μDE+πDE+αDE, which provide an interesting complement to the
analysis resented in the previous chapter, enriching the sectorial evidence presented in the previous tables with a broader analysis. The results of this decomposition are presented in the following Table 1.10, which present the emission differential Xi-X and its
31
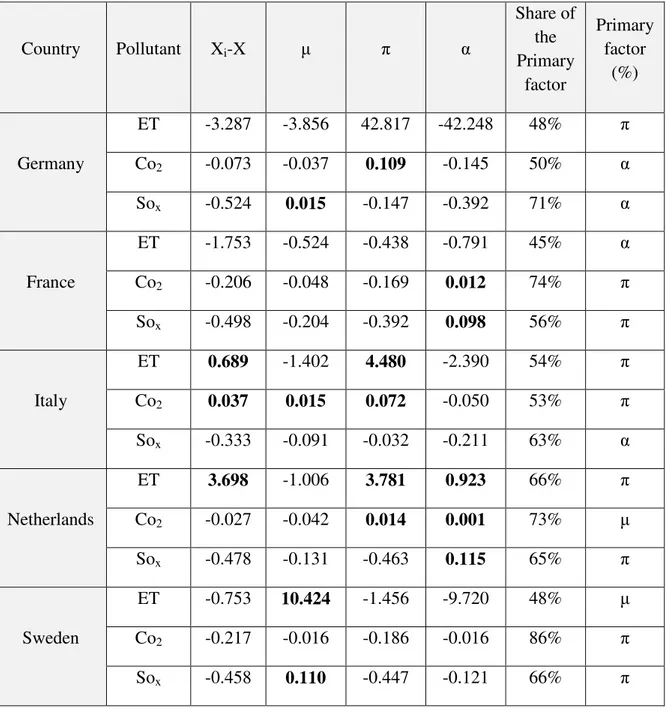
Table 1. 10 Shift-Share Analysis
Country Pollutant Xi-X μ π α Share of the Primary factor Primary factor (%) Germany ET -3.287 -3.856 42.817 -42.248 48% π Co2 -0.073 -0.037 0.109 -0.145 50% α Sox -0.524 0.015 -0.147 -0.392 71% α France ET -1.753 -0.524 -0.438 -0.791 45% α Co2 -0.206 -0.048 -0.169 0.012 74% π Sox -0.498 -0.204 -0.392 0.098 56% π Italy ET 0.689 -1.402 4.480 -2.390 54% π Co2 0.037 0.015 0.072 -0.050 53% π Sox -0.333 -0.091 -0.032 -0.211 63% α Netherlands ET 3.698 -1.006 3.781 0.923 66% π Co2 -0.027 -0.042 0.014 0.001 73% μ Sox -0.478 -0.131 -0.463 0.115 65% π Sweden ET -0.753 10.424 -1.456 -9.720 48% μ Co2 -0.217 -0.016 -0.186 -0.016 86% π Sox -0.458 0.110 -0.447 -0.121 66% π
When considering the aggregate country environmental differential Xi-X previous evidence is clearly confirmed: the country selected tend to perform better than the EU 27 average, as confirmed by the negative sign of most of the coefficients14. There are however some interesting exceptions. Netherlands and Italy, in fact, despite being specialised in green sectors (with the exception, for both countries, of “Wholesale Trade”, see tables 1.2 and 1.3 of the previous chapter), have an aggregate environmental
14 All the shift-share indicators are very simple to interpret. A negative sign always means a better than average
32
performance below the EU27 average respectively for Energy Intensity (NL) and energy Intensity and CO2/VA (IT). This result, as confirmed by the other column of the shift-share analysis is due by a mix of different Factors. For what concern Emission intensity, both countries are less efficient than EU average, as confirmed by the π factor, which account for the 66% of Netherlands differentials and the 54% of the Italian one. Similarly, also in the case of the Italian CO2/VA indicator, the below than average performances are
due to a mix of the π and α, which account respectively for the 53% and 10% of the total differential. Italy is both specialised in more polluting sectors and has a lower CO2 emission efficiency than EU27. If, on the other hand, the results for the industry mix factor (μ) are analysed some new evidence emerge. Germany and Sweden appear to be slightly more oriented towards SOX intense sectors, as shown by the positive coefficient associated
to this value. The magnitude of this element is however minimal, and account only for the 2% of german differential and the 16% of the Sweden one. More relevant is the case of Emission intensity, which despite being on average more efficient than the benchmark, shw and high specialisation in polluting sectors. Finally, despite the generally very positive performance of Germany, the π factor shows as the Country tend to be less efficient than average for what concern CO2 efficiency. A similar result is found in Netherlands.
1.5. Conclusion
The analyses in this chapter attempt to investigate the static and dynamic performance of EU sectors, trying to understand whether economic, environmental and environmental innovation performances in a joint fashion. I assess the hypothesis that performances may be linked based on a sector-based scrutiny of main 5 EU countries which show cross heterogeneity in the economic structure and accounts for more than 50% of EU27 GDP.
This chapter analyses the role of EI diffusion and its relationships with economic and environmental productivities, descriptively analysing performances for major sectors, top expanding and top shrinking branches. The idea is to provide a general but integrated assessment of how Europe has changed over the past, what performances sectors have shown, and finally whether the recent evolution of the economy is coherent (or not) with a greener, competitive, sustainable economy.
33
First, it has to be noticed, based on this investigation that economic and environmental performances are effectively potentially interrelated. Examples of integrated innovation-economic-environmental performances appear.
The current EU crisis is not a debt crisis per se, but a crisis that originates from a lack of convergence in relation to innovation and economic productivity performances. It is clear that environmental performances are far from being detached from the above performances. They are strictly integrated in what may be defined an ‘overall competitiveness’. Natural sector specialization of the economy matters in explaining competitiveness, but also industrial, innovation and environmental policies are part of the picture (as drivers of the integrated competitiveness).
It is shown how countries have specialized in quite different sectors – within the natural movement towards a service based economy. Though expanding and more competitive sectors show a relative higher likelihood of integrated performances, notice that even in shrinking sectors (typically manufacturing, thus directly more polluting) joint performances are present.
More specifically, some emerging sectors appear those that show the most fruitful amalgamation of economic and environmental dynamics. Innovation confirms to be often a key correlated factor. This is evident for the interesting case of electrical machinery in Germany, a manufacturing sector that has expanded in the EU, and for some cases in services in Germany and France (such as air transport) as well as Sweden (land transport). It is also worth noting how the overall performance of Germany and France, among others, is relatively better than that of countries plagued by structural productivity and environmental performance gaps due to a fiercer resistance of shrinking sectors to the challenges of international competition. In those countries, even a sector such as textile appears to defend itself through the adoption of innovation.
Expanding sectors lead the current and future re-composition of the economy, but shrinking sectors can produce economic and environmental value even at smaller shares. The importance of integrating economic and environmental performances on both sides of the structural re-composition of the EU economies is then clear for a comprehensive achievement of sustainability and competiveness.
A further extension of this analysis, which can add some new insights with respect to the gap between the northern European countries and the other countries, is to analyse the convergence15 in emission intensity indicator, in order to better understand if there is an
15
34
ongoing process of catching up by countries which lies behind in terms of environmental sustainability.