UNIVERSITÀ DEGLI STUDI DI FERRARA
DOTTORATO DI RICERCA IN
“SCIENZE DELLA TERRA”
CICLO XXVI°
COORDINATORE Prof. Massimo COLTORTI
Primary magmas, fractionation modelling and
mantle source of Etnean lavas
Settore Scientifico Disciplinare GEO/07
Dottorando
Tutore
1 INDEX
1. Introduction and aims of the research page 3
2. Geographic background page 5
3. Geological background page 6
3.1. Structural setting page 9
4. Volcanological evolution page 13
5. Sampling and analytical methods page 19
6. Gas and volume estimation page 25
6.1. Gas page 25
6.2. Volume estimation page 30
7. Melt inclusions page 32
8. Petrography page 37
9. Whole-rock geochemistry page 47
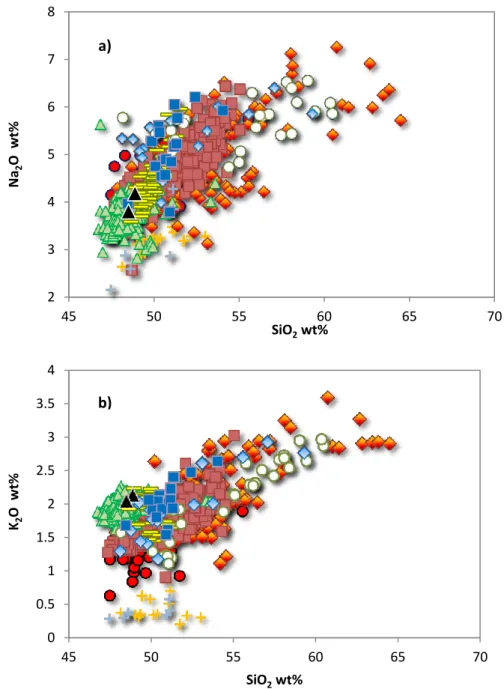
9.1. Major elements geochemistry page 47
9.2. Trace elements geochemistry page 57
2
11. Fractionation modeling page 74
11.1. Major elements fractionation modeling page 75
11.2. Trace elements fractionation modeling page 85
12. Melting modeling page 102
12.1. Major elements melting modeling page 103
12.2. Trace elements melting modeling page 105
13. Conclusions page 116
14. References page 120
Appendix A (CD-ROM)
3
1. INTRODUCTION AND AIMS OF THE RESEARCH
“Mt. Etna is one of the most active and emblematic Volcano in the World, it represents a reference point for a lot of Earth Sciences disciplines from Volcanology to Geophysics, representing an open-air laboratory. With this motivation the UNESCO committee decided during his 2013 annual session in Phnom Penh to include this volcano into the UNESCO World Heritage List. Mt. Etna, 3343 meters high, is the highest European Volcano and one of the most active in the world. With his about 103 m3 of volcanic material emitted every year is one the most studied volcanoes worlwide and a touristic destination of primary importance. For this reason is fundamental to take into account the hazard that could occurs to tourists, inhabitants, infrastructures and air-traffic in the area surrounding the volcano. In the last decades several eruptive events caused the closure of the “Fontane Rosse” Airport of Catania for few days and the destruction of edifices and roads along the southern (Rifugio Sapienza and Nicolosi) and northern flank (Piano Provenzana) of the Volcano. In order to reduce the risk connected to these events, it is necessary trying to understand the eruptive dynamics starting from the deep “roots” of the volcano. The investigation of the deep and shallow feeding system of Mt. Etna, and subsequently of his mantle source could give us some information about the eruptive style thus helping to predict future volcanic events and to reduce the hazard of them. This PhD project research wants to give some support to the Etnean volcanic hazard. It’s organized as following:
1) Stratigraphically controlled sampling of the whole Etnean magmatic suites.
2) Whole rock analyses of major and trace elements by X-rays fluorescence (XRF) (Laboratories of the Department of Physics and Earth Sciences – University of Ferrara).
3) Whole rock analyses of trace elements by Inductively Coupled Plasma Mass Spectrometer (ICP-MS) (Laboratories of the Department of Physics and Earth Sciences – University of Ferrara).
4) “In situ” major elements analyses of olivine, clinopyroxene, plagioclase, Ti-magnetite and amphibole phenocrysts by Electron Microprobe (EMP) (Laboratories of Padova, IGG-CNR).
4
5) Fractionation modeling for each magmatic suites.
6) First volume estimation of the volcanic edifice.
7) Melt modeling to investigate the Etnean mantle source.
5
2. GEOGRAPHIC BACKGROUND
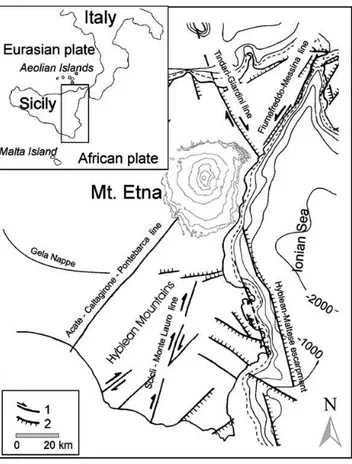
Mt. Etna is the highest active Volcano in Europe (is named Mongibello from the Arabic word gebel). It’s located in the northeastern sector of Sicily region and has an oval base area of 1418 km2 (47 km N-S and 38 Km E-W) (Tanguy et al., 1997). The Volcanic edifice lies on a big anticlinal structure dipping eastward, that is made up of tertiary and quaternary sedimentary rocks which constitute the base of the volcano. The maximum thickness of the volcanic pile resting on the sedimentary cover is estimated about 2000 meters (Tanguy et al., 1997). Mt. Etna is confined to the north by Alcantara River and Peloritani Mountains, to the east, for about 30 km, by the Ionian Sea, to the west by Simeto River and to the South by the Gela-Catania Plain that separate it from Mt. Iblei (Fig. 2.1). The volume of the whole volcanic edifice is estimate in about 370 Km3 of material (Neri and Rossi, 2002).
6
3. GEOLOGICAL BACKGROUND
Fig. 3.1.1 – Geological map of Sicily.
Mt. Etna is located in a complex geodynamic contest, at the intersection of the Maghrebian Chain, the Peloritani Mountains and the Iblean foreland (Catalano e D'Argenio, 1982; Ben Avraham and Grasso, 1990) (Fig. 3.1.1). Two main domains identify the structural setting of Sicily: i) the foredeep-foreland system of the southeastern part of the Island (Gela-Catania foredeep and Iblean foreland) and ii) the southward sedimentary successions related to the Eocene-Quaternary deformation of the paleogeographic domains into the northern sector of the Sicilian region.
The Iblean Foreland represents the southeastern corner of Sicily (Fig. 3.1.1) and reach 986
meters in altitude close to Mt. Lauro (Schmincke et al., 1997). It’s made up of an upper Triassic-Pleistocene massive, prevalently carbonatic succession with intercalations of basaltic
7
lavas of submarine and subaereal origin and from tholeiitic to nephelinitic affinity (Beccaluva et al. 1998). It is connected, by a NE-SW oriented fault system, to the Gela-Catania foredeep that is an upper Triassic tectonic depression interpreted as external foredeep (Cristofolini et al. 1979; Schmincke et al., 1997) filled by quaternary and recent sediments that cover the Pliocene and Lower Pleistocene Etnean volcanic products. All the main Iblean Plio-Pleistocene tectonic displacements occurred along a N-NE trust system faults located in the western sector of the Plateau (Grasso and Reuther, 1988; Schmincke et al., 1997). To the east The Iblean foreland is delimitated by the Ibleo-Maltese Escarpment. This is a trastensive fault system oriented NNW-SSE (N170°) and extending for 300 kilometers from the oriental Sicilian coast to the south with maximum vertical displacements of 2000 meters. The Gela Nappe is the most external front of the Maghrebian overthrust belt (Butler et al., 1992), generated by continental collisions between the African Plate and the Calabro-Peloritano Arc.
The Maghrebian Chain (Eocene - Quaternay) connects the Appennines with the Northern
African Chains (Fig. 3.1.1) and is formed by successions identified in three distinct structural – stratigraphical Units that were formed during the Miocene - Pliocene continental collisional tectonic (Catalano and D’Argenio, 1982).
The external Units:
I. Monte Judica Unit. Constitutes the Numidian Flysch
II. Imerese Unit. Identified by a thicker Numidian Flysch which is formed by an alternation of
brown clays and yellow quarzarenites (Upper Oligocene – Lower Miocene). They outcrop next to the Etnean western flank (Bronte).
The intermediate Units:
I. Panormide Unit. It took place after the Panormide carbonatic platform deformation (Catalano
and D’Argenio, 1982) and is represented by reef and back-reef facies. At the top, this succession is covered by the Gratteri Formation, marls and calcarenites with intercalations of quarzarenites that together with the Numidian Flysch represent the crustal xenolites found inside the 2001 and 2002-2003 eruptions lava flows (Michaud, 1995; Ferlito et al., 2009).
8
II. Sicilide Complex. Constituited by the Sicilide Unit and Mt. Soro Unit. They are related to
intense overtrusting events.
III. Calabridi Unit. It is made up of Paleozoic metamorphic successions, that lie tectonically on
the Mt. Soro Flysch (Catalano e D’Argenio, 1982). They could by divided into four more subunits: 1) Longi-Taormina Unit formed by a metamorphic basement and a Meso – Cenozoic sedimentary cover (it is delimitated by the Taormina lineation that separates it from the northern sector of the Appennine – Maghrebian Chain); 2) Fondachelli – Portella – Mandrazzi Unit; 3) Mandanici Unit constituited by epimetamorphites and 4) Aspromonte Unit (at the base of the succession) with high degree metamorphic rocks and intrusions of granites (Catalano e D’Argenio, 1982). They are covered by Capo D’Orlando Flysch made up of conglomeratic lenses and alternations of sandstones and marly – silty clays.
IV. Post – orogenic Units. This sedimentary succession that took place after the main Miocene
tectonogenic stage. In the southern sector of Mt. Etna they form most of the Gela Nappe and were involved into the recent tectonic deformations. They cover volcanites and old sedimentary deposites along Mt. Etna flanks (Catalano e D’Argenio, 1982).
9
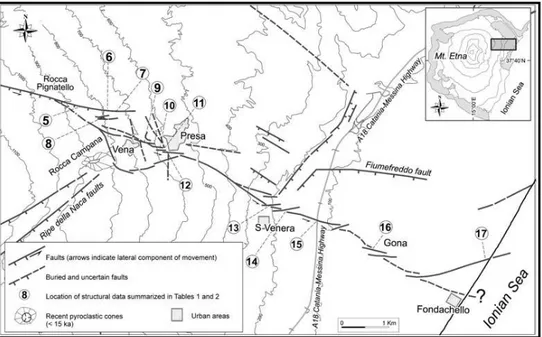
3.1 STRUCTURAL SETTING
Fig. 3.1.2 – Geological map of eastern Sicily 1) Tectonic lineations; 2) Main faults (from Patanè et al., 2006)
The tectonic setting of Mt. Etna is due to the interaction between regional tectonic dynamics and local processes concentrated into the Etnean area. It grew up at the intersection of three main regional fault system (Fig. 3.1.2):
I. Tindari – Giardini lineation, directed NW-SE and connected with the Ibleo – Maltese
Escarpment towards SE.
II. Messina – Fiumefreddo fault System, oriented NE-SE.
III. Kumeta – Alcantara fault System, directed ENE-WSW, that intersect the others lineation just north of the volcanic edifice.
10
Recently The Ibleo – Maltese Escarpment assumed a more important role than Messina – Fiumefreddo and Kumeta – Alcantara Systems. It is considered as the superficial expression of a main regional asymmetric rifting (Continisio et al., 1997; Torelli et al., 1998). The continental crust is 23 kilometers in thickness under the central portion of Sicily and becomes thinner reaching only 13 to 11 kilometers eastward under the Ionian Sea. This could represents a transition to an oceanic crust (Torelli et al., 1998). In this hypothesis the Ibleo – Maltese Escarpment would represents a passive continental margin separating the Sicilian continental domain from the adjacent Jurassic – Cretaceous oceanic basin (Reuther et al., 1993; Torelli et al., 1998). Another hypothesis argues against the oceanic nature of the Ionian crust and identifies this fault system as a deep intra-continental fracture, reactivated during the Miocene which separates the Sicily region from the nearby Ionian Sea (Scandone et al., 1981). The main Etnean tectonic structures are located in the eastern sector of the volcanic edifice and are represented by the “Timpe” system, extension to the north of the Ibleo – Maltese Escarpment. It is a normal-trust fault system, oriented NNW – SSE, that reaches 200 meters of displacement decreasing towards the Ionian sea (Azzaro, 1998; Nicolich et al., 2000). This system is very active and contributes to the topographic raising of the southwestern Etnean flank. Northward it is cut by the Pernicana Fault that is oriented E-W and separate a wide sector of the volcanic edifice, and by the Naca Fault System directed NE-SW. The Ragalna Fault System, oriented N-S and with a main normal-right displacement, borders the Etnean complex along his western flank. Finally in the southern volcanic flank two main isolated structures are found, the Trecastagni Fault and the Tremestieri Fault (Azzaro, 1998, Nicolich et al., 2000). Most of the earthquakes occur within the first 5 kilometers in the eastern sector of the volcano and although the low magnitude (M<4,8) they can generate destructive effects and extended shallow fractures. The geodynamic behavior of the volcanic edifice seems to be controlled by flank instability processes, like the oriental sector eastward dislocation. This is named “Valle del Bove”, a horseshoe shaped depression 7 kilometers long and 5 kilometers wide, bounded by steep wall up to 700-800 meters (Nicotra et al., 2011). It is interpreted as the result of a complex interaction between regional tectonic stresses and the gravity on the volcanic edifice. Pernicana Fault and Trecastagni and Tremestieri Faults identify respectively the northern and southern margin of this unstable sector (Azzaro, 1998). Valle del Bove has been extensively studied by numerous authors (Romano, 1982; Calvari et al., 1994; Coltelli et al., 1994, D’Orazio et al., 1997) because it exposes most of the Ancient Alkaline Centers products. The “Pernicana Fault System” (PF) is a E-W oriented fracture system 18 kilometers in length (Neri et al. 2004) of great importance for the Etnean eruptive dynamics. Here occur
11
most of the displacements after each eruptive event. As a result of the 2002-2003 Etna eruption, it propagated eastward with a predominant lateral-left displacement (Neri et al., 2005). Currently the PF can be subdivided into two main portions with different degree of displacement. The occidental one, 9 kilometers long, is associated with an intense shallow seismicity. The oriental one is the aseismic portion of recent formation (Fig. 3.1.3). The distinct seismic behavior could be related to different physics properties of the substratum (Neri et al., 2004). The NE-Rift (NE-SW) and the S-Rift (N-S) represent, in recent times, two other important fracture systems, directly connected to the main Etnean tectonic lineaments. They generated very dangerous lateral eruption with extended lava flows that could be able to invade the densely populated low Etnean flanks.
Fig. 3.1.3 - Structural map of eastern sector of Pernicana Fault, after the 2002-2003 eruption (from Neri et al. 2004)
12
13
4. VOLCANOLOGICAL EVOLUTION
The Mt. Etna volcanological evolution has been debated for three decades taking into account the Etnean volcano-stratigraphic units (Romano 1982) and several isotopic analyses. Condomines et al. (1982) utilized the 230Th/238U method followed by Gillot et al. (1994) that based on K/Ar measurements was able to identify clear temporal limits inside the Romano et al. (1982) chronological reconstruction. Recently Branca et al. (2008), on the basis of new stratigraphical data, recognized four main evolutional stages: Basal Tholeiitic (BT), Timpe (TI), Valle del Bove Centers (VDB) and Stratovolcano (SV). This marks a shift from the usual Romano’s chronology that distinguished the entire volcanological evolution in 5 different stratigraphic units: The Tholeiitic phase, Ancient alkaline eruptive centers, Trifoglietto Unit, Ancient Mongibello and Recent Mongibello Units. Branca et al. (2008) constrained his reconstruction using the K/Ar age determinations published by Gillot et al. (1994) and Tric et al. (1994).
One of the aim of this PhD research project was to establish a well defined and internationally acknowledged volcanological evolution of Mount Etna taking into account volcano-stratigraphic features, age determinations but specially geochemical and petrological affinities. For this reason was implemented a new volcanological evolution that could integrate all data from previous works (Condomines et al., 1982; Romano, 1982; Gillot et al., 1994; Tric et al., 1994; Branca et al., 2008; Nicotra et al., 2011 and reference therein):
Tholeiitic and transitional phase (500 – 220 ka ago)
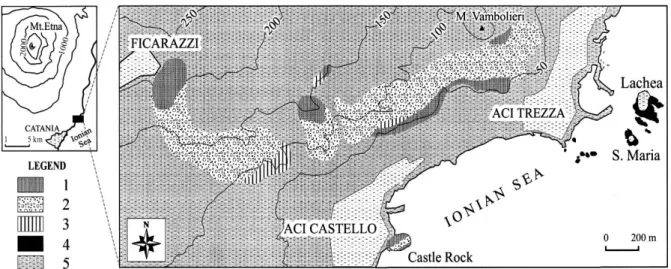
The volcanic activity started about 500 Ka ago (Gillot et al., 1994), several kilometers southeastward the actual Mt. Etna position, with fissural and submarine volcanism with tholeiitic affinity. The products emitted in this first stage represent only 10% of the whole volcanic edifice. Olivine-tholeiites lava flows (520 – 400 Ka ago) emitted by not connected fissures outcrop Near Aci Trezza, Ficarazza and Aci Castello towns (Tanguy et al., 1997). Younger basaltic lava flows and pigeonite tholeiites can be observed in correspondence of Adrano - Biancavilla and Santa Maria di Licodia - Paternò (300 Ka ago) respectively (Tanguy et al., 1997).
14
This first period is characterized by sub-volcanic bodies, pillow lavas and volcanoclastic breccia of tholeiitic affinity intercalated in the Gela – Catania foredeep’s marly-clay succession (Pleistocene) (Branca et al., 2008; Corsaro and Cristofolini, 2000). Several important outcrops are shown at the Castle Rock of Acicastello. Here pillow lavas are laterally associated to volcanoclastic breccia emitted by the same N-S oriented eruptive fissure. Marly-clay material is founded among the “pillows” indicating a shallow water depositional environment with intense clay accumulation (Simeto river’s paleo-alluvional plain). Adjacent to the pillow lavas hypoabissal masses and well developed colonnade lava flows are shown (Corsaro and Cristofolini, 2000). Pillow lavas and pillow breccias formed by angular pillow fragments inside a hyaloclastitic matrix outcrop westward. The oldest subaerial lavas are exposed in the volcano western flank, along the Simeto River’s left bank (Romano, 1982; Corsaro and Cristofolini, 2000; Branca et al., 2008). They form a basaltic succession (tholeiitic), from 5 to 25 meters thick, with pillow lavas facies and marly claystones at the bottom of the succession (Adrano and Santa Maria di Licodia) (Tanguy et al., 1997; Branca et al., 2008). Tanguy et al. (1997) in his detailed work recognized three main type of eruptive products with peculiar petrographic and geochemical features:
Fig. 4.1. - Sketch map of the tholeiitic lithotypes in the Acicastello–Acitrezza–Ficarazzi area. 1) Pillow-lavas and pillow breccia. 2) Volcaniclastic deposits. 3) Subvolcanic rocks with closely spaced columnar joints. 4) Subvolcanic rocks with widely spaced columnar joints. 5) Younger alkaline volcanics and sedimentary rocks
chiefly marly claystones; sands and gravels (Corsaro and Cristofolini, 2000).
i. Olivine-tholeiites. They show subaphyric texture with olivine phenocrysts in a course
groundmass mostly made up of plagioclase and clinopyroxene with dark-brown glass of rhyodacitic composition. These lavas are primary magmas (or at least primitive magmas), the
15
earliest and less evolved emitted at Mount Etna. They show high Mg, Cr, Ni and low alkalies and U and Th.
ii. Pigeonite-tholeiites. Less primitive magmas with a decidedly aphyric texture, rare olivine
phenocrysts and lower content in Mg, Cr and Ni than olivine-tholeiites type.
iii. Transitional tholeiites. They have lower normative olivine and hypersthene contents than the
two previously described groups. The texture varies from subaphyric - doleritic (as in a typical tholeiite) to porphyritic (as in basaltic alkaline lavas).
Ancient alkaline volcanism – AAV (220 - 60 Ka ago)
About 220 Ka ago the volcanic activity shifted northward along the Ionian coast with fissural eruptions of Na-alkaline products (Tanguy et al., 1997; Branca et al., 2008). This first alkaline stage generated a shield volcano, 15 km in diameter (oriented N-S) and 7 kilometers southeastward the actual volcano edifice (Branca et al., 2008). His products, with variable thickness from 10 to 100 meters, outcrop along the Acireale-Moscarello Timpa and form the bottom of the Acireale Timpa. Here the passage from a transitional to a Na-alkaline magmatism can be observed (from the base to the top of the succession). Contemporaneously some monogenic Na-alkaline volcanic centers were active close to the actual southern flank of Mt. Etna.
About 121 Ka ago the volcanic activity migrated (westward) to the “Valle del Bove” area and was characterized by the emplacement of the polygenic volcanic centers of “Tarderia” (106 Ka ago) and “Rocche” (102 Ka ago) recording the beginning of a central conduit type volcanic activity (Branca et al., 2008). Their products outcrop in the central zone of the volcano, along the northern rim of “Valle del Bove” (Val Calanna and Tarderia) (Nicotra et al., 2011). Afterwards some others ancient alkaline centers took place named Calanna, Triglioletto I and II, Zoccolaro, Vavalaci-Belvedere, Giannicola, Salfizio and Cuvigghiuni. Trifoglietto is the largest volcanic center developed from 80 to 60 Ka ago. It was located WNW of the primordial Etnean edifice (Tanguy et al., 1997).
16 Ellittico (60 – 15 ka ago)
About 60 ka ago, the main Etnean feeding system moved northwestward inducing the development of the Ellittico Center, the large Stratovolcano which constitutes the skeleton of the actual edifice (more than 1/3 of the whole volcanic edifice). It covered to the west the
ancient shield volcano products and to the southeast the Trifoglietto Unit lava flow successions (Romano, 1982; Tanguy et al., 1997). It was formed by an alternation of lavas and pyroclastic material that cover a wide compositional range and constituted a large volcanic edifice with steep flanks. About 15 Ka ago four sub-plinian eruptions partially destroyed the Ellittico Center (Branca et al., 2008) producing several Km3 of trachytes as fall and pyroclastic flow deposits. These events generated a 4 x 3 kilometers wide caldera filled by the subsequent Recent Mongibello products and lavas (Romano, 1982; Tanguy et al., 1997; Branca et al., 2008 and reference therein). Actually the Ellittico products outcrop along the western and southern rim of Valle del Bove. Their thickness range from 100 to 400 meter (Belvedere) and represent 90% of the whole Stratovolcano volume (Romano, 1982).
Recent Mongibello (15 ka ago – present day)
The last 15 Ka volcanic persistent activity formed the Recent Mongibello Volcano over-imposed on the Ellittico caldera (Romano, 1982; Tanguy et al., 1997; Branca et al., 2008). Its activity is characterized by different eruptive mechanisms related to the presence of an extensional tectonic regime. In general effusive activity prevailed on explosive phenomena but it showed always a wide range of eruptive styles. About 2 Ka the Recent Mongibello summit area collapse generated the “Caldera del Lago” filled by the actual summit craters products. All lavas and product emitted belong to Na-alkaline series and in lesser extent to K-alkaline series although since 1971 the K-affinity prevails on the Na-one.
Recent activity
Recent studies on the last decades eruptions (Allard et al., 2006) investigate the relationship between magma raising, flank instability and changes in eruptive style (summit and eccentric). Three periods were identified, the first from 1993 to 1995 with simply degassing from the summit area; the second from 1995 to 2001 with lava flows, strombolian activity and lava
17
fountains concentrated in the summit craters area (Fig. 4.2). In this second period were recorded the most intense eruptive events in the last 330 years of Etnean activity. Finally the third from 2001 to the present day with strong explosive activity and lateral eruptions (2001 and 2002-03 eruptions) (Andronico et al., 2009; Giacomoni et al., 2012) and an intense effusive activity from summit craters (2004, 2006, 2008, 2010 and the 2011-12 eruptions) (Neri et al., 2004; Ferlito et al., 2010).
The 2001 (Viccaro et al., 2006; Ferlito et al., 2008) and 2002-03 eruptions (Andronico et al., 2005 and 2009; Ferlito et al., 2009; Spampinato et al., 2008; Giacomoni et al., 2012) were hybrid and highly explosive events characterized by both central and eccentric activity. The 2002-03 eruption interested for the first time, after 70 years, both the NE and S-Rifts. The NE Rift is formed by a fissures system starting from the North East Crater (NEC, formed after the 1911 eruption) and going northeastward, constituting a topographic ridge, 5 kilometers long and 1 kilometer wide, made up of pyroclasts and lava flows (Ferlito et al., 2009). This structure is part of a more important and extended fracture system (NE-SW) from the summit of South East Crater (SEC; fig. 4.2) to the northern margin of Valle del Bove (Monaco et al., 2005; Patanè et al., 2006). The S Rift cuts the southern flank of the volcano and forms a fracture and fissures system directed N-S and SSW-NNE extending from “Montagnola” to “Nicolosi” town for about 10 kilometers. These structures constitute a volcanic ridge marked by a series of aligned eccentric cones (Patanè et al., 2006).
The 2004 effusive activity was followed by the 2006 eruption, culminated with the 16Th November paroxysm, that radically changed the summit area morphology (Ferlito et al., 2010). After the partial SEC collapse, the alternative emission of lava flows and strombolian activity until the 15th December originated the New South East Crater (NSEC). The 2008 eruption lasted 11 months and was very similar to the 2004 one with lava flows emission into Valle del Bove and weak strombolian activity confined to the summit craters. The 2010 activity was characterized by several strombolian events that generated dense ash plumes up to 1 km high. Between January 2011 and April 2012, 25 eruptive events were recorded, all of them lasted from several hours to 2-3 days and were characterized by rare lava flows and very intense strombolian explosions and lava fountains, in some cases up to 800 meters high (Braiato 2011-12).
The explosive behavior for 2001 and 2002-03 eruptions was strictly related (Ferlito et al., 2009; Giacomoni et al., 2012) to the presence of shallow magma batches and to the arrival of primitive and volatile rich magma bodies (Metrich et al., 2004) under the two Etnean Rift Systems, reactivated after long time. Otherwise the most recent activity involved only the
18
summit craters area in a open-conduit system where magmas can easily degas. A detailed study of 2001 and 2002-03 eruptions is reported in Ferlito et al., (2009) and Giacomoni et al. (2012). 2011 and 2012 strombolian and lava fountains events are well descripted in Braiato 2011-2012 that analyzed samples from most of the cited paroxysms.. During every strombolian event, the magma is replaced by a new and more primitive one. In this complex contest is very important to integrate these data investigating the shallow and deep plumbing system, the Etnean mantle source and his original volatile content to understand the future eruptive mechanisms.
Fig. 4.2 - Satellite image of Etnean summit craters.
“Bocca Nuova” and “Voragine Centrale” North East
Crater (NEC)
South East Crater (SEC)
19
5. SAMPLING AND ANALYTICAL METHODS
Fig. 5.1 - Map showing the sampling of Mt. Etna succession.
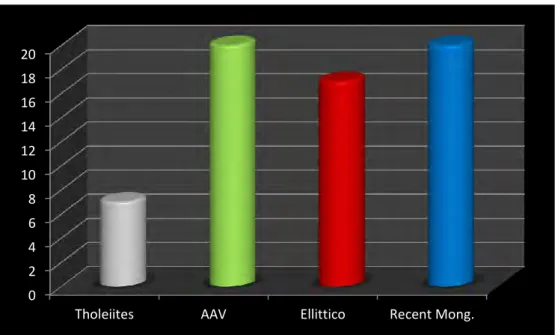
Fig. 5.2 – Statistical distribution of sampled rocks.
A detailed stratigraphically-controlled sampling was performed on the whole volcanic edifice for a total amount of 64 samples (lavas flows, pillow lavas and dykes). Position, elevation and typology of all the samples are reported in Table 1. GPS coordinates and altitude values were
0 2 4 6 8 10 12 14 16 18 20
20
taken by a Magellan Meridium Platinum. A representative number of rocks were sampled for each evolutionary stage of Mt. Etna volcanic activity (Fig. 5.1) in order to have a complete framework. This sampling helped also to complete the analyses for both Tholeiitic and AAV periods which are rather scarce in literature (7 Tholeiites, 20 AAV, 18 Ellittico and 19 Recent Mongibello) (Fig. 5.2 and Table 1). In some cases a detailed sampling of the entire volcanic successions was performed as for the ancient eruptive centers of Trifoglietto (AAV - Valle del Bove) and Ellittico (Fig. 5.3) with the aim to observe any geochemical variation during their evolution.
Fig. 5.3 – Satellite image of sampled Ellittico succession.
All samples were analyzed for whole-rock major and trace elements using X-ray fluorescence (Thermo ARL Advant XP). Intensities were corrected for matrix effects following the method of Lachance and Trail, (1996). Loss on Ignition (L.O.I.) was determinate by gravimetric method. All samples were left 12 hours at 100° Celsius to eliminate the hygroscopic water. After a first precision balance weight they were calcined in a muffle for 12 hours at 1100° Celsius and reweighed. L.O.I. values (wt%) were finally calculated using:
L.O.I. = (Weight Precalcination – Weight Postcalcination) / (Weight Precalcination – Weight Crucible)
21
FeO = Fe2O3 TOT / (1,2613)
Fe2O3 = FeO * 0,15
26 Representative samples were selected for Th, U, and REE analyses by means of Inductively Coupled Plasma Mass Spectrometry (ICP-MS, Plasma Quad 2Plus VG Elemental). Both major and trace element analyses were carried out at the Department of Physics and Earth Sciences of the University of Ferrara. Accuracy and precision were calculated by analyzing a set of international rock standards with certified values. Geostandards include: JP-1, JGb-1, BHVO-1, UB-N, BE-N, BR, GSR-3, ANG, MAG-1, JLs1 and JDo1. Accuracy for analyzed elements is in the range of 0.9 – 7.9 %. Conservatively, its assumed an accuracy of 10 % for all elements. Detection limits for U and Th are 0,01 ppm.
Porphyritic index (P.I.) was determined by means of Scion Corporation image elaboration program (www.scioncorp.com).
Major and minor elements for olivines, clinopyroxenes, plagioclases, amphiboles, spinels and apatites were carried out by an electron microprobe (EMP-Cameca SX-50) at laboratories of Padova, IGG-CNR, using both energy and wavelength dispersive spectrometry (EDS and WDS).
Routine WDS data were carried out on carbon-coated polished thin sections with an accelerating voltage of 20 KV, 40 nA beam current, and a counting time on peak of 120-130 seconds for ten elements analysis. Natural and synthetic standards were used for calibration. Phenocrysts of the main mineralogical phases were analyzed from 12 representative samples of the four evolutionary stages. Profiles were made following a step of 10-20 μm resulting in
22 Table 1 – Latitude, longitude and elevation
Sample Unit Latitude Longitude Elevation (m) Type Location
ET1 Tholeiites 37°33'14.58"N 15° 8'55.91"E 15 Pillow lava Acicastello ET2 Recent Mongibello 37°33'14.88"N 15° 8'55.50"E 16 Subaereal lava flow Acicastello ET3 Recent Mongibello 37°33'14.21"N 15° 8'55.30"E 17 Subaereal lava flow Acicastello ET4 Tholeiites 37°33'50.23"N 15° 9'47.03"E 5 Pillow lava Acitrezza ET5 Tholeiites 37°33'47.43"N 15° 9'45.14"E 7 Pillow lava Acitrezza ET6 Tholeiites 37°33'47.08"N 15° 9'43.25"E 8 Subaereal lava flow Acitrezza
ET7 AAC 37°37'9.90"N 15°10'9.46"E 161 Lava flow Acireale
ET8 AAC 37°37'11.05"N 15°10'9.54"E 161 Lava flow Acireale ET9 Tholeiites 37°33'38.33"N 15° 7'59.09"E 175 Lava flow Ficarazzi
ET10 Tholeiites 37°30'42.64"N 14°58'16.68"E 250 Lava flow Motta San Anastasia ET11 Tholeiites 37°33'33.57"N 14°55'12.24"E 299 Lava flow Paternò - railway
ET12 Ellittico 37°34'58.11"N 14°55'1.82"E 322 Lava flow highway Santa Maria di Licodia ET13 Tholeiites 37°40'27.78"N 14°49'55.41"E 597 Lava flow Adrano
ET14 Ellittico 37°40'40.39"N 14°49'15.91"E 424 Lava flow Adrano
ET15 Recent Mongibello 37°41'14.72"N 14°48'46.47"E 362 Lava flow From Adrano to Simeto Valley ET16 Recent Mongibello 37°41'59.14"N 14°48'14.14"E 374 Lava flow From Adrano to Simeto Valley ET17 AAC 37°42'2.88"N 14°48'0.14"E 360 Lava flow Saraceno Bridge
ET18 Recent Mongibello 37°45'30.94"N 14°48'57.60"E 605 Lava flow Mt. Barca ET19 AAC 37°45'55.11"N 14°48'8.00"E 502 Lava flow Mt. Barca
23
Sample Unit Latitude Longitude Elevation (m) Type Location
ET21 Recent Mongibello 37°47'20.19"N 14°50'32.99"E 855 Lava flow Bronte ET22 Recent Mongibello 37°47'16.26"N 14°50'55.04"E 889 Lava flow Bronte
ET23 Recent Mongibello 37°49'59.47"N 14°54'4.60"E 1010 Lava flow Maletto-Randazzo ET24 Recent Mongibello 37°50'37.88"N 14°54'39.99"E 947 Lava flow Maletto-Randazzo ET25 Recent Mongibello 37°52'25.80"N 14°56'19.58"E 795 Lava flow Randazzo
ET26 Recent Mongibello 37°52'31.82"N 14°58'29.41"E 734 Lava flow Randazzo ET27 Recent Mongibello 37°52'10.18"N 15° 2'15.36"E 667 Lava flow Pisciaro Pass ET28 Recent Mongibello 37°54'40.38"N 15° 3'4.37"E 611 Lava flow Mt. Mojo ET29 Recent Mongibello 37°51'33.46"N 15° 4'55.96"E 688 Lava flow Salicchiata
ET30 Recent Mongibello 37°48'43.28"N 15° 4'51.45"E 1308 Lava flow Piano Provenzana ET31 Ellittico 37°48'43.25"N 15° 4'51.43"E 1473 Lava flow Ragabo Refuge ET32 AAC 37°41'57.93"N 15° 3'12.98"E 1379 Lava flow Acqua Rocca
ET33 AAC 37°42'17.64"N 15° 2'50.38"E 1499 Dyke Acqua Rocca
ET34 AAC 37°42'19.20"N 15° 2'48.72"E 1530 Lava flow Acqua Rocca ET35 AAC 37°42'18.52"N 15° 2'47.94"E 1527 Lava flow Acqua Rocca ET36 AAC 37°42'31.57"N 15° 2'29.38"E 1768 Dyke Schiena dell'Asino ET37 AAC 37°42'32.50"N 15° 2'26.70"E 1800 Dyke Schiena dell'Asino ET38 AAC 37°42'30.96"N 15° 2'25.77"E 1815 Lava flow Schiena dell'Asino
ET39 AAC 37°42'38.43"N 15° 2'19.42"E 1720 Lava flow Valle del Bove - southern margin ET40 AAC 37°42'38.93"N 15° 2'18.72"E 1716 Lava flow Valle del Bove - southern margin
24
Sample Unit Latitude Longitude Elevation (m) Type Location
ET41 AAC 37°42'40.90"N 15° 2'19.60"E 1683 Lava flow Valle del Bove - southern margin ET42 AAC 37°42'40.83"N 15° 2'17.25"E 1686 Lava flow Valle del Bove - southern margin ET43 AAC 37°42'41.27"N 15° 2'16.93"E 1683 Lava flow Valle del Bove - southern margin ET44 Recent Mongibello 37°42'40.98"N 15° 2'18.20"E 1683 Lava flow Valle del Bove
ET45 Recent Mongibello 37°42'41.12"N 15° 2'17.99"E 1683 Lava flow Valle del Bove ET46 AAC 37°42'32.50"N 15° 2'28.77"E 1777 Lava flow Schiena dell'Asino ET47 AAC 37°42'32.50"N 15° 2'28.77"E 1777 Lava flow Schiena dell'Asino ET48 AAC 37°42'32.50"N 15° 2'28.77"E 1777 Lava flow Schiena dell'Asino ET49 AAC 37°42'32.50"N 15° 2'28.77"E 1777 Lava flow Schiena dell'Asino
ET50 Ellittico 37°45'8.56"N 15° 2'50.24"E 1964 Lava flow Valle del Bove - ColleSerra ET51 Ellittico 37°45'9.03"N 15° 2'50.53"E 1971 Lava flow Valle del Bove - ColleSerra ET52 Ellittico 37°45'10.01"N 15° 2'50.45"E 1983 Lava flow Valle del Bove - ColleSerra ET53 Ellittico 37°45'10.80"N 15° 2'51.12"E 2001 Lava flow Valle del Bove - ColleSerra ET54 Ellittico 37°45'11.88"N 15° 2'50.90"E 2019 Lava flow Valle del Bove - ColleSerra ET55 Ellittico 37°45'12.83"N 15° 2'51.33"E 2023 Lava flow Valle del Bove - ColleSerra ET56 Ellittico 37°45'13.66"N 15° 2'51.67"E 2030 Lava flow Valle del Bove - ColleSerra ET57 Ellittico 37°45'14.52"N 15° 2'51.36"E 2034 Lava flow Valle del Bove - ColleSerra ET58 Ellittico 37°45'15.17"N 15° 2'52.21"E 2039 Lava flow Valle del Bove - ColleSerra ET59 Ellittico 37°45'15.72"N 15° 2'51.72"E 2044 Lava flow Valle del Bove - ColleSerra ET60 Ellittico 37°45'16.31"N 15° 2'52.37"E 2052 Lava flow Valle del Bove - ColleSerra ET61 Ellittico 37°45'22.13"N 15° 2'53.21"E 2031 Lava flow Citelli Refuge pathway ET62 Ellittico 37°45'24.21"N 15° 2'55.34"E 2010 Lava flow (Cicirara) Citelli Refuge pathway ET63 Ellittico 37°45'28.07"N 15° 2'55.30"E 1992 Lava flow Citelli Refuge pathway ET64 Recent Mongibello 37°45'50.12"N 15° 3'1.47"E 1871 Lava flow Citelli Refuge pathway
25
6. GAS AND VOLUME ESTIMATION
6.1 GAS
One of the main feature of Mt. Etna is represented by the persistent degassing from summit craters (this is one of the most commonly observed kind of volcanic activity). Upon their migration from the source region toward the Earth’s surface, magmas release volatile species into the gas phases after a decrease in their solubility inside the melt (Carroll and Holloway, 1994). These may induce magma fragmentation during strombolian activity and lava fountaining generating a significant hazard (Cashman et al., 2000). Since the late 1970s explosive eruptive events have been more frequent, especially for the 1995-2001 period that counts about 150 episodes of lava or fire fountaining (many of which generating high ash and gas columns). Mt. Etna is very well monitored by The “Istituto Nazionale di Geofisica e Vulcanologia” (INGV) through continue observation of seismic signals, volcanic tremor, video monitoring (visible and termal maps) and simulations of the volcanic ashes dispersion (taking into account the dominant winds) (Fig. 6.1.1).
26
Fig. 6.1.1. – Simulations maps of Mt. Etna ash dispersion (www.INGV.it)
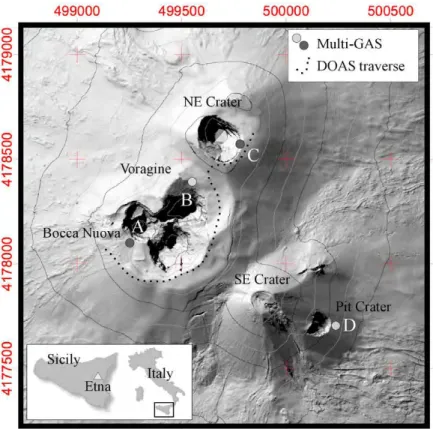
Notwithstanding its behavior is poorly understood in many aspects and the composition of volcanic gas can give us some information upon the magma ascent and the eruptive dynamics. Aiuppa et al. (2011) analyzed the H content in Mt. Etna’s gas phases with the aim to discover the redox properties of the shallow magmatic system. Magma redox state controls the iron partition thus contributing in controlling magma crystallization sequence and differentiation, and volatile partitioning between gas and melt. The fugacity in gases is buffered by oxidation-reduction reactions among ferromagnesian minerals in the surrounding silicate (rock/melt) matrix. Aiuppa et al. (2011) performed hydrogen determinations in the volcanic gas plume of Mt. Etna with an upgraded MultiGAS apparatus (Fig. 6.1.2). When the magmatic gas phase is directly injected in the atmosphere at high temperature, as at open vents (Bocca Nuova and Northeast craters), and then rapidly cooled, the H2‐H2O and SO2‐H2S gas ratios are quenched
to reflect redox properties of the source magmas (hydrogen‐rich gas). Comparison between the model derived compositions and natural data suggests that most of the observed plume compositions closely match those representative of quenched gas-melt equilibria for redox conditions at the NNO buffer and 0.1 MPa Pressure. These data support the shallow (near surface), cold (550 °C) and oxidized (conduit gases have equilibrium redox conditions at NNO + 2.8) environment of final equilibration of H poor gases.
27
Fig. 6.1.2 – Map of Mt. Etna summit craters area, showing the MultiGAS sites measurements (Aiuppa et al. 2011)
Giacomoni et al. (2013) tried to investigate the deep feeding system oxidation state. He calculated fO2 values for Mt. Etna magmas using Fe3+/Fe2+ distribution between
clinopyroxene-plagioclase phenocrysts and melt (France et al., 2010). At Pressure <0.5 Gpa and Temperature of 1150°, oxygen fugacity varies between +0.8 < ΔQFM < +2.3. According to Kress and Carmichael (1988) this fO2 corresponds to a Fe3+/Fe2+ = 0.15.
Other important volatile species are represented by SO2 and CO2. The CO2/SO2 ratio is related
to the different solubility of CO2 and sulfur (14 MPa; Stelling et al., 2008) in a silicate melt. In
a open conduit degassing system this value gets low because the loss of CO2, until the
triggering of new eruptions with the uprising of primitive and volatile-rich magma bodies (Aiuppa et al., 2007). Real time gas measurements of CO2 and SO2 could be used as indicator
of incoming eruptions. Mt. Etna is one of the largest SO2 emission source even during
non-eruptive periods (Allard et al., 1991; Allard, 1997; Pennisi and Le Cloarec, 1998). Measurements of the SO2 volcanic plume and of CO2 soil emissions indicate an average SO2
outflux between 0.31 and 7.7 Mt yr-1 (average of 2.04 Mt yr-1 during non eruptive periods; Ferlito et al. 2014) and a CO2 average output of 13 3 Mt yr-1 (Allard et al., 1991) (Table 2).
Regard to CO2 Mt. Etna produces about the 15 % of the global volcanic emission. Some
28
magmas a saturation limit of CO2 at about 700 MPa (at 1200 °C) that corresponds to a
minimum exsolution depth of approximately 24 km. D’Alessandro et al. (1997) calculated the involvement of 0,7 km3/a of magma in generating the estimated CO2 emission rate (Table 2).
However a lot of authors (Azzaro and Neri, 1992; Barberi et al., 1993; Calvari et al., 1994) measured a lava emission rate in the order of 0,035 km3/a for the 1971-1995 period (GPS techniques were used to measure the lava thickness enabling to calculate the final volume and emission rate), that is 1/20 of the value requested to balance the gas emissions (Table 2). This reveals a very low ratio between erupted and degassed magma and opens a lively debate that affects other well studied volcanoes such as Izu – Oshima, Japan (Kazahava et al., 1994); Stromboli, Italy (Allard et al., 1994); Erebus, Antarctica (Oppenheimer and Yirgu, 2002) and Masaya, Nicaragua (Rymer et al., 1998) that exhibit continued degassing in the absence of significant magma eruptions. Allard et al. (1997) tried to explain this great Mt. Etna’s CO2
emission rate with the thermal decarbonatation of limestones present in Etna’s sedimentary basement.
D’Alessandro et al., (1997), provided constraints on CO2 magmatic origin in the Etnean area
(excluding the decarbonatation origin proposed by Allard et al., 1997) by means of isotopic data on carbon in CO2 from Allard et al., (1991), Anzà et al., (1989), D’Alessandro et al.
(1997) and Giammanco and Inguaggiato, (1996). Values of δ13C (CO2) in gas from both the
lower flanks and the summit craters area of Etna, generally fall in the range of –6 to 1‰ vs PDB (Pee Dee Belemnite) that are slightly more positive than the values commonly accepted for magmatic CO2. This could be explained by a slight crustal contamination of the magmatic
source as suggested by - 3He/4He ratio (5.8–7 R/Ra), which is slightly lower than ratios typical of a MORB source (8±1 R/Ra according to Lupton, 1983).
However Etna is also a strong emitter of SO2, whose output alone would account for a huge
amount of degassing magma and the S-isotopic composition (δ34S (SO2) + 0.8‰ vs Canyon
Diablo Troilite) indicate a mantle source (Allard, 1986). The high output of both CO2 and SO2
might be typical of alkaline volcanoes such as Etna. D’Alessandro et al. (1997) hypothesize a model conceptually consistent with these isotopic data suggesting that the asthenosphere beneath Etna rises to a depth where reduced lithostatic pressure allows exsolution of CO2 from
the magma. This hypothesis is supported by seismic refraction studies that showed a significant upwarp of the lower-crust boundary beneath the eastern flank of Etna (Nicolich et al. 1996). These authors suggest that the deep magma chamber of Etna is a lens atop an upwarped mantle and the presence of convective movements in an uprising asthenosphere
29
allows the transport of gas rich magma from deeper to shallower parts, making the source of gas practically infinite.
Many authors (Francis et al., 1993; Allard et al., 1994 and references therein), instead, suggest the intrusion of huge amounts of magma and/or the presence of convective movements within the conduits and magma chambers (Oppenheimer and Yirgu, 2002; Oppenheimer et al., 2009; Kazahava et al., 1994; Stoiber et al., 1986; Witham and Llewellin, 2006; Witham et al., 2006; Spilliaert et al., 1996; Witham et al., 2011). The undegassed and volatile-rich magma rises the conduit while the degassing one increases his density and can I) convects back down into the volcanic conduit; II) mixes in large and deep reservoir; III) intrudes the country rock (Huppert and Hallworth, 2007; Francis et al., 1993; Kazahava et al., 1994; Stevenson and Blake, 1998; Witham et al., 2011).
In this contest, mixing represents the main mechanism that may be able to reduce the volatile concentration in magma arriving at an open volcanic vent in a degassing system (that is lower than in melt inclusions analyses). This could explain the rare explosive eruptions because the low gas content cannot induce magma fragmentation (Witham et al., 2011). In addition the escape of gas from shallow depths through a permeable network (Burton et al., 2007) represents another reason for the lack of explosive activity.
Following Ferlito et al., (2014) the solution of magma convection presents some important weakness: i) does not explain why new magmas batches can emplace, lose their volatiles content and don’t erupt; ii) the loss of volatiles induces undercooling, promotes crystallization and should “close” the open conduit; iii) all the degassed magma will have to be rearranged beneath the volcanic edifice. The estimated amount of degassed and cold basaltic magma is 3*105 m3 every day and it would be too large if compared with the plutonic complex recognized by Allard et al. (1997) and Patanè et al. (2006).
Ferlito et al., (2014) support the presence of a CO2 flux within the Etnean feeding system,
because CO2 exsolves at considerable depths (700 Mpa from Clocchiatti et al. 1992; 600 MPa
from Barsanti et al., 2009). The CO2 acting as volatiles carrier (because changes the CO2-H2O
equilibrium of fluxed magma), induces the H2O exsolution at depth, causing loss of H2O from
the system (Dixon et al., 1995; Papale, 1999; Liu et al., 2005; Collins et al., 2009; Armienti et al. 2013).This can justify the high emissions of H2O without frequent magma eruptions.
Unfortunately the migration mechanism of H2O is still a not well understood process that
30
6.2. VOLUME ESTIMATIONS
One of the aim of this study was to obtain an estimation of the magmatic products related to the Etnean activity. First was necessary to calculate the volcanic edifice volume, taking into account the reconstruction of the sedimentary basement underlying Mt. Etna. Neri and Rossi (2002), starting from geoelectric data (Ogniben, 1966) and hydrogeological studies drew a substratum map (Fig. 6.2.1). Most of the wells in literature do not reach the sedimentary succession, so all information on the impermeable substratum come from indirect Vertical Electrical Soundings (VES) (Patella and Quarto, 1987; Loddo et al., 1989). Both wells and VES are less numerous in the summit craters area, making the substratum map not so precise. Evaluating both literature data and hydrogeological studies of private and public companies, Neri and Rossi (2002) reconstructed the sedimentary basement morphology comparing direct and indirect information on the same detected area.
According to this reconstructed map, N-NW respect to the actual summit craters area, it is observable a 1300 meters high-topographic, that could represent an extension of Madonie and Mt. Peloritani formations.
A specific software, that makes tridimensional elaborations of topographic data, was used to calculate the emitted products volume as a simple difference between the actual topographic surface and the reconstructed substratum (Fig. 6.2.2). However, the result of 326 km3 does not consider the Valle del Bove area eroded material. With the aim to obtain this missing volume, they digitalized the apical morphology prior to the Valle del Bove formation from Neri et al., (1995) and subtracted it to the actual topography getting more 13,4 km3. Considering the error given by the use of indirect data and the probable substitution of part of the substratum sediments with magmatic dykes intrusions is reasonable to add 10% to the previous estimated volume. The final result is 374 km3 with an emission rate of 1250 m3/y (Table 2) that was calculated taking into account that most of the volcanic edifice developed in the last 100 ka. (Neri and Rossi, 2002).
31
Fig. 6.2.1 –Substratum morphologic map of Mt. Etna (from Neri and Rossi 2002). In the central area are marked the main Volcanic Centers of the last 150 ka: E= Ellittico, C= Cuvigghiuni; G= Giannicola Grande; S= Salfizio; T= Trifoglietto; R= Rocca Capra; ?= Calanna. The locations derive from Coltelli et al. (1994), Calvari et al. (1994) and
Romano (1982).
Fig. 6.2.2 - Tridimensional reconstruction of Etnean sedimentary basement (at the bottom) and actual topographic surface (at the top). Vertical scale 1=2/3h. (from Neri and Rossi 2002).
32
7. MELT INCLUSIONS
Silicate melt inclusions represent trapped silicate melt that can give us important information on the evolution of the magma. This is possible only on the condition that they remained isolated from the enclosing magma after their entrapment (Frezzotti, 2001). Studies of melt inclusions in early crystallization phases (for example olivine) allow the characterization of primary magmas while in differentiated products they can provide information on the petrological evolution of the magmas. The concentrations of volatile species (H2O, CO2, Cl, S)
are very important to recognize the presence of metasomatic agents in the mantle source (possible recycling of subducted material) and to better understanding the degassing processes. Matching these data with geochemical and petrological information is useful in order to increase our knowledge of magmatic processes (Frezzotti, 2001). Melt inclusions (MI) are constituted by glass ± one or more glass bubbles ± daughter mineral phases and are often very small (< 30 µm) (Fig. 7.1 and 7.2). A very common processe that affects MI is represented by crystallization of daughter-mineral phases within the inclusion (Fig. 7.2). From an original alkali-basalt trapped by the growing crystal, Mg, Ca, Fe and Si will be lost by the crystallization of clinopyroxene at the walls of the inclusion. Complete studies to characterize MI requires: i) Electron microprobe analyses (major and minor elements analyses; Nielsen and Sigurdsson, 1981; Lowenstern and Mahood, 1991); ii) Ion microprobe (trace-element and isotope analyses, HO quantitative analyses; Kovalenko et al., 1988; Ihinger et al., 1994; Deloule et al., 1995); iii) Fourier-transformed infrared spectroscopy (H2O and CO2
quantitative analyses; Ihinger et al., 1994, Lowenstern, 1994) and more recently iv) Laser-ablation microprobe inductively coupled plasma-mass spectrometry (trace elements; Taylor et al., 1997).
Fig. 7.1 – Pictures of melt inclusions in olivine phenocrysts from a) Keanakakoi, Kilauea, Hawaii (Metrich and Wallace 2008); b) Stromboli (Faure and Schiano, 2005) and c) 2002-2003 eruption, Mt. Etna (Metrich and Wallace
2008)
33
Fig. 7.2 – Sketch of post-entrapment modifications of Melt inclusions (from Metrich and Wallace 2008).
A common way to check if the silicate-melt inclusions have retained their original composition is to bring the inclusions to homogenization temperatures followed by quenching (Frezzotti, 2001). If inclusions are properly homogenized, their composition should match the major element trends of the host magma.
One of the most important MI’s application to the Etnean magmastic system is represented by data on major and trace elements. They allow i) reconstructions of the primary magmas composition and to establish the formation conditions of alkali basaltic melts in the mantle (Clocchiatti and Massare, 1985; Gurenko et al., 1991; Sobolev and Shimizu, 1993; Sobolev and Danyushevsky, 1994); ii) characterization of fractional crystallization processes (Metrich et al., 1991; Lu et al., 1992; Vaggelli et al., 1993) and iii) recognition of mixing phenomena, not observable in whole rock analyses (Anderson, 1976; Anderson and Wright, 1972; Hervig and Dunbar, 1992).
Olivine, represents the best mineralogical phase for the MI study because give us the compositions of primary melts and it is less prone to fracturing. Kamenetsky and Clocchiatti (1994 and 1996) found a range of compositions for Etnean magmas varying from tholeiitic, transitional to alkaline basalts (Fig. 7.3) that could not be related by fractional crystallization but only by partial melting of the mantle source. Melt inclusions from the most primitive olivine (Mt. Maletto alkali basalt) were unusually high in CaO and were very different from the primary melt calculated by Armienti et al. (1988) on the bases of Mt. Maletto whole rock composition (Kamenetsky and Clocchiatti, 1996). Probably this divergence is related to the failure of a complete homogenization of melt inclusions because of the high crystallization
34
pressure (2-6 Kbar) of the host olivine, indicated by the presence of high-density CO2 fluid
inclusions in olivine (Kamenetsky and Clocchiatti, 1996).
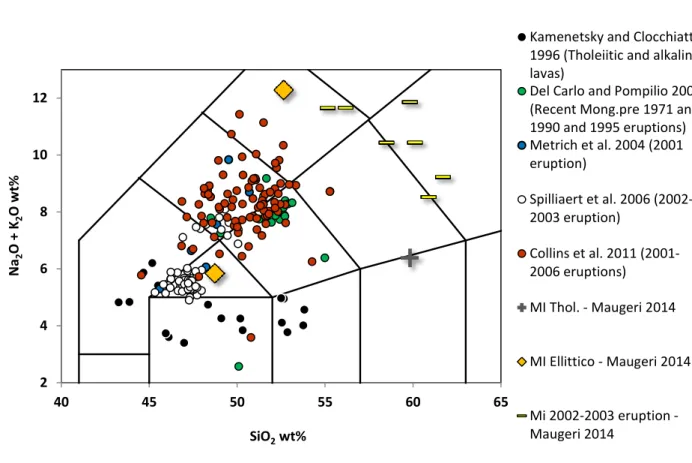
Recently, Maugeri (2014; Fig. 7.3) analyzed melt inclusions from Tholeiitic, Ellittico and Post-1971 Recent Mongibello olivine phenocrysts (lavas sampled in this thesis work). In the first period, only one evolved MI was obtained, whereas for Ellittico is shown a primitive composition that fits well with literature data and reconstructed primary magmas described in Fractionation modeling chapter. Melt inclusions from 2002-2003 eruption are differentiated and plot along the alkaline differentiation trend.
Fig. 7.3 – TAS diagram of Etnean melt inclusions data from literature (Kamenetsky and Clocchiatti, 1996; Del Carlo and Pompilio, 2004; Metrich et al. 2004; Spilliaert et al. 2006; Collins et al. 2011, Maugeri 2014).
Another important outcome in studying MI is given by the measurements of their H2O and
CO2 content (Fig. 7.4). They allow the estimation of the magmatic volatile content prior and
during crystallization processes and the pre-eruptive volatile evolution of the magma (Frezzotti, 2001). Furthermore The H2O concentration in olivine’s MI is representative of the
water content in primary magmas directly derived from the partial melting of their mantle source. 2 4 6 8 10 12 40 45 50 55 60 65 Na 2 O + K2 O wt % SiO2 wt%
Kamenetsky and Clocchiatti 1996 (Tholeiitic and alkaline lavas)
Del Carlo and Pompilio 2004 (Recent Mong.pre 1971 and 1990 and 1995 eruptions) Metrich et al. 2004 (2001 eruption) Spilliaert et al. 2006 (2002-2003 eruption) Collins et al. 2011 (2001-2006 eruptions) MI Thol. - Maugeri 2014 MI Ellittico - Maugeri 2014 Mi 20022003 eruption -Maugeri 2014
35
At Mt. Etna several authors analyzed the volatiles contents of MI entrapped in olivines (Métrich et al., 2004 and Spilliaert et al., 2006). Metrich et al. (2004) and Spilliaert et al. (2006) on recent erupted lavas (2001 and 2002-2003 eruptive events) obtained a value of 3.5 wt% of H2O and 4000 ppm of CO2 for MI trapped at 400 and 100 MPa. These high values are
normally related to metasomatized mantle source in subduction geodynamic settings (Fig. 7.4). A lot of authors (Tonarini et al., 2001; Schiano et al., 2001; Faccenna et al., 2011) hypothesize the interaction with metasomatizing fluids from the near eolian subduction slab. They relate such a high amount of water with the increase in K2O and low field rare earth
elements observed especially in the post 1971 eruption products, although the subduction imprinting beneath Mt. Etna is still debated because seismic investigations indicate that the active Benioff zone is located beneath the Eolian Islands (Anderson and Jackson, 1987; Selvaggi and Chiarabba, 1995; Finetti, 2005). A possible explanation for the high H2O content
in etnean magmas could be: i) Supercritical fluids carrying alkali Cl-complexes migrating from the deeper to the shallower portion of the pumbling system (Ferlito and Lanzafame, 2010; Ferlito et al., 2014) and ii) Involvement of volatile-bearing phases (amphibole and/or phlogopite) in the partial melting of an heterogeneous and variably enriched mantle source (Beccaluva et al., 1998; Viccaro and Cristofolini, 2008, Alesci et al., 2013). Arguments in support of this last model will be given by data on potential Etnean primary magmas in “Melt modeling” chapter.
36
Table 2 - Values of the parameters considered In magma emission rate calculations for Mt. Etna. Ferlito et al. (2014) calculated the magma emission rate starting from the SO2
measured flux (Allard 1991) and SO2 content at the saturation limit in the etnean feeding system (Metrich et al. 2004; Spilliaert et al. 2006). D'Alessandro 1997 followed the
same approach by means of CO2 measured flux (Allard et al. 1991) and CO2 concentration at the saturation limit (Armienti et al. 1994). The vaules obtained from this two works
are quite different, but both of them evidence the low ratio between erupted (Azzaro and Neri, 1992; Barberi et al., 1993; Calvari et al., 1993) and degassed (respectively 4 and 20 times) magma. Neri and Rossi (2002) calculated the emission rate on the base of Mt. Etna volcanic edifice volume (the value is 28 times underestimated).
Author Magma emission rate (km3/y-1) SO2 flux (Mt/y-1) CO2 flux (Mt/y-1) Saturation limit CO2 (MPa) Saturation limit SO2 (MPa) Magmatic CO2 (%) Magmatic SO2 (%) Allard et al. (1991) 13±3
Clocchiatti et al.(1992) 700 Mpa
Armienti (1994) 0,70
D'Alessandro (1995) 2,04
D'Alessandro (1997) 0,7 Neri e Rossi (2002) 0,00125
Stelling et al. (2008) 14 Mpa
Metrich et al. (2004) 0,3
Spilliaert et al. (2006) 0,3
Ferlito et al. (2014) 0,12 Azzaro and Neri(1992)
0,035
Barberi et al. (1993)
37
8. PETROGRAPHY
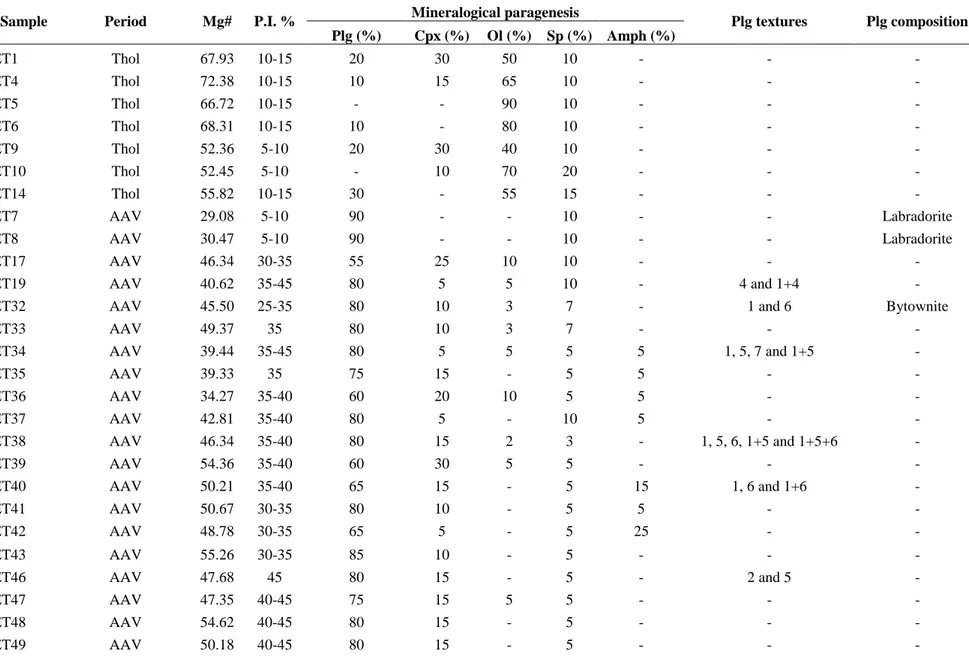
Mt. Etna rocks show peculiar petrographic features for each evolutionary stage. The tholeiitic samples, massive and altered (especially ET1 and ET6), have ophitic to poorly porphyritic textures with P.I. (Porhyritic index vol%) ranging from 5 to 15% and vesiculation up to 10%. Phenocrysts include altered olivine (on average 63%), clinopyroxene (21%), plagioclase (18%) and Cr-spinel (13%) set in a microcrystalline groundmass (composed by plagioclase, clinopyroxene and Cr-spinel) (Table 3). Large-size olivine phenocrysts (millimetric in size; Fig. 8.1a) have Cr-spinel inclusions (Fig. 8.1b), resorbed cores and rims, Peccerillo (2005) and Tanguy et al. (1997) observed rare orthopyroxene inclusions. Clinopyroxene ranges from diopside to salite in composition (Tanguy et al., 1997; Corsaro and Cristofolini, 1997; Armienti et al., 2004; Corsaro and Pompilio, 2004). High dimension plagioclase phenocrysts (Fig. 8.1b) have labradoritic composition, whereas oligoclase to anorthoclase are observable as microlites in the matrix (Tanguy et al. 1997). All tholeiitic sections are markedly altered so it was not possible to study in details the textural features of plagioclase and clinopyroxenes. Products and lavas from AAV show higher Porphiritic Index (on average P.I.= 35-40%) than tholeiites with abundant and large labradoritic plagioclase phenocrysts (75%) (from euhedral to subeuhedral) followed by clinopyroxene (13%), amphibole (9%), Ti-magnetite (7%), and olivine (6%) in a glassy to microcrystalline groundmass (Table 3). Using the textural plagioclase classification proposed by Viccaro et al. (2010) and Giacomoni et al. (2012) the following textures were recognized: Type 1 (oscillatory zoned), type 4 (sieved), type 5 (resorbed dusty rim) and type 6 (aligned melt inclusions). Sometimes types 1 and 4 or 5 and 6 are found in the same crystal. ASF1, ASF2, ASF3, ASF4 and CAR1, CAR2, CAR4 lavas contain large clinopyroxene phenocrysts (up to 1 cm) that is the most common mineralogical phase (30-35%). They are often zoned (from yellow Ti-augite to green Fe-diopside compositions) (Fig. 8.2a) and sometimes show rounded and resorbed rims. CAR4 has a peculiar phenocryst with Ti-magnetite inclusions at the core ad a clear resorbed rim with aligned melt inclusions (Fig. 8.2b). ASF1 shows zoned clinopyroxenes with “sieved” cores. In all other samples clinopyroxene is smaller and less abundant with Ti-magnetite inclusions and resorbed rims. Olivines in these samples are large in size with resorbed rims and Ti-magnetite inclusions (indicating its early crystallizzation). Plagioclase is smaller and the association between the texture 4 and 5 is quite common (Viccaro et al., 2010; Giacomoni et al., 2012).
38
All lavas show glomeroporphyritic aggregates fromed by clinopyroxene, olivine and Ti-magnetite phenocrysts (in order of decreasing abundance) (Fig. 8.4, table 3).
Amphibole, founded in ET34, ET35, ET36, ET37, ET40, ET41 and ET42 (up to 25-30%) is abundant (in some cases entirely resorbed), markedly pleochroic (with ά pale yellowish brown and γ dark brown) with high relief and straight extinction (Table 3). These optical characters conform to those of the Ti-rich calcic amphibole classified as kaersutite (Fig. 8.4). The markedly resorbed rim is due to the decreased volatile pressure during the eruptive activity testifying a disequilibrium with the melt. Olivine phenocrysts are rare (up to 15%), small and commonly displaying a brown-reddish iddingsite envelope (hydrothermal alteration). Sometimes clinopyrexene, olivine and Ti-magnetite form glomeroporphyritic aggregates.
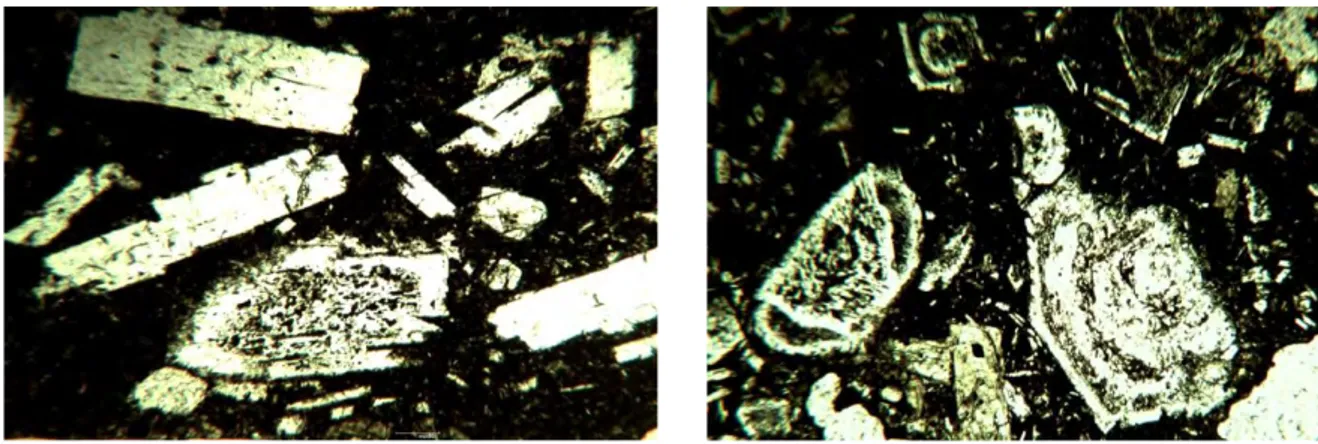
Ellittico lavas are the most evolved terms emitted by Mt. Etna and show petrographic features similar to AAV ones. They have a porphyiritc texture (on average P.I.= 35-40%) with abundant plagioclase (on average 71%), olivine (15%), clinopyroxene (11%), and Ti-magnetite (5%) phenocrysts in a glassy to microcrystalline groundmass (Table 3). The Type 5 (resorbed dusty rim) plagioclase texture (Viccaro et al., 2010; Giacomoni et al., 2012) is the most common, followed by type 1 (oscillatory), 4 (sieved), 6 (aligned melt inclusions) and 7 (shallow tailed) (Fig. 8.5, 8.6a and 8.6b). Sometimes the oscillatory zoning is found associated with the 4, 5 or 6 types. Using the “Michel Levy” method and observing the in situ analyses on plagioclase phenocrysts it was possible to determinate the compositions ranging from andesine to bytownite (confirmed by in-situ analyses, Table 5). Olivine (up to centimetric in ET58) and clinopyroxene often are zoned and show Ti-magnetite inclusions (Fig. 8.6a and 8.6b).
Samples from Recent Mongibello have a more primitive character with lower P.I (on average 25-30%) and abundant olivine. Andesitic and labradoritic plagioclase is still the most common phase (on average 60%) that shows prevalently the “sieved” (type 4; Fig. 8.7a and 8.8a), “resorbed dusty rim” (type 5; Fig. 8.7b) and “shallow tailed” (type 7) textures (Viccaro et al., 2010; Giacomoni et al., 2012). All typologies are often mutually associated (1+4; 1+5; 4+6, Fig. 8.8b; 6+7 and 1+6+7) (Table 3). Clinopyroxene phenocrysts (22%), of medium-small size, show germinations (ET22, ET24), zoning (Fig. 8.9b) (hourglass zoning in ET23) and Ti-magnetite and olivine inclusions (Fig. 8.8a, 8.8b and 8.9b). Sometimes form clusters with olivine and Ti-magnetite (ET15, ET44). Olivine (up to 30%), of medium-small size, is frequently fractured and altered along rims and fractures (ET20); sometimes displays resorbed rims (ET22, ET25, ET27) and holds Ti-magnetite phenocrystals (5%) (Fig. 8.9a and 8.9b). Most of the samples have a prevalently glassy matrix (Table 3). Textural relationships
39
between phenocrysts indicate early crystallization of olivine, clinopyroxene, and Ti-magnetite, followed by massive crystallization of plagioclase.
The petrographic features of Recent Mongibello products are well described by a lot of authors (Cristofolini and Tranchina, 1980; Cristofolini et al., 1987; Viccaro et al., 2010, Giacomoni et al., 2012), especially for the eruptive events of the last three decades. This is related to the increase of the volcanic activity and the emission of K-alkaline terms since the 1971 eruption (Tanguy and Kieffer, 1977; Joron and Treuil, 1984; Tanguy et al., 1997; Clocchiatti et al., 2004). Ferlito et al. (2009) and Giacomoni et al. (2012) studied lavas from the 2002-2003 event (from both NE and S-Rift systems) founding different kind of magmas on the base of geochemical composition and textural features (as well as for the 2001 eruption; Viccaro et al., 2006; Corsaro et al., 2007; Ferlito et al., 2008). These samples are all porphyritic (P.I. from 25 to 40%) while along two NE-Rift fractures, during the 2002-2003 eruption, were emitted oligophyric products with P.I. ranging from 10 to 18%. A detailed textural and petrological study of plagioclase in lavas from the S and NE-Rifts indicates that chemicophysical conditions of the deep feeding system were analogous, while more superficially ascent dynamics were different (Giacomoni et al., 2012). The inhibition of plagioclase growth for the oligophyric NE- Rift products is related to the presence of H2
O-satured and undegassed magmas in a closed system. The presence of aligned melt inclusions, (type 6 texture) along the plagioclase phenocryts rims, represents the instant growth of this phase after the sudden loose of water probably in relation to decompression due to fracture opening. On the other hand, the porphyritc samples (prevalently along the S-Rift) in association with the type 5 plagioclase texture (resorbed dusty rims), indicate frequent primitive magma imputs (where clinopyroxene prevails on the other phases; Alesci, 2010) in H2O-undersatured conditions that are the most common for the shallow etnean feeding system
(Giacomoni et al., 2012).
If the study of plagioclase textures is useful to constrain the shallow feeding system conditions, clinopyroxene can represent an important tool to obtain information on the deeper part of the Etnean magmatic system. Plagioclase is very susceptible to temperature, pressure and volatile content but its stability field, restricted to low pressure conditions, limits its use to the first 12 km of deepness. Clinopyroxene that crystallizes earlier can provide important information on deeper processes and magmatic parameters. A preliminary study by Fini (2013) investigated the textural features of clinopyroxenes from the four Etnean evolutionary periods.
40
Fig. 8.1 – a) Olivine phenocryst from ET4 (Tholeiite); b) Olivine and plagioclase phenocryts from ET9 (Tholeiite).
41
Fig. 8.3 – Glomeroporphyritic aggregate of Cpx, Ol and Ti-Mt (ET39, AAV).
42
Fig. 8.5 – Plagioclases phenocrysts from ET52 (Ellittico).
Fig. 8.6 –Cpx ad plg phenocrysts from a) ET 52 (Ellittico) and b) ET59 (Ellittico).
43
Fig. 8.8 – a) Plg type 2 and 4, cpx and Ti-mt (ET63, Recent Mong. Pre-1971) and b) Plg 4+6 type and cpx (ET24, Recent Mong. Pre-1971)