Longitudinal HIV sequencing reveals reservoir
expression leading to decay which is obscured
by clonal expansion
Marilia Rita Pinzone
1
, D. Jake VanBelzen
1,2
, Sam Weissman
1
, Maria Paola Bertuccio
1
, LaMont Cannon
1
,
Emmanuele Venanzi-Rullo
1,3
, Stephen Migueles
4
, R. Brad Jones
5
, Talia Mota
5
, Sarah B. Joseph
6
, Kevin Groen
7
,
Alexander O. Pasternak
7
, Wei-Ting Hwang
8
, Brad Sherman
9
, Anastasios Vourekas
1
, Giuseppe Nunnari
3
&
Una O
’Doherty
1
After initiating antiretroviral therapy (ART), a rapid decline in HIV viral load is followed by
a long period of undetectable viremia. Viral outgrowth assay suggests the reservoir continues
to decline slowly. Here, we use full-length sequencing to longitudinally study the proviral
landscape of four subjects on ART to investigate the selective pressures in
fluencing the
dynamics of the treatment-resistant HIV reservoir. We
find intact and defective proviruses
that contain genetic elements favoring ef
ficient protein expression decrease over time.
Moreover, proviruses that lack these genetic elements, yet contain strong donor splice
sequences, increase relatively to other defective proviruses, especially among clones. Our
work suggests that HIV expression occurs to a signi
ficant extent during ART and results
in HIV clearance, but this is obscured by the expansion of proviral clones. Paradoxically,
clonal expansion may also be enhanced by HIV expression that leads to splicing between
HIV donor splice sites and downstream human exons.
https://doi.org/10.1038/s41467-019-08431-7
OPEN
1Department of Pathology and Laboratory Medicine, University of Pennsylvania, Philadelphia 19104 PA, USA.2Department of Molecular Biosciences, Northwestern University, Evanston 60201 IL, USA.3Department of Clinical and Experimental Medicine, Unit of Infectious Diseases, University of Messina, Messina 98124, Italy.4Laboratory of Immunoregulation, National Institutes of Allergy & Infectious Diseases, National Institutes of Health, Bethesda 20892 MD, USA.5Infectious Disease Division, Weill Cornell Medical College, New York 10065 NY, USA.6Department of Microbiology and Immunology, University of North Carolina at Chapel Hill, Chapel Hill 27599 NC, USA.7Laboratory of Experimental Virology, Department of Medical Microbiology, Academic Medical Center, University of Amsterdam, Amsterdam 1105, The Netherlands.8Department of Biostatistics, Epidemiology and Informatics, University of
Pennsylvania, Philadelphia 19104 PA, USA.9Laboratory of Human Retrovirology and Immunoinformatics, Frederick National Laboratories for Cancer Research, Leidos Biomedical Research Inc., supporting the Division of Clinical Research, NIAID, Frederick 21702 MD, USA. These authors contributed equally: Marilia Rita Pinzone, D. Jake VanBelzen, Sam Weissman. Correspondence and requests for materials should be addressed to
U.O’D. (email:[email protected])
123456789
T
he advent of antiretroviral therapy (ART) revealed a
treatment-resistant reservoir of HIV proviruses requiring
life-long therapy
1. Pioneering work has shown that the
HIV reservoir has a very slow rate of decay. Estimates of reservoir
decay suggested a half-life of 44 months using Quantitative Viral
Outgrowth Assay (QVOA)
1,2. However, these measurements
were indirect, and their error was sufficiently large that the
pre-cise half-life of the reservoir in individual subjects was uncertain.
Differentiating error due to assay inconsistency versus biological
variation is difficult. If biological variation is prominent, a subset
of subjects may have significant reservoir decline while others
may not. For this reason, it becomes essential to robustly measure
each individual’s reservoir decay rate, especially in cure studies.
This biological variation could arise for multiple reasons,
including variable ART compliance or biological differences in
the host or pathogen.
Viral nucleic acid measurements have been used as a surrogate
for HIV reservoir size, as some measures have shown significant
correlations with QVOA
3. Longitudinal studies suggest HIV
DNA is relatively stable after the
first few years of ART
4.
How-ever, HIV DNA measurements suffer from the presence of
defective proviruses, which constitute the majority of the
total DNA; thus, while the intra-assay variation for PCR is
small, the variable and largely unknown frequency of defective
proviruses
5–9results in precise but inaccurate estimates of
replication-competent reservoir size. As a consequence, large
changes in replication-competent proviruses may be masked by
defective proviral DNA. Moreover, selective pressures on
defec-tive DNA may be different than selecdefec-tive pressures on intact
proviruses
10, and thus HIV DNA measures may not be an
appropriate way to longitudinally monitor reservoir dynamics.
Monitoring the frequency of individual proviral sequences over
time in the presence of ART could reveal positive and negative
selective pressures that act on infected cells. Furthermore, such an
approach would differentiate between replication-competent and
defective proviruses, allowing for a direct calculation of decay of
the replication-competent reservoir. While such an approach is
currently not feasible for all HIV-infected individuals due to
limited throughput and cost, in-depth study of a subset of
sub-jects might provide new insights into reservoir dynamics as well
as the effect of the host on reservoir persistence.
We employed limiting dilution polymerase chain reaction
(PCR) followed by DNA sequencing to obtain full-length
sequences of integrated HIV proviruses in four subjects on
sup-pressive ART over time. We provide evidence that both intact and
defective proviruses that contain genetic elements that favor
protein expression are under negative selective pressure.
Inter-estingly, defective proviruses that lack these genetic elements, but
encode a strong donor splice sequence, are under relative positive
selective pressure. We also show significant biological variation in
reservoir decay in two of these individuals. In this case, clonal
expansion represents an important factor contributing to slower
decay. An important implication from our analysis is that the
replication-competent reservoir of intact proviruses is under
more negative selection than defective proviruses, suggesting that
the majority of the replication-competent reservoir is expressed
over time.
Results
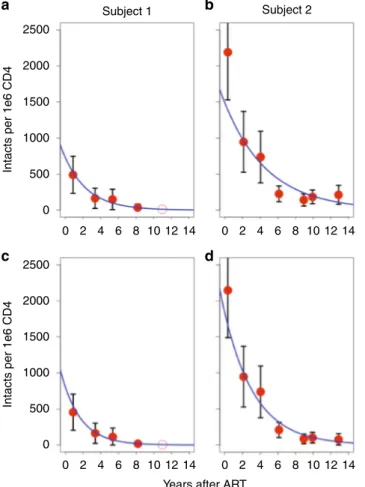
Longitudinal parameters of four subjects on ART. We wanted
to assess the decay rate of intact and defective proviruses by
combining proviral sequencing with PCR measurements of HIV
DNA levels. We identified two subjects with detailed clinical
histories (Supplementary Table 1) and sufficient peripheral blood
mononuclear cell (PBMC) aliquots spanning more than a decade
after achieving virological suppression. For both subjects, total
and integrated HIV DNA were assessed at multiple intervals
during the
first 11–13 years of ART (Fig.
1
and Supplementary
Tables 1–3). Viral load and CD4 T cell count were repeatedly
assessed in both subjects over the study period. For Subject 1,
viral load was always below the detection limit of the diagnostic
assay (<50 copies or <20 copies/ml). For Subject 2, the majority
of viral load measurements were below the detection limit, with
a few episodes of low-level viremia detected after 9 years of
continuous virological suppression on ART (Fig.
1
). There was a
slight decline in total and integrated HIV DNA over the study
period, in general less than a two-fold change by any measure (i.e.
normalized to CD4, PBMC or per unit volume; Supplementary
Tables 2 and 3). In conclusion, RNA and DNA measurements
including total and integrated HIV DNA decreased minimally
over time, suggesting minimal change in reservoir size. Two
additional subjects were also included for whom two time points
were available (Fig.
1
and Supplementary Tables 1–3).
Dynamic changes of intact proviruses imply HIV expression.
To estimate the decay rate of the HIV reservoir, we performed
limiting dilution full-length PCR at multiple time points in
Subjects 1 and 2 followed by proviral sequencing of the full-length
amplicons to determine if they were intact. Our criteria for an
intact provirus were the presence of nine open reading frames
(ORFs) and 3–4 stem loops at the psi packaging site as well as
several critical donor and acceptor splice sequences
11–13and
the Rev-responsive element (RRE) sequence
14, as detailed in the
Methods section. When we plotted the frequency of intact
pro-viruses over time, we noticed substantial decay (Fig.
2
a, b), in
contrast to total HIV DNA, which was relatively constant over
the same time frame (Fig.
1
). For Subject 1, we found the
expo-nential decay rate was
−0.38/year with a half-life of 1.8 years. For
the purpose of modeling, time 0 was the moment the subject was
placed on ART. Using the best-fit exponential decay curve, we
predicted that Subject 1 had an estimated 734 intact proviruses
per million CD4 T cells contributing to his reservoir at the time
he was placed on ART. After 11 years of ART, we estimated that
98% of the cells with intact proviruses were cleared (Fig.
2
a).
Subject 2 had a slower decay rate (−0.2/year) with a half-life of
3.4 years, and after 11 years the number of intact proviruses
declined from an estimated 1490 to 158 per million CD4 T cells
(Fig.
2
b). This slower decay of intact proviruses in Subject 2 may
be due to multiple reasons, including clonal expansion, ongoing
replication
15, and redistribution of infected cells from lymphoid
tissue.
To investigate the role of clonal expansion in proviral decay
over time, we aligned intact proviruses and generated a
phylogenetic tree for Subjects 1 and 2 independently (Fig.
3
a,
b). We noticed that there was no increase in sequence diversity
over time, consistent with no replication
16–20or minimal
replication
21–25on ART. We identified several identical
sequences in the intact tree, suggesting clonal expansion of intact
proviruses
6,9,26–32. For Subject 1, there were occasional identical
intact clones, but they did not appear to increase in frequency
over time. There was one pair of identical sequences in 2008, and
another distinct pair was identified in 2012 which was also
detected once in 2015. While identical sequences only accounted
for ~22% of intact proviruses in Subject 1, in 2015 half of the
intact proviruses (1 out of 2) had been sampled at earlier time
points. We found no intact proviruses in the 2018 sample from
Subject 1 (Fig.
3
a). For Subject 2, we identified nine distinct
clones of intact proviruses which increased in prevalence over
time. One identical clone emerged ~9 years after starting ART
(2014) in Subject 2 and persisted in samples from 2015 and 2018.
This proviral clone was capable of releasing infectious virus as
measured by QVOA (Fig.
3
b). The presence of identical
sequences is suggestive of clonal expansion of cells harboring
intact proviruses, a recently supported phenomenon
6,9,26–32which may contribute significantly to the maintenance of the
intact reservoir. To minimize the effect of clonal expansion
on reservoir decay, we next counted each clone only once, at the
time it
first appeared (Fig.
2
c, d), assuming proviruses with
identical sequences were clones. We found that this led to a
greater
fit to the exponential model, suggesting that when the
effects of clonal expansion are reduced the resulting dynamics
more closely follow an exponential decay. Given the substantial
decay of intact proviruses when clonal expansion is minimized,
our data suggest that a significant portion of the reservoir is
expressed over time, consistent with recent literature
33–35as well
as intracellular RNA measures in both subjects (Supplementary
Table 2).
Role of splicing on the proviral landscape. Our results of
minimal changes in HIV DNA yet a significant decline in intact
proviruses over time led us to investigate the dynamics of
defective proviruses in the reservoir. Importantly, defective
pro-viruses are not expected to be subject to selective pressures that
arise through ongoing replication. We restricted our study to four
similar time points for Subjects 1 and 2, spanning nearly 10 years
on ART and 2 time points for Subjects 3 and 4 (identified by
arrows in Fig.
1
). We performed full-length proviral sequencing
of every amplicon obtained at limiting dilution. In this way, we
sequenced over 1400 individual proviruses and performed de
novo assembly to generate contiguous sequences. Evaluation of
the de novo assembled proviruses showed a predominance of
large deletions, in agreement with other studies
5–10.
Supple-mentary Figure 1 shows the distribution of the sequenced
pro-viruses according to the number of ORFs. We observed that
proviruses with nine complete ORFs tended to contract over time
while proviruses with 0 ORFs did not. A detailed analysis of ORF
selection showed that proviruses with an intact HIV Gag ORF
were negatively selected, but no other clear pattern emerged
(Fig.
4
). Initially, this seemed counterintuitive since Gag is less
toxic than other HIV proteins. This led us to examine the deletion
maps of the subjects which revealed that splicing could play an
important role in selection.
To visually inspect for selection pressures that might be exerted
on deleted proviruses, we
first aligned all defective proviruses
from two time points for Subject 1 (Fig.
4
a, b) and Subject 2
(Fig.
4
c, d) identified by asterisk in Fig.
1
as well as Subjects 3
(Fig.
4
e, f) and 4 (Fig.
4
g, h) to the reference HXB2. Next, we
grouped the deleted proviruses into categories based on the
presence or absence of the donor splice sites 1 (D1) and 4 (D4).
D1 and D4 are unique among HIV splice sites for their strong
ability to interact with U1 small nuclear ribonucleoprotein
(snRNP) and splice with a downstream acceptor. The other
ART ART ART Years on ART 0.9* 3.4 5.3 8.2* 0.3 2.1* 4 6.1 9* 10 12.9 4.3* 8.6* 1.9* 6.6* Apheresis Years on ART Apheresis 11 HIV copies HIV copies 2005 2005 2003 2001 1999 1997 1995 2007 2007 2006 2008 2010 2012 2014 2016 2009 2011 2013 2015 2017 2019 2005 2007 2009 2011 2013 2015 2017 2019 106 104 102 100 106 104 102 100Subject 1 ART Subject 2 1000
750 500 250 Viral load (copies/ml) Total HIV (copies/million CD4s) 0 CD4 count CD4 T cells / μ l 1000 750 500 250 0 CD4 T cells / μ l Subject 4 Subject 3 Limit of detection
Fig. 1 Longitudinal parameters of four subjects over time on ART. Longitudinal levels of plasma HIV-1 RNA (blue), total HIV DNA (green), and CD4 T cell counts (red). For each subject, peripheral blood mononuclear cells (PBMCs) were collected by apheresis at the time points indicated in the graph. The arrows identify the time points we used for sequencing of both intact and defective proviruses, while for the remaining time points only near-full-length proviruses were sequenced. Asteriks identify the time points used for the deletion maps in Fig.4. Total HIV DNA was quantified by primers binding to the long terminal repeat region of HIV-1. Values are normalized to CD4 T cell count and presented as log copies of HIV per million CD4 T cells. HIV RNA is presented as copies per ml blood
splice donor and acceptor sites of HIV are all considered
weak
12,36. We categorized deleted proviruses as follows: D1+
D4+ (black), D1+D4− (red), D1−D4+ (blue), D1−D4− (gold),
and hypermutated proviruses (purple). Upon inspection, we
found that the proportion of D1+D4+ (black) proviruses
contracted the most. These proviruses had small deletions but
retained D1 and D4. In addition, a subset of the D1+D4− (red)
proviruses, which contain 3′ deletions that encompass D4, also
appeared to contract over time, especially in Subject 1.
Interestingly, we found that a large fraction of these proviruses
had the genetic potential to express HIV Gag and occasionally
HIV Pol (Fig.
4
a–d). Notably, despite the fact that the red
proviruses lack the RRE, there is evidence that nuclear export of
Gag can be Rev-independent
37. Thus, we hypothesize that Gag
transcripts can reach the cytoplasm and be translated even in the
absence of Rev. The fraction of D1−D4− (gold) and
hypermu-tated (purple) proviruses did not significantly change over time.
Neither of these proviruses would be expected to express
functional HIV proteins. Overall, it seems the potential to express
HIV proteins exerts a negative selection pressure on the HIV
proviral landscape.
Subject 1 Subject 2a
b
c
d
2500 2000 1500 1000 500 0Intacts per 1e6 CD4
2500 2000 1500 1000 500 0
Intacts per 1e6 CD4
0 2 4 6 8 10 12 14 0 2 4 6 8 10 12 14
0 2 4 6 8 10 12 14 0 2 4 6
Years after ART 8 10 12 14
Fig. 2 Dynamic changes of intact proviruses over time. a Frequency of intact proviruses after initiating treatment for Subject 1 measured by intact copies per million CD4 T cells. Red circles represent intact proviruses calculated by multiplying the concentration of total HIV DNA per CD4 by the frequency of sequenced proviruses that were intact.b Frequency of intact proviruses for Subject 2.c Frequency of intact proviruses for Subject 1 when counting clones only thefirst time they were detected in order to minimize the effects of clonal expansion.d Frequency of intact proviruses in Subject 2 with clones counted only once, when theyfirst appeared. We includedfive time points for Subject 1 and 7 for Subject 2. For Subject 1, we did not identify any intact provirus in 2018, and therefore this time point is presented as an open circle. Black bars signify 95 percent confidence interval of the mean based on a binomial process with approximately 100 sequences per time point. The blue line is the estimated decay based on a exponential decay model
Subject 1 Identical clones
a
b
2007 Subject 2 2007 2005 2009 2011 2014 2014QVOA 2015QVOA 2015 2018 2008 2010 2012 2015 2018Fig. 3 Phylogenetic tree of intact proviruses for Subjects 1 and 2. a Phylogenetic tree of intact proviruses for Subject 1 (n= 90). Branch lengths are proportional to genetic distance to a consensus sequence for the sequences graphed in the tree. Identical clones are indicated within the red circles. Consensus sequences were generated for each subject and used to root the tree.b Phylogenetic tree of intact proviruses for Subject 2 (n= 123). Circled clones represent identical intact proviruses. Notably, we included 67 sequences from 2007 for Subject 1, at which time he was in the first phase of viral decay; for this reason, we excluded this time point in our model of intact proviral decay79. For Subject 1, no intact proviruses were
identified in the sample from 2018, and therefore this time point is presented as an open circle
Subject 1 2008 43% 47% 12% 32% 5′ 3′ D1Gag Gag-pol Pol D4 5′D1Gag 3′ Gag-pol Pol D4 16% 23% 32% 3% Subject 2 2007 Subject 3 2001 Subject 4 2010 Subject 4 2014 Subject 3 2005 Subject 2 2014 D1+/D4+ D1+/D4– D1–/D4– Hypermutants D1–/D4+ Gag Gag-pol %gag ORF Pol
a
b
c
d
e
f
g
h
Subject 1 2015Fig. 4 Deletion analysis reveals a role for splicing in reservoir dynamics. a Defective proviruses from an apheresis sample collected from Subject 1 in 2008 (~1 year of ART) are aligned to HXB2. In order, from top to bottom, black proviruses are D1+ D4+, red proviruses are D1+ D4−, blue proviruses are D1− D4+, and gold proviruses are D1−D4-. Hypermutated proviruses are represented in purple. The shaded beige, light green, and dark green regions correspond to the gag, gag-pol, and pol regions of HXB2, respectively. On the left side of panelsa–h we show the percentage of defective proviruses containing a complete Gag ORF.b Defective proviruses from Subject 1 for the apheresis sample collected in 2015 (~8 years of ART). Proviruses are graphed on the same scale to demonstrate how the proportion of each type of defective proviruses changed fromfirst to last time point. c, d Defective proviruses from Subject 2 for the apheresis sample collected in 2007 (~2 years of ART) and in 2014 (~9 years of ART).e, f Defective proviruses from Subject 3 for the apheresis sample collected in 2001 (~4 years of ART) and in 2005 (~9 years of ART).g, h Defective proviruses from Subject 4 for the apheresis sample collected in 2010 (~2 years of ART) and in 2014 (~7 years of ART). The time points used for the deletion maps are identified by asterisks in Fig.1. Thefirst black provirus depicted ina contains a D1 and terminates within the gag ORF, but this is obscured due to imperfect R-codedfiltering
One category of proviruses increased relatively over time.
These proviruses are represented in blue in Fig.
4
. All blue
proviruses contained a deletion in the 5′ end and are missing the
major splice donor site D1, but they all preserved D4 (D1−D4+).
On inspection, it became clear that at the later time points several
of the blue proviruses were identical sequences and represented
defective proviral clones. These proviruses are not expected to
express HIV Gag/Pol efficiently because they lack the canonical
AUG for Gag/Pol. For this category of defective proviruses, the
deletion begins in front of the four stem loops of the psi
packaging site and ends before D4. This is true by definition
because D1 is located within the second stem loop of the
packaging site. Importantly, D1 is utilized in the canonical splice
pathway for all the proteins besides Gag/Pol which are encoded
on the 3′ end of HIV. Given that all canonical spliced and
unspliced forms of HIV have by design the same 5′ untranslated
region (5′UTR) with extensive secondary structure, including the
Trans-activation response element (TAR) and the four packaging
stem loops
38, it is reasonable to assume that HIV has evolved to
efficiently translate proteins when the entire 5′UTR is placed next
to the favored AUG. It follows that truncating the 5′UTR would
likely make HIV translation less efficient. Thus, inefficient protein
expression may provide one mechanism for the relative increase
over time of D1−D4+ proviruses. Importantly, we observed
similar patterns in two additional subjects for which only two
time points were available for analysis (Fig.
4
e–h).
Immune evasion may also contribute to the relative
preserva-tion of D1−D4+ proviruses. All of the D1−D4+ proviruses also
contain a complete ORF for Nef, which could provide a
mechanism of immune evasion
39–43. Nef has been shown to
downregulate MHC and to provide protection from CTL
clearance
39–43. These changes, while still present in Subject 2,
tended to be less dramatic as compared to the other subjects. This
could be due to weaker immune responses in Subject 2, which in
turn would be consistent with his clinical history, characterized
by HLA B35 haplotype and a rapid drop in CD4 T cell count
[down to 0 CD4 T cells six years after diagnosis (Supplementary
Table 1)]. Thus, D1−D4+ proviral clones may be relatively
preserved because they evade the immune system by Nef.
Two opposing forces shape the proviral landscape. To probe if
expression potential was important for selective pressure we
investigated whether defective proviruses with an intact
D1 sequence and at least one intact ORF were selected against
and thus declined over time. We required the presence of D1 and
at least one intact ORF because proteins that are expressed on the
3′end utilize this sequence to make the canonical spliced products
that encode all proteins except Gag/Pol
12,13. The majority of
proviruses meeting these criteria contained an intact Gag ORF
(Fig.
4
). We excluded intact proviruses which clearly decreased
over time from this analysis to concentrate on the pressures
exerted on defective proviruses. By using a linear random-effects
regression model, we found a relative decline in defective
pro-viruses with a D1 splice site and at least one intact ORF in the
four subjects (P
= 0.003 by type III Anova; Fig.
5
a). Thus, our
data suggest that the potential to express proteins even among
defective proviruses correlates with relative clearance of proviral
DNA.
We next asked if the presence of a strong D4 in the absence of
D1 could explain the relative increase of defective proviruses
containing complete ORFs in the 3′end over time. We reasoned
that the absence of D1 in a provirus with a large 5′ deletion would
truncate the 5′UTR and thereby hinder expression of any of the
HIV proteins translated from spliced RNAs
12,13. Moreover, the
vast majority of D1−D4+ proviruses contain an intact ORF for
Nef such that if proteins were made, we would expect Nef to be
prominent among them. Given that Nef provides a mechanism
0 10 0 25 50 75 100 % D1+ with ORFs
a
P = 0.003 0 10 0 25 50 75 100 % D1– D4+b
P = 0.05 P = 0.05 0 10 0 25 50 75 100 % clonesd
0 10 0 25 50 75 100Years after ART Years after ART
% unopposed splice donors (D1 or D4)
c
P < 0.001 S1 S2 S3 S4 5 5 5 5Fig. 5 Relative changes in the major splice sites donors reveal selection pressures. a Percentage of defective proviruses with D1 splice site and at least one ORF over time on ART (red).b Percentage of intact D4 splice site sequence in defective proviruses lacking 5′ D1 at the same time points. These proviruses are predicted not to express proteins efficiently due to a truncated 5′UTR (blue). c Percentage of defective proviruses with unopposed strong donor splice site, i.e. D1+ without ORFs or D1−D4+ at the same time points (green). d Percentage of clones over time in defective proviruses (black). Estimations of a common slope for these data were done using a linear random-effects regression model, assuming each subject had a different intercept at the initiation of ART. To test for the statistical significance of this effect, a statistical analysis based on a type III Anova was performed. The time points used for the analysis of the deleted proviruses are identified by arrows in Fig.1
for immune evasion
39–43this might contribute to positive
selection. To test this hypothesis, we plotted the presence of D4
without D1 over time among defective proviruses in the four
subjects and found a significant increase (P = 0.05 by type III
Anova), consistent with relative positive selection for proviruses
with strong donor splice sites without strong potential for HIV
protein expression (Fig.
5
b).
We then asked if the presence of a strong donor splice site (D1
or D4) might drive the relative increase in deleted proviruses
when genetic elements that favor protein expression are missing,
potentially by enhancing clonal expansion. We defined those
proviruses that lack genetic elements to promote protein
expression (D1−D4+ and D1+ without ORFs) as proviruses
with an unopposed strong donor splice site. In other words, the
term unopposed indicates proviruses without genetic elements
that favor protein expression. We found a correlation between the
percentage of unopposed splice sites and time (P < 0.001 by type
III Anova; Fig.
5
c). In summary, the number of defective
proviruses that contained unopposed strong donor splice sites
increased over time which likely reflects proliferation of cells
containing these defective proviruses.
We next plotted the frequency of all clones over time as a
proportion of the reservoir. In all subjects we observed the
expansion of proviral clones over time (P
= 0.05 by type III
Anova; Fig.
5
d). Clones steadily increased relative to other
defective proviruses over time, consistent with several recent
studies
29–31,44,45. Splicing may be one driver of clonal expansion
since a higher percentage of clones contained unopposed splice
sites than defective proviruses in general (Supplementary Table 4,
P
= 0.02 by Wilcoxon signed-rank test). Notably, the absolute
number of defective proviruses with unopposed splicing potential
as well as clones did not change over time on ART
(Supplemen-tary Fig. 2). This suggests that the majority of clonal expansion
occurs before or near the time of ART initiation (Supplementary
Fig. 2). Nonetheless, our data are consistent with other studies
32showing that individual proviral clones wax and wane during
ART, indicating that clonal expansion continues even after ART
initiation, possibly at a slower rate (Supplementary Fig. 3).
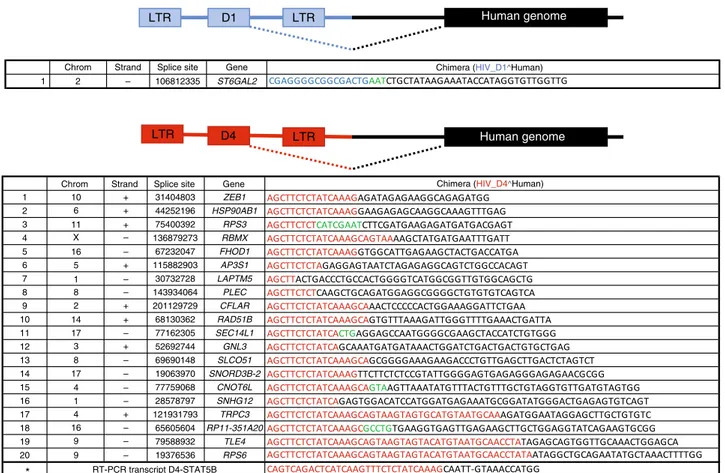
HIV expression can lead to aberrant splicing. In order to
investigate the biological evidence supporting our
findings, we
measured the frequency of cells that contained unspliced HIV
RNA and multispliced (ms) HIV RNA in Subjects 1 and 2
(Supplementary Table 2). We found between 10% and 30% of
proviruses were actively transcribing at the four time points tested
consistent with
33,34. A much smaller fraction of cells had
detectable tat/rev ms HIV RNA. Thus, the potential to splice to
downstream oncogenes exists. We then measured the frequency
of splicing between D1 or D4 and downstream human genes in
our in vitro model of resting T cell infection. In a recent study
46,
D1 was shown to splice to the human oncogene STAT5B,
sug-gesting a potential mechanism that HIV can exploit for its own
expansion by integrating into genes that promote cell division.
This
finding as well as our own results led us to investigate
whether D1 or D4 could splice to downstream exons in infected
CD4 T cells. We
first performed RT-PCR on 600 ng RNA
recovered from in vitro-infected CD4 T cells. After two rounds of
PCR, we were able to detect and confirm by Sanger sequencing
the presence of D4-STAT5B chimeric transcripts (Fig.
6
), but not
LTRChrom Strand Splice site Gene
Chrom Strand Splice site
31404803 ZEB1 HSP90AB1 RPS3 RBMX FHOD1 AP3S1 LAPTM5 PLEC CFLAR RAD51B SEC14L1 GNL3 SLCO51 SNORD3B-2 CNOT6L SNHG12 TRPC3 TLE4 RPS6 RP11-351A20 44252196 75400392 136879273 67232047 115882903 30732728 143934064 201129729 68130362 77162305 52692744 69690148 19063970 77759068 28578797 121931793 65605604 79588932 19376536 RT-PCR transcript D4-STAT5B Gene
Chimera (HIV_D1∧Human)
Chimera (HIV_D4∧Human) 106812335 ST6GAL2 Human genome Human genome 1 1 1 1 2 2 2 3 3 4 4 4 5 5 6 6 7 8 8 8 9 9 9 10 10 X 11 11 12 13 14 14 15 16 16 16 17 17 17 18 19 20 * – – – – – – – – – – – – – + + + + + + + + LTR D4 LTR LTR D1
Fig. 6 HIV expression leads to chimeric transcripts between D1 or D4 and human genes. RNA-seq was performed using in vitro-infected resting cells harvested at day 7 after infection. The sequences of the chimeric transcripts between HIV D1 (blue) and human genes (black) are shown in the top panel, while those between HIV D4 (red) and human genes (black) are shown in the bottom panel. We marked in green the sequences we could not map to either HIV or the human genome.The sequence marked with an asterisk was retrieved by RT-PCR and Sanger sequencing of in vitro-infected CD4 T cells
D1-STAT5B transcripts. We then performed RNA-seq on four
million in vitro-infected CD4 T cells that were cultured for 7 days
in the presence of IL-7 and found that splicing occurred more
frequently between D4 and downstream exons in comparison to
D1 (20 to 1 ratio; Fig.
6
). While our experiment does not address
selection, our data are consistent with the idea that splicing
between D4 and downstream exons could provide a mechanism
to induce cell division. In turn, this may explain why D1−D4+
proviruses are enriched relative to other proviruses over time.
Discussion
Our longitudinal study of proviral sequences reveals that two
opposing forces simultaneously exert negative and relative
posi-tive selection pressures on cells containing proviral DNA in
HIV-infected individuals on ART. Specifically, we found that
pro-viruses with both an intact 5′UTR and ORFs declined over time
while proviruses with strong donor splice sites and a truncated 5′
UTR increased relatively over time. Consistent with recent
studies
6,9,26–34, we also found evidence of clonal expansion of
intact proviruses. We speculate that positive selection of these
proviruses can be driven by the unique positioning of strong HIV
donor splice sites within an intron of an oncogene. Our work has
several implications for HIV eradication:
first, it provides a
mechanism for how intact proviruses can decline over time while
proviral DNA levels remain unchanged; second, it gives new
insights on forces that might drive clonal expansion; third, it
provocatively suggests that the HIV reservoir is likely less
resis-tant to reactivation than generally thought. This has imporresis-tant
implications for HIV cure as it suggests that the major hurdle to
HIV eradication may not be the invisibility of the reservoir. On
the contrary, our results suggest that HIV expression may provide
a targetable mechanism for HIV persistence.
We
find reservoir expression leads to proviral clearance. Our
data show that intact proviruses contracted more rapidly than
defective proviruses. This
finding suggests that intact proviruses
experience stronger negative selection. The strong negative
pressure against intact proviruses suggests in turn that the
majority of the replication-competent reservoir is expressed over
time, despite the small fraction that is detectably expressed at any
one moment
33–35,47–50. Negative selective pressures could be due
to immune or viral cytotoxicity. It is generally thought that
immune pressure during ART is minimal due to the dramatic
drop in the total antigen load
51–53. However, our study suggests
that immune pressure can play a role in shaping the reservoir
even during suppressive ART in humans. In rhesus macaques
there is evidence that CD8 T cell depletion after ART suppression
results in rebound viremia, which is consistent with our
interpretation
54.
Deleted proviruses with genetic elements that promote protein
expression contract over time. In addition to intact proviruses, we
observed the contraction over time of a subset of defective
pro-viruses. We noticed this subset contained both a full-length 5′
UTR and at least one functional ORF and fell into the category of
D1+ D4+ or D1+ D4−. The 5′UTR is generally defined as the
region between the transcription start site and the canonical AUG
start codon. This region contains several regulatory elements that
play a role in translation initiation
38. Subject 2 showed a weaker
contraction of proviruses with a full-length 5′UTR and gag ORF.
This suggests that Subject 2 exerts less immune pressure than the
other subjects, as supported by clinical history of more rapid
progression (Supplementary Table 1). The variable contraction
of proviruses on ART could be due to variable immune pressure.
Consistent with this idea, proviral DNA significantly declines
on ART in elite controllers and acutely infected individuals,
who have a more robust immune response to HIV
55–61.
On the other hand, proviral DNA decline is variable and difficult
to detect in chronically infected individuals who have a weaker
immune system
59–61.
Proviruses with limited expression potential are relatively
preserved over time. It seems reasonable to assume that cells
infected with proviruses that lack ORFs will experience no
immune pressure and those that have reduced genetic potential
for protein expression would be relatively preserved because
they would be less visible to the immune system. Specifically,
D1−D4+ proviruses should also be relatively protected from
immune clearance as we expect them to be expressed at lower
levels since they have a truncated 5′UTR. Interestingly, the
D1−D4+ proviruses have deletions that start in front of the HIV
packaging site stem loops (downstream of TAR) and end
some-where in gag/pol. While a role for TAR in translation has been
supported
38, further work on the stem loops is needed to
demonstrate if they have a role in translational control of HIV
62.
It should also be mentioned that immune evasion provides an
additional (not mutually exclusive) mechanism for D1−D4+
preservation. The vast majority of D1−D4+ proviruses contain
HIV Nef, which may contribute to immune evasion
39–43,63.
Proviruses that lack elements to promote protein expression
but retain splicing may enhance clonal expansion. Our data in
combination with recent work
45,46,64suggest that integration of
proviruses into introns can stimulate cell division. Long terminal
repeat (LTR) transcription can lead to splicing between a strong
HIV donor site and an oncogene acceptor site. This in turn could
result in higher expression of the oncogene as recently
descri-bed
46. Our work advances the
findings of Cesana et al.
46by
showing that unopposed strong donor splice sequences correlate
with relative proviral clonal expansion in vivo and by
demon-strating the contribution of D4, not just D1 (Figs.
4
–
6
,
Supple-mentary Fig. 2, SuppleSupple-mentary Table 4). Our hypothesis is further
supported by the presence of chimeric transcripts between HIV
and human genes (Fig.
6
). In the context of recent literature,
splicing in the absence of immune clearance provides a
mechanism for how HIV integration near an oncogene can lead
to clonal expansion
45,46,65,64.
Contraction and expansion forces could be applied to all
proviral clones including intact ones. Notably, if HIV inserts
within an intron of an oncogene it seems likely that with robust
LTR transcription there could a mixture of canonical HIV RNA
forms leading to HIV protein expression and aberrant splicing to
downstream exons. Cell division would occur if a strong D1 or
D4 splice sequence spliced to an exon of an oncogene, leading to
forced expression of the oncogene. On the other hand, negative
selection pressure may occur if the provirus expresses HIV
pro-teins that could lead to immune-mediated or viral cytotoxicity. In
other words, a D1+ D4− provirus could express proteins and
also provide a D1 to splice to an oncogene. In fact, this could
apply to all categories of proviruses that have the potential to
express HIV proteins as well as splice, including the intact ones.
Notably, intact proviral clones appear to emerge after many years
of ART when the immune system wanes. It seems logical that
intact proviral clones would proliferate without being cleared by
the waning immune system. If true, this would suggest that
immune clearance plays a greater role than viral cytotoxicity in
the elimination of proviral clones.
The timing and drivers of clonal expansion remain unclear.
One limitation of our approach is that we cannot easily quantify
the extent of negative and positive selection individually because
they are opposing and simultaneous forces. It is possible that
clones form predominantly before starting ART or around the
time of ART initiation, then emerge after clearance of the
pro-viruses capable of expressing proteins. This is consistent with
previous work showing turnover of T cells is many fold higher
before ART is initiated
66. It is also consistent with our own work
that shows a steady increase in proviral DNA over time prior to
ART
59which then plateaus after ART initiation
4,59. On the other
hand, our data show that individual proviral clones wax and wane
over time (Supplementary Figs. 2 and 3), suggesting that clonal
expansion likely occurs even during ART, perhaps at a lower rate,
perhaps driven by sporadic stimuli. Regardless, the enrichment of
clones with identical sequences indicates that some proviral
expansion occurs through cell division and likely includes
epi-sodic expansions and contractions. Our contribution is to provide
evidence that a substantial driving force may be due to unique
positioning of splicing sites, but several other drivers beyond
splicing likely play a role
67.
Clonal expansion is a newly identified force driving HIV
persistence. In our study, we observed that 78% of intact
pro-viruses in Subject 2 were identical at the last time point. This
suggests that cell division contributed to the increase in intact
proviruses in Subject 2. Previous investigations have shown
that HIV preferentially integrates into actively transcribing
genes
68and can potentially clonally expand without reactivating
and triggering immune clearance
69. Evidence supporting a role
for
clonal
expansion
in
proviral
persistence
has
been
mounting
6,9,26–32,44–46,64,67,70,71. In one study, the identical intact
sequences were more prominent in effector memory (EM) cells
6consistent with work showing the persistence over many years of
a mutant HIV clone in EM cells
72. Another study showed that
clonally expanded proviruses are important for viral rebound
33.
The accumulation of intact clonal sequences (Fig.
3
) in Subject 2
adds to the evidence that clonal expansion plays a role in
reser-voir persistence and suggests that its contribution is substantial.
An important limitation of our study is the small number of
subjects studied as well as the fact that our analysis is comprised
of only the circulating white blood cells. Thus, our data do not
reflect the selection of proviruses in tissue-resident lymphocytes
that do not recirculate. However, as recent studies have shown
that the phylogeny of proviruses isolated from lymph nodes and
blood is similar, our analysis likely reflects selection pressures
exerted on the circulating pool of lymphocytes that travel between
the blood, spleen, and lymph nodes
33,34. Moreover, we cannot
rule out that some rounds of ongoing replication (either due to
poor ART penetration into some compartments or drug
resis-tance) may have occurred, especially in Subject 2. However, the
lack of phylogenetic evidence of ongoing replication and the
demonstration that the predominant intact sequences are
pre-dicted to be susceptible to ART, combined with the prevalence of
clonal expansion, reinforce the notion that cellular expansion, not
viral replication, is likely the primary driver of positive selection
in individuals on ART.
Taken together, our data suggest that intact HIV proviruses are
under stronger negative selective pressure for clearance than
defective proviruses. This suggests indirectly that the majority of
the reservoir is expressed over several years, implying that lack of
HIV expression may not be the main hurdle to reservoir
clear-ance. In fact, the very expression of HIV RNA may play an
important role in HIV persistence as RNA transcription is
essential for HIV splicing. Splicing in turn may enhance
expres-sion of downstream genes involved in cell diviexpres-sion and may
represent a new target for HIV cure.
Methods
Apheresis. Subjects underwent apheresis at the University of Pennsylvania according to protocols #704904, approved by the Institutional Review Board (IRB). Each subject signed an informed written consent to be enrolled in the study. The early time point samples from Subjects 1 and 2 as well as the samples from Subjects 3 and 4 were provided by Dr. Stephen Migueles (National Institute of Health) who follows his institutional protocol with IRB approval.
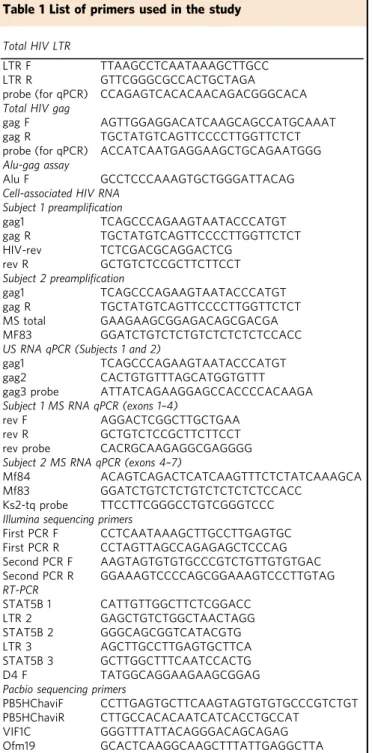
DNA isolation and quantification of HIV DNA. DNA was isolated from PBMCs using the Gentra Puregene Cell Kit (Qiagen). HIV DNA was quantified by total HIV against the LTR (primers LTR F and LTR R; Table1) or gag regions (primers gag F and gag R; Table1). Integrated HIV DNA was measured using primers Alu F and gag R; Table1). First-step PCR reactions were cycled using the Nexus Master Cycler (Eppendorf) and qPCR reactions were cycled on a 7500 FAST real-time instrument (ThermoFisher). For total HIV, PCR conditions for thefirst round were: 95 °C for 2 min; then 95 °C for 15 s, 64 °C for 45 s, 72 °C for 1 min for 12 cycles; and then 72 °C for 10 min. For Alu-gag measurements the following PCR conditions for thefirst round were used: 95 °C for 2 min; then 95 °C for 15 s, 56 °C for 45 s, 72 °C for 3:30 min for 40 cycles; and then 72 °C for 10 min. Fifteen microliters of thefirst-round PCR reactions were run on the qPCR instrument using the primers LTR F and LTR R for total HIV LTR and Alu-gag reactions and primers gag F and gag R for total HIV gag measurements (Table1). PCR condi-tions were: 95 °C for 15 s; then 95 °C for 10 s, 60 °C for 20 s for 40 cycles. Cell-associated HIV RNA measurements. Frequencies of cell-associated HIV RNA+ cells per million PBMC and HIV RNA copy numbers per cell were mea-sured by limiting dilution-duplex seminested qPCR assay that measures unspliced
Table 1 List of primers used in the study
Total HIV LTRLTR F TTAAGCCTCAATAAAGCTTGCC LTR R GTTCGGGCGCCACTGCTAGA
probe (for qPCR) CCAGAGTCACACAACAGACGGGCACA Total HIV gag
gag F AGTTGGAGGACATCAAGCAGCCATGCAAAT gag R TGCTATGTCAGTTCCCCTTGGTTCTCT probe (for qPCR) ACCATCAATGAGGAAGCTGCAGAATGGG Alu-gag assay
Alu F GCCTCCCAAAGTGCTGGGATTACAG Cell-associated HIV RNA
Subject 1 preamplification
gag1 TCAGCCCAGAAGTAATACCCATGT
gag R TGCTATGTCAGTTCCCCTTGGTTCTCT HIV-rev TCTCGACGCAGGACTCG
rev R GCTGTCTCCGCTTCTTCCT Subject 2 preamplification
gag1 TCAGCCCAGAAGTAATACCCATGT
gag R TGCTATGTCAGTTCCCCTTGGTTCTCT MS total GAAGAAGCGGAGACAGCGACGA MF83 GGATCTGTCTCTGTCTCTCTCTCCACC US RNA qPCR (Subjects 1 and 2)
gag1 TCAGCCCAGAAGTAATACCCATGT
gag2 CACTGTGTTTAGCATGGTGTTT gag3 probe ATTATCAGAAGGAGCCACCCCACAAGA Subject 1 MS RNA qPCR (exons 1–4)
rev F AGGACTCGGCTTGCTGAA
rev R GCTGTCTCCGCTTCTTCCT rev probe CACRGCAAGAGGCGAGGGG Subject 2 MS RNA qPCR (exons 4–7)
Mf84 ACAGTCAGACTCATCAAGTTTCTCTATCAAAGCA Mf83 GGATCTGTCTCTGTCTCTCTCTCCACC
Ks2-tq probe TTCCTTCGGGCCTGTCGGGTCCC Illumina sequencing primers
First PCR F CCTCAATAAAGCTTGCCTTGAGTGC First PCR R CCTAGTTAGCCAGAGAGCTCCCAG Second PCR F AAGTAGTGTGTGCCCGTCTGTTGTGTGAC Second PCR R GGAAAGTCCCCAGCGGAAAGTCCCTTGTAG RT-PCR STAT5B 1 CATTGTTGGCTTCTCGGACC LTR 2 GAGCTGTCTGGCTAACTAGG STAT5B 2 GGGCAGCGGTCATACGTG LTR 3 AGCTTGCCTTGAGTGCTTCA STAT5B 3 GCTTGGCTTTCAATCCACTG D4 F TATGGCAGGAAGAAGCGGAG
Pacbio sequencing primers
PB5HChaviF CCTTGAGTGCTTCAAGTAGTGTGTGCCCGTCTGT PB5HChaviR CTTGCCACACAATCATCACCTGCCAT
VIF1C GGGTTTATTACAGGGACAGCAGAG Ofm19 GCACTCAAGGCAAGCTTTATTGAGGCTTA
(us) and multispliced (ms) RNA simultaneously in the same RNA aliquot73. US RNA for both subjects was measured by a gag assay. MS RNA for Subject 1 was measured by an assay that amplifies exon 1–4 junction, while for Subject 2 it was measured by an assay that amplifies exon 4–7 junction. Different primers for MS RNA were chosen because of primer mismatches. The primers used for these measurements are reported in Table1.
Provirus amplification and sequencing. A two-step nested PCR approach was used to reduce non-specific amplification from genomic targets. Primer sets used in both reactions were located within the LTRs and were staggered appropriately to avoid localized LTR amplification as well as LTR-related PCR artifacts while simultaneously capturing nearly the full-length of HIV proviruses (Table1). We used a long-range and high-fidelity polymerase enzyme for both reactions (Plati-num SuperFi PCR Master Mix; ThermoFisher). In thefirst PCR reaction, PBMC DNA was diluted so that PCR amplification resulted in ≤30% of wells being positive for HIV DNA. The following PCR cycling conditions were used for both rounds: 95 °C for 2 min; then 95 °C for 15 s, 68 °C for 8 min (15 cycles for thefirst PCR, 40 cycles for the second one); then 72 °C for 5 min. Nested PCR reactions were visualized by gel electrophoresis, and the fraction of reactions containing≥2 bands were excluded from our analysis as these were often found to contain multiple proviruses. PCR amplicons were purified using the DNA Clean & Con-centrator kit (Zymogen) and DNA concentration was measured using the Quant-iT dsDNA Broad Range Assay Kit (ThermoFisher). Amplicons were prepared using the Nextera library preparation kit (Illumina) and sequenced on a MiniSeq System using a Mid-outputflow cell (Illumina).
Sequence assembly and removal of double proviruses. Paired reads were trimmed in the program Geneious using the BBDuk plugin, discarding reads from the adaptor, and then merged using Geneious. Again, the reads were trimmed of those with a quality rating under 30, and those under 115 base pairs in length. The reads were then mapped using BBMap to the HXB2 reference sequence, and the reads that aligned to the HIV sequence were extracted. Provirus contigs were made through de novo assembly of the extracted reads. Contigs generated by Spades, Tadpole, and Trinity de novo assemblers were compared. Accuracy of each assembler was evaluated by: (1) its ability to produce a contig matching the length of the region supported by reads when mapped to an HIV reference (2) reads supporting the generated contig. We selected Spades as our default de novo assembler based on these criteria. Reads were de novo assembled using Spades with default settings. When reads gave rise to multiple non-overlapping contigs, the contigs were concatenated into one sequence. Thefinal contig was then mapped back to HXB2, and annotated with motifs, including splice donor and acceptor sites, and ORFs as described in the Supplementary Methods 2. Finally, in order to determine whether two proviruses had been sequenced together (double viruses), the extracted reads were aligned to the assembled contig. Double pro-viruses were identified according to the criteria listed in the Supplementary Methods 1 and discarded from analysis.
Nomenclature. Intact proviruses were defined as those determined to code for nearly complete psi packaging sites with at least three stem loops (SL2 has to be intact because it contains D113) and nine complete ORFs for all HIV genes. We allowed for truncated Nef and Tat genes as commonly identified in infectious strains of HIV74. Nef was allowed to be truncated up to the extent seen in NL4-3. We required the presence of Major Donor Site 1 or a GT dinucleotide cryptic donor site located four nucleotides downstream13(only found in four proviruses) and presence of Major Donor Site 4. We also required the presence of splice Acceptor Site A5, A7, either A4a or A4b or A4c as well as an intact RRE sequence (Supplementary Table 5)13. We also accepted the sequence GGTAAGT as well as the canonical donor 1 splice sequence GGTGAGT for the D1 sequence as these sequences binds U1 snRNP equally well75. Notably this D1 variant sequence was found in a proviral sequence with no functional ORFs that was present at increasing frequency over time, consistent with clonal expansion.
Intact provirus decay analysis. Based on intact criteria, the number of intact proviruses per million CD4 T cells was calculated for each subject at multiple time points. To estimate decay parameters, a statistical analysis was performed using a random-effects regression model assumingfirst-order decay kinetics. Setting time t= 0 to be the date when ART was initiated, we were able to estimate the number of intact proviruses at the beginning of treatment, decay rate, as well as their half-life.
Deletion analysis. Provirus consensus sequences were aligned by MAFFT76using the iterative E-INS-i method with a gap penalty opening penalty of 1.8. This facilitates proper alignment of proviruses of different lengths, which is common among proviruses with deletions. Aligned sequences were then exported to an R software environment using the Seqinr Biological Sequence Retrieval and Ana-lysis package. Once in the R software environment, a program removed base pairs within each subject′s proviruses which were insertions relative to the HXB2 HIV sequence. This allowed the alignment of all proviruses to be standardized in length with base pair indices to HXB2. Then, deletions with length more than 100 base
pairs were recorded, and a graph was made in R which showed each sequence plotted against the base pair numbers of HXB2, with deletions shown (Fig.4). Identification of hypermutant sequences. To identify hypermutant HIV sequences, all proviruses for each individual were aligned using MAFFT with the E-INSi algorithm and a 1.8 gap penalty, and an intact HIV sequence was selected as the reference. The aligned proviruses were checked against the reference for hypermutants using the LANL Hypermut 2 program. The provirus with the lowest chance of being a hypermutant as determined by the Hypermut program was selected as the reference, and once again Hypermut 2 was run on the alignment. Proviruses determined to be hypermutant with P < 0.05 were counted as hyper-mutant ones.
Phylogenies and identification of potential clones. Intact proviral sequences were aligned using MAFFT76with the G-INSi algorithm with a 1.8 gap penalty. A maximum likelihood tree was constructed using PHYML with the general time reversible substitution model, using both SPR and NNI optimization methods for topology, four substitution rate categories, and an estimated transition/transversion ratio, proportion of invariable sites, and gamma distribution parameter77.
As described above, all intact proviruses were aligned in MAFFT using the E-INSi algorithm tofind potential clones, defined as proviruses with the same sequence and similar length. Wefirst trimmed the entire 5′ LTR and the 3′ LTR up to the end of nef. This was done to remove any ambiguous nucleotides due to poor assembly at both ends of the proviruses. We then created a phylogeny of the intact proviruses as described above, except those with inversions and large insertions. Proviruses that clustered closely in the phylogeny were then individually aligned with each other and manually checked for identical sequences (with sequence differences highlighted by Geneious). Clones were checked for a second time, this time once again aligning all proviruses with MAFFT and then among proviruses of a similar length manually identifying proviruses with identical sequences. QVOA assay. For Subject 2, we set up a QVOA using PBMCs from 2014 and 2015. Total CD4 T cells were negatively selected from PBMCs using the Easy-SepTM Human CD4+ T cell Isolation Kit (Stemcell technologies) and cultured at limiting dilutions in RPMI supplemented with 50 U/ml IL-2, IL-15 superagonist (ALT-803; 72 ng/ml; ALTOR), 10% fetal bovine serum, penicillin–streptomycin,
L-glutamine, and PHA (2 µg/ml). Allogeneic feeder PBMCs from a healthy donor were irradiated and added to culture. MOLT-4 cells (CRL-1582, ATCC) were added 24 h later and the cells were cultured for 2 weeks with half media changes every 3–4 days. After 2 weeks, supernatants were screened for p24 using NCI Fredrick p24 ELISA kits. IUPMs were calculated using extreme limiting dilution analysis software (Walter and Eliza Hall).
Sequencing of outgrowth virus populations. Viral RNA was isolated from each p24-positive QVOA well and converted to cDNA using an oligo(dT) primer and Superscript III Reverse Transcriptase (Table1). For each p24-positive QVOA well, a nearly full-length viral genome (~8845 bases in length) was amplified in two segments using barcoded primers that labeled each amplicon with one of 64 dif-ferent barcodes. Amplicons were then separately gel purified using the Qiagen MinElute Gel Extraction Kit and SMARTbell Adaptors were added to the ampli-cons using the template Prep Kit (PacBio). Sixty-four ampliampli-cons (each with a different barcode) were pooled into a library and libraries were submitted for PacBio sequencing (movie time of 10 h). The resulting sequences werefirst grouped by barcode, thus allowing identification of the QVOA well from which a virus was derived and correction of sequencing errors. High-quality sequences were then analyzed using the PacBio Long Amplicon Analysis (LAA) package. The 5′ and 3′ amplicons for the same virus were joined and visually screened to confirm that ORFs were intact.
RT-PCR and RNA-seq. Resting CD4 T cells of an uninfected donor were isolated and infected with NL4-3 by spinoculation by centrifuging viral supernatant on cells at 1200g for 2 h at 25 °C78. Cells were cultured for 7 days in the presence of IL-7 20 ng/ml and SQV 1 µM. At day 7, cells were harvested and total RNA was isolated using Trizol. RT-PCR was performed with 600 ng RNA per reaction, with primers binding to the HIV LTR (primer LTR 2) and STAT5B exon 6 (primer STAT5B 1) (Table1)46. The enzymes Superscript III and Platinum Taq polymerase were used for reverse transcription and amplification, respectively. The amplification product was diluted 1:50 and reamplified in two separate reactions with Taq polymerase using nested primers. In one reaction, the nested primers from Cesana et al.46were used to further amplify D1-STAT5B transcripts (primer LTR 3 and STAT5B 2), and in another reaction nested primers were used to amplify D4-STAT5B tran-scripts (primer D4 F and STAT5B 3; Table1). To isolate D4-STAT5B, we designed our own D4 and STAT5B primers (Table1). Our nested STAT5B primer was in exon 2 of STAT5B, closer to the junction between HIV and STAT5B observed by Cesana et al.46. Gel electrophoresis was performed on 30% of the amplification product from each reaction, and a band at the expected length was seen for the D4-STAT5B amplicon (210 nt), but not for D1-D4-STAT5B. Repeat PCR was performed on the remaining D4-STAT5B sample to obtain enough sample for Sanger sequencing using the same primers. Thirty percent of the product of this reaction
was run on a gel, and the band was excised, purified, and Sanger-sequenced with both the D4 F and STAT5B 3 primers. The transcript sequence mapped to HIV up to the D4 splice site, and then mapped to the STAT5B gene starting at the same junction at the start of exon 2 as seen by Cesana et al.46.
For RNA-seq, we used 1 µg of RNA isolated by Trizol from the same in vitro-infected cells. Ribosomal RNA was removed using the Ribo-Zero Gold rRNA Removal Kit (Illumina). The enriched messenger RNA was sequenced on a NextSeq 500/550 instrument after library preparation using the TruSeq Stranded Total RNA kit (Illumina).
Statistical analysis and graphing. Statistical processes were performed using R®, Pass, and Microsoft Excel®softwares. Graphpad Prism®software was used for graphing.
Code availability. The custom computer codes used for this study will be made available to the interested readers upon request to the corresponding author. Reporting Summary. Further information on experimental design is available in the Nature Research Reporting Summary linked to this Article.
Data availability
All relevant data used in this manuscript are available upon request to the corre-sponding author. The proviral sequences obtained in the study have been sub-mitted to the NCBI Sequence Read Archive under GenBank accession code MK383384-MK385589.
Received: 26 April 2018 Accepted: 31 December 2018
References
1. Siliciano, J. D. et al. Long-term follow-up studies confirm the stability of the latent reservoir for HIV-1 in resting CD4+T cells. Nat. Med. 9, 727–728 (2003).
2. Finzi, D. et al. Latent infection of CD4+T cells provides a mechanism for lifelong persistence of HIV-1, even in patients on effective combination therapy. Nat. Med. 5, 512–517 (1999).
3. Eriksson, S. et al. Comparative analysis of measures of viral reservoirs in HIV-1 eradication studies. PLoS Pathog. 9, eHIV-1003HIV-174 (20HIV-13).
4. Besson, G. J. et al. HIV-1 DNA decay dynamics in blood during more than a decade of suppressive antiretroviral therapy. Clin. Infect. Dis. 59, 1312–1321 (2014).
5. Bruner, K. M. et al. Defective proviruses rapidly accumulate during acute HIV-1 infection. Nat. Med. 22, 1043–1049 (2016).
6. Hiener, B. et al. Identification of genetically intact HIV-1 proviruses in specific CD4+T cells from effectively treated participants. Cell Rep. 21, 813–822 (2017).
7. Ho, Y.-C. et al. Replication-competent noninduced proviruses in the latent reservoir increase barrier to HIV-1 cure. Cell 155, 540–551 (2013). 8. Imamichi, H. et al. Defective HIV-1 proviruses produce novel protein-coding
RNA species in HIV-infected patients on combination antiretroviral therapy. Proc. Natl Acad. Sci. USA 113, 201609057 (2016).
9. Lee, G. Q. et al. Clonal expansion of genome-intact HIV-1 in functionally-polarized Th1 CD4 T cells. J. Clin. Invest. 127, 2689–2696 (2017). 10. Pollack, R. A. et al. Defective HIV-1 proviruses are expressed and can be
recognized by cytotoxic T lymphocytes, which shape the proviral landscape. Cell Host Microbe 21, 494–506 (2017).
11. Clever, J. L. & Parslow, T. G. Mutant human immunodeficiency virus type 1 genomes with defects in RNA dimerization or encapsidation. J. Virol. 71, 3407–3414 (1997).
12. Stoltzfus, C. M. Advances in Virus Research Vol. 74 (Elsevier Inc., Amsterdam, 2009).
13. Purcell, D. F. & Martin, M. A. Alternative splicing of human
immunodeficiency virus type 1 mRNA modulates viral protein expression, replication, and infectivity. J. Virol. 67, 6365–6378 (1993).
14. Fernandes, J., Jayaraman, B. & Frankel, A. The HIV-1 Rev response element. RNA Biol. 9, 6–11 (2012).
15. Ramratnam, B. et al. The decay of the latent reservoir of replication-competent HIV-1 is inversely correlated with the extent of residual viral replication during prolonged anti-retroviral therapy. Nat. Med. 6, 82–85 (2000).
16. Dinoso, J. B. et al. Treatment intensification does not reduce residual HIV-1 viremia in patients on highly active antiretroviral therapy. Proc. Natl Acad. Sci. USA 106, 9403–9408 (2009).
17. Gandhi, R. T. et al. The effect of raltegravir intensification on low-level residual viremia in HIV-infected patients on antiretroviral therapy: a randomized controlled trial. PLoS Med. 7, e1000321 (2010). 18. Josefsson, L. et al. The HIV-1 reservoir in eight patients on long-term
suppressive antiretroviral therapy is stable with few genetic changes over time. Proc. Natl Acad. Sci. USA 110, E4987–E4996 (2013).
19. Kearney, M. F. et al. Lack of detectable HIV-1 molecular evolution during suppressive antiretroviral therapy. PLoS Pathog. 10, e1004010 (2014). 20. Nettles, R. E. et al. Intermittent HIV-1 viremia (Blips) and drug resistance in
patients receiving HAART. JAMA 293, 817–829 (2005).
21. Tobin, N. H. et al. Evidence that low-level viremias during effective highly active antiretroviral therapy result from two processes: expression of archival virus and replication of virus. J. Virol. 79, 9625–9634 (2005).
22. Hatano, H. et al. Increase in 2-long terminal repeat circles and decrease in D-dimer after raltegravir intensification in patients with treated HIV infection: a randomized, placebo-controlled trial. J. Infect. Dis. 208, 1436–1442 (2013). 23. Buzón, M. J. et al. HIV-1 replication and immune dynamics are affected by
raltegravir intensification of HAART-suppressed subjects. Nat. Med. 16, 460–465 (2010).
24. Lorenzo-Redondo, R. et al. Persistent HIV-1 replication maintains the tissue reservoir during therapy. Nature 530, 51–56 (2016).
25. Cardozo, E. F., Luo, R., Piovoso, M. J. & Zurakowski, R. Spatial modeling of HIV cryptic viremia and 2-LTR formation during raltegravir intensification. J. Theor. Biol. 345, 61–69 (2014).
26. Bui, J. K. et al. Proviruses with identical sequences comprise a large fraction of the replication-competent HIV reservoir. PLoS Pathog. 13, e1006283 (2017). 27. Bui, J. K. et al. Ex vivo activation of CD4+ T-cells from donors on suppressive ART can lead to sustained production of infectious HIV-1 from a subset of infected cells. PLoS Pathog. 13, 1–19 (2017).
28. Hosmane, N. N. et al. Proliferation of latently infected CD4(+) T cells carrying replication-competent HIV-1: potential role in latent reservoir dynamics. J. Exp. Med. 214, 959–972 (2017).
29. Kim, M. & Siliciano, R. F. Reservoir expansion by T-cell proliferation may be another barrier to curing HIV infection. Proc. Natl Acad. Sci. USA 113, 201600097 (2016).
30. Simonetti, F. R. et al. Clonally expanded CD4+ T cells can produce infectious HIV-1 in vivo. Proc. Natl Acad. Sci. USA 113, 1883–1888 (2016).
31. Cohn, L. B. et al. HIV-1 integration landscape during latent and active infection. Cell 160, 420–432 (2015).
32. Wang, Z. et al. Expanded cellular clones carrying replication-competent HIV-1 persist, wax, and wane. Proc. Natl Acad. Sci. USA HIV-1HIV-15, E2575–E2584 (20HIV-18). 33. Kearney, M. F. et al. Origin of rebound plasma HIV includes cells with
identical proviruses that are transcriptionally active before stopping antiretroviral therapy. J. Virol. 90, 1369–1376 (2015).
34. Wiegand, A. et al. Single-cell analysis of HIV-1 transcriptional activity reveals expression of proviruses in expanded clones during ART. Proc. Natl Acad. Sci. USA 114, E3659–E3668 (2017).
35. DeMaster, L. K. L. K. et al. A subset of CD4/CD8 double-negative T cells expresses HIV proteins in patients on antiretroviral therapy. J. Virol. 90, 2165–2179 (2015).
36. O’Reilly, M. M., McNally, M. T. & Beemon, K. L. Two strong 5’ splice sites and competing, suboptimal 3’ splice sites involved in alternative splicing of human immunodeficiency virus type 1 RNA. Virology 213, 373–385 (1995). 37. Blissenbach, M., Grewe, B., Hoffmann, B. & Brandt, S. U. K. nuclear RNA
export and packaging functions of HIV-1 Rev revisited. J. Virol. 84, 6598–6604 (2010).
38. Hidalgo, L. & Swanson, C. M. Regulation of human immunodeficiency virus type 1 (HIV-1) mRNA translation. Biochem. Soc. Trans. 45, 353–364 (2017).
39. Mujib, S. et al. Pharmacologic HIV-1 Nef blockade promotes CD8 T cell-mediated elimination of latently HIV-1-infected cells in vitro. JCI Insight 2, e93684 (2017).
40. Schwartz, O., Maréchal, V., Le Gall, S., Lemonnier, F. & Heard, J.-M. Endocytosis of major histocompatibility complex class I molecules is induced by the HIV–1 Nef protein. Nat. Med. 2, 338–342 (1996).
41. Cohen, G. B. et al. The selective downregulation of Class I major histocompatibility complex proteins by HIV-1 protects HIV-infected cells from NK cells. Immunity 10, 661–671 (1999).
42. Mwimanzi, P. et al. Human leukocyte antigen (HLA) class I down-regulation by human immunodeficiency virus type 1 negative factor (HIV-1 Nef): what might we learn from natural sequence variants? Viruses 4, 1711–1730 (2012).
43. Collins, K. L., Chen, B. K., Kalams, S. A., Walker, B. D. & Baltimore, D. HIV-1 Nef protein protects infected primary cells against killing by cytotoxic T lymphocytes. Nature 391, 397–401 (1998).
44. Wagner, T. A. et al. An increasing proportion of monotypic HIV-1 DNA sequences during antiretroviral treatment suggests proliferation of HIV-infected cells. J. Virol. 87, 1770–1778 (2013).