UNIVERSITÀ DEGLI STUDI DELLA TUSCIA DI VITERBO
DIPARTIMENTO per la Innovazione nei sistemi Biologici, Agroalimentari e Forestali (DIBAF)
Corso di Dottorato di Ricerca in Ecologia Forestale - XXV Ciclo
The anthropogenic impacts on tropical
forest ecology and dynamics
AGR/05
Tesi di dottorato di:
Dott. Roberto Cazzolla Gatti
Coordinatore del corso Tutore
Prof. Paolo De Angelis Prof. Riccardo Valentini
Firma ……….. Firma
Index
•
Introduction………pag. 4
•
C
HAPTER1
-
The impact of selective logging on African tropical
forests………pag. 20
•
C
HAPTER2 - A model for localized disturbances in tropical
forests……….…..pag. 50
•
C
HAPTER3 -
The global correlation between canopy height and
biodiversity………..pag. 64
•
C
HAPTER4
-
A theory to explain why tropical forests are so
diverse……….….pag. 76
•
C
HAPTER5
-
Growth trends of tropical trees from Pre- to
Post-Industrial Age under a changing climate……….pag. 82
4
I
NTRODUCTION
Africa, topical forests, climate changes and biodiversity
Africa is the second-largest continent on Earth after Asia. With about 30 million square kilometres including adjacent islands and the Sahara, the world’s largest desert, Africa covers over 20 per cent of Earth’s total land area. Africa is also the second most populous continent after Asia.
With over 965 million people it accounts for about one-seventh of the world’s human population. The vast landscape of Africa contains a host of natural wonders and rich resources such as coltan and platinum, which are currently considered the most strategic minerals. Its grasslands, wetlands, mountains, deserts, rainforests and marine areas are home to thousands of species of plants and animals. It is also a land of unparalleled natural beauty and its rainforests are an important storehouse of carbon. Its vast mineral and natural resources provide immense opportunities for economic growth, development and human well-being. The high economic growth of over 4.6 per cent witnessed in the region since 2004 is largely underpinned by the region’s environmental resources—oil exploration, improved agricultural performance, and tourism (AMCEN & UNEP, 2008).
Africa is also a land of increasing population and rapidly changing land-use patterns; changes that have deep local, regional and global environmental significance. Sustaining a reasonably high economic growth rate to match the human population growth rate coupled with ensuring the environmental and natural resources integrity is one of the key challenges (UNEP, 2008). Climate change is likely to intensify some conditions like land degradation and desertification, water stress, declining biodiversity, deforestation, increasing dust storms, rising pollution and rapid urbanisation and alter the environment even further. Although Africa emits only four per cent of total global carbon dioxide emissions, its inhabitants are projected to suffer disproportionately from the consequences of global climate change. Given its economic constraints, Africa’s capacity to adapt to climate change is relatively low making the region exceptionally vulnerable to potential impacts. In many areas, even small changes in precipitation and water availability could have a devastating effect on agricultural output and therefore on food security. As climate change intensifies and its impacts deepen, adaptation will become increasingly difficult. Correspondingly, achieving targets set by the United Nations Millennium Development Goals (MDGs) will become more challenging. Africa is particularly vulnerable to climate change. Computer models project major changes in precipitation patterns on the continent, which could lead to food shortages and increased
5
desertification. Yet on the whole, African nations lack the resources and technology to address such changes (Adger et al., 2007; UNECA 2001).
According to this vulnerability, converting forests to agricultural land is necessary for food production but such deforestation negatively impacts local ecosystems as habitats are lost. Deforestation also impacts the global carbon cycle; carbon released when trees are cut, burned, or as they decompose enters the atmosphere as CO2 and contributes to global warming
(Willcocks 2002).
Moreover, land degradation and desertification processes result from both human activities and climatic variability. For example, people use controlled fire to manage grasslands and savannahs for livestock production and wildlife, control pests, clear dying vegetation, and convert wild lands to cropland (Trollope and Trollope 2004).
Another important environmental aspect, in Africa, is the rise of population. An increasing population and a decreasing water supply leads to water scarcity and stress. Water scarcity is defined as less than 1000 m3 of potable water available per person per year, while water stress means less than 1700 m3 of potable water is available per person per year (UNEP 2002). In terms of agriculture, water consumption can be defined as the amount of surface and groundwater absorbed by crops and transpired, or used directly in the building of plant tissue, together with water that evaporates from the area where crops are located. Water consumption also includes all activities where the use of water results in a loss of the original water supplied, such as industrial or community consumption (UNESCO, 2007).
There are few data concerning wetland losses in Africa. A 2005 review of wetland inventories in ten countries in southern Africa found significant losses in two areas in KwaZulu Natal: Tugela Basin, where over 90 per cent of wetland resources have been lost in parts of the basin, and the Mfolozi catchment (10 000 km2), where 58 per cent of the original wetland area (502 km2) had been lost (Taylor and others, 1995). Another study in 1992 reported an overall loss of 15 per cent of wetland area in Tunisia and 84 per cent wetland loss in the region’s Medjerdah catchment (Moser and other, 1996). Losses may be due to land conversion, water extraction and climate change.
Furthermore, biological diversity in Africa continues to decline (UNEP, 2002). Over 120 plant species are extinct, with another 1771 threatened (Bird and Medina, 2002). Threats to species are both direct (such as bushmeat hunting) and indirect (such as habitat loss). Some species, such as the Bonobo or pygmy chimpanzee (Pan paniscus), exist in very limited areas. Loss of habitat in these relatively small areas can lead to the rapid extinction of species (Brooks and others, 2002).
6
All this data show that Africa is already a continent under pressure from climate stresses and it is highly vulnerable to the impacts of global change. Many areas in Africa are recognized to have climates that are among the most variable in the world on seasonal and decadal time scales. Floods and droughts can occur in the same area within months of each other. These events can lead to famine and widespread disruption of socio-economic well-being.
Many factors contribute and compound the impacts of current climate variability in Africa and will have negative effects on the continent’s ability to cope with climate change. These include poverty, illiteracy and lack of skills, weak institutions, limited infrastructure, lack of technology and information, low levels of primary education and health care, poor access to resources, low management capabilities and armed conflicts. The overexploitation of land resources including forests, increases in population, desertification and land degradation pose additional threats (UNDP 2006). In the Sahara and Sahel, dust and sand storms have negative impacts on agriculture, infrastructure and health.
As a result of global warming, the climate in Africa is predicted to become more variable and extreme weather events are expected to be more frequent and severe, with increasing risk to health and life. This includes increasing risk of drought and flooding in new areas (Few et al. 2004, Christensen et al. 2007) and inundation due to sea-level rise in the continent’s coastal areas (Nicholls 2004; McMichael et al. 2006).
Africa will face increasing water scarcity and stress with a subsequent potential increase of water conflicts as almost all of the 50 river basins in Africa are transboundary (Ashton 2002, De Wit and Jacek 2006). Agricultural production relies mainly on rainfall for irrigation and will be severely compromised in many African countries, particularly for subsistence farmers and in sub-Saharan Africa. Under climate change much agricultural land will be lost, with shorter growing seasons and lower yields. National communications report that climate change will cause a general decline in most of the subsistence crops, e.g. sorghum in Sudan, Ethiopia, Eritrea and Zambia; maize in Ghana; millet in Sudan; and groundnuts in Gambia. Of the total additional people at risk of hunger due to climate change, although already a large proportion, Africa may well account for the majority by the 2080s (Fischer et al. 2002).
Africa is vulnerable to a number of climate sensitive diseases including malaria, tuberculosis and diarrhoea (Guernier et al. 2004). Under climate change, rising temperatures are changing the geographical distribution of disease vectors which are migrating to new areas and higher altitudes, for example, migration of the malaria mosquito to higher altitudes will expose large numbers of previously unexposed people to infection in the densely populated east African highlands (Boko et al. 2007).
7
Future climate variability will also interact with other stresses and vulnerabilities such as HIV/AIDS (which is already reducing life expectancy in many African countries) and conflict and war (Harrus and Baneth 2005), resulting in increased susceptibility and risk to infectious diseases (e.g. cholera and diahrrhoea) and malnutrition for adults and children (WHO 2004). Climate change is an added stress to already threatened habitats, ecosystems and species in Africa, and is likely to trigger species migration and lead to habitat reduction. Up to 50 per cent of Africa’s total biodiversity is at risk due to reduced habitat and other human-induced pressures (Boko et al. 2007). The latter include land-use conversion due to agricultural expansion and subsequent destruction of habitat; pollution; poaching; civil war; high rates of land use change; population growth and the introduction of exotic species. For example, the habitat of the great apes, including the western lowland Gorilla – identified as critically endangered on the World Conservation Union’s (IUCN) red list of threatened species, is likely to seriously decline in the next four decades.
Future sea level rise has the potential to cause huge impacts on the African coastlines including the already degraded coral reefs on the Eastern coast. National communications indicate that the coastal infrastructure in 30 percent of Africa’s coastal countries, including the Gulf of Guinea, Senegal, Gambia, Egypt, and along the East-Southern African coast, is at risk of partial or complete inundation due to accelerated sea level rise.
In Tanzania, a sea level rise of 50 cm would inundate over 2,000 Km2 of land, costing around USD 51 million (UNEP 2002a). Future sea level rise also threatens lagoons and mangrove forests of both eastern and western Africa, and is likely to impact urban centres and ports, such as Cape Town, Maputo and Dar Es-Salaam.
Predicting the impact of climate change on complex biophysical and socio-economic systems, that constitute agricultural sectors, is difficult. In many parts of Africa it seems that warmer climates and changes in precipitation will destabilise agricultural production. This is expected to undermine the systems that provide food security (Gregory et al., 2005). Whilst farmers in some regions may benefit from longer growing seasons and higher yields, the general consequences for Africa, are expected to be adverse and particularly adverse for the poor and the marginalized who do not have the means to withstand shocks and changes.
Effective adaptation strategies and actions should aim to secure well-being in the face of climate variability, climate change and a wide variety of difficult to predict biophysical and social contingencies. In pursuing this aim, climate adaptation should focus on support for the decision-making and capacity building processes that shape social learning, technology transfer, innovation and development pathways. Adaptation is most relevant when it influences
8
decisions that exist irrespective of climate change, but which have longer-term consequences (Stainforth et al., 2007).
A key component of climate adaptation involves building resilience, where resilience is the capacity of a system to tolerate disturbance without collapsing into a qualitatively different state that is controlled by a different set of processes: a resilient system can withstand shocks and rebuild itself when necessary.
An important aspect of the capacity to rebuilding itself sets up on energy. Sub-Saharan Africa is home to the world’s lowest electricity consumption rates per capita; here poverty and the under-development of modern energy services are clearly linked. Between 1990 and 1999, average per capita consumption fell from 695 kilograms of oil equivalent (kgoe) to 410 kgoe. Although Africa is home to 13% of the world’s population and produces 7% of the world’s commercial energy, it accounts for only 2% of the world’s GDP and 3% of global commercial energy consumption. In 1990 the total primary energy use in sub-Saharan Africa—including South Africa— was: 53% biomass; 26% petroleum; 14% coal; 3% large-scale hydro; 2% natural gas; and, 2% other renewables.
Moreover, according to the latest African Water Development Report, a total of five countries—South Africa, Egypt, Algeria, Nigeria, and Libya—were responsible for 84% of all energy production in Africa and for 78% of total energy consumed. Because of their centralised, non-renewable energy reserves—and high level of government involvement in energy generation—these countries have managed to develop at a faster rate than most other African countries. Conversely, due to the unavailability of comparable, traditional energy reserves, other African countries have had to import energy or rely primarily on renewable energy sources, e.g., hydro-electric generation, solar thermal and wind technologies. This development disparity illustrates a direct relationship between energy security and economic growth in Africa: energy security is a correlation of livelihood security.
As rural and urban low-income households do not have access to alternative energy sources they are the most vulnerable to climate change. This vulnerability is further compounded by national policy development that does not adequately address the needs of the rural population in general or rural energy needs in particular. There is, then, a real need to ensure sustainable energy supplies while also increasing access and affordable energy services for Africa’s poor—both rural and urban.
In the face of projected climate impacts, the need is even more pressing. Problems of inefficient energy production and use undermine the income-generating potential of entrepreneurs and small-scale farmers. Studies show that small and medium enterprises (SMEs) in sub-Saharan Africa still depend on biomass for 84% of their energy needs. The
9
increased threat of climate change on natural fuel resources reinforces the need for urgent action to provide alternative and sustainable energy generation and supply for this economic sector.
In terms of energy generation and supply, the impacts of climate change on the energy sector will be felt primarily through: changes in the growth rates of biomass for fuel use; increased runoff and siltation from land degradation on hydro-generation; and, losses or fluctuations in hydropower production due to increased stresses on water supply systems and changing rainfall patterns.
Hydropower generation is likely to be the most heavily impacted because it is sensitive to the amount, timing and geographical pattern of precipitation as well as temperature—rain or snow, timing and speed of melting, etc. As hydropower is the primary source of electricity in East Africa and Central Africa—and supplying about half of West Africa’s needs—the impact on development will be significant. This high dependence on water resources for energy generation further highlights the vulnerability of energy systems across Africa.
Although climate change seems marginal compared to the pressing needs of poverty alleviation, health, hunger and economic development, it is becoming increasingly clear that achieving development goals, such as those related to food, water and energy, can be seriously impeded by climate impacts. As a result, linkages between climate change and development are receiving more attention in political and scientific circles. Development can and should be planned in such a way that development goals are achieved, while simultaneously reducing vulnerability to climate change. It is essential that the potential impacts of climate change be mitigated in Africa where levels of poverty will be worsened by extremes of climate change. Countries with the fewest resources are most likely to bear the largest burden of climate change in terms of morbidity, loss of life, adverse effect on income and growth and damage to general living standards, such as access to safe water, energy and shelter.
Africa must explore mitigation options against greenhouse gases (GHG) emissions by developing solar, wind, hydro- and bio-energy sources; simultaneously the region must also consider the impacts of climate change on these energy sources.
The extent to which a community is able to adapt to climatic changes depends on its relative vulnerability—the degree to which a community is susceptible to the adverse effects of climate change—and adaptive capacity. Adaptive capacity is the ability of a community to adjust to the evolving challenges of climate change. It is also the ability of a community—or system—to adjust to climate change, to take advantage of opportunities, or to cope with the consequences. To be successful, adaptation responses must be consistent with sustainable development. However, historically, little reference is made to climate impacts in development plans other
10
than in disaster management plans for droughts and floods. Most of the work done to date looks at the impacts on natural resources that affect the livelihoods of Africans. While energy has received lots of attention, the main focus has been on energy access and ensuring a sustainable energy path for Africa. The linkage between sustainable energy and climate impacts has not been explicitly made. Longer-term impacts due to climate change, such as the gradual change in rainfall patterns, do not fit into most planning horizons which are usually politically and financially constrained. The uncertainty of future projections such as population growth, energy demand and future energy supplies, further complicates adaptation responses. All levels of government should ensure that policies, programmes, budget frameworks and projects take account of climate change and adaptation strategies. To date, much has been invested in Africa in terms of capacity building; however, more new efforts are needed to enhance the adaptive capacity of institutions, organisations and individuals. Even where climate change is recognised as a crucial concern, it is viewed as a long-term issue and therefore not consistently considered.
Thus, Africa has a huge burden to bear: it has been deemed “the continent most vulnerable to the impacts of climate change” by the UN Intergovernmental Panel on Climate Change (IPCC). Political, social, environmental and economic realities complicate the problem despite, or because of the region’s abundant natural resources. One thing is clear however: Africa must not be allowed to slip into climate-induced chaos because of the industrialised world’s addiction to fossil fuels. From the country reports, we can see that energy development for Africa in a changing climate will require greater emphasis on small-scale, decentralised and diversified supply and increased distribution to households and enterprises alike. As has been discussed, hydro-dependency will become problematic if rain patterns change. Similarly, renewable technologies such as wind and solar could be affected by changing climate patterns. A diversified and distributed energy mix is the best insurance policy against climate change. But adaptation of energy policies and systems is only part of the solution; building up the resiliency of local populations and energy systems is equally important.
Despite the obstacles facing Africa, hope is not lost. There are numerous positive characteristics upon which successful programmes can—and should be—built. Culturally, Africa has strong social networks. These networks serve an important function in educating communities, disseminating information and serving as substitutes for collateral in micro-loans. Women—in particular—play an important role in the management of natural resources. As primary collectors and users of biomass and water, women are well-placed to monitor and manage resources, spur innovation on adaptive techniques and experiment with new management approaches. Ironically, it may be Africa’s decades-long experience coping with
11
poverty that may be its strongest resource. By its collective survival the region has shown itself to be adaptive and resilient despite enormous obstacles. It is now our collective responsibility to ensure that this rich, diverse region develops to its fullest potential (Helio International, 2007).
Superimposed on the many other anthropogenic impacts on forest ecosystems is surely human-forced global climate change. Climate has a major influence on rates of photosynthesis and respiration (Law et al. 2007), and on other forest processes, acting through temperature, radiation, and moisture regimes over medium and long time periods. Climate and weather conditions also directly influence shorter-term processes in forests, such as frequency of storms and wildfires, herbivory, and species migration. As the global climate changes, forest ecosystems will change because species’ physiological tolerances may be exceeded and the rates of biophysical forest processes will be altered (Olesen et al. 2007, Kellomaki et al. 2008, Malhi et al. 2008).
If climate change results in a significant reduction in water availability, then the forest system will naturally change species composition (or state – see definition below). For example, the vegetation will reach a threshold beyond which the vegetation structure is not sufficiently tall and dense to comprise a forest, along with the concomitant changes in the dominant taxonomic composition of the plant community. Several studies have established that resilience in ecosystems is related to the biological diversity in the system and the capacity that it confers to maintain ecosystem processes (Hooper et al. 2005, Drever et al. 2006, Bodin and Wimen 2007). Most ecosystem processes are controlled by, or are the result of, biodiversity. However, not all species are
necessarily equally important in maintaining these processes (Walker 1992, 1995, Diaz et al. 2003) and there is some redundancy at multiple levels within most ecosystems (Hooper et al. 2005). Loss of functional species in the absence of redundancy has negative consequences for the ecosystem to the point of ecosystem collapse (Chapin et al. 1997). Bazazz et al. (1995) demonstrated the potential for populations to respond to varying levels of CO2, and the genetic
complexity and magnitude of genetic responses to population factors such as density and competitive interactions. The first aim of this Ph.D. thesis is to investigate the impact of selective logging, which alter forest dynamics and cause loss of functional species, and could seriously affect tropical forests under a changing climate. I carried out researches on African tropical forests trying to find a significant answer to this issue.
There is considerable ongoing debate over the role that biodiversity plays in ecosystem function and stability owing to the highly complex nature of the relationships among species and the synergistic roles of extrinsic factors and intrinsic factors, including genetic factors, in
12
ecosystems (see e.g., Waide et al. 1999, Kinzig et al. 2001, Loreau et al. 2002, for summary discussions). Further, there is evidence that complex forest ecosystems are more productive than less diverse ones (under the same conditions) (e.g., Phillips et al. 1994), and generally that forest systems comprised of few species are highly prone to various catastrophes including disease and invasion (Scherer-Lorenzen et al. 2005).
Much of the work done to understand the relationship between species diversity, ecosystem processes, and production has necessarily been done in highly controlled low-diversity systems at small scales, especially using grasses (e.g., Tilman and Downing 1994, Tilman et al. 1996, Hector et al. 1999, Hector 2002), or in other controlled systems (e.g., Naeem et al. 1995). Few studies have examined more connected systems with multiple trophic levels and complex production webs, such as forests, nor have they considered larger scales.
The second aim of this Ph.D. thesis is to understand the relations between forest structure, productivity and biodiversity.
Up to now, two main competing hypotheses have been identified to predict the relationship between biodiversity and productivity in ecosystems: the niche complementarity hypothesis (Tilman et al. 1996, Tilman and Lehman 2001) and the sampling effect hypothesis (Aarssen 1997, Doak et al. 1998).
Under either hypothesis, a certain level of saturation is expected where no more effective use of resources can be achieved regardless of increased species richness (Hooper et al. 2005). The niche complementarity (or niche differentiation) hypothesis predicts that as species are added to a system, the productivity in the system will increase until vacant niches are filled because of effective partitioning of resources. The coexistence of species then is assured through interspecific differentiation as a direct response to competition for resources. If species are able to avoid competition by occupying different niches, then production in the system will increase accordingly (e.g., Tilman and Lehman 2001, Tilman et al. 2002). Niche differentiation models also consider the concept of facilitation, where one or more species may enhance the capacity of another species to survive and reproduce (e.g., ectomycorrhizal fungi on tree roots or legumes in grasslands). However, few keystone functional roles among plants are known (e.g., C3 and C4 grasses, nitrogen fixers).
A competing model, the sampling (or selection) effect hypothesis, suggests that dominant competitors (“sampled” from the regional species pool) will play the greatest roles in ecosystem functioning and as diversity increases, functioning in the system will be controlled by these dominant species because of their greater likelihood of being present in a diverse system (e.g., Aarssen 1997, Huston 1997). This result is achieved because the best competitors will always control resources within a system. Niche differentiation models predict coexistence
13
among species, while sampling effect models predict dominance by one or a few species, especially for systems in equilibrium. Various studies suggest support for one or the other of these models (e.g., Hooper and Vitousek 1997, Tilman at al. 2002, Hooper and Dukes 2004) or suggest that the capacity to conduct the experiments has been limited by almost intractable design problems or analysis constraints (e.g., Huston 1997, Allison 1999, Schmid et al. 2002). By studying tropical forest of Africa and of the Earth I tried to shed light on this two competing hypothesis and to develop a unified theory which could explain the relations between forest structure, niche volume, climate and biodiversity.
14
References
⇒ AA.VV., Environment and development decision making in Africa 2006-2008
⇒ Aarssen, L.W. 1997. High productivity in grassland ecosystem: affected by diversity or productive species? Oikos 80: 183-184
⇒ Adams, RM, 1999. On the search for the correct economic assessment method. Climatic Change 41 (3–4), 363–70.
⇒ Allison, G.W. 1999. The implications of experimental design for biodiversity manipulations. Amer. Nat. 153: 26-45.
⇒ Bazazz, F.A., M. Jasienski, S.C. Thomas, and P. Wayne. 1995. Micro-evolutionary responses in experimental populations of plants to CO2-enriched environments: parallel results from two model systems. Proc. Nat. Acad. Sci. USA 92: 8161-8165.
⇒ Bodin, P. and B.L.B. Wimen. 2007. The usefulness of stability concepts in forest management when coping with increasing climate uncertainties. For. Ecol. Manage. 242: 541-552.
⇒ Chapin, F.S., B.H. Walker, R.J. Hobbs, D.U. Hooper, J.H. Lawton, O.E. Sala and D. Tilman. 1997. Biotic control over the functioning of ecosystems. Science 277: 500-504.
⇒ Chow, G, 1983. Econometrics. McGraw-Hill, New York. Deressa, T, Hassan, R & Poonyth, D, 2005. Measuring the economic impact of climate change on South Africa’s sugarcane growing regions. Agrekon 44 (4), 524–42.
⇒ Christian Aid, 2007 Human tide: the real migration crisis
⇒ Deschenes, O & Greenstone, M, 2007. Climate change, mortality, and adaptation: Evidence from annual fluctuations in weather in the US. MIT Department of Economics Working Paper
⇒ Diaz, S., A.J. Symstad, F.S. Chapin, D.A. Wardle and L.F. Huenneke. 2003. Functional diversity revealed by removal experiments. Trends Ecol. Evol. 18: 140-146. ⇒ Dinar, A, Hassan, R, Mendelsohn, R & Benhin, J, 2008. Climate change and agriculture
in Africa: Impact assessment and adaptation strategies. EarthScan, London.
⇒ Doak, D.F., D. Bigger, E.K. Harding, M.A. Marvier, R.F. O’Malley and D. Thomson. 1998. The statistical inevitability of stability-diversity relationships in community ecology. Amer. Natur. 151: 264-276
15
⇒ Drever, C.R., G. Peterson, C. Messier, Y. Bergeron and M.D. Flannigan. 2006. Can forests management based on natural disturbances maintain ecological resilience? Can. Jour. For. Res. 36: 2285-2299.
⇒ Dubin, J & McFadden, D, 1984. An econometric analysis of residential electric appliance holdings and consumption. Econometrica 52, 345–62.
⇒ FAO (Food and Agriculture Organization), 2003. The digital soil map of the world: Version 3.6 (January). FAO, Rome, Italy.
⇒ Gbetibouo, G & Hassan, R, 2005. Economic impact of climate change on major South African field crops: A Ricardian approach. Global and Planetary Change 47, 143–52. ⇒ Greene, WH, 2003. Econometric analysis. Fifth edition. Prentice Hall, New Jersey. ⇒ Greenpeace International, 2008 Cool Farming. Climate impacts of agriculture and
migration potential
⇒ Heckman, JJ, 1979. Sample selection bias as a specification error. Econometrica 47 (1), 153-61.
⇒ Hector, A. 2002. Biodiversity and the functioning of grassland ecosystem: multi-site comparisons. Pages 71-95 in A. Kinzig, D. Tilman and S. Pacala (eds.), Functional consequences of biodiversity: experimental progress and theoretical extensions. Princeton University Press, Princeton, NJ, USA.
⇒ Hector, A., B. Schmid, C. Beierkuhnlein, M.C. Caldeira, M. Diemer, P.G. Dimitrakopoulos, J.A. Finn, H. Freitas, P.S. Giller, J. Good, R. Harris, P. Högberg, K. Huss-Danell, J. Joshi, A. Jumpponen, C. Körner, P.W. Leadley, M. Loreau, A. Minns, C. P. H. Mulder, G. O’Donovan, S.J. Otway, J.S. Pereira, A. Prinz, D.J. Read, M. Scherer-Lorenzen, E.-D. Schulze, A.-S. D. Siamantziouras, E.M. Spehn, A.C. Terry, A.Y. Troumbis, F.I. Woodward, S. Yachi and J.H. Lawton. 1999. Plant diversity and productivity experiments in European grasslands. Science 286: 1123-1127.
⇒ Helio International, 2007 A preliminary assessment of energy and ecosystem resilience in ten African countries
⇒ Hooper D.U. and P.M. Vitousek. 1997. The effects of plant composition and diversity on ecosystem processes. Science 277: 1302-1305.
⇒ Hooper, D.U. and J.S. Dukes. 2004. Over-yielding among plant functional groups in a long-term experiment. Ecol. Letters: 7: 95-105.
⇒ Hooper, D.U., F.S. Chapin, J.J. Ewel, A. Hector, P. Inchausti, S. Lavorel, J.H. Lawton, D.M. Lodge, M. Loreau, S. Naeem, B. Schmid, H. Setala, A.J. Symstad, J. Vandermeer
16
and D.A. Wardle. 2005. Effects of biodiversity on ecosystem functioning: a consensus of current knowledge. Ecol. Monogr. 75: 3-35.
⇒ Huston, M.A. 1997. Hidden treatments in ecological experiments: re-evaluating the ecosystem function of biodiversity. Oecologia 110: 449-460.
⇒ International Institute for Environment and Development, 2008 Up in smoke? Threats from, and responses to, the impact of global warming on human development
⇒ International Institute for Sustainable Development, 2004 Adapting to climate change with decentralized renewable energy in developing countries
⇒ IWMI (International Water Management Institute) & University of Colorado, 2003. Hydroclimatic data for the GEF/CEEPA/World Bank Project on Regional Climate, Water and Agriculture: Impacts on and adaptation of agro-ecological systems in Africa. ⇒ Kellomaki, S., H. Peltola, T. Nuutinen, K.T. Korhonen and H. Strandman. 2008.
Sensitivity of managed boreal forests in Finland to climate change, with implications for adaptive management. Phil. Trans. Roy. Soc. B: 363: 2341-2351.
⇒ Kelly, DL, Kolstad, CD & Mitchell, GT, 2005. Adjustment costs from environmental change. Journal of Environmental Economics and Management 50, 468–95.
⇒ Kinzig, A.P., S.W. Pacala and D. Tilman, (eds.). 2001. The functional consequences of biodiversity: empirical progress and theoretical extensions. Princeton Univ. Press, Princeton, NJ, USA
⇒ Law, B.E. Falge, E.; Gu, L.; Baldocchi, D. D.; Bakwin, P.; Berbigier, P.; Davis, K.; Dolman, A. J.; Falk, M.; Fuentes, J. D.; Goldstein, A.; Granier, A.; Grelle, A.; Hollinger, D.; Janssens, I. A.; Jarvis, P.; Jensen, N. O.; Katul, G.; Mahli, Y.; Matteucci, G.; Meyers, T.; Monson, R.; Munger, W.; Oechel, W.; Olson, R.; Pilegaard, K. (et al). 2002. Environmental controls over carbon dioxide and water vapour exchange of terrestrial vegetation. Agric For Meteor 113: 97-120.
⇒ Loreau, M., A. Downing, M. Emmerson, A. Gonzalez, J. Hughes, P. Inchausti, J. Joshi, J. Norberg and O. Sala. 2002. A new look at the relationship between diversity and stability. Pages 79-91 in M. Loreau, S. Naeem and P. Inchausti (eds.), Biodiversity and ecosystem functioning. Oxford University Pres, Oxford, UK.
⇒ Malhi, Y., J.T. Roberts, R.A. Betts, T.J. Killeen, W.H. Li and C.A. Nobre. 2008. Climate change, deforestation, and the fate of the Amazon. Science 319: 169-172. ⇒ Naeem, S., I.J. Thompson, S.P. Lawler, J.H. Lawton and R.M. Woodfin. 1995.
Empirical evidence that declining species diversity may alter the performance of terrestrial ecosystems. Trans. Roy. Soc. Lond. B.: 347: 249-262.
17
⇒ Olesen, J.E., T.R. Carter, C.H. Az-Ambrona, S. Fronzek, T. Heidmann, T. Hickler, T. Holt, M. Quemeda, M. Ruiz-Ramos, G.H. Rubeak, F. Sau, B. Smith and M.T. Sykes. 2007. Uncertainties in projected impacts of climate change on European agriculture and terrestrial ecosystems. Climatic Change 81: 123-143.
⇒ Pradeep Kurukulasuriya and Robert Mendelsohn, AfJARE, Vol 2 No 1, 2008 Crop switching as a strategy for adapting to climate change
⇒ R Hassan and C Nhemachena AfJARE Vol 2 No 1, 2008 Determinants of African farmers’ strategies for adapting to climate change: Multinomialchoice analysis
⇒ S. Niggol Seo and R Mendelsohn, AfJARE Vol 2 No 1, 2008 Animal husbandry in Africa: Climate change impacts and adaptations
⇒ Scherer-Lorenzen, M., C. Körner and E.-D. Schulze (eds.). 2005. Forest diversity and function: temperate and boreal systems. Springer, Berlin.
⇒ Schmid, B., A. Hector, M.A. Huston, P.Inchausti, I. Nijs, P.W. Leadley and D. Tilman. 2002. The design and analysis of biodiversity experiments. Pages 61-77 in M. Loreau, S. Naeem and P. Inchausti (eds.), Biodiversity and ecosystem functioning. Oxford University Pres, Oxford, UK.
⇒ Stockholm Environment Institute, 2008 Climate change and adaptation in African agriculture
⇒ Tilman, D. 1996. Biodiversity: population vs. ecosystem stability. Ecology 77: 350-363.
⇒ Tilman, D. and C. Lehman. 2001. Biodiversity, composition, and ecosystem processes: theory and concepts. Pages 9-41 in A.P. Kinzig, S.W. Pacala and D. Tilman (eds.), The functional consequences of biodiversity: empirical progress and theoretical extensions. Princeton Univ. Press, Princeton, NJ, USA.
⇒ Tilman, D. and J.A. Downing. 1994. Biodiversity and stability in grasslands. Nature 367: 363-365.
⇒ Tilman, D., D. Wedin, and J. Knops. 1996. Productivity and sustainability influenced by biodiversity in grassland ecosystems. Nature 379: 718-720.
⇒ Tilman, D., J. Knops, D. Wedin and P. Reich. 2002. Plant diversity and composition: effects on productivity and nutrient dynamics of experimental grasslands. Pages 21-35 in M. Loreau, S. Naeem, and P. Inchausti (eds.), Biodiversity and ecosystem functioning. Oxford University Press, Oxford, UK.
⇒ UNEP (2008), “Africa: Atlas of Our Changing Environment.” Division of Early
18
⇒ UNFCCC, 2007 Climate change: impacts, vulnerabilities and adaptation in developing countries
⇒ Waide, R.B., M.R. Willig, C.F. Steiner, G. Mittlebach, L. Gough, S.I. Dodson, G.P. Juday, and R. Parmenter. 1999. The relationship between productivity and species richness. Ann. Rev. Ecol. Syst. 30: 257-300.
⇒ Walker, B. 1995. Conserving biological diversity through ecosystem resilience. Cons. Biol. 9: 747-752.
⇒ Walker, B.H. 1992. Biological diversity and ecological redundancy. Cons. Biol. 6: 18-23.
⇒ WWF International, 2006 Climate Change Impacts on East Africa A Review of the Scientific Literature
⇒ WWF International, 2007 Water for life: Lessons for climate change adaptation from better management of rivers for people and nature
20
C
HAPTER
1
The impact of selective logging on African tropical forests*
Abstract
Tropical deforestation for timber market is well known to have serious negative consequences on local biodiversity, terrestrial carbon sink and the balance of atmospheric greenhouse gases. In contrast, selective logging of tropical forests is often regarded as a management practice that has less dangerous effects on the ecosystem, even though researches are scanty in critically evaluating its impact on forest structure, biodiversity and ecosystem services. We compared field data that we collected in Africa (Cameroon, Gabon, Sierra Leone and Ghana) from 511 plots of tropical forest subject to different forest management practices (old-growth primary forests, selectively logged and secondary forests). Our findings suggest that the vertical structure and plant diversity of the logged forest are not largely different from those of a primary forest, while a remarkable difference in forest density, synthesized in some indicators, together with a concomitant invasion by vines, climbers and other weeds is pointed out. We show that the effects on species richness and biomass are greater than those expected from the simple removal of commercial species, implying that selective logging, unless it is practiced very carefully at very low harvest intensities, may significantly reduce the biomass density of a tropical forest for time scales spanning decades, and possibly longer, seriously diminishing the aboveground carbon storage and richness of the forest.
* Submitted to Proc. R. Soc. B. as “Gatti Cazzolla R; Castaldi S., Lindsell J. A., Coomes D. A,
Marchetti M., Maesano M., Di Paola A., Paparella F., Valentini R., The impact of selective logging on forest structure, tree diversity and above-ground biomass of African tropical forests”
21
Introduction
Tropical forests are key biomes for crucial ecosystem services. Such biomes attain the highest level of biodiversity among terrestrial ecosystems (1), protect hill slopes, strongly influence local climate and represent the most productive ecosystems on Earth, accounting for 59% of the global carbon pool in forests (2, 3). However, tropical forest areas are also characterized by very high rates of deforestation, conversion to agriculture, logging, and degradation by continuous withdrawal of wood by local population for subsistence (4).
In recent decades, many tropical countries have changed forest resource extraction management from clear cutting to selective logging (5, 6, 7), in response to the scientifically recognized role of deforestation activity in the increase of CO2 atmospheric concentration (8, 9) and following the concept that . the close relationship between biodiversity and productivity makes policies which support preservation of forest integrity a win-win approach for both carbon sequestration and biodiversity protection (10, 11, 12).
Selective logging is defined as the harvest of valuable timber trees above a threshold trunk diameter with methods designed to maintain the forest cover, including a significant understock of living biomass. Currently, selective logging is considered to be a “sustainable forest management” (SFM) practice and it is increasingly embraced as an approach to protect forest integrity while allowing an appropriate use of resources. Overall, there appears to be a consensus on viewing selective logging as causing only minor disturbance (13, 14, 15, 16), and thus acceptable within the requirements of certification schemes such as the Forest Stewardship Council (FSC), a highly regarded SFM standard established in 1993 and now included in REDD programs (17).
At the moment, there is not an extensive knowledge on the short and long-term effects of selective logging on carbon sequestration and biodiversity, as well as the trade-off between these two ecosystem variables as functions of the intensity of timber harvesting, despite its increasingly wide adoption.
Generally, available studies focus on specific and confined areas of South or Central America (18, 19, 20), or South-East Asia (21, 22), or Africa (23, 24, 25, 26, 27, 28), where the practice of selective logging is rapidly increasing (29).
In some cases, the intensity of the disturbance caused by selective logging was solely quantified in terms of diversity of the logged forest (30, 31, 32) with results that were encouraging for that practice. However, other studies show significant changes of species composition (33, 34, 35, 36) and genetic diversity (37), variations in forest structure (38, 39, 40) and nutrient cycling (41). Remote sensing techniques have been applied to quantify large-scale physical forest damage, extent of canopy openings (caused by logging operations and the
22
construction of access trails) and changes in the carbon stock (42) showing that selective logging definitely has non-negligible impacts.
An important aspect in evaluating forest damage is the assessing of the extension of canopy gaps by selective timber harvests. In tropical forests, canopy gaps have immediate impacts on light interception, heat fluxes, water stress and plant productivity (43). In computer simulations the rate of forest regeneration strongly depends on the size, the number and the spatial arrangement of canopy gaps following harvest (44). Recent studies also suggest that canopy openings decrease in size with distance from each felled tree crown, but in recently logged forest the area initially affected by harvesting of each tree is at least 50-100 m in radius (45). One of the main effects of canopy gaps discontinuities appears to be the creation of spaces readily invaded by weeds, vines and climbers at the expense of the late-successional state cenosis (46). Typically, fragmentation and selective logging opens up gaps of light in which weeds displace or suppress native species. Conversely, natural gaps (e.g. due to big broken branches or naturally died trees) are usually smaller than logging gaps, and tree saplings seems to be prepared to grow fast enough to fill the canopy opening (47, 48, 49, 50, 51). This reduces the likelihood of vines, weeds and climbers invasion (52). Here we argue that changes in native cenosis caused by the selective removal of the tallest trees induce a local variation of forest structure with relative consequences on biodiversity and carbon stocks.
To support our thesis we compare three different types of forest management (old-growth/untouched, clearcut and subject to selective logging) of tropical forests in Western and Central Africa looking for statistically significant differences. For this purpose we collected data of tree heights, diameter at breast height (d.b.h) and species composition from 33 forest plots, each one of 500 m2 located in Ghana, Gabon and Cameroon (which we call Dataset1), and we processed 478 additional plots with data of d.b.h. located in Sierra Leone (Dataset2). The data allow us to form 12 distinct indices (summarized in Table 2) on forest biomass, diversity, density, etc. that we examine in order to determine which of them show statistically significant differences among the forest types, and which do not.
Study sites
Our data were collected in four tropical forest countries, located in West and Central Africa: Ghana, Cameroon, Gabon and Sierra Leone. In West Africa forest plots were selected along the border between Ghana and Ivory Coast (Bia National Park and surrounding areas), and on the Ghana coast (Ankasa Forest Reserve). We also analysed data collected in the Gola Rainforest National Park (located in Sierra Leone close to the border with Liberia) within Kenema district. In Central Africa forest plots were selected within the Congo river basin, on
23
the border between Cameroon and Congo (Sangha Tri-National Forest) and in Gabon (Woleu-Ntem and Moyen-Ogooué regions).
The first sampling site in Ghana, Bia National Park, is part of a protected area of 306 km2, which includes 77.7 km2 of national park in the north, and 227.9 km2 of Resource Reserve (where logging is permitted) in the south. The area is located in the transition zone between the southern mixed evergreen forest and northern mixed semi-deciduous forest. The average annual precipitation ranges from 1500 mm to 1800 mm and the average monthly temperatures range between 24° and 28°C, with the rainy season during the months of May, June, September and October. More than 300 plant species per hectare can be observed; species from the Tieghemella, Ceiba, and Khaya genera are widespread.
The second sampling site in Ghana, Ankasa Conservation Area, is twin Wildlife Protected Area comprising Suhien National Park and the Ankasa Resource Reserve with the Nini-Sushien river forming the boundary between the two. Selective logging and clearcutting occurred in area surrounding the current boundaries of the protected areas. Its extension is about 500 km2 and it is situated in the Western Region of Ghana. Being the area with the highest rainfall in Ghana (1700-2000 mm per year), Ankasa is the richest forest of the country in terms of botanical diversity. About three hundred plant species have been recorded in a single hectare. Notable among the trees are Tieghemella heckelii, Ceiba pentandra and Khaya ivorensis. The vegetation of the two conservation areas is respectively wet evergreen and semi-deciduous evergreen. The southern parts of Ankasa were logged from the early 1960s up to about 1974. Logging intensity was, however, relatively low due to the small amounts of commercially valuable timber. Nini Sushien contains one of the few remaining blocks of relatively untouched forest in the country (53).
The first sampling area in Central Africa is bordered to the east by the Sangha River, an affluent of the Congo River, and it belongs to the surrounding areas of the Lobeké National Park. It is located in the East Region of Cameroon. The forest covers an area of 184,000 hectares with an altitude ranging between 300 m and 750 m above sea level. The area consists of semi-evergreen forests, with over 300 species of trees, the largest ones including Ceiba pentandra (L.) Gaertn, Terminalia superba Engl. & Diels and members of the family Sterculiaceae (Triplochiton, Pterygota). The average annual precipitation is 1400 mm, with the dry season occurring from December to February (54).
The second study site in Central Africa is located in North and Central Gabon in the Provinces of Woleu-Ntem and Moyen-Ogoouè. These forest areas of about 180,000 hectares have an equatorial climate, with year-round high temperatures and humidity. Rainfall varies from an annual average of 1750 to 3050 mm, with almost all of it falling between October and April. In
24
the period from May to September there is little, if any, rainfall, but humidity remains high. Temperature shows little seasonal variation, the daily average being about 27° C. The areas in the provinces surveyed for this study are moist and semi-evergreen forests.
In all of these study sites, the commercial tree species most commonly harvested are Enthandrophragma cylindricum, Terminalia superba, Triplochiton scleroxylon and Heritiera utilis. A typical selective logging scheme includes the harvest of trees with diameters bigger than 30–100 cm and logging cycles of 15–30 years. For example, in Central Africa the minimum diameter is 100 cm for Enthandrophragma cylindricum, 60 cm for Terminalia superba and 80 cm for Triplochiton scleroxylon and logging cycle is 15-30 years.
We also expand our study on data sampled from Lindsell and Klop (Lindsell, J. A., & Klop, E. 2013) in the Gola Rainforest National Park, the largest area of lowland evergreen rain forest remaining in Sierra Leone (54). The forest covers 71,000 hectares hilly terrain located at Sierra Leone's eastern border with the Republic of Liberia and it extends for. The forest used to be commercially exploited when was classified as a production forest and more than 20,000 hectares were logged. Logging in Gola started at least by 1961 but possibly earlier. Logging practice in the northern block was good in the 60s and 70s, but it may have been poor in the 80s. Most areas were only logged once and few had two harvests. Offtake was concentrated in accessible areas so impact was patchy. Logging in the western and eastern blocks was much more intensive. It lasted 1963 to 1965, then 1975 to 1989 and in the latter period was patchy, intensive and damaging (55).
Methods
Sampling Methods
In the following we shall distinguish between three kinds of sampling plots: “Primary Forest” (PF) which designates plots sampled in areas of old-growth forest for which we have documented evidence that they were left untouched for at least 300 years; “Secondary Forest” (SF), plots sampled in areas subject to clear cutting in the 1990s and, hence, left to recover for at least 20 years; “Selective Logging” (SL) to label plots sampled in areas, harvested in the 1990s (SL20) or in the 1980 (SL30). Cameroon also include a plot subject to two rounds of logging in the 1960s and 1990s (SLD), while two plots in Ankasa were clearcutted and then selectively logged after about 50 years (SFD). All plots have negligible slope and lie on plains or hilltops, with the exception of two primary forest plots (PFH) lying on hillsides (Table 1). To collect the data included in the Dataset1, we used a cartographic grid with rectangular cells of 500 m2 to define field plots (56) for each forest category (primary, secondary and selectively
25
logged) within each study area above described (57). The grid was overlaid on satellite maps of the study areas of the five countries. Rectangular plots of 500 m2 (20x25 m or 10x50m) were selected by random sampling method (adapted Whittaker sampling method, 58, 59) at a minimum buffer distance of 50 m from access roads and extant logging trails. This sampling design resulted in some plots being placed in forest affected by logging as well as in plots with not direct signs of cutting activities (stumps, roads, skid trails and gaps). Overall, including all three forest management types, we sampled a total of 33 distinct plots (Table 1).
Table 1. List of site characteristic with regard to location, vegetation type, climate and soil classification of the sampled tropical forest. All the study sites incorporates primary forests (PF, -H: hills) surrounded by managed forest: SL20, area subjected to selective logging 20 years ago; SL30 area subjected to selective logging 30 years ago; SL-WM area subjected to a well-managed practice of selective logging; SLD area subjected to a double turn of selective logging (1960s and 1990s); SF area subjected to clearcutting 20 years ago; SFD area clearcutted and then selectively logged after about 50 years.
Dataset 1 Dataset 2
Country Ghana Cameroon Gabon Sierra Leone
Location Bia National Park Ankasa Forest Reserve South-Est Region North and
Central Regions Gola National Park
N° Plots of primary forest (PF) 2 ( including 1 PFH) 4 2 3 ( including 1 PFH) 223 N° Plots in Selective logged forest (SL) 2 4 3 (including 1 SLD plot) 4 119 SL-WM, 136 SL N° Plots in secondary forest (SF) 1 4 ( including 2 SFD plots) 1 3 --
Vegetation type moist evergreen forest wet evergreen forest moist evergreen forest wet evergreen
forest wet evergreen forest Meters a.s.l. 85-104 70-130 120-400 410 154-400 Annual total rainfall (mm) 1650-2000 1850-2000 1500-1750 2000-2500 2000-2500
Average mean temp (°C) 23-25° 26-28° 23-25° 24-26° 24-28° Soil type Oxisol-alfisol Oxisol Oxisol-alfisol Oxisol Oxisol
26
Within these plots, corner coordinates were collected with a GPS/compass and positions of all trees having diameter not less than 5 cm were mapped. The diameter of each tree was measured at breast height, i.e. 1.37 m above ground (or 50 cm above buttresses if present). D.b.h. and height were measured using a laser hypsometer-dendrometer. The genus and species name was identified directly in field or using specimens in laboratory. Tree positions into the plot were recorded in gridded and geo-referenced worksheets, as well as weed/vines cover. We collected the available documentation reporting the number of felled tree in the areas of selectively logged forest, which range from 4 trees/ha to 38 trees/ha. Scaling these numbers down to the area of the plots, we estimate the number of felled trees per plot, on average, to be 1±0.6.
The plots from the Gola National Park (Dataset2) that we use in our analysis are a subset of 609 circular plots of 0.125 ha, sampled at 200 m intervals and arranged in 43 transects, surveyed by Lindsell and Klop (27) between October 2005 and May 2007. In each plot the diameter of all trees larger than 30 cm d.b.h. was measured, together with ancillary data such as the slope of the terrain, the distance from the nearest road or trail, etc (see ref. 27 for a full data description). We excluded the plots disturbed by rivers, swamps, trails, farming activities, and those where the slope was not measured. Based on field evidence and on the available records of logging offtake, we classified the remaining plots as “unlogged” (223 plots, assumed to be PF), “well-managed” (119 plots, SL-WM) and “logged” (136 plots, SL). This classification is based on historical records (60) and field observations. “Unlogged” areas were untouched by commercial operations and showed no indication of recent illegal activity. “Well-managed” and “logged” areas were distinguished according to the recorded performance of the relevant concessionaires (60) with “well-managed” areas having a largely intact canopy and “over-logged” areas having extensive canopy openings. Because of the different sampling methodologies, we analyse the data from Sierra Leone (Dataset2) separately from the others (Dataset1).
Data analysis
The biometric data (height and d.b.h.) were used for the calculation of aboveground biomass using the allometric equations of Chave et al., 2005 (61) and the Global Wood Density Database (62). The amount of carbon stored in the aboveground biomass was then estimated as the kilograms of biomass multiplied for a conversion factor of 0.47 (63).
We formed 12 indices for each plot, defined in Table 2. The first group of four indices contains the average tree height, diameter and biomass, and the height of the 80th percentile in each
27 Table 2. Definition of the 12 indices used to compare primary vs secondary and primary vs selectively logged
forest plots.
plot. The second group of four indices contains measures of density, that is the sum of height, diameter, biomass and number of individuals normalized by the area of the plot. The third group contains three indices of biodiversity (richness, entropy and evenness, 64) and a measure of the abundance of vines in each plot.
For each index, we compare the values scored by primary forest plots with those scored by secondary forest plots, and, separately, by selectively logged forest plots of the Dataset1. The null hypothesis, namely that the index shows no difference between PF and either SF or SL, is tested with a Mann-Whitney U test, which is appropriate because it works also if the distribution of data is non-normal or unknown and it is applicable to samples of small size.
28
From the value of the statistics U we compute, using Harding's algorithm (65), the probability P of the null hypothesis, namely that the two samples are drawn from the same distribution. We report the value of P any time that it is lower than 0.05.
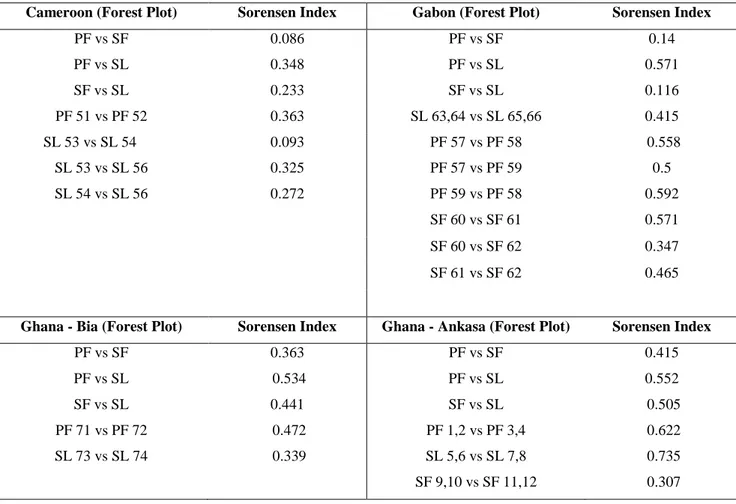
We complete the analysis of Dataset 1 by computing the Sørensen index to estimate the beta-diversity among primary forest plots and between primary and selective/secondary forests plots (65).
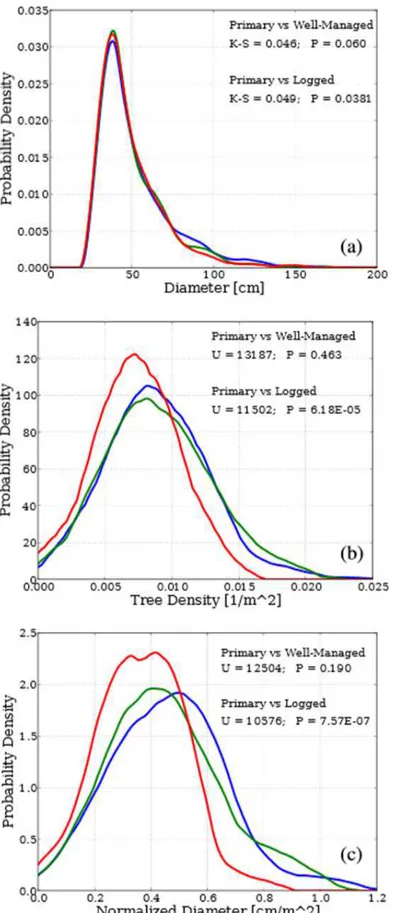
For the Sierra Leone plots (Dataset2) the tree height was derived from the diameter data by allometry. Therefore, height and biomass data are merely a function of diameter data, and we do not include them in our analysis. On the other hand, the abundance of plots, all from the same location, allows us to study the entire distribution of tree diameters (for trees larger than 30 cm dbh), rather than just plot-by-plot averages (or percentiles). For this purpose we form three large samples of diameter data by grouping together the diameter measurements from all the unlogged, all the well-managed and all the logged forest plots. We then perform two pairwise comparisons between the 'unlogged' and 'well-managed' samples, and between the 'unlogged' and 'logged' samples by means of a two-sides, two-sample Kolmogorov-Smirnov test. In addition we use a kernel density estimation (based on the Epanechnikov kernel, using Silverman's rule for bandwidth selection) 66 in order to plot a reliable estimate of the diameter data probability density function (pdf).
Then we use two indices of the second group (measures of density), namely the tree density and the normalized diameter. In this case we have to revert to a plot-by-plot analysis, because we need the plot's area to compute the densities. Following ref. 27, in order to properly weight the contribution of plots on sloping grounds, we use the vertical projection of the surface area, namely
where = 0.125 ha is the (constant) surface area of the plot, and φ is the slope of the ground as measured in-situ with a clinometer. We then compare the three groups pairwise, as for the 33 plots discussed above, using the Mann-Whitney U test. Note that the actual values of these two indices are not directly comparable with those of the same indices of the 33 plots from the Dataset1, because in the former case the samples include all trees above 5 cm dbh, while in Sierra Leone only the trees above 30 cm dbh were measured and, overall, the sampling protocols are quite different (see section "Sampling Methods").
29
Results
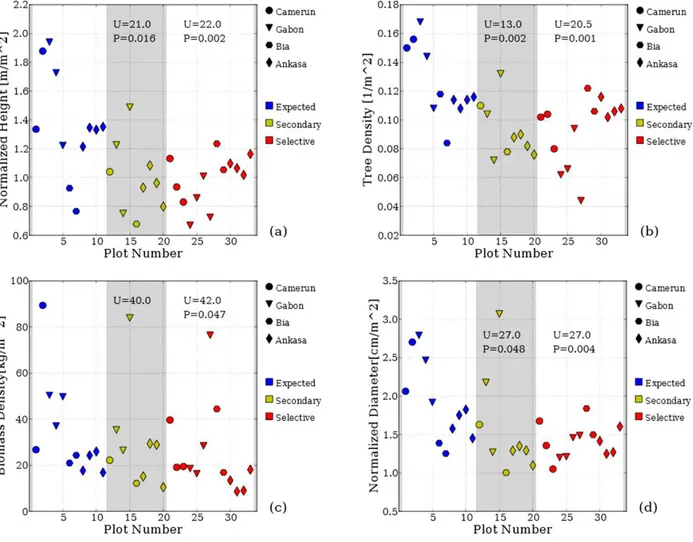
Figure 1 shows the first group of indices, namely the average values of tree height, diameter, biomass and the 80th percentile of height, for each plot. It is quite evident that these indices do not show striking differences between plots of primary forest and plots of either secondary or selectively cut forest. Although visually the values of selectively logged forest (red symbols) appear to be generally lower than those of primary forests (blue symbols), the probability of the null hypothesis is not as low as to allow for its outright dismissal, except possibly in the case of the mean biomass. In addition, we must observe that one selectively logged plot in
Figure 1. Indices characterizing the distribution of tree height, biomass and diameter in each plot. A) Mean tree height, B) Height of the 80th percentile, C) Mean biomass D) Mean diameter. The abscissa shows a serial number attributed to each plot (which is held the same in all the figures). The marker shape identifies the geographical location of the plot (circles: Cameroon; triangles: Gabon; hexagons: Ghana – Bia; diamonds: Ghana – Ankasa). Plots from Cameroon and Gabon are clumped together in Table 3 as “Central Africa”, Bia and Ankasa as “West Africa”. The marker color identifies the type of forest management (blue: primary, yellow: secondary, red: selectively cut). We show the values of the Mann-Whitney U statistics, above the yellow symbols when comparing primary vs selectively cut forest plots. If the probability P of the null hypothesis is lower than 0.05 we report it under the value of U.
30
Gabon scores the highest value in all these four indices, reflecting the fact that selective logging does not always remove all the big trees in a given area.
Figure 2 shows the four density indices, namely the sum of the height, biomass, diameter of each tree, and the number of trees in each plot, divided by the area of the plot. The Mann-Whitney U tests let us conclude, with a very high confidence, that all four densities are systematically higher in primary forests. Therefore, these indices are sensitive to differences between primary forests and the other two types of forest.
The difference in response between the first and the second group of indices may be further illustrated by looking at Figures 3 and 4, which show a representative examples of the vertical profiles and the canopy covers of the trees in two plots of lowland primary forest and two plots of selectively logged forest of Cameroon and Ghana. Even when one compares a primary forest plot containing a few big, tall trees with a selectively logged forest deprived of tall trees, the averages are in both cases dominated by medium and low height trees, that by far
Figure 2. Indices of forest density in each plot. A) Normalized height, B) Tree density, C) Normalized biomass, D) normalized diameter. Symbols, colours and legends as in Figure 1.
31
outnumber tall trees even in primary forest plots. On the other hand, the visually evident difference between the two types of forest management is the sparseness and lower number of the trees in selectively logged plots compared with the denser, thicker and more uniform spatial tree distribution in primary forest plots.
Figure 3. A comparison between vertical profiles (upper) and canopy view (bottom) of two plots of 50 m x 10 m achieved in Cameroon. a) primary forest (PFP); b) Forest subject to selective logging 30 years ago (SL30).
Figure 4. A comparison between vertical profiles (upper) and canopy view (bottom) of two plots of 50 m x 10 m achieved in Ghana.a) primary forest (PFP); b) Forest subject to selective logging 30 years ago (SL30).
Figure 5 shows the diversity and vines coverage indices. In all cases, with the sole exception of a plot of secondary forest in Cameroon, entropy and evenness of the plots have very high values, signalling that most of the species appear only once in each plot, regardless of the forest management type. Evenness is unable to distinguish between primary and the other two forest types, and entropy does so with a relatively low statistical confidence. This result is consistent with previous studies that did not record large losses of diversity in selectively logged forests (32). Not surprisingly, the species richness is instead significantly lower in plots
32 Figure 5. Indices of diversity and vine coverage. A) Species richness, B) Shannon’s entropy, C) evenness, D) Vines cover fraction. Symbols, colors and legend as in Figure 3.
of secondary and selectively logged forest than in plots of primary forest: this is the expected consequence of the fact that the number of individuals per plot is less in selectively logged than in primary forests (Figure 4b), and that most species are represented by just one individual. Finally, the fraction of plot surface covered by vines is the index that most reliably singles out the primary forest plots from the other two types: in each primary forest plot the vine coverage is less (usually by a factor larger than ten) than in all non-primary forest plots.
In order to exclude that the test results are affected by geographic inhomogeneities, we have applied the Mann-Whitney test grouping together only the plots from West Africa and, separately, only the plots from Central Africa. The results are reported in Table 3. The reduced size of samples raises the P-values associated to the computed U-values, and makes it difficult to reject the null hypothesis with very high confidence even when the value of U is near zero. However, the general pattern appears to be unaffected by the geographic location, namely that the first four indices, together with entropy and evenness are not particularly skilled in distinguishing plots of primary forest from the other two forest types, and that the density