~ 0 ~
Dipartimento di Ecologia e Biologia
Dottorato di Ricerca in Genetica e Biologia Cellulare
Ciclo XXVIII
Settore scientifico-disciplinare BIO/11
Study of a novel NF-Y/miRNAs network in colon
cancer
Candidata: Dott.ssa Emmanuela Falcone
Coordinatore Dottorato:
Relatore:
Prof. Giorgio Prantera
Dott.ssa Aymone Gurtner
~ 1 ~
TABLE OF CONTENTS
1 ABSTRACT p3
2 INTRODUCTION p6
2.1 MicroRNAs p6
2.2 miRNAs as cancer classifier p6
2.3 miRNAs as oncogenes or tumour suppressor p7
2.4 MicroRNA biogenesis p8
2.5 The miRNA-200 family p9
2.6 miRNA-200 and cell invasion p12
2.7 MiRNAs and transcriptional factors p12
2.8 The transcriptional factor NF-Y p14
3 RESULTS p17
3.1 The NF-Y-binding sequence, CCAAT, is highly represented
on human miRNA promoters deregulated on CRC p17
3.2 NF-Y binds in vivo miRNA’s promoters p19
3.3 NF-Y positively regulates miRNA-200 family at transcriptional level p22
3.4 NF-Y regulates cell invasion p27
4 CONCLUSIONS AND DISCUSSION p33
5 MATERIALS AND METHODS p35
5.1 Cell lines and cell culture p35
5.2 Transient and stable transfection p35
5.3 Chromatin Immunoprecipitations (ChIP) p35
5.4 Western blotting p36
5.5 RNA extraction, cDNA synthesis and RT-qPCR. p36
5.6 Luciferse reporter gene assay p37
5.7 Chemoinvasion assay p37 5.8 Zymograph assay p37 6 REFERENCES p39 Figure 1 p9 Figure 2 p11 Figure 3 p11 Figure 4 p14 Figure 5 p16
~ 2 ~
Figure 6 p21 Figure 7 p21 Figure 8 p23 Figure 9 p24 Figure 10 p25 Figure 11 p25 Figure 12 p26 Figure 13 p29 Figure 14 p30 Figure 15 p31 Figure 16 p32 Table1 p17 Table2 p20 7 RELATED PUBLICATION p52~ 3 ~
1. ABSTARCT
During my PhD in “Genetica e Biologia Cellulare” at University of Tuscia (Viterbo), performed at National Cancer Institute “Regina Elena” in Rome, in Dr. Giulia Piaggio’s group and under the supervision of Dr. Aymone Gurtner, I focused my research activity on the molecular mechanisms by which the transcription factor NF-Y regulates miRNA expression in colon cancer.
Colorectal cancer (CRC) is one of the major leading causes of cancer-related death. CRC development and progression involves mutational events in oncogenes and tumor suppressor genes often accompanied by deregulated gene expression (Schoen et al. 2012).
MiRNAs are small non coding single-stranded RNAs of about 20–25 nucleotides in length that regulate gene expression by binding to complementary target mRNAs and promoting their decay or inhibiting their translation (Ha and Kim 2014, Krol et al. 2010). More than 1800 human miRNA loci and an even greater number of predicted miRNA targets have been identified in the human genome. Thus, miRNAs are potent regulators of gene expression involved in diverse physiological processes, such as normal development, differentiation, growth control, apoptosis, and in human diseases, particularly in cancer where they act as regulators of key cancer-related pathways (Lynam-Lennon et al. 2009, Lujambio and Lowe 2012).
Deregulation of miRNAs expression has been found in various cancer types among which CRC (Fabbri et al. 2007, Lujambio and Lowe et al. 2012), thus, miRNAs may be potential targets for cancer therapy. However, the mechanisms through which miRNAs are regulated in cancer remain unclear. Therefore, the identification of transcriptional factor–miRNA crosstalk is one of the most update aspects of the study of miRNAs regulation (Schanen and Li 2011). NF-Y is an ubiquitous heterotrimeric transcription factor with a high binding affinity for the CCAAT consensus motif that is one of the most common cis-acting elements found in the promoter and enhancer regions of protein coding genes in eukaryotes. Growing number of experiments in cells support the notion that NF-Y complex is a key player in the regulation of proliferation and viability (Gurtner et al. 2010, Gurtner et al. 2008, Gurtner et al. 2003, Imbriano et al. 2005). Analysis of transcriptome profiles during cellular transformation identified the CCAAT box as over-represented in promoters of genes overexpressed in diverse types of cancers, breast, colon, thyroid, prostate and leukemia (Yamanaka et al. 2009). This strongly indicates the involvement of NF-Y in cancer-associated pathways. Interestingly, computational studies indicate that a number of known transcriptional factors, among which NF-Y, could be responsible for the
~ 4 ~
aberrant regulation of human pre-miRNA sequences in cancer and other diseases (Lee et al. 2007, Goodarzi et al. 2009). However, no experimental data on miRNA regulation by the transcription factor NF-Y are available until now. Indeed we addressed whether NF-Y regulates at transcriptional level miRNAs deregulated in CRC, and also we study the biological implications of the identified NF-Y-miRNAs crosstalk .
- In paper I (Falcone et al. 2016), we developed a software, named infinity, able to find the presence of transcriptional factor-binding DNA matrices, in 60Kb upstream 980 human pre-miRNA, simultaneously. Using this software we found that the CCAAT sequences, bound by NF-Y, are overrepresented on ~60% of 118 human miRNA deregulated in CRC in a minimal promoter region between -1 kb to + 0,5kb with respect the transcription start site (TSS). Of note, some of these miRNAs, such as miR181a, -181b, -21, -17, -18a, -20a, -19b, -92a, -301b, -130b, -200a, -200b, -200c, -141, -429, display key roles on cell proliferation, viability and cell migration on colon cancer (Woods et al. 2007, Dong et al. 2014, Lin et al. 2014, Pichler et al. 2014, Sun et al. 2015). The power of our software has been validated in vivo by performing chromatin immunoprecipitation assays (ChIP) and loss of function experiments on the above mentioned group of miRNAs on SW480 colon cancer cell line. Our results revealed, for the first time, that NF-Y, through its CCAAT binding activity, regulates the expression of miRNAs deregulated in colon cancer cells.
- Paper II (Falcone et al. in preparation). MiRNA-200 family, found deregulated in CRC and presenting the CCAAT boxes near the TSS, are potent inhibitors of migration, invasion and metastasis (Humphries and Yang C 2015). Indeed we asked whether NF-Y, regulating their expression at transcriptional level, impacts on colon cancer cell invasion. Firstly, we have demonstrated, by ChIP, Luciferase assay, loss of function experiments on several colon cancer lines, that NF-Y regulates at transcriptional levels the miRNA-200 family members. Furthermore, considering the miRNA-200 family’s role in cancer development and progression, we have studied the NF-Y implication in cell invasion. To this hand we have demonstrated that the invasion activity of human colon adenocarcinoma cell lines, is reduced after NF-Y overexpression while is increased after NF-Y depletion. Moreover the expression levels and activity of the matrix metalloproteinase MMP-2, a cancer-associated secreted zinc-dependent endopeptidases, is increased upon NF-Y depletion. Collectively our data demonstrated
~ 5 ~
that NF-Y positively regulates a transcriptional level the miRNA-200 family, and consequently inhibits cellular invasion of colon cancer cells.
List of related publications and manuscript during three years of Ph.D.
1) Infinity: an in-silico tool for genome-wide prediction of specific DNA matrices in miRNA genomic loci. Falcone E, Grandoni L, Garibaldi F,Manni I, Filligoi G, Piaggio Gand Gurtner A. PlosOne 2016 (accepted).
2) Study of a novel NF-Y/miRNAs network in colon cancer. Falcone E, Garibaldi F, Gurtner A and Piaggio G (paper in preparation)
List of not related publications during three years of Ph.D.
1) Mutant p53 inhibits miRNA biogenesis by interfering with the microprocessor complex.Garibaldi F, Falcone E, Trisciuoglio D, Colombo T, Lisek K, Walerych D, Del Sal G, Paci P, Bossi G, Piaggio G, Gurtner A. Oncogene. 2016 Mar 21. doi: 10.1038/onc.2016.51.
2) Dysregulation of microRNA biogenesis in cancer: the impact of mutant p53 on Drosha complex activity. Gurtner A, Falcone E, Garibaldi F, Piaggio G. J ExpClinCancer Res. 2016 Mar 12;35(1):45. doi: 10.1186/s13046-016-0319-x.
3) Combining optimization and machine learning techniques for genome-wide prediction of human cell cycle-regulated genes. De Santis M, Rinaldi F, Falcone E, Lucidi S, Piaggio G, Gurtner A, Farina L. Bioinformatics. 2014 Jan 15;30(2):228-33. doi: 10.1093/bioinformatics/btt671.
~ 6 ~
2. INTRODUCTION 2.1 MicroRNAs.
The discovery of microRNAs (miRNAs) almost two decades ago established a new paradigm of gene regulation. During the past ten years these small non-coding RNAs have been linked to all known physiological and pathological processes, including cancer, in which they can function as a group to mark differentiation states or individually as bona fide oncogenes or tumour suppressors (Lujambio and Lowe 2012).
miRNAs are small non coding single-stranded RNAs of about 20–25 nucleotides in length that regulate gene expression by binding to complementary target mRNAs and promoting their decay or inhibiting their translation (Ha and Kim 2014, Krol et al. 2010, Winter et al. 2009). The control of gene expression by miRNAs is a process seen in virtually all cancer cells. These cells show alterations in their miRNA expression profiles, and emerging data indicate that these patterns could be useful in improving the classification of cancers and predicting their behavior. In addition, miRNAs have now been shown to behave as cancer ‘drivers’ in the same way as protein-coding genes whose alterations actively and profoundly contribute to malignant transformation and cancer progression. Owing to the capacity of miRNAs to modulate tens to hundreds of target genes, they are emerging as important factors in the control of the ‘hallmarks’ of cancer (Hanahan and Weinberg 2011).
2.2 miRNAs as cancer classifiers.
Aberrant miRNA levels reflect the physiological state of cancer cells and can be detected by miRNA expression profiling and harnessed for the purpose of diagnosis and prognosis (Yanaihara et al. 2006, Calin et al.2005). In fact, miRNA profiling can be more accurate at classifying tumours than mRNA profiling because miRNA expression correlates closely with tumour origin and stage, and can be used to classify poorly differentiated tumours that are difficult to identify using a standard histological approach (Lu et al. 2005, Rosenfeld et al. 2008). The special features of miRNAs make them potentially useful for detection in clinical specimens. For example, miRNAs are relatively resistant to ribonuclease degradation, and they can be easily extracted from small biopsies, frozen samples and even formalin-fixed, paraffin-embedded tissues (Xi et al. 2007). Furthermore, relatively simple and reproducible assays have been developed to detect the abundance of individual miRNAs, and methods that combine small RNA isolation, PCR and next-generation sequencing, allow accurate and quantitative assessment of all the miRNAs that are expressed in a patient specimen, including material that
~ 7 ~
has been isolated by laser capture microdissection. The detection of global miRNA expression patterns for the diagnosis of cancers has not yet been proved; however, some individual or small groups of miRNAs have shown promise. For example, in non-small cell lung cancer, the combination of high miR-155 and low let-7 expression correlates with a poor prognosis, and in chronic lymphocytic leukaemia a 13 miRNA signature is associated with disease progression (Lujambio and Lowe 2012, Yanaihara et al. 2006, Calin et al. 2005). Further advances in the technology of miRNA profiling could help to revolutionize molecular pathology. Perhaps the most appealing application of miRNAs as a cancer diagnostic tool comes from the discovery of circulating miRNAs in serum. For example, miR-141 expression levels in serum were significantly higher in patients with prostate cancer than in healthy control individuals (Mitchell et al. 2008). Although the analysis of circulating miRNAs is only just beginning, the successful advancement of this technology could provide a relatively non-invasive diagnostic tool for single-point or longitudinal studies. With such diagnostic tools in place, miRNA profiling could be used to guide cancer classification, facilitate treatment decisions, monitor treatment efficacy and predict clinical outcome.
2.3 miRNAs as oncogenes or tumour suppressor.
In the same way as protein-coding genes, miRNAs can be oncogenes or tumour suppressors depending on the cellular context in which they are expressed, which means that defining their precise contribution to cancer can be a challenge. Since mRNAs targeted by miRNAs can be tissue-specific, the miRNA dysregulation could lead to a completely different output depending of the tissue contest. For example, the miR-29 family has a tumour-suppressive effect in lung tumours but appears oncogenic in breast cancer because of its ability to target the DNA methyltransferases DNMT3A and DNMT3B, and ZFP36, respectively (Fabbri et al. 2007, Gebeshuber et al. 2009).
To further complicate the process, some miRNAs repress several positive components of a pathway, whereas others target both positive and negative regulators, possibly to buffer against minor physiological variations that could trigger much larger changes in the cell physiology (Small and Olson 2011). In cancer cells, this buffering role can mean that some miRNAs could simultaneously target oncogenes and tumour-suppressor genes. In addition, combinations of miRNAs can cooperate to regulate one or several pathways, which increase the flexibility of regulation but confound experimentalists (Bueno et al. 2011). Consequently, the way in which miRNAs contribute to cancer development is conceptually similar to cancer-associated transcription factors such as MYC and p53, which are mediated through many targets that
~ 8 ~
depend on contextual factors that are influenced by cell type and micro-environment. From a practical perspective it is crucial that miRNA targets are studied in a context that is appropriate to the environment that is being studied to determine what impact they will have on tumour cell behavior (Lujambio and Lowe 2012).
2.4 MicroRNA biogenesis.
The expression level of biologically active mature miRNAs is the result of a fine mechanism of biogenesis, carried out by different enzymatic complexes that exert their function at transcriptional and post-transcriptional levels.
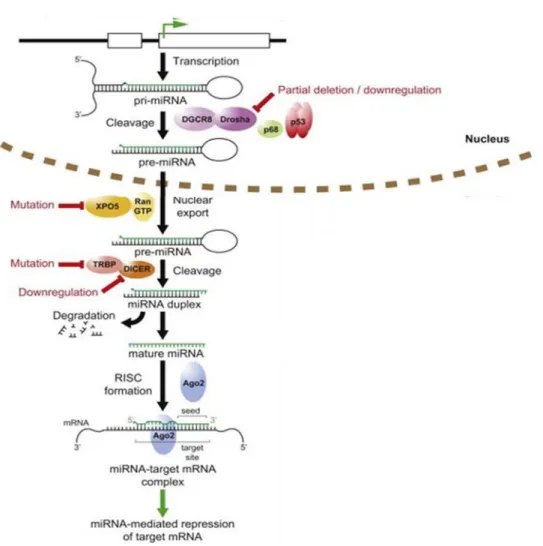
MiRNAs sequences are distributed all throughout the genome, being localized in exonic or intronic regions, as well as intergenic locations (Altuvia et al. 2005). The biogenesis of miRNAs starts with their transcription by RNA polymerase II (Lee et al. 2004) although some other miRNAs are transcribed by RNA polymerase III (Borchert 2006) resulting in a primary transcript known as pri-miRNA which contains a 33 nucleotides hairpin stem, a terminal loop and a flanking single stranded sequence of hundreds of bases or even several kilobases. In general, pri-miRNAs are capped at the 5´end and polyadenylated at the 3´ end. The canonical miRNA biogenesis pathway is characterized by two subsequent central steps utilizing ribonuclease reactions (Figure 1). In the nucleus, pri-miRNAs are recognized and cropped into hairpin-structured precursor miRNAs (pre-miRNAs) by the Drosha complex (also known as Microprocessor complex). Drosha, an RNase III enzyme, and DGCR8 (DiGeorge critical region 8), a double-strandedRNA-binding domain (dsRBD) protein, are two essential components of the Microprocessor complex. Drosha liberates the stem-loop pre-miRNAs from pri-miRNAs in cooperation with DGCR8-mediatedrecognition of the junctional region between the single-stranded and double-stranded portions of pri-miRNAs (Lee et al. 2003, Han et al. 2006). The pre-miRNAs of approximately 70 nucleotides in length are transported from the nucleus to the cytoplasm by Exportin-5 (XPO5) together with Ran-GTP (Zeng et al. 2004). Exportin-5 can also protect pre-miRNAs against nuclear degradation (Chendrimada et al. 2005). In the cytoplasm, Dicer, another RNase III, digests the pre-miRNAinto a 20-25 nucleotides mature duplex miRNA. During this process, Dicer is associated with other proteins like TAR RNA binding protein (TRBP) and kinase R–activating protein (PACT) to increase its stability and its processing activity (Lee et al. 2006, Chiang et al. 2010). The miRNA duplex is comprised of two miRNA strands, with one strand loaded onto the RNA-induced silencing complex (RISC), which contains the Argonaute (Ago) family protein as a core component. In
~ 9 ~
these processes, another strand (miRNA* strand) is usually degraded, while miRNA* strands are retained and function in some cases (Bartel 2009).
Mature miRNAs serve as guides directing RISC to target mRNAs, which are degraded, destabilized or translationally inhibited by the Ago proteins (Jansson and Lund 2012).
Figure 1. Schematic representation of miRNA biogenesis (Xiao et al. 2008). Simplified
canonical pathway of miRNA biogenesis and processing. Steps commonly deregulated in cancer indicated in red.
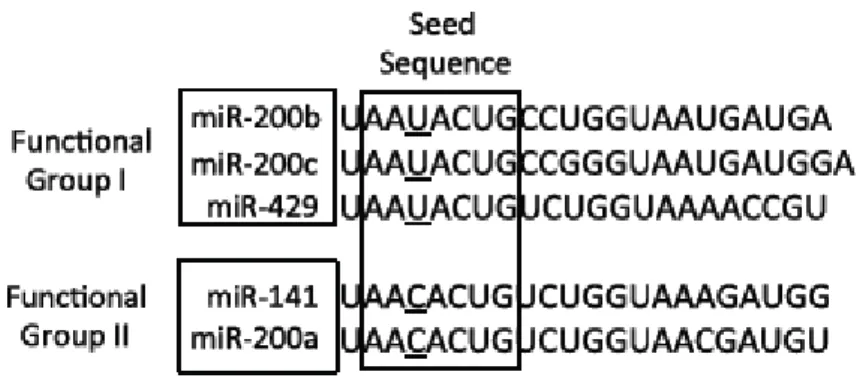
2.5 The miRNA-200 family.
Between the miRNAs dysregulated in tumours there is the 200 family. The miRNA-200 family consists of five members, which form two clusters located in two different genomic regions. As shown in Figure 2 the Cluster I miRNA200s in humans contains miRNA200b, -200a, and -429 (miRNA-200b-200a-429) located in an intergenic region of chromosome 1, and cluster II miRNA-200s contains miRNA- 200c and -141 (miRNA-200c-141) located on chromosome 12 (Altuvia et al.2005, Michaelet al. 2003). Alternatively, the miRNA-200 family
~ 10 ~
members can also be divided into two functional groups based upon the similarities of their seed sequences (Figure 3). MiRNA- 200b, -200c, and -429 (Functional Group I) all share the same seed sequence and miRNA-200a and -141 (Functional Group II) both share the same seed sequence, with the two functional groups only differing in the seed sequence by one nucleotide (AAUACUG for miRNA-200b-200c-429 and AACACUG for miRNA-200a-141). The miRNA-200 family is highly conserved among vertebrate species and highly expressed within epithelial cells. The expression of the miRNA-200 family can be regulated through interactions with, and modifications of their promoters. Recent studies suggest that modifications to the promoter regions of each of the miRNA-200 clusters can cause the loss of the expression of the miRNA-200 family in cancer. The promoter region of the miRNA- 200c-141 cluster has been shown to be hypermethylated (Neves et al. 2010, Castilla et al. 2012), whereas the miRNA-200b-200a-429 cluster has been shown to be silenced primarily through polycomb group-mediated histone modifications (Limet al. 2013) in cancer. Alternatively, the promoter regions of the miRNA-200 family can be bound by the transcription factors zinc finger e-box bind homeobox 1 (ZEB1) and 2 (ZEB2 also known as SIP1), specificity protein 1 (Sp1), and p53. When bound, ZEB1 and ZEB2 can inhibit the transcription of the entire miRNA-200 family, while Sp1 and p53 binding has been shown to lead to activation of transcription of the miRNA-200b-200a-429 (Kolesnikoff et al. 2014, Kim, et al. 2011) and the miRNA-200c-141 (Kim et al. 2011, Chang et al. 2011) clusters, respectively. However, Kolesnikoff and colleagues also showed that Sp1-mediated activation of miRNA-200b-200a-429 transcription can be disrupted by the expression and interaction of ZEB1/2 with its binding sites within the promoter. The miRNA-200 family is among the most widely studied miRNAs in cancer, this miRNAs have different role in EMT (Epithelial–Mesenchymal-Transition), cancer initiation, metastasis, diagnosis and treatment.
~ 11 ~
Figure 2: The Genomic location of the miR-200 family. The miR-200 family is located on
two distinct clusters: Cluster I on chromosome 1(miRNA-200b,- 200a, and -429) and Cluster II on chromosome 12 (miRNA-200c, and -141).
Figure 3: The sequences of mature miRNA-200 family members. The miRNA-200 family
members can also be separated into two functional groups based upon their seed sequences. Functional Group I is composed of miRNA-200b, -200c, and -429 and Functional Group II consists of miRNA-141 and -200a. The seed sequences of these two functional groups only differens by one nucleotide : AAUACUG for group I and AACACUG for group II.
~ 12 ~
2.6 miRNA-200 and cell invasion.
Local invasion can be considered an initial and essential step in the malignancy of carcinomas, leading to the generation of usually fatal distant metastasis. Metastasis is the primary cause of death in cancer patients (Hanahan and Weinberg 2000). Tumour invasion appears to be controlled by a coordinated series of cellular and molecular processes that enable tumour cells to dissociate and migrate from the primary tumour. In particular cell invasion is the collective outcome of a number of processes dependent on extensive cytoskeletal rearrangements and assembly of actin bundles, including the assembly of invadopodia. These are actin-rich membrane protrusions specialized for the delivery of proteases that degrade the extracellular matrix at specific sites (Sibony-Benyamini and Gil-Henn 2012) to facilitate movement through the matrix.
In a recent work, Bracken and colleagues have found that the miRNA-200 family members interacting with different targets which regulate the actin cytoskeleton dynamics (Bracken et al. 2014).Their data indicate that miRNA-200 family imposes coordinated control of functional networks that are central to cell shape and motility, and of crucial importance in cancer cell invasion and metastasis. They demonstrate that miRNA-200 family suppresses cell invasion and inhibits the formation of invadopodia. Invadopodia can be identified by the colocalization in dense puncta of actin with cortactin and Tks5, two proteins essential for initiation of invadopodia formation, (Courtneidge et al. 2005, Bowden et al. 2006). Sites of invadopodial activity can also be identified by monitoring the local pericellular degradation of gelatin matrix onto which the cells have been plated (Grass et al. 2012). Moreover, in the same work, Bracken and collaborators found that miRNA-200 reduces invadopodia formation and identified several miRNA-200 targets with a key rolein invadopodia formation, including WIPF1, MPRIP, and Abl2, which significantly inhibited invasion when knocked down, as well as cofilin2 (CFL2), moesin (MSN), and LGR4 which have been been previously demonstrated to be positively involved in promoting invasion or metastasis (Ono et al. 2008, Estecha et al. 2009, He et al. 2010, Haynes et al. 2011, Garcia et al. 2012, Gil-Henn et al. 2012, Erkutlu et al. 2013).
2.7 MiRNAs and transcriptional factors.
The regulation of gene expression is a critical mechanism in the control of biological processes in cellular organisms. At the transcriptional level, the main regulators contributing to the control are transcription factors (TFs), proteins that bind to cis-regulatory elements in the gene promoter regions (Vaquerizas et al. 2009). By activating or repressing their target genes, TFs can regulate the global gene expression program of a living cell, and form transcriptional
~ 13 ~
regulatory networks (Shen-Orr et al. 2002, Lee et al. 2002, Yu et al. 2006). Several studies have identified that miRNAs regulate a wide range of biological processes in proliferation (Chen et al. 2006, Zhao et al. 2005), metabolism (Poy et al. 2004, Xu et al. 2003), differentiation (Esquela-Kerscher and Slack 2006), development (Jin et al. 2004, Zhao et al. 2007), apoptosis (Xu et al. 2007, Xu et al. 2004, Xu et al. 2003), cellular signaling (Cui et al. 2006) and even cancer development and progression (Kim and Nam 2006, Flynt and Lai 2008). In recent years, many researchers have attempted to understand how miRNAs act to regulate target genes and what their roles are in various diseases. However, the study of miRNA regulation by TFs (TF– miRNA regulation) has been relatively limited.
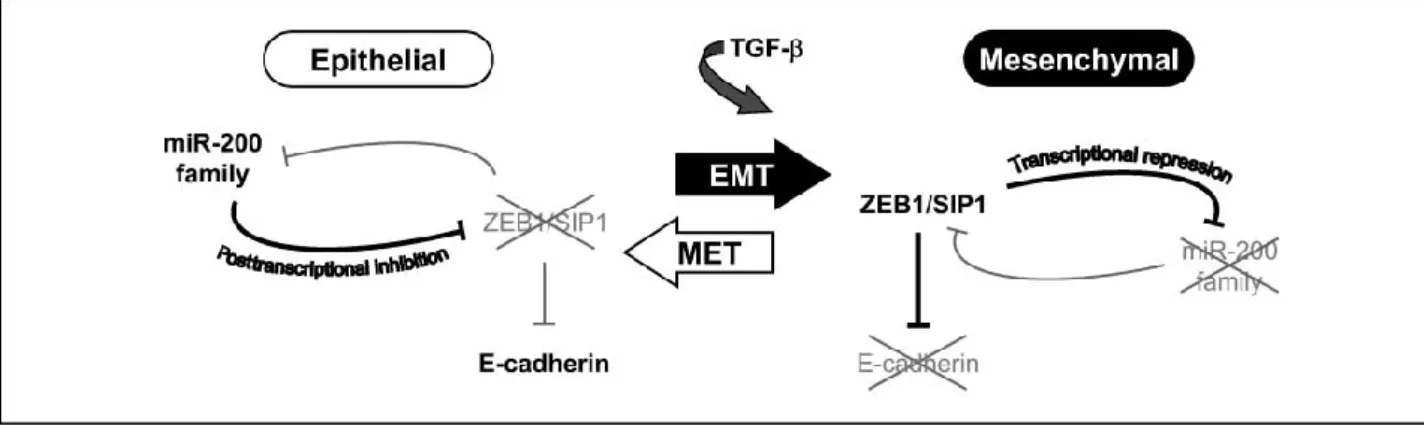
It has been reported that miRNAs and TFs may cooperate to tune gene expression (Cui et al. 2007). In addition, miRNAs and TFs can form feedback or feedforward loops, which play critical roles in various biological processes. For example, Yamakuchi and Lowenstein (Yamakuchi and Lowenstein 2009) reported a feedback loop in which p53 induces expression of miRNA-34a, which in turn suppresses the expression of SIRT1 and thus increases p53 activity. Bracken and colleagues have proposed a model for a double negative feedback loop between ZEB1-SIP1 and the miRNA-200b-200a-429 cluster: in epithelial cells, a stable state is maintained by high levels of miRNA-200, which inhibits ZEB1/SIP1 and, hence, increases the expression of ZEB-repressed epithelial genes such as E-cadherin. The switch to a mesenchymal state (EMT) can be induced by TGF-β, which increases ZEB1-SIP1 levels. This in turn instigates and maintains a mesenchymal state through ZEB1-SIP1 binding to ZEB-type E-boxes within the miRNA-200b-200a-429 promoter and repressing miRNA-200 transcription. Together, this system forms a double-negative feedback loop (Figure 4), maintaining stable cellular states depending upon the relative levels of ZEB1-SIP1 and miRNA-200 (Bracken et al. 2008).
Increasing evidence suggests that aberrant regulation of miRNAs by TFs can cause diseases (Mraz et al. 2009, Ryan et al. 2010). Therefore, TF–miRNA regulation is one of the most important aspects of the study of both miRNAs and TFs and is attracting the interest of increasing numbers of researchers.
~ 14 ~
Figure 4. Model for a double-negative feedback loop between ZEB1-SIP1 and the miRNA-200 family regulates epithelial-mesenchymal transition (Bracken et al. miRNA-2008). In epithelial
cells, a stable state is maintained by high levels of miR-200, which inhibits ZEB1/SIP1 and, hence, increases the expression of ZEB-repressed epithelial genes such as E-cadherin. The switch to a mesenchymal state (EMT) can be induced by TGF-h, which increases ZEB1-SIP1 levels. This in turn instigates and maintains a mesenchymal state through ZEB1-SIP1 binding to ZEB-type E-boxes within the miR-200b-200a-429 promoter and repressing miRNA-200 transcription. Together, this system forms a double-negative feedback loop, maintaining stable cellular states depending upon the relative levels of ZEB1-SIP1 and miRNA-200, yet retaining the ability to switch between these states, as exemplified by TGF-h induced EMT.
2.8 The transcriptional factor NF-Y.
NF-Y is an ubiquitous heterotrimeric transcription factor with a high binding affinity for the CCAAT consensus motif that is one of the most common cis-acting elements found in the promoter and enhancer regions of protein coding genes in eukaryotes in both direct (CCAAT) and reverse (ATTGG) orientation (Gurtner et al. 2003, Imbriano et al. 2005, Gurtner et al. 2008, Gurtner et al. 2010). It is also reported that the frequency of CCAAT boxes appears to be relatively high in TATA-less promoters, particularly in the reverse ATTGG orientation. In TATA-containing promoters, the CCAAT box is preferentially located in the -80/-100 region with respect to the transcription initiation site (+1) and is not found nearer to the transcription initiation site than -50. In TATA-less promoters, it is usually located closer to the transcription initiation site (at -66 on average) and is sometimes present in close proximity. Analysis of CCAAT boxes in 502 unrelated promoters indicated that NF-Y is the major, if not the sole, CCAAT box recognizing protein and that it might serve different roles in TATA-containing and TATA-less promoters (Mantovani 1998). Interestingly, analysis of transcriptome profiles during cellular transformation identified the CCAAT box as over-represented in promoters of genes overexpressed in diverse types of cancers such as in the breast, colon, thyroid, prostate
~ 15 ~
and leukemias. This strongly indicates the involvement of NF-Y in cancer-associated pathways (Dolfini and Mantovani 2013).
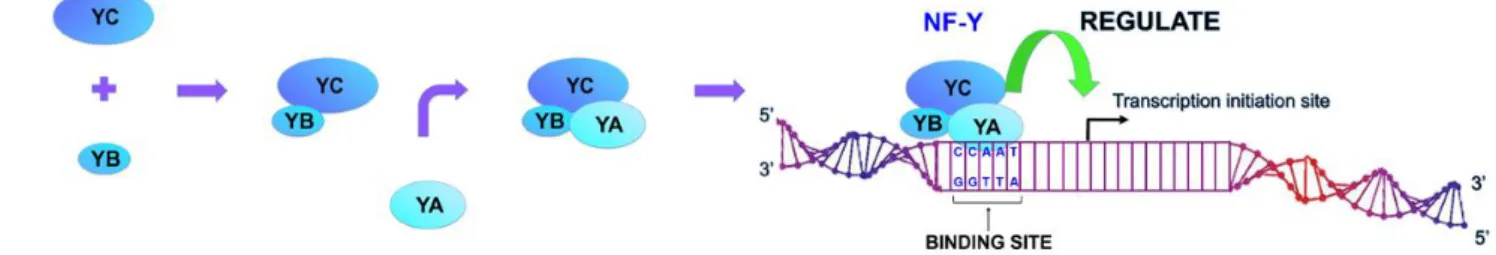
NF-Y consists of three different subunits, NF-YA, NF-YB and NF-YC, which are all necessary for formation of NF-Y complexes and binding to CCAAT boxes. These subunits are encoded by independent genes. YA contains a DNA binding domain, while both YB and NF-YC contain histone-fold motifs (HFMs). First, NF-YB and NF-NF-YC interact to form heterodimers through their HFMs (Figure 7). The NF-YB/NF-YC heterodimer then interacts with NF-YA to form the heterotrimeric NF-Y transcription factor (Figure 5). The absence of any of the NF-Y subunits results in loss of binding of the NF-Y complex to DNA and NF-Y-directed transcription (Mantovani 1999, Yoshioka et al. 2007).
Growing number of experiments in cells support the notion that NF-Y complex is a key player in the regulation of proliferation and viability (Gurtner et al, 2003, Imbriano et al. 2005, Gurtner et al. 2008, Gurtner et al.2010). In agreement, the knock out of the NF-YA subunit in mice leads to embryo lethality (Bhattacharya et al. 2003). As describe in a recent review, it’s possible divide the NF-Y’s target genes into two major groups: cell cycle-related genes and human disease-related genes, including examples important for hematopoietic disorders and cancer. In the first group, NF-Y controls the expression of several key regulators of the cell cycle such as topoisomerase II alpha (topo IIα), cdc2, cyclins and cdc25C genes (Hu et al. 2002, Kao et al. 1999, Manni et al. 2001). For example, topo IIα activated during the late S and G2/M phases of the cell cycle carries several NF-Y binding sites in its promoter. Cyclin-dependent kinases (CDKs) also play an important role in the eukaryotic cell cycle progression. The Cdc2 (CDK1) gene is expressed during the late G1/S phase and is required for the G2 to M phase transition in higher eukaryotes. It is also reported that NF-Y mediates transcriptional inhibition of mitotic cyclins and the cdc25C genes during p53-dependent G2 arrest induced by DNA damage. These observations suggest a transcriptional regulatory role of NF-Y in the G2 checkpoint after DNA damage (Manni et al. 2001). Moreover, NF-Y is reported to be required for widespread activation of G2/M and anti-apoptotic genes. Knockdown of NF-YB impairs G2/M progression, induces apoptosis and is sufficient to functionally activate p53, in the absence of DNA damage (Benatti et al. 2008 ). Impairment of Bax/Bcl-2 and Bax/Bcl-X(L) ratios contributes to failure to maintain a physiologic level of CCAAT-dependent transcription of anti-apoptotic genes. Fine balancing the NF-Y-p53 duo appears to be important for cell survival by maintaining transcription of anti-apoptotic genes and preventing p53 activation that triggers the apoptotic cascade (Benatti et al. 2008). In the second group, of the NF-Y targets, there are all genes that have related with the human disease. NF-Y can regulate transcription of several genes that are
~ 16 ~
related to human diseases such as gamma-globin, Hoxb4, MHC class II, transforming growth factor beta type II receptor and the SRY-related HMG-box (Sox) family (Zhu et al. 2012, Gilthorpe et al. 2002, Reith et al. 1994, Huang et al. 2005, Basile et al. 2006, Kato et al. 2009, Wiebe et al. 2000). Clinical studies have indicated that patients with up-regulated expression of NF-Y target genes have poor prognosis in multiple cancers (Yamanaka et al. 2009). NF-Y overexpression increased the proliferation rate of cancer cells harbouring endogenous mutant p53 (Gurtner 2010). Moreover, mutant p53 protein physically interacts with the transcription factor NF-Y up-regulating the expression of many key genes involved in the regulation of the cell cycle in response to DNA damage (Di Agostino et al.2006). Analysis of transcriptome profiles during cellular transformation identified the CCAAT box as over-represented in promoters of genes overexpressed in diverse types of cancers, breast, colon, thyroid, prostate and leukemia. This strongly indicates the involvement of NF-Y in cancer-associated pathways (Dolfini and Mantovani 2013). Interestingly, computational studies indicate that a number of known transcriptional factors, among which NF-Y, could be responsible for the aberrant regulation of 214 human pre-miRNA sequences in cancer and other diseases (Lee et al. 2007). However, no experimental data on miRNA regulation by the transcription factor NF-Y are available until now.
Figure 5. Schematic representation of NF-Y complex formation. NF-Y consists of three
different subunits, YA, YB and YC, which are all necessary for formation of NF-Y complexes and binding to CCAAT boxes to activate transcription. NF-NF-YA is the limiting subunit.
~ 17 ~
3. RESULTS
3.1 The NF-Y-binding sequence, CCAAT, is highly represented on human miRNA promoters deregulated on CRC.
To identify NF-Y–miRNA-crosstalk, in collaboration with a group of engineers, we have developed a software, named infinity, able to find the presence of DNA matrices, in 60Kb upstream and 5kb downstream of 939 human pre-miRNA, simultaneously. Since it has been demonstrated that flanking sequences of the invariably conserved CCAAT core box are important for NF-Y binding, we have searched the matrix D/V/V/C/C/A/A/T/S/N/V (D=A/T/G, N=A/T/C/G, V=C/A/G), derived from the previously described matrices recognized by NF-Y (Mantovani 1998, Dolfini et al. 2009, Fleming et al. 2013). Our in silico analysis demonstrated that the CCAAT matrices are overrepresented on miRNA minimal promoters and strongly support the hypothesis that NF-Y is a regulatory factor for many of these genes (Falcone et al. 2016).
CRC is one of the major leading causes of cancer-related death. Moreover, Deregulation of miRNAs expression has been found in CRC (Di Agostino et al. 2006, Fabbri et al. 2007, Lujambio and Lowe et al. 2012). In order to decipher whether NF-Y binds CCAAT matrices on miRNAs loci deregulated in CRC, we first catalogued a set of common miRNAs deregulated in this tumour. In particular, we carried out a meta-analysis on PubMed database to collect articles that investigated the aberrant miRNA gene expression patterns in colon samples from colon cancer patients. The keywords miRNA, microRNA and colon cancer were used in performing the literature search. This search retrieved 353 research articles until the beginning of 2013. The relevant articles extracted from PubMed were subjected to additional refinement. Moreover, we focused our attention exclusively on up-regulated miRNAs. This search retrieved 118 up-regulated miRNAs corresponding to 141 pre-miRNAs (Table 1). Using infinity we found that CCAAT sequences are overrepresented on ~60% of human miRNA deregulated in CRC in a minimal promoter region between -1 kb to + 0,5 kb with respect the TSS.
miRNA References
miRNA-29b; miRNA-30a-5p; miRNA-140-5p; miRNA-516-3p; miRNA-99a
Arndt, GM. et al. 2009 miRNA-15a; miRNA-27a; miRNA-98; miRNA-103;
miRNA-105; miRNA-107; miRNA-122a; miRNA-128a; miRNA-134; miRNA-142-5p; miRNA-142-3p;miRNA-1; miRNA-147; miRNA-148a; miRNA-151; miRNA-181c; miRNA-186; miRNA-194; miRNA-197; miRNA-213; miRNA-215; miRNA-216; miRNA-219; miRNA-222;
~ 18 ~
miRNA-324-5p; miRNA-330; miRNA-338; miRNA-339; miRNA-370; miRNA-373; miRNA-Let-7g30e-3p; 181d; 220;
miRNA-302a; miRNA-302b; miRNA-493-3p; miRNA-550;
miRNA-570
Motoyama, K. et al. 2009
494; 500; 513a-5p; miRNA-513b; miRNA-513c; miRNA-892b
Mosakhani, N. et al. 2012 337; 483-3p; 520b;
miRNA-520g; miRNA-550a-3p; miRNA-629-3p; miRNA-663; miRNA-135a-3p
Navon, R. et al. 2009
miRNA-32; miRNA-33; miRNA-188; miRNA-503;
miRNA-542-5p; miRNA-552; miRNA-584; miRNA-625
Sarver. AL. et al. 2009
miRNA-451; miRNA-675 Schetter, AJ. et al. 2011
miRNA-424; miRNA-301b Wang, YX. et al. 2010
miRNA-335 Xi, Y. et al. 2006
miRNA-10a; miRNA-25¸ miRNA-181a; miRNA-200a miRNA-200b; miRNA-34a; miRNA-141; miRNA-320
Arndt, GM. et al. 2009; Monzo, M. et al. 2008 miRNA-93
miRNA-298
Arndt, GM. et al. 2009; Navon, R. et al.2009
miRNA-30a-3p Arndt, GM. et al. 2009; Xi, Y.et al. 2006
miRNA-106b Arndt, GM. et al. 2009; Wang, YX. et al. 2010
miRNA-20 Bandrés, E. et al. 2006; Monzo, M. et al. 2008
miRNA-15b; miRNA-181b Arndt, GM. et al. 2009; Monzo, M. et al. 2008;
Xi, Y. et al. 2006
miRNA-210; miRNA-221; miRNA-154-3p Monzo, M. et al. 2008; Navon, R. et al. 2009
miRNA-182-3p Monzo, M. et al. 2008; Sarver. AL. et al. 2009
miRNA-374 Monzo, M. et al. 2008; Wang, YX.et al. 2010
miRNA-191 miRNA-200c
Monzo, M. et al. 2008; Xi, Y.et al. 2006
miRNA-92a-5p Motoyama, K. et al. 2009; Navon, R. et al. 2009
miRNA-196b Motoyama, K. et al. 2009; Wang, YX. et al. 2010
miRNA-19b Navon, R. et al. 2009; Schetter, AJ. et al. 2011
miRNA-203; miRNA-130b; miRNA-106 Arndt, GM. et al. 2009; Monzo, M. et al. 2008;
Navon, R. et al. 2009
miRNA-135a Monzo, M. et al. 2008; Nagel, R. et al. 2008;
Schetter,AJ. et al. 2011
miRNA-17-3p Monzo, M. et al. 2008; Navon, R. et al. 2009; Sarver.
AL. et al. 2009 miRNA-301
miRNA-92a-3p
Monzo, M. et al. 2008; Navon, R. et al. 2009; Schetter,AJ. et al. 2011
miRNA-7 Navon, R. et al. 2009; Motoyama, K. et al. 2009;
Mosakhani, N. et al. 2012
miRNA-18b Navon, R. et al. 2009; Motoyama, K. et al. 2009;
Wang, YX. et al. 2010
miRNA-31 Arndt, GM. et al. 2009; Monzo, M. et al. 2008;
Motoyama, K. et al. 2009; Sarver. AL. et al. 2009
miRNA-29a Arndt, GM. et al. 2009; Monzo, M. et al. 2008;
Sarver. AL. et al. 2009; Schetter,AJ. et al. 2011
miRNA-95 Arndt, GM. et al. 2009; Monzo, M. et al. 2008;
Motoyama, K. et al. 2009; Navon, R. et al. 2009
miRNA-17-5p Arndt, GM. et al. 2009; Monzo, M. et al. 2008;
Motoyama, K. et al. 2009; Schetter, AJ. et al. 2011
miRNA-96 Arndt, GM. et al. 2009; Monzo, M. et al. 2008; Navon,
R. et al. 2009; Sarver. AL. et al. 2009
miRNA-19a Arndt, GM. et al. 2009; Bandrés, E. et al. 2006;
Monzo, M. et al. 2008; Navon, R. et al. 2009; Wang, YX. et al. 2010
miRNA-224 Arndt, GM. et al. 2009; Monzo, M. et al. 2008;
~ 19 ~
Wang, YX. et al. 2010
miRNA-183; miRNA-182-5p Arndt, GM. et al. 2009; Monzo, M. et al. 2008;
Navon, R. et al. 2009; Motoyama, K. et al. 2009; Sarver. AL. et al. 2009
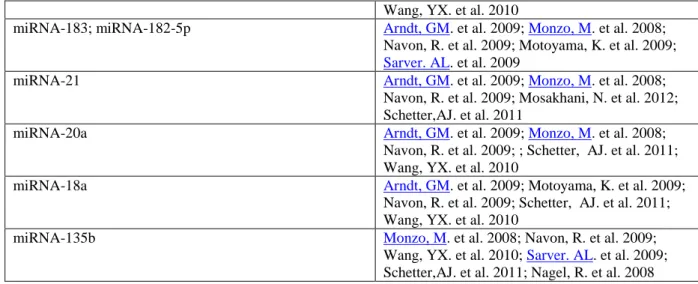
miRNA-21 Arndt, GM. et al. 2009; Monzo, M. et al. 2008;
Navon, R. et al. 2009; Mosakhani, N. et al. 2012; Schetter,AJ. et al. 2011
miRNA-20a Arndt, GM. et al. 2009; Monzo, M. et al. 2008;
Navon, R. et al. 2009; ; Schetter, AJ. et al. 2011; Wang, YX. et al. 2010
miRNA-18a Arndt, GM. et al. 2009; Motoyama, K. et al. 2009;
Navon, R. et al. 2009; Schetter, AJ. et al. 2011; Wang, YX. et al. 2010
miRNA-135b Monzo, M. et al. 2008; Navon, R. et al. 2009;
Wang, YX. et al. 2010; Sarver. AL. et al. 2009; Schetter,AJ. et al. 2011; Nagel, R. et al. 2008
Table 1. 118 miRNA up-regulated on ccolorectal cancer patients. Representation of a
meta-analysis on PubMed database to collect articles that investigated the aberrant miRNA gene expression patterns in colorectal samples from colorectal cancer patients. This search retrieved 118 up-regulated miRNAs in colon cancer.
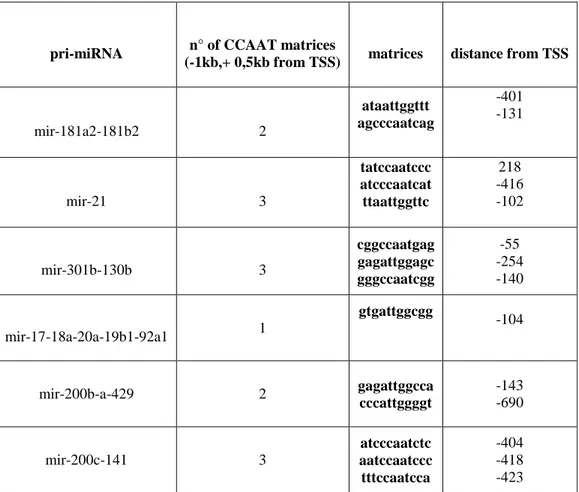
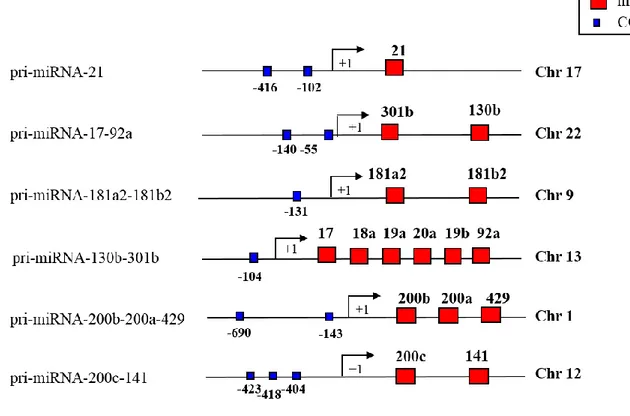
3.2 NF-Y binds in vivo miRNA’s promoters.
In order to demonstrate the in vivo binding of NF-Y to the in silico predicted CCAAT matrices, we concentrated our attention on promoters regions of 6 miRNA clusters (pri-miRNA-181a2-181b2, -21, -17-18a-20a-19b1-92a1, -301b-130b, -200b-a-429, -200c-141) coding for 15 mature miRNAs (181a, 181b, 21, 17, 18a, 20a, 19b, 92a, 301b, 130b, 200b, 200a, -429, -200c, -141). Interestingly, these miRNAs display key roles on cell proliferation, viability and cell migration on colon cancer (Woods et al. 2007, Dong et al. 2014, Lin et al. 2014, Pichler et al. 2014, Sun et al. 2015). These 6 promoters contain multiple CCAAT boxes (Table 2 and Figure 6) in a region proximal to the TSS (between -1000bp to +500bp). We performed in vivo chromatin immunoprecipitation experiments (ChIP) on human colon adenocarcinoma cells line SW480, by using anti-NF-YA antibody and, as negative controls, we included a reaction lacking primary antibody. Enrichment of DNA fragments containing predicted CCAAT matrices, were assessed by PCR. As shown in Figure 7, NF-Y binds in vivo all analyzed sequences. This binding is associated with high level of the transcription permissive histone mark H3K9ac (histone 3 lysine 9 acetylated), and low level of the heterochromatin mark H3K9me2 (histone 3 lysine 9 di-methylated). Moreover, the acetyltransferase p300 is recruited onto the chromatin of the majority of these NF-Y target promoters. This data are in agreement with previously reports that demonstrated that NF-Y may modulate transcription via histone
~ 20 ~
acetylation because of its interaction with the histone acetyl transferases p300 (Gurtner et al. 2008).
Collectively our results support the hypothesis that NF-Y can regulate at transcriptional level miRNAs deregulated on CRC.
pri-miRNA n° of CCAAT matrices
(-1kb,+ 0,5kb from TSS) matrices distance from TSS
mir-181a2-181b2 2 ataattggttt agcccaatcag -401 -131 mir-21 3 tatccaatccc atcccaatcat ttaattggttc 218 -416 -102 mir-301b-130b 3 cggccaatgag gagattggagc gggccaatcgg -55 -254 -140 mir-17-18a-20a-19b1-92a1 1 gtgattggcgg -104 mir-200b-a-429 2 gagattggcca cccattggggt -143 -690 mir-200c-141 3 atcccaatctc aatccaatccc tttccaatcca -404 -418 -423
Table 2. Results of the in silico analysis of 1,5 kb of promoter of the 6 miRNA clusters validated by in vivo experiments.
~ 21 ~
Figure 6. Schematic picture showing miRNA promoters and CCAAT consensus position.
Figure 7. NF-Y binds in vivo the CCAAT-matrices on miRNAs promoters. ChIPs performed
on SW480 cells using the indicated antibodies. PCR were performed using specific primers for the immunoprecipitated DNA fragments on promoter regions containing the indicated CCAAT-matrices found with infinity.
~ 22 ~
3.3 NF-Y positively regulates miRNA-200 family at transcriptional level.
Among the miRNAs deregulated in colon cancer that contains the CCAAT matrices in proximity to TSS, there are the miRNA-200 family members.
The miR-200 family is among the most widely studied miRNAs in cancer. During the last decade many of the miRNA-200 putative targets have been validated and their roles in cancer initiation, metastasis, diagnosis and treatment have been demonstrated (Humphries and Yang 2015). Considering the impact of the miRNA-200 family in cancer development and progression, we wondered whether NF-Y, can positively regulate these miRNAs at a transcriptional level.
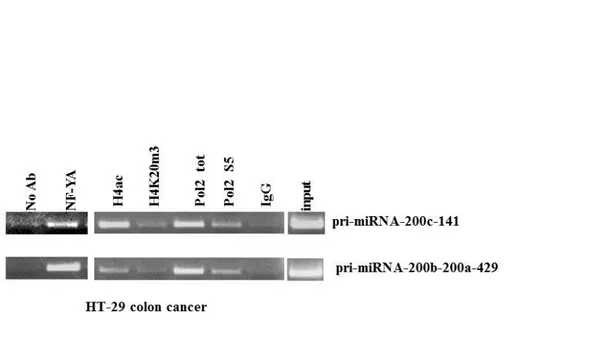
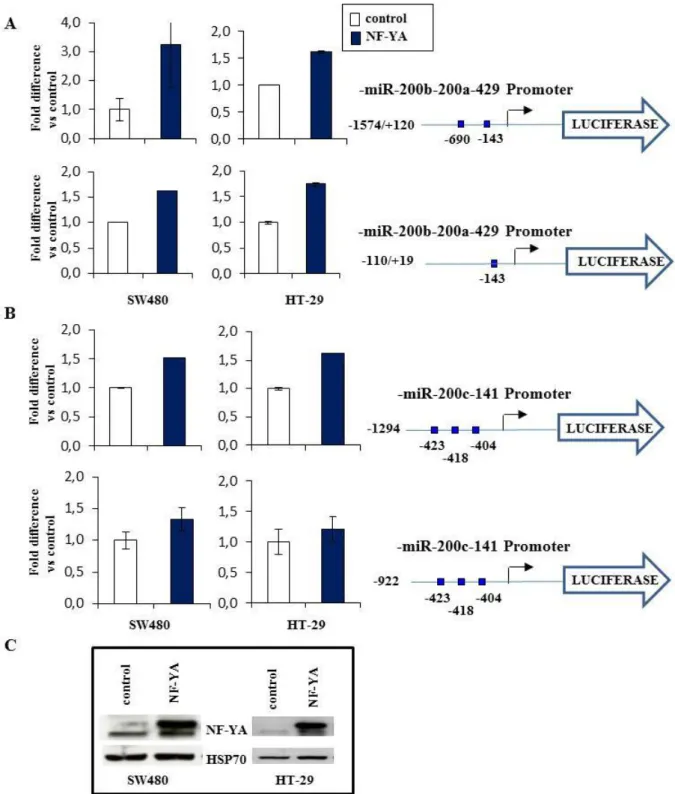
First, we confirmed on colon cancer cell line HT29 the results of ChIP experiments on miRNA-200 family obtained on SW480. Figure 8 shows that NF-Y binds in vivo the CCAAT matrices present on two promoters of miRNA-200 family also on HT29 cell line. Moreover, the results of ChIP showed that these promoters are enriched for polymerase2 (Pol2), activated Pol2S5 (phosphorylated on Serine5, a marker of active transcription initiation) (Heidemann et al. 2013) and of the transcriptional permissive histones mark H4ac (histone 4 acetylated). Next, we asked whether NF-Y, through CCAAT matrices binding, is able to drive the transcription of miRNA-200’s promoters. To this hand, SW480 and HT29 cells were transiently co-transfected with an expression vector coding for NF-YA, the limiting subunits of the trimer, and with luciferase reporter constructs carrying human miRNA-200b-200a-429 and miRNA-200c-141 promoter fragments. Promoter activity was evaluated after 24 h by luciferase assay. In particular we used two different constructs for miRNA-200b-200a-429 promoter (-1574/+120 containing two CCAAT matrices, -110/+19 containing one CCAAT matrix), and two constructs for miRNA-200c-141 promoter (-1294 and -922, both the constructs contain the three CCAAT matrices). As shown in Figure 9 NF-YA overexpression increases the activity of both miRNA-200b-200a-429 and miRNA-200c-141 promoters, though to different extents, in all tested cell lines. To investigate whether NF-Y DNA binding activity impacts on the expression of these miRNAs, we infected SW480 cells with an adenoviral vector expressing a dominant negative NF-YA protein (dn-NF-YA) and a control adenovirus. This molecule is a NF-YA protein with a triple amino acid substitution in the DNA binding domain that impairs its ability to bind the DNA. It is still able to interact with a NF-YB/-YC dimer, but the resulting trimer is inactive in terms of CCAAT recognition (Figure 10) (Mantovani et al. 1994). Quantitative reverse transcription PCR (RT-qPCR) analysis performed 30 hours post infection shows that upon dn-NF-YA overexpression (Figure 11A), although to different extents, primary miRNAs transcripts (pri-miRNA 200c-141 and pri-miRNA-200b-200a-429) and the mature miRNA-200 family
~ 23 ~
members (miRNA-200c, -141, -200a, -200b) are down-regulated (Figure 11B). In order to further address the direct role of NF-Y on miRNA transcriptional regulation, we analyzed the expression levels of both precursor and mature form of miRNA-200 family members in colon cancer cell lines HT29 and LoVo, before and after constitutive depletion of the endogenous NF-YA subunit, the limiting subunits of the trimer. The cells were transduced with lentiviral vectors carrying either shRNA sequences specific to NF-YA (sh-NF-YA) or scrambled (sh-scr) control, and the modulation of pri- and mature miRNAs expression was investigated through RT-qPCR. The results revealed that, upon efficient NF-YA depletion (Figure 12C) both primary transcript and the mature miRNAs levels are down-regulated (Figure 12A, B), demonstrating that NF-Y positively regulates the expression of miRNA-200 family members at transcriptional level. Taken together, our data demonstrate that NF-Y binds in vivo miRNA-200 family promoters and its DNA binding activity is essential for transcriptional regulation of these miRNAs in colon cancer cell lines.
Figure 8. The transcription factor NF-Y binds in vivo the miRNA-200 family promoters.
ChIp experiment performed in HT29 cells, with the indicated antibodies, on promoters of miRNA-200-family. The PCR were performed with complementary oligonucleotides to CCAAT consensus near the TSS.
~ 24 ~
Figure 9. NF-Y regulates the miR-200-family promoters. Luciferase activity of Luc-reporter
constructs carrying human pri-miRNA-200b-200a-429 (A), and pri-miRNA-200c-141 (B) promotor constructs was analyzed before and after NF-Y overexpression. (C) NF-YA level was analysed by western blot on lysates of control- and NF-YA-transfected SW480 and HT29 cell lines. HSP70 was used as a loading control.
~ 25 ~
dn-NF-YA
Figure 10. Schematic representation of the dominant-negative (dn) NF-YA. The dn is a
NF-YA protein mutant in the DNA binding domain able to interact with NF-YB-NF-YC dimer. The resulting trimer is inactive in terms of CCAAT recognition.
Figure 11. Expression levels of pri-miRNAs and mature miRNAs are reduced after YA. (A) YA level was analysed by western blot on lysates of control- and
dn-NF-YA-infected SW480 cells. HSP70 was used as a loading control. (B) qRT-PCR analysis of the indicated pri-miRNAs and mature miRNAs before and after infection with either dn-NF-YA or control adenoviruses on SW480 cells.
~ 26 ~
Figure 12. Expression levels of pri-miRNAs and mature miRNAs are reduced after NF-Y depletion. qRT-PCR analysis of the indicated pri-miRNAs (A) and mature miRNAs (B) before
and after stable infection with either sh-NF-YA or control lentiviruses on HT29 cells and LoVo cells. (C) NF-YA level was analysed by western blot on lysates of control- and sh-NF-YA-infected HT29 and LoVo cells. GAPDH was used as a loading control.
~ 27 ~
3.4 NF-Y regulates cell invasion.
It has been demonstrated that miR-200 family, by acting on numerous targets at multiple levels, prevents cell migration (Bracken et al. 2014).
Our previously data demonstrated that NF-Y, binding the miRNA-200 family promoters, positively regulates their expression in colon cancer. Indeed we wondered if NF-Y could have a role in colon cancer cells invasion. To this hand, we performed the chemoinvasion assay after NF-YA overexpression. In particular, LoVo cells were transfected with the expression vector encoding for NF-YA and for the relative control (Figure 13A) and chemoinvasion assay was performed 24 hours after transfection. As shown in figure 13B and C chemoinvasion experiment demonstrates that NF-YA overexpressing cells have a less invasive capacity of four times compared to control cells. In agreement with this result, after NF-YA depletion, by a lentivirus expressing the short-hairpin against NF-YA, LoVo cell invasion capacity is increased about two times (Figure 13). Subsequently, we assessed whether NFY depletion can lead an increase of the cell invasion capacity, also in cells which presents a strong epithelial phenotype, the HT29 colon cancer cells. Chemoinvasion experiments demonstrate that HT29 cells also become more invasive after NF-YA depletion (Figure 14A, 14B). Collectively our data show, for the first time, an inhibitory role of NF -Y in the cell invasion.
Since the maturation of invadopodia is accompanied by local release of MMPs, we also assessed MMPs secretion using zymography assay. The MMPs are enzymes that are secreted by cells in response to their extracellular environment and can degrade both matrix and non-matrix proteins during cell invasion. MMPs are grouped into collagenases, gelatinases, stromelysins, matrilysins, membrane-type (MT)-MMPs and others. The gelatinase A (MMP-2) has three repeats of a fibronectin type II motif in the metalloproteinase domain.Several studies have demonstrated an association between tumor spread and expression of MMP-2, indicating that MMP-2 may have a prognostic potential in different epithelial cancer types and even a diagnostic potential in malignant cancers (Roomi et al. 2009, Groblewska et al. 2012, Zhang et al. 2012, Zhang et al. 2011, Qin L et al. 2008, Zucker et al. 2004, Sakata et al. 2000, Basset et al. 1990). Indeed, we asked whether NF-Y depletion leads a release of MMP-2 in colon cancer cells. To this hand we used the quantitative zymography assay to measure enzyme levels in HT29 colorectal cancer cells before and after NF-YA stable depletion by viral infection. Our data demonstrated that after NF-YA depletion the level of MMP2 secreted in the culture medium is increased (Figure 15). Even if MMPs are extracellular proteins, they are also present in intracellular compartments (Limb et al. 2005, Kwan et al. 2004, Luo et al. 2002). Thus, we evaluate also the MMP-2 protein level in total cell extract after NF-YA depletion. In agreement
~ 28 ~
with the zymography assay, MMP-2 protein levels are increased after NF-YA depletion (Figure 16). These evidences strongly suggest that NF-Y inhibits cell invasion, not only by the miRNA-200 family regulation, but also by the MMP-2 inhibition.
~ 29 ~
Figure 13. NF-Y regulates colon cancer cell invasion. (A) NF-YA level was analysed by
~ 30 ~
loading control. (B) Cell invasion was examined by using Matrigel-coated transwell cell culture chambers. (C) Ability of invasion of LoVo cells were quantified by counting the number of cells that invaded the underside of the porous polycarbonate membrane under a phase-contrast microscope. Data represent the average of three experiments. (D) NF-YA level was analysed by western blot on lysates of control- and sh-NF-YA-infected LoVo cells. GAPDH was used as a loading control. (E) Cell invasion was examined by using Matrigel-coated transwell cell culture chambers. (F) Ability of invasion of LoVo cells were quantified by counting the number of cells that invaded the underside of the porous polycarbonate membrane under a phase-contrast microscope. Data represent the average of three experiments. Data represent the average of three experiments.
Figure 14. NF-Y depletion reduces cell invasion in HT29 colon cancer cell.
(A) NF-YA level was analysed by western blot on lysates of control- and sh-NF-YA-infected HT29 cells. GAPDH was used as a loading control. (B) Cell invasion was examined by using Matrigel-coated transwell cell culture chambers. (C) Ability of invasion of HT29 cells were quantified by counting the number of cells that invaded the underside of the porous polycarbonate membrane under a phase-contrast microscope.
~ 31 ~
Figure 15. NF-Y depletion increases the activity of the matrix metalloproteinase MMP-2. (A) Representative zymogram gel performed with secreted proteins by sh-NF-YA- and
control-infected HT29 colon cancer cell. Gelatinolytic activities appear as a strong bands for MMP-2 (63KDa). (B) Histograms show densitometry analysis of gel in A.
~ 32 ~
Figure 16. NF-Y depletion increases the matrix metalloproteinase MMP-2 protein level.
Western blot analysis performed on total extract of sh-NF-YA- and control-infected HT29 cells, to evaluate the non-activated form of MMP-2 (pro-MMP-2), the cleaved and activated form of MMP-2 and NF-YA level. GAPDH was used as a loading control.
~ 33 ~
4. CONCLUSIONS AND DISCUSSION
It has been previously shown that CCAAT matrices, bound by the transcriptional factor NF-Y, are over-represented in promoters of protein coding genes deregulated in colorectal cancers and deregulation of miRNAs (non coding genes) expression has been found in colorectal cancer (Dolfini et al. 2013, Fabbri et al. 2007, Lujambio and Lowe et al. 2012). Thus, we have developed of a fast and user-friendly software, named infinity, able to find the presence of DNA matrices, such as binding sequences for transcriptional factors, on ~65kb (kilobase) of 939 human miRNA genomic sequences, simultaneously. To test the power of our software, we used it to search all CCAAT matrices on 60Kb upstream and 5Kb downstream of 939 human miRNA genomic sequences and we observed that CCAAT matrices are highly represented on promoter of human miRNA loci, among them miRNAs deregulated in colon cancer. Of note, chromatin immunoprecipitation experiments (Figure 7, 8) performed with an anti-NFY antibody, demonstrated that the in silico identify CCAAT matrices play an in vivo functional role. Indeed, NF-Y binds in vivo all analyzed sequences thus strongly support the idea that NF-Y, through its CCAAT binding activity, regulates the expression of miRNAs deregulated in colon cancer. Moreover, for the first time, we have demonstrated, by loss of function experiments, that NF-Y directly positively regulates the expression of miRNA-200 family at transcriptional level. In particular we have found that the Luciferase activity, of both the miRNA-200 promoters, is increased after the NF-YA overexpression (the limiting subunit of the trimer) (Figure 9). Furthermore, pri-miRNA and mature miRNAs levels are reduced after NF-YA depletion or after dn-NF-YA overexpression in different colon cancer cell lines (Figure 11, 12). Expression of miRNA-200 family members is frequently downregulated in metastases compared to that in primary tumors (Gibbons et al. 2009, Olson et al. 2009, Iliopoulos et al. 2010), and reduced miRNA-200 levels are associated with a poor outcome in several human epithelial malignancies (Hu X et al. 2009, Wiklund et al. 2011, Yu et al. 2010). According, these miRNAs are potent inhibitors of migration, invasion and metastasis (Humphries and Yang 2015, Sun et al. 2015). In agreement with the pivotal role of miRNA-200 family in cell invasion and the NF-Y’s positive role in their expression, we have demonstrated, through experiments of chemoinvasion, that NF-Y inhibits cancer cells invasion (Figure 13, 14). Moreover, we have found that the activity and protein expression levels of the matrix metalloproteinase MMP-2, an enzyme involved on extracellular matrix degradation during cell invasion, are increased after NF-Y depletion, to further evidence that NF-Y has an important role in tumor invasion inhibition (Figure 15, 16).
~ 34 ~
In conclusion our results revels a novel Y/miRNAs network in colon cancer, in which NF-Y positively regulates the miRNA-200 family expression and has an inhibitory role in colon cancer cell invasion.
~ 35 ~
5. MATERIALS AND METHODS 5.1 Cell lines and cell culture
All colon cancer cell lines (LoVo, HT29 and SW480) were grown in DMEM, supplemented with 10% FBS (GIBCO-BRL), L-glutamine (2mM), Penicillin (100 U/ml)/Streptomycin (100 ug/ml) (Life Technologies Inc.). Cells were grown at 37°C in a humidified atmosphere with 5% CO2.
5.2 Transient and stable transfection
Cells were transiently transfected with 1ug of NF-YA plasmid and the relative control with Lipofectamine 2000, Invitrogen.
Recombinant adenoviral vector encoding dn-NF-YA-GFP (dn-NF-YA), and, as control, the adenoviral vector encoding –GFP (scr) have been described previously (Gurtner et al. 2008). Cells exponentially growing on plates were infected in DMEM without serum for 1 hour at 37 °C at a multiplicity of infection (MOI) of 200. Following infection DMEM supplemented with 10% FBS were added to each plate and the cells were incubate at 37°C and analyzed after 30h. For NF-Y depletion we used a Lentivirus expressing the short-hairpin against the limiting subunit of the trimer, NF-YA, and containing puromycin resistance cassette. Non-target short hairpin RNA (shRNA) and shRNA-NF-YA, targetingexon 6 (CCATCG TCTATCAACCAGTTA) are provide by Imbriano’sgroup (Benatti et al. 2011).
5.3 Chromatin Immunoprecipitations (ChIP)
ChIP assays were performed in SW480and TH29 cells as described (Gurtner et al., 2008). Chromatin was sonicated and incubated with 4 ug of anti-NF-YA (Rockland 200-401-100) antibody, p300 (Santa Crutz Biotech 584), H3AcK9 (ABCAM 4441-50), H3dimK9 (UPSTATE07-441), H4ac (UPSTATE 06-598) H4K20me3 (UPSTATE07-749) Pol2 tot (Santa Crutz Biotech 899) Pol2 S5 (ABCAM 5131-50).
For PCR analysis 2ul of template in 20–30 ul of total reaction were used. PCR was performed with HOT-MASTER Taq (Eppendorf). The primers sequences of miRNA’s promoters were: 181a2-181b2-F gactagaggcagccagacac, 181a2-181b2-R cctgtctgctcagctcgcat, 21-F gggtaagaaggagctccgag, 21-R aggcacctcccactagtcag, 17-92-F cgcgcagagcttgttaacgg, 17-92-R gccccactccctcattagca, 301b-130b-F aaaccacggagcccgagact, 301b-130b-R gcgggttaaagatggagccg, 27a-F cctgaggggcacagtaaagg, 27a-R caggagaggacagaggcttc, 34a-F gggtcctgcactccaacaga, 34a-R tccttggtgccacatggacc, 183-F gctatcaccaaaccgcgagg, 183-R ggactggagcacagagacag, 31-F gggcctcagcgaggatatca, 31-R ccctaacaaggtccctaaccc, 191-F
~ 36 ~
ccaagcttttcctgcccctg, 191-R ggcaacagccatttacgggc, 148a-F agaggaggtgccagctggat, 148a-R ccacacaagacccttcctgg. One of two independent experiments is represented.
200b-200a-429F agaagccttcccatcctggc, 200b-200a-429R cgccttacaaggagcagtgc.
5.4 Western blotting
Cells were washed twice in ice-cold PBS, harvested by scraping with 1X RIPA buffer (150 mMNaCl, 1 % TritonX100, 0.25 % Sodium deoxycholate, 0.1 % SDS, 50 mMTris/HClph 8.0, 20 mM EDTA) supplemented with 1X protease and phosphatase inhibitor cocktail (Sigma-Aldrich). Lysates were incubated 30 min in ice, clarified by centrifugation 20 min at 14000 RPM, and resolved onto 10% SDS-PAGE (40 ug/lane). Blotting was performed using Mini-PROTEAN-PrecastGels, BIORAD, for the trasferweused Trans-Blot Turbo™ System, BIORAD.
Membranes for protein transfer immuno-reacted with following antibodies: anti-NF-YA (Santa Crutz Biotech 17753), anti-GAPDH (Santa Crutz Biotech),HSP70 (StressGen), MMP2 (Santa Crutz Biotech 10736).
5.5 RNA extraction, cDNA synthesis and RT-qPCR
Total RNA was extracted using the Trizol Reagent (Gibco BRL) and following the manufacturer’s instructions.
For pri-miRNAs, RNA was retro-transcribed with M-MLV-RT (Invitrogen) following the manufacturer’sinstruction. RT–qPCRwas performed by using this primers: 200b-200a-429F agcagctcctggaacaccat, 200b-200a-429R cacgtgctgccttgtctga, 200c-141F ccacccagtgcgatttgtc, 200c-141R ccaaccccaagctcaaggt, U6-F ctcgcttcggcagcaca, U6-R aacgcttcacgaatttgcgt, U19-F ggtgcctgtgatggtgttacac, U19-R ttggagccaaacctcaataaaga.
For mature miRNAs, Reverse Transcription and RT-qPCR quantification of miRNA expression were performed respectively by TaqMan MicroRNA RT assay and TaqMan MiRNA® Assays (Applied Biosystems, Foster City, CA, USA) according to the manufacturer's protocol. U6 and U19 were used as endogenous controls to standardize miRNA expression. Experiments were done on triplicate and the results were estimated based on the comparative threshold (2ΔCt). Results are reported as fold of enrichment respect to control defined as 1.
~ 37 ~
5.6 Luciferse reporter gene assay
SW480 e HT29 cells cultured in 6-well plate were transiently transfected with 0,5ug of promorer and 1 ug NF-YA by using Lipofectamine 2000 (Life Technologies) according to the manufacturer’s instructions. Transfection efficiency was monitored by cotrasfection with 0,1ug of Renilla, which was used as an internal control. Luciferase reporter activity was measured after 24h using Luciferase assay system (Promega), according to the manufacturer’s instructions, and normalized to Renilla activity. miR-200b-a-429 promoters constructs were purchased from Addgene, while miR-200c-141 promoters constructs were provided by Li Wang group’s.
5.7 Chemoinvasion assay
LoVo chemoinvasion was assessed using a 48-well modified Boyden's chamber (Neuro Probe, Pleasanton, CA) and 8-µm pore polyvinylpyrrolidone–free polycarbonate Nucleopore filters (Whatman 155846). The filters were coated with an even layer of 3 mg/mL of matrigel Cultrex (Trevigen). The lower compartment of the chamber was filled with 24 hours conditioned serum free medium produced from NIH3T3 fibroblasts.
The transfected and the infected cells were, then, harvested and placed 10000 cells/well in the upper compartment (45 µl/well) of the Boyden's chamber. After16 hours of incubation at 37°C, the invaded cells on the lower surface of the filters were fixed and stained with Diff Quick (Merz-Dade, Dudingen, Switzerland). Then, the invaded cells were counted. Each assay was carried out in quadruplicate and repeated at least three times.
HT29 chemoinvasion was performed using the CultreCoat 24 Well (Trevigen, cat. 3481-024-01). The lower compartment of the well was filled with 24 hours conditioned serum free medium produced from NIH3T3 fibroblasts. The infected cells then, harvested and placed 100000 cells/well in the upper compartment (120 µl/well) of wells. After16 hours of incubation at 37°C, the invaded cells on the lower surface of the filters were fixed and stained with Diff Quick (Merz-Dade, Dudingen, Switzerland). Then, the invaded cells were counted. Each assay was carried out in triplicate
5.8 Zymograph assay
The gelatinases are secreted enzymes (Murphy and Crabbe 1995). Therefore, in cultured cells, a significant part of the gelatinase pool is found in the media. Because serum contains gelatinases, it is necessary to prepare serum-free conditioned media for gelatin zymography.
~ 38 ~
HT29 cells are growed to approx 80% confluence in complete growth media for 24h, afterthey are washed with sterile PBS or serum-free media to remove the serum completely. HT29 cells, with serum-free media, are been incubate at 37°C for at 24 h. We have collected the media and centrifuged (1200 rpm, 5 min at 4°C) to remove cells and debris after the supernatant was concentrated.
Samples are subjected to separation by SDS-PAGE in a resolving gel containing gelatin, a co-polymerized protease substrate. After being resolved in this gel, proteases are re-natured and act to hydrolyze the protein substrate in the gel matrix. The presence and relative activity of MMP’s in the sample are thus determined by a decrease in Coomassie brilliant blue staining of the digested gelatin at the position of the MMP. The gel was scanned and for the objective quantification of bands we have used densitometry with the ImageJ software.
~ 39 ~
6. REFERENCES
Altuvia Y, Landgraf P, Lithwick G, Elefant N, Pfeffer S, Aravin A, Brownstein MJ, Tuschl T, Margalit H. Clustering and conservation patterns of human microRNAs. Nucleic Acids Res 2005. 33:2697-706.
Arndt GM, Dossey L, Cullen LM, Lai A, Druker R, Eisbacher M, Zhang C, Tran N, Fan H, Retzlaff K, Bittner A, Raponi M. Characterization of global mi-croRNA expression reveals oncogenic potential of miR-145 in metastatic colorectal cancer. BMC Cancer. 2009. 9:374.
Bandrés E, Cubedo E, Agirre X, Malumbres R, Zárate R, Ramirez N, Abajo A, Navarro A, Moreno I, Monzó M, García-Foncillas J.Identification by Real-time PCR of 13 mature microRNAs differentially expressed in colorectal cancer and non-tumoral tissues. Mol Cancer. 2006; 5:29.
Bartel DP MicroRNAs: target recognition and regulatory functions. Cell. 2009. 136:215-233.
Basile V, Mantovani R and Imbriano C. DNA damage promotes histone deacetylase 4 nuclear localization and repression of G2/M promoters, via p53 C-terminal lysines. J Biol Chem 2006. 281: 2347-2357.
Basset P, Bellocq JP, Wolf C, Stoll I, Hutin P, Limacher JM, Podhajcer OL, Chenard MP, Rio MC, Chambon P, A novel metalloproteinase gene specifically expressed in stromal cells of breast carcinomas, Nature.1990. 348(6303):699– 704.
Benatti P, Basile V, Merico D, Fantoni LI, Tagliafico E and Imbriano C. A balance between NF-Y and p53 governs the pro- and anti-apoptotic transcriptional response. Nucleic Acids Res 2008. 36: 1415-1428.
Benatti P, Dolfini D, Viganò A, Ravo M, Weisz A, Imbriano C. Specific inhibition of NF-Y subunits triggers different cell proliferation defects. Nucleic Acids Res. 2011. 39(13):5356-68.
Bhattacharya A, Deng JM, Zhang Z, Behringer R, de Crombrugghe B, Maity SN et al. The B subunit of the CCAAT box binding transcription factor complex (CBF/NF-Y) is essential for early mouse de-velopment and cell proliferation. Cancer Res. 2003. 63(23):8167-72.
Borchert GM, Lanier W, Davidson BL. RNA polymerase III transcribes human microRNAs. Nat Struct Mol Biol. 2006. 13:1097-101.
~ 40 ~
Bowden ET, Onikoyi E, Slack R, Myoui A, Yoneda T, Yamada KM, Mueller SC. Co-localization of cortactin and phosphotyrosine identifies active invadopodia in human breast cancer cells. Exp Cell Res. 2006. 312: 1240 – 1253.
Bracken CP, Gregory PA, Kolesnikoff N, Bert AG, Wang J, Shannon MF, Goodall GJ. A double-negative feedback loop between ZEB1-SIP1 and the microRNA-200 family regulates epithelial-mesenchymal transition. Cancer Res. 2008. 68(19):7846-54. Bracken CP, Li X, Wright JA, Lawrence DM, Pillman KA, Salmanidis M, Anderson
MA, Dredge BK, Gregory PA, Tsykin A, Neilsen C, Thomson DW, Bert AG, Leerberg JM, Yap AS, Jensen KB, Khew-Goodall Y, Goodall GJ. Genome-wide identification of miR-200 targets reveals a regulatory network controlling cell invasion. EMBO J. 2014. 33(18):2040-56.
Bueno MJ, Gómez de Cedrón M, Gómez-López G, Pérez de Castro I, Di Lisio L, Montes-Moreno S, Martínez N, Guerrero M, Sánchez-Martínez R, Santos J, Pisano DG, Piris MA, Fernández-Piqueras J, Malumbres M. Combinatorial effects of microRNAs to suppress the Myc oncogenic pathway. Blood. 2011. 117:6255–6266.
Burk U, Schubert J, Wellner U, Schmalhofer O, Vincan E, Spaderna S, Brabletz T. A reciprocal repression between ZEB1 and members of the miR-200 family promotes EMT and invasion in cancer cells. EMBO Rep. 2008. 9:582–589.
Calin GA, et al. A microRNA signature associated with prognosis and progression in chronic lymphocytic leukemia. N. Engl. J. Med. 2005.353:1793–1801.
Castilla MÁ, Díaz-Martín J, Sarrió D, Romero-Pérez L, López-García MÁ, Vieites B, Biscuola M, Ramiro-Fuentes S, Isacke CM, Palacios J. MicroRNA-200 family modulation in distinct breast cancer phenotypes. PLoS ONE. 2012. 7:e47709.
Chang CJ1, Chao CH, Xia W, Yang JY, Xiong Y, Li CW, Yu WH, Rehman SK, Hsu JL, Lee HH, Liu M, Chen CT, Yu D, Hung MC. P53 regulates epithelial-mesenchymal transition and stem cell properties through modulating miRNAs. Nat Cell Biol. 2011. 13:317–323.
Chen JF, Mandel EM, Thomson JM, Wu Q, Callis TE, Hammond SM, Conlon FL, Wang DZ: The role of microRNA-1 and microRNA-133 in skeletal muscle proliferation and differentiation. Nat Genet 2006. 38(2):228–233.
Chendrimada TP, Gregory RI, Kumaraswamy E, Norman J, Cooch N, Nishikura K, Shiekhattar R. TRBP recruits the Dicer complex to Ago2 for micro-RNA processing and gene silencing. Nature. 2005. 436:740-744.