Dipartimento di Agricoltura, Alimentazione e Ambiente (Di3A)
Sezione di Idraulica e Sistemazioni idraulico-forestali
Alessandro Castorina
URBAN WASTEWATER REUSE IN AGRICULTURE: RECENT PERSPECTIVES FROM CASE STUDIES IN
SICILY
Dottorato di Ricerca Internazionale in Ingegneria Agraria XXVIII ciclo
Coordinatore: Prof. Simona Consoli
Tutor: Prof. Simona Consoli
Index FOREWORD
OBJECTIVES OF THE THESIS
1. ON THE USE OF URBAN TREATED
WASTEWATER IN AGRICULTURE
1.1 EUROPEAN LEGISLATION AND WHO GUIDELINES 1.2 RECENT RESEARCHES
1.3 WASTEWATER REUSE AS SUSTAINABLE PRACTICE IN AGRICULTURE
1.3.1 Effects on soil characteristics
1.3.2 Effects on crop production and quality
1.3.3 Effects on irrigation systems and biofilm growth
2. CASE STUDIES IN SICILY
2.1 WASTEWATER AS ALTERNATIVE RESOURCE FOR IRRIGATION IN SICILY
2.2 CASE STUDIES DESCRIPTION 2.3 METHODOLOGY
2.3.1 Set up of the experimental tertiary treatment plant 2.3.2 Irrigation scheduling for row crops
2.3.3Water sampling and irrigation system efficiency 2.3.4 Soil contamination and hydraulic determinations 2.3.5 Crop response
2.3.6 Irrigation system performance
2.3.7 Biofilm determination within the pipelines
3. RESULTS
3.1 WASTEWATER TREATMENT PLANTS RELIABILITY 3.2 SOIL MONITORING
3.3 PLANT GROWTH, QUALITY AND BIOFILM
DETECTION
4. DISCUSSION CONCLUSIONS
ACKNOWLEDGMENTS REFERENCES
FOREWORD
Irrigated agriculture implies the largest consumptive water use and water withdrawal (Frenken and Gillet, 2012).
Water for irrigation and food productions constitutes one of the greatest pressures on freshwater resources. Agriculture accounts for about 70% of global freshwater withdrawals (up to 90% in some fast-growing economies). Irrigation is only a modest part of agricultural water consumption but it accounts for more than 40% of the world‘s production on less than 20% of the cultivated land.
Withdrawals for agriculture tend to decrease with increasing levels of development. In many countries, water availability for agriculture is already limited and uncertain, and is set to worsen. Agricultural water withdrawal accounts for 44% of total water withdrawal in OECD (Convention on the Organisation for Economic Co-operation and Development). In the BRIC countries (Brazil, Russian Federation, India and China), agriculture accounts for 74% of water withdrawals (this ranges from 20% in the Russian Federation to 87% in India). In the least developed countries (LDCs), more than 90% (FAO, 2011b) of the available water is used for irrigation. Globally, irrigated crop yields are ~2.7 times those
of rainfed farming, hence irrigation will continue to play an important role in food production. The area equipped for irrigation increased from 170 million ha in 1970 to 304 million ha in 2008.
The world population is expected to grow from 6.9 billion in 2010 to 8.3 billion in 2030 and to 9.1 billion in 2050 (UNDESA, 2009a). Although projections vary considerably based on different scenario assumptions and methodologies, FAO estimates an 11% increase in irrigation water consumption from 2008 to 2050. This will imply a ~5% increase of the actual water withdrawal for irrigation, which corresponds to about 2,740 km3. Although this seems a modest increase, much of it will occur in regions already suffering from water scarcity (FAO, 2011a).
Economic growth and individual wealth are shifting diets from predominantly starch-based to meat and dairy, which require more water. Producing 1 kg of rice, for example, requires ~3,500 L of water, 1 kg of beef ~15,000 L, and a cup of coffee ~140 L (Hoekstra and Chapagain, 2008). This dietary shift is the greatest to impact on water consumption over the past 30 years, and is likely to continue well into the middle of the twenty-first century (FAO, 2006).
As of 2010 the world‘s aggregated groundwater abstraction is estimated at ~1,000 km3 per year, ~67% of which is used for irrigation, 22% for domestic purposes and 11% for industrial purposes (EUROSTAT, 2011; FAO 2011b, IGRAC, 2010; Margat, 2008; Siebert et al., 2010). The rate has at least tripled over the past 50 years and continues to increase by 1– 2% per year. The estimates suggest that the abstraction of groundwater accounts for ~26% of total global water withdrawal and equals ~8% of mean global groundwater recharge (WWAP, 2009).
North Americans, the highest per capita water users in the world, consume 2.5 times what Europeans use. One reason for this is that water is relatively inexpensive compared to other industrialized countries (CEC, 2008). European and North American populations consume a considerable amount of virtual water embedded in imported food and products. Each person in North America and Europe (excluding former Soviet Union countries) consumes at least 3 m3 per day of virtual water in imported food, compared to 1.4 m3 per day in Asia and 1.1 m3 per day in Africa (Zimmer and Renault, n.d.).
Irrigation with treated wastewater (TWW) is a common practice in many parts of the world, although its diffusion is
still a debatable point (Scott et al., 2004). A realistic estimation confirms that 20 million ha in the world are irrigated by raw, treated and/or partially diluted wastewater (Hamilton et al., 2006). TWWs are produced in large volumes, which if not re-used would be discharged into the environment and do not contribute to increase water availability for the agricultural context. Furthermore, it is well known that discharge of raw effluents into the environment, particularly natural water bodies such as lakes, rivers and the coastal marine environments, may cause severe degradation of these water bodies. The degradation is often related to the presence of organic and inorganic nutrients, which cause problems such as eutrophication and algal blooms. Reusing these discharged effluents can significantly reduce or completely remove the impact of these effluents on receiving bodies. In addition, the TWW reuse for agricultural irrigation reduces the amount of water that needs to be extracted from environmental water resources. TWW can often contain significant concentrations of organic and inorganic nutrients for example nitrogen and phosphate that may be used as a fertilizer source when the water is recycled for irrigation. Moreover, soil microorganisms have been
observed to increase their metabolic activity when sewage effluent is used for irrigation (Toze, 2006).
One of the most economically feasible agricultural uses of reclaimed TWW is the irrigation of high-value horticultural crops, which typically has high returns per volume of water invested in (Hamilton et al., 2006). But this practice has been approached with trepidation, owing primarily to concerns about risks to human health via contamination of food with pathogenic microorganisms (Lazarova, 2005, Hamilton et al., 2005, Toze, 2006). There have been a number of risk factors identified for using TWWs for agricultural irrigation purposes. Some risk factors are short term and vary in severity depending on the potential for human, animal or environmental contact (e.g. microbial pathogens), while others have longer term impacts which increase with continued use of recycled water (e.g. saline effects on soil). A pragmatic approach to allow and justify such concerns, which has been gaining favour in recent years, is the application of WHO 2006 guidelines (updated in 2008) based on a risk assessment and management procedure. In particular, the approach for microbial risks is (i) to define a tolerable maximum additional burden of disease, from which is possible (ii) to derive tolerable risks of disease and infection,
(iii) to set health-based targets for pathogens reductions, (iv) to determine how the required pathogen reductions can be achieved, and (v) to set up a system for verification monitoring.
Finally, the main purposes of this study were to assess the health risk associated with the use of wastewater in irrigation and to monitor the impact on different crops of drip and sub-drip irrigation with treated municipal WW. Faecal Coliform (FC), Escherichia Coli (E. Coli), Enterococcus Faecalis (EF) were selected as indicators of faecal contamination, whereas Salmonella was selected as pathogenic bacteria. In addition, effects of TWW reuse on irrigation system, main production features, hydrological soil behaviour and microbial soil contamination were investigated.
OBJECTIVES OF THE THESIS
On the basis of the previously described context of water use for irrigation in agriculture, and due to the necessity of finding new and alternative water resources to guarantee the economy of the primary sector, my PhD thesis had the following main objectives:
- analyse the European legislation, and World Health Organization (WHO) guidelines regarding the real possibility of reusing wastewater in the agriculture context;
- evaluate the role of a natural tertiary treatment system (i.e. constructed wetland and lagoons) for supplying good quality water for irrigation purposes;
- analyse the effects of tertiary treatment wastewater reuse on vegetable crops production and quality characteristics;
- identify any potential effects of tertiary wastewater reuse on soil contamination and soil hydraulic properties modification;
- analyse the performance of micro-irrigation systems (i.e. drip and sub-drip irrigation) supplying tertiary treatment wastewater for irrigation;
- identify the presence of microbial biofilm growth within the irrigation pipelines supplying wastewater for irrigation;
- test bacteriostatic pipelines for preventing the biofilm growth in the irrigation pipelines.
To find reliable argumentations to the above cited research objectives, experimental campaigns were realized by the
Dipartimento di Agricoltura, Alimentazione e Ambiente of the University of Catania, within the area of S. Michele di Ganzaria (in province of Catania, Eastern Sicily). The trials were carried out in an experimental field close to the Constructed Wetland (CW) systems of the municipality (i.e. the CW system serves as tertiary wastewater treatment system), during the period 2013-2015.
1. ON THE USE OF URBAN TREATED WASTEWATER IN AGRICULTURE
1.1 EUROPEAN LEGISLATION AND WHO
GUIDELINES
The Italian legislation (n. 152/2006) states that natural freshwater sources can be used as a priority for the municipal water supply, and that the recycling and reuse of water are viable alternatives for meeting industrial and agricultural needs. Putting these strategies into practice requires that concentration limits, best treatment practices and irrigation technology options are defined to support treated wastewater (TWW) reuse in agriculture. These specifications are still under discussion; currently, there are strict regulations for TWW reuse (Ministry Decree, D.M. n. 185/03), especially for levels of some chemical compounds and for microbial parameters. In many cases, the quality standards for reclaimed wastewater are the same as for drinking water (Cirelli et al., 2008).
These regulations have made it difficult to promote TWW reuse, especially when advanced treatments are needed to ensure compliance with very strict standards, making water
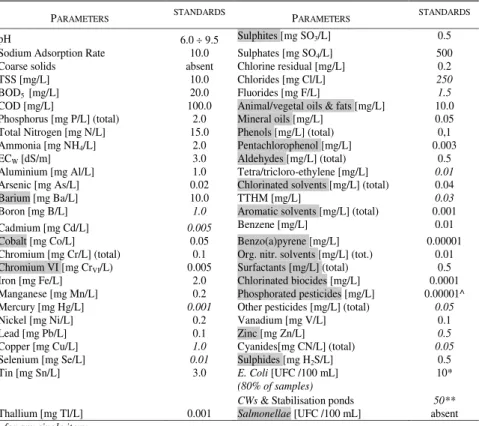
recycling uneconomical. Another obstacle is the excessive number of parameters (54) taken into account by the Italian legislation and their related monitoring protocols, which also have to comply with regional regulations. In addition, the legislation makes no distinction among different alternatives of TWW reuse, namely, urban non-potable, industrial and agricultural reuse. For agriculture in particular, the regulations do not distinguish between crops using restricted irrigation and those using unrestricted irrigation. Additionally, the regulations do not consider the impact of different irrigation options (i.e., subsurface drip irrigation versus spray irrigation) on reducing sanitation-related risks. In summary, current legislation (Table 1) is a major constraint to the development of municipal TWW reuse for irrigation in Italy.
Table 1 Chemical-physical and microbiological parameter reuse limits according to MD 185/2003.
PARAMETERS STANDARDS PARAMETERS STANDARDS
pH 6.0 9.5 Sulphites [mg SO3/L] 0.5
Sodium Adsorption Rate 10.0 Sulphates [mg SO4/L] 500
Coarse solids absent Chlorine residual [mg/L] 0.2
TSS [mg/L] 10.0 Chlorides [mg Cl/L] 250
BOD5 [mg/L] 20.0 Fluorides [mg F/L] 1.5
COD [mg/L] 100.0 Animal/vegetal oils & fats [mg/L] 10.0
Phosphorus [mg P/L] (total) 2.0 Mineral oils [mg/L] 0.05
Total Nitrogen [mg N/L] 15.0 Phenols [mg/L] (total) 0,1
Ammonia [mg NH4/L] 2.0 Pentachlorophenol [mg/L] 0.003
ECW [dS/m] 3.0 Aldehydes [mg/L] (total) 0.5
Aluminium [mg Al/L] 1.0 Tetra/tricloro-ethylene [mg/L] 0.01
Arsenic [mg As/L] 0.02 Chlorinated solvents [mg/L] (total) 0.04
Barium [mg Ba/L] 10.0 TTHM [mg/L] 0.03
Boron [mg B/L] 1.0 Aromatic solvents [mg/L] (total) 0.001
Cadmium [mg Cd/L] 0.005 Benzene [mg/L] 0.01
Cobalt [mg Co/L] 0.05 Benzo(a)pyrene [mg/L] 0.00001
Chromium [mg Cr/L] (total) 0.1 Org. nitr. solvents [mg/L] (tot.) 0.01
Chromium VI [mg CrVI/L) 0.005 Surfactants [mg/L] (total) 0.5
Iron [mg Fe/L] 2.0 Chlorinated biocides [mg/L] 0.0001
Manganese [mg Mn/L] 0.2 Phosphorated pesticides [mg/L] 0.00001^
Mercury [mg Hg/L] 0.001 Other pesticides [mg/L] (total) 0.05
Nickel [mg Ni/L] 0.2 Vanadium [mg V/L] 0.1
Lead [mg Pb/L] 0.1 Zinc [mg Zn/L] 0.5
Copper [mg Cu/L] 1.0 Cyanides[mg CN/L] (total) 0.05
Selenium [mg Se/L] 0.01 Sulphides [mg H2S/L] 0.5
Tin [mg Sn/L] 3.0 E. Coli [UFC /100 mL]
(80% of samples) CWs & Stabilisation ponds
10*
50**
Thallium [mg Tl/L] 0.001 Salmonellae [UFC /100 mL] absent
^ for any single item;
* 100 CFU/100 mL will be allowed as a maximum for a single isolated sample and for the first three years of application of the new Act;
** 200 CFU/100 mL will be allowed as a maximum for a single isolated sample.
E.coli: Escherichia coli; * limit value for 80% of samples; a maximum of 200 CFU/100 mL is allowed in 20% of samples; n.d.: not detected; ** 100% of samples.
The World Health Organization (WHO) considers a different approach for evaluating any potential pathogenic risk associated with TWW reuse in agriculture. The approach is that of the: the Disability-adjusted Life Years (DALYs) (WHO, 2006). The DALYs index calculates the time lost because of disability from a disease compared with a long life free of disability in the absence of disease. Three index pathogens are selected from WHO: Rotavirus (a virus),
Campylobacter (a bacterium) and Cryptosporidium (a protozoan). Results of the QMRA (Quantitative Microbial Risk Analysis, WHO 2006) are used to determine the total pathogen reductions targets to be achieved by a combination of wastewater treatment and a selection of post-treatment health protection control measures; these are based on a tolerable maximum additional burden of disease of one-million of a DALY loss per person per year (110-6
DALY loss pppy).
In the adopted approach, the model exposure scenario of ―unrestricted irrigation‖, based on the consumption of TWW-irrigated lettuce (Shuval et al., 1997), was considered within the ―planned TWW use‖ definition. The selected scenario corresponds with the controlled use of TWW to grow crops that are normally eaten raw (WHO, 2006).
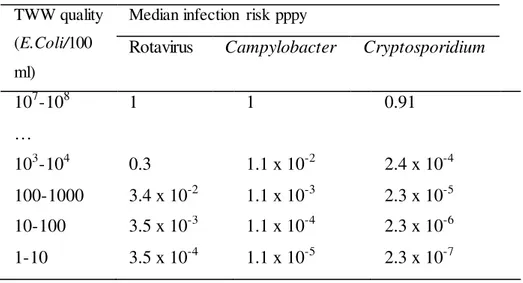
The QMRA procedure is illustrated in Table 2 for the consumption of TWW-irrigated lettuce.
As it can be seen, the risk of Rotavirus infection is higher than those of Campylobacter and Cryptosporidium and thus Rotavirus infection risk must be used to assess the safety of TWW irrigation practice. In particular, the calculation shows that, for the parameter value selected, the required rotavirus reduction from TWW to lettuce ingestion is 6 log units. This total reduction is achieved partially by wastewater treatment and partially by a selection of post-treatment health-protection control measures (i.e. low-cost drip irrigation techniques, pathogen die-off, produce washing and peeling, etc.).
Table 2. Unrestricted irrigation: median infection risks from the consumption of TWW-irrigated lettuce estimated by QMRA-Monte Carlo simulation (WHO, 2006)
TWW quality (E.Coli/100 ml)
Median infection risk pppy
Rotavirus Campylobacter Cryptosporidium
107-108 1 1 0.91 … 103-104 0.3 1.1 x 10⁻² 2.4 x 10⁻⁴ 100-1000 3.4 x 10⁻² 1.1 x 10⁻³ 2.3 x 10⁻⁵ 10-100 3.5 x 10⁻³ 1.1 x 10⁻⁴ 2.3 x 10⁻⁶ 1-10 3.5 x 10⁻⁴ 1.1 x 10⁻⁵ 2.3 x 10⁻⁷
In the study, the risk associated with the use of TWW to grow tomato crops, evaluated by the described DALY tool, was compared with the very restrictive approach adopted by the Italian legislation for TWW reuse (Ministry Decree, n. 185/03).
1.2 RECENT RESEARCHES
Conventional wastewater treatment consists of a combination of physical, chemical, and biological processes and operations to remove solids, organic matter and, sometimes, nutrients from wastewater. General terms used to describe different degrees of treatment, in order of increasing treatment level, are preliminary, primary, secondary, and tertiary and/or advanced wastewater treatment.
Natural treatment methods are mainly used for wastewater treatment from decentralized houses, small settlements, dwelling, hotels, recreational facilities, restaurants and summer camps, smaller municipalities or their parts, usually up to 2000 p.e. (population equivalent). According to the composition of wastewater, these methods are also applicable for treatment of industrial wastewater from the food processing industry, trade facilities (workshops) and selected small industrial plants, landfill leachate treatment, organically low-loaded agricultural runoff and wastewater agricultural facilities, polluted storm water runoff, erosion washes of polluted surface water. Natural technologies of wastewater treatment are especially represented by soil filters (SF), constructed treatment wetlands (CTW) and waste
stabilization ponds (WSP) that have been used in the last thirty years. Relatively considerable effort is devoted to the possibility of using aquatic plants systems in different arrangements.
The reuse of wastewater in agriculture is gaining wider acceptance in many parts of the world. It represents an agronomic option adopted, even more frequently, in regions with water scarcity, growing urban populations, and rising demand for irrigation water (Meli et al., 2002; FAO, 2011). In this section, results of recent researches were briefly reported in order to give value to TWW reuse practice. In particular, even more researches are focusing on the evaluation of the effects of TWW reuse practice on row crops, mainly because these crops, due the their edible part, may be greatly affected by contamination. The research group of the Di3A of the University of Catania has conducted in these recent years several experiment on TWW reuse in agriculture, evaluating the effects on soil, irrigation system performance and on row crops productivity and quality characteristics (see Aiello et a., 2007; 2013; Barbagallo et al., 2012; Cirelli et al., 2012; Castorina et al., 2015.) These studies have confirmed the suitability of TWW reuse practice in agriculture; low effects on crops main features were
evidenced from these studies. In particular, following the WHO standards the cited researches provided fundamental results for standardized the reuse practice procedures.
Other researchers were in the same direction of those carried out by the University of Catania. For example, Gatta et al., (2014) have revealed interesting aspects of the TWW reuse: (i) yields of the irrigated tomato fruits were not significantly different from those obtained with fresh water; (ii) for all the TWW irrigation treatments, the most important morpho-qualitative parameters of the processing tomato fruit (i.e., dry matter content, pH, soluble solid content, colour parameters) were in agreement with those reported in the literature; and (iii) tomatoes microbial quality was very good for all the thesis.
As confirmed by studies (Lopez et al., 2006), Compared to olive trees grown in rainfed conditions, irrigation with the ―simply‖ treated effluents caused a yield increase of 50%, improving fruit characteristics very important for marketing table-olives such as weight and flesh to pit ratio.
Other studies carried out by Lubello et al. (2004) confirm that treated wastewater can be reused on nurseries irrigation. In fact, The refinery treatment by filtration and disinfection with PAA (Peracetic Acid) and UV together were very effective in
bacteria removal. The value of 2 Total Coliforms MPN 100 ml-1 set by law for unrestricted irrigation was constantly satisfied. The tertiary effluent can be considered as an important source of fertilizer for some container grown plants (e.g., Juniper, Myrtle and Cypress), with positive economic and environmental aspects related to reduction of synthetic fertilizers use (Lubello et al., 2004).
A recent research conducted by A. Christou (2014) has evaluated the effects of tomato crop irrigation with treated WW effluent, as compared to groundwater irrigation, on soil geochemical properties, fruit safety and crop productivity. Irrigation using either effluent did not significantly affect soil pH, organic C or heavy metal content. Also, no impacts of WW irrigation on crop productivity, as compared to control irrigation, were registered. Furthermore, the heavy metal content of tomato fruits and leaves in all irrigation treatments was below the MPLs set for fruit safety and the critical tissue concentration for phyto-toxicity. Moreover, no microbiological contamination (TC, FC, E. coli, Salmonella spp., Listeria spp.) of tomato fruits was found, in any treatment.
1.3 WASTEWATER REUSE AS SUSTAINABLE PRACTICE IN AGRICULTURE
The use of treated wastewater (TWW) for crop irrigation is an alternative to the scarcity of quality water suffered in many countries of the Mediterranean basin. TWW can provide an important saving of fertilizers (i.e. nitrogen and phosphorus) as well as benefits for the environment, by avoiding the discharge of contaminated water into public waterways (Martínez et al., 2013) and providing consistent available water throughout the year. It is estimated, that the reuse of wastewater could reach 15% of the world‘s water consumption (Asano, 1998). Possible uses of reclaimed wastewater include irrigation of food or non-food crops, irrigation of green or leisure zones (with or without direct contact), aquaculture, industry (water for refrigeration, cleaning), municipal use and aquifer recharge, among others (Cirelli et al., 2009). The use of reclaimed wastewater for crop irrigation has been a common practice for some years now. This agricultural use has been tested in crops such as forage (Bole and Bell, 1978), alfalfa and radish (Rosas et al., 1984), wheat and maize (Al-Jaloud et al., 1993), trees (Tznakis et al., 2003) and vegetable crops (Rosas et al., 1984;
Keraita et al., 2007; Aiello et al., 2007; Cirelli et al., 2012). Moreover, different practices involving wastewater reuse, in terms of irrigation techniques (surface and subsurface drip irrigation) (Cirelli et al., 2012), cultivation systems (Pedrero and Alarc‘on, 2009) and treatments technologies, (Pedrero et al., 2010, Barbagallo et al., 2003; Consoli et al., 2011; Barbagallo et al., 2012) have been tested.
The use of wastewater for crop irrigation is perhaps one of the main sources of pathogenic microorganism contamination (Assadian et al., 2005; Aiello et al., 2013). The risk associated with this type of water depends on the presence of pathogenic microorganisms and chemical substances, as well as on environmental conditions, safety measures, treatment types, irrigation methods and type of grown crops. Among the variety of existing crops, vegetables are the most vulnerable to contamination (Armon and Shelef, 1991), especially when they are consumed fresh, thus demanding high-quality water for irrigation.
1.3.1 Effects on soil characteristics
In recent years, a number of Mediterranean countries have experienced severe water supply and demand imbalances, with more frequent and longer lasting periods of drought. In particular, several regions in Italy have suffered successive droughts over the last 10 years (Coppola et al., 2004). Due to water scarcity, agricultural activities (using more than 50% of the total water resource extracted) are penalized, while higher priority demands (domestic and industrial) are satisfied. Benefits apart, treated wastewater can be used for irrigation under controlled conditions to minimise hazards from pathogenic and toxic contaminants of agricultural products, soils, and ground water (Al-Nakshabandi et al., 1997). Furthermore, hydrological soil properties are specially sensitive to wastewater compounds. Indeed, numerous studies (Pescod, 1992; Bresler, 1981; Tarchitzky et al., 1984; Vinten et al., 1991; Aiello et al., 2007; Cirelli et al., 2012) have highlighted hydraulic conductivity reduction in wastewater irrigated soil, ascribing it to a partial biological clogging of soil pores due to increased biomass and suspended solids. Recycled wastewater applications generally result in a disturbed layer at a soil depth of 0.3 m, exhibiting
changes in physical properties (increase in bulk density). The investigated layer shows reduced soil porosity, translation of pore size distribution towards narrower pores and a consequent decrease in permeability. Near the surface level, soil samples (collected around the emitter) show a certain growth in microbial content (E. coli and FS) (Aiello et al., 2007).
Impact from wastewater on agricultural soil, is mainly due to the presence of high nutrient contents (Nitrogen and Phosphorus), high total dissolved solids and other constituents such as heavy metals, which are added to the soil over time. Wastewater can also contain salts that may accumulate in the root zone with possible harmful impacts on soil health and crop yields. The leaching of these salts below the root zone may cause soil and groundwater pollution (Bond 1999).
1.3.2 Effects on crop production and quality
The main health risks are associated with contamination of crops or groundwater by wastewater due to its chemical composition being somewhat different from most natural waters used in irrigation (Pereira et al., 2002). Urban
wastewater generally contains high concentrations of suspended and dissolved solids (chloride, sodium, boron and heavy metals) and little of any added salt is removed during conventional (secondary and tertiary) treatments. Pathogenic organisms (Helminths, Enteric bacteria, Enteric viruses) constitute one of the main health concerns in the use of wastewater for irrigation.
The safety of reclaimed water (e.g., municipal effluent from the Wastewater Treatment Plant (WWTP) is source of concern; toxic chemicals are one of dominant hazardous components in wastewater (Asano et al., 2007 and Xu et al., 2014). These residual toxic chemicals in WWTP effluents would accumulate and cause long term potential risks on human health (Asano et al., 2007). Considering the non-biodegradability and the persistent nature of heavy metals, the control of their levels in reclaimed water intended for irrigation is of vital concern. Indeed, such trace-elements may enter the human body via consumption of food crops and can cause various toxic effects (Khan et al., 2013, Li et al., 2012 and Liu et al., 2011).
Study carried out by Aiello et al. (2007) revealed in microbial crop analysis a slight accumulation of E. coli on tomato fruits irrigated with wastewater, with a concentration of about 40
MPN/100 for 80% of the samples. Results also showed that tomato yield increased when irrigated with wastewater. Notwithstanding the combination of tertiary treated wastewater and irrigation technologies (DI and SDI), a not negligible level of contamination on tomato fruit and irrigation soil surface was determined; these results confirm that CW effluents cannot be used for irrigation without additional disinfection. (Aiello et al.,2007).
Wastewater is a rich source of plant food nutrients. Empirical studies, presented in an earlier section of this paper, show that the impact of wastewater irrigation on yield, varies from crop to crop. If the crops are under-supplied with essential plant food nutrients, wastewater irrigation will act as a supplemental source of fertilizer thus increasing crop yields. Alternatively, if plant food nutrients delivered through wastewater irrigation result in over supply of nutrients, yields may negatively be affected.
1.3.3 Effects on irrigation systems and biofilm growth Modern irrigation (surface drip irrigation, and subsurface drip irrigation) has the possibility of adequately applying water
and chemicals both in respect of amount and in location throughout a field soil.
Selecting the most appropriate irrigation technique can reduce the environmental and health risks. Drip irrigation is the safest irrigation technique for wastewater reuse (Capra and Scicolone 2007) applying the reclaimed water onto the soil surface close to the plants. Thus, compared to other irrigation techniques, drip irrigation has the potential to optimize water application and minimize health and crop contamination risks. Nevertheless, clogging is a common problem when using drip irrigation (Ravina et al. 1997). It is generally observed on different components of irrigation systems (filters, pipes and emitters) and consequently can have significant economic impacts for farms. Indeed, irrigation systems become dysfunctional as the uniformity of distribution progressively decreases. This leads to serious yield losses, may generate local leaching and induce additional costs to either clean or replace the damaged irrigation devices. Clogging causes are categorized into physical, biological and chemical (Dosoretz et al. 2011). Physical deposits when using reclaimed water are mainly composed of organic matter, clay and silt-sized aggregates. Chemical precipitation may occur depending on water quality
parameters such as temperature, pH and the concentration of salt. These parameters may induce the precipitation and sedimentation of mineral elements to generate clogging. Treated effluents contain microorganisms and some nutrients that tend to develop a self-protection biofilm. Independently of other causes, the intensity of microbial slime development is usually related to water flow properties.
Biomass growth and disruption are conditioned by flow velocity (Beyenal and Lewandowski 2002; Stoodley et al. 1999; Mahfoud et al. 2008). Under high velocities, biofilm thickness is reduced due to high shear forces at its interface with flow. In addition, cohesion and density increases near to the attachment areas of biofilms as resistance to shear stress (Delron et al. 2007).
Biological clogging is often coupled to physical and chemical deposits (Gilbert et al. 1981; Adin and Sacks 1991) when suspended materials adhere to the biofilm (Figure 1).
Numerous studies have been carried out looking at the effect of wastewater quality on clogging of irrigation system components when using wastewater effluents (Bucks et al. 1979; Capra and Scicolone 2004, 2005; Dehghanisanij et al. 2004; Puig-Bargue`s et al. 2005; Liu and Huang 2009;
Duran-Ros et al. 2009; Bo et al.,2013), without analyzing the physical phenomena involved.
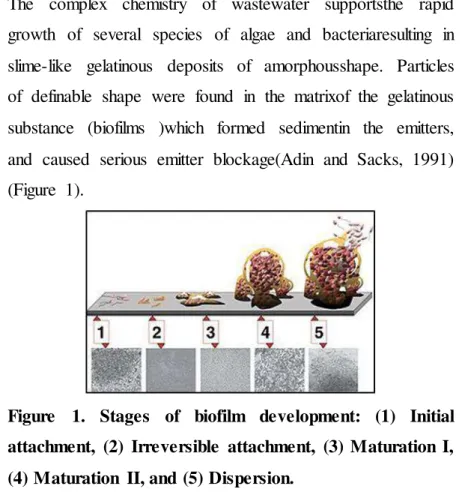
The complex chemistry of wastewater supportsthe rapid growth of several species of algae and bacteriaresulting in slime-like gelatinous deposits of amorphousshape. Particles of definable shape were found in the matrixof the gelatinous substance (biofilms )which formed sedimentin the emitters, and caused serious emitter blockage(Adin and Sacks, 1991) (Figure 1).
Figure 1. Stages of biofilm development: (1) Initial attachment, (2) Irreversible attachment, (3) Maturation I, (4) Maturation II, and (5) Dispersion.
Adapted from: https://en.wikipedia.org/wiki/Biofilm
More than 90% of the clogging composition included biological species and the clogging process was usually
initiated by bacterial biofilms (Gilbert et al., 1981; Taylor et
al., 1995). Although the clogging materials are mainly suspend particles, some of the biofilm bacterial species may also cause emitter clogging through the precipitation of iron, manganese and sulfur mineralsdissolved in reclaimed wastewater (James, 1988; Pitts et al., 1990; Ahin et al., 2005). Microbial cell that grow in association with surfaces often form biofilms, microorganisms immobilized and embedded within an organic polymer matrix (Liu et al.,1994; Kristina et al., 2007; Strathmann et al., 2002). Microorganisms including various bacteria, fungi, protozoa, and metazoa with large quantities, multiple types, and fast growth rates in natural water play an important role in the ecosystem. In fact, over 90 % of microbes adhere to the substrate surface and exist in the form of biofilms (Dong et al. 2002; Kang et al. 2006; White et al. 1998). Biofilm is a 3D heterogeneous and functional aggregation contain in microbial community (bacteria, protozoa and fungi, etc.), solid particulates, extracellular polymers (EPS) secreted by microorganisms and other substances (Capra and Scicolone 2004, 2005; Liu and Huang 2009; Ravina et al. 1992,1997). Although the water quality of reclaimed water reaches basic standards of irrigation, it still contains a certain amount of
pollutants. The nutrients, organic substances, and trace elements in the reclaimed water after secondary or even tertiary treatment can sustain the microorganisms‘ growth. Microorganisms and nutrients can pass through the filter and enter the drip irrigation system and then form biofilms following the ‗‗attachment-growth-detachment-decay‘‘ process (Li et al. 2010; Nakayama and Bucks 1991). The biological species in the biofilm excrete a protective mass of extracellular polysaccharides (EPS), a wide group of polymers that can be highly attached to the cell surface or released as extracellular slime in the surroundings of the cell (Knoshaug et al., 2000).
2. CASE STUDIES IN SICILY
2.1 WASTEWATER AS ALTERNATIVE RESOURCE FOR IRRIGATION IN SICILY
The economical sustainability of the agricultural sector in Sicily (southern Italy) has to cope with the availability and management of water resources for irrigation.
Crop water requirements are, generally, unfulfilled for relevant percentages and the need to use alternative water sources, like urban TWW, is urgent. Moreover, reusing these discharged effluents can significantly reduce or completely remove the impact of these effluents from receiving environments. In addition, TWW reuse for agricultural irrigation reduces the amount of water that needs to be extracted from environmental water resources. TWW can often contain significant concentrations of nutrients, for example nitrogen and phosphate, which might be used as a fertilizer source when the water is recycled for irrigation. In this section, a recent study conducted by Barbagallo et al., 2012 was taken as reference. In the study, the potential of TWW reuse in Sicily was analyzed and irrigated areas, eligible to receive TWW from wastewater treatment plants
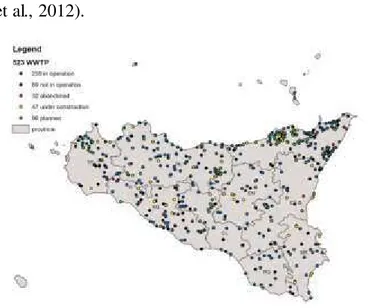
were identified. In particular, among those analyzed, 24 out of 37 irrigation areas were eligible to receive TWW from 59 WWTPs (Figure 2). Overall, TWW potentially reusable was about 87 × 106 m3 y-1, while water deficit was 65 × 106 m3 y
-1
. Obviously, by considering each district, deficit or surplus would still exist. The irrigation districts with a resource surplus may extend their irrigated area or save high quality water for other uses or avoid aquifer overexploitation. TWW volumes coming from the excluded 247 WWTPs (about 117 × 106 m3 y-1) could be used to irrigate extra areas currently not irrigated, or served by private water supplies. This would represent a fundamental opportunity to improve the agricultural sector, to save fresh water, to preserve the environment and to develop the internal marginal areas of Sicily. Of course, this approach would imply a more accurate study to allocate in a correct way the nonconventional resources. TWW may be successfully used, under specific experimental conditions, to irrigate and grow crops that are normally eaten raw. In particular, the risk assessment analysis highlighted that, by applying post-treatment health-protection control measures (such as product washing, disinfection, peeling and/or the natural pathogen die-off after last irrigation), the acceptable rotavirus infection risk was
generally preserved, although E. coli content of TWW was often over the limits set by the Italian legislation (Barbagallo et al., 2012).
Figure 2. Potential TWW reuse in Sicily
2.2 CASE STUDY DESCRIPTION
The experimental activity of this PhD thesis was carried out in an open field near the constructed wetland (CW) system of S. Michele di Ganzaria (37°17‘29.27‖N 14°25‘16.76‖E) in the east part of Sicily. The study was conducted during 3 different irrigation seasons in 2013, 2014 and during the first months of 2015 on different vegetable crops. The constructed wetland unit treats secondary urban effluents from the
conventional wastewater treatment plant of the municipality (approximately 5,000 inhabitant) (Figure 3). The area has a Mediterranean-semiarid climate, with an average of 500 mm/year of rain.
The experimental plants is equipped with 4 constructed wetland (Horizontal Sub Surface Flux) reed beds (Figure 4) (i.e. surface area of about 2,000 m3) followed by three storage reservoirs (Figure 5), for the tertiary treatment of wastewater coming from the conventional treatment plant. The reed beds 1, 2 and 3 are vegetated with Phragmites australis, the bed 4 is vegetated with Typha latifolia. During the year 2013, TWW were collected from the outlet of HSSF-2, in 2014 from the outlet of HSSF-3. The flow rate of the systems is about 240 m3/day, and the hydraulic loading rate is about 0.11 m3/day. The filter bed depth is of 0.6 m, filled with gravel size of 5-15 mm, with porosity of 0.4.
The Hydraulic Retention Time (HRT) of TWW in each CW system is about 2 days.
while industrial cultivar of tomato Solanum licopersicum (var. Missouri) and eggplant of two different variety (Solanum melongena var. Tasca and var. Gloria) were tested in 2014.
During the last cycle, autumn-winter 2015, lettuce of two variety (Lactuca sativa var. Canasta and var. Romana) and cabbage of two variety (Brassica oleracea gongylodes var. red Acitano and var. white Luna) were analysed as test crops.
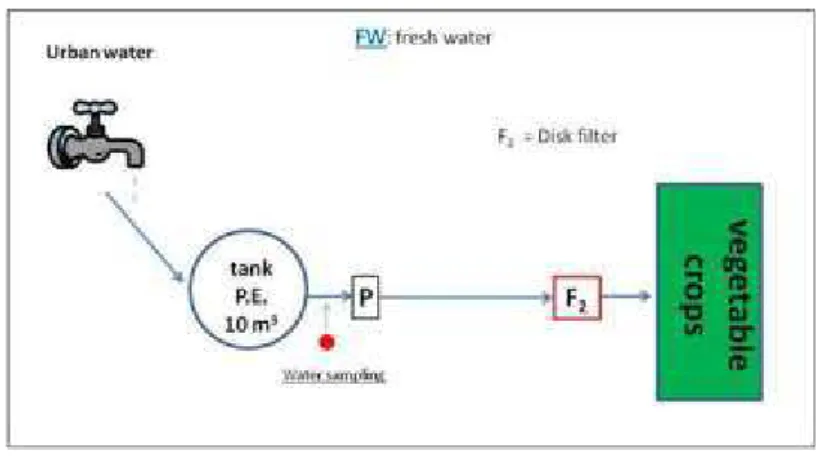
2.3.1 Set up of the experimental tertiary treatment plant During 2013, tertiary treated effluents coming from the horizontal sub-surface flow constructed wetland system (HSSF- 2), after filtration, were reused to irrigate vegetable crops.
Before to be supplied to the experimental irrigation field, CW wastewater were stabilized within a reservoir (i.e. lagoon), that has a capacity of about 50 m3, hydraulic loading rate of 2.5 L/day and a nominal hydraulic retention time of 20 days. Wastewater passed in a storage tank (earth made), with a capacity of 100 m3 and then filtered by sand filter (model Irritec EGV 2‖ diam. 600 mm, max flow rate 28 m3
- Reclaimed wastewater (RW) - Fresh water (FW).
Figure 7: Lay-out out of the FW supplying system
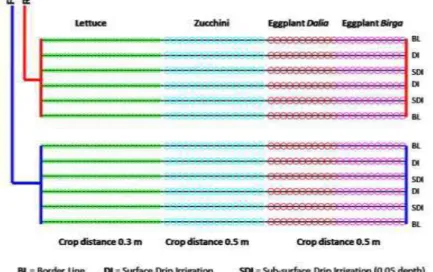
Each plot was equipped with 4 blocks (Figure 8), consisting of 2 surface drip irrigation laterals (DI), and 2 sub-surface drip irrigation laterals (SDI), this latter buried at 0.05 m of depth. To avoid evaporation increasing due to bordering conditions (which can be significant, especially under windy conditions) the two outermost laterals (BL) of each plot were planted and irrigated, but not sampled during the experiment. The total length of the irrigated plots was 30 m. All the plots (supplied byRW and FW) were equipped with polyethylene laterals with 16 mm external diameter. All the laterals were
supplied by in-line labyrinth drippers (model i-siplast Tape) with a theoretical discharge rate of 0.8 L h-1 at a pressure of 55 kPa.
Pipelines thickness was 8 mil and emitters were spaced at 0.1 m; distance between rows was 1.2 m. Each plot was equipped by flow meters and manometers.
Figure 8: Experimental irrigation field for vegetable crops irrigation realized during summer 2013
(HSSF- 3), after a filtration, were reused to irrigate vegetable crop. Differently from the previous year of trial, in 2014, HSSF-3 outlets were treated by two different lines, named ARU1 and ARU2 (see Figures 10 and 11).
Figure 9: ARU1 treatment system
The treatment system ARU 1 includes in series: horizontal sub-surface constructed wetland (CW), lagoon basin (of about 50 m3), storage reservoir (of about 100 m3), and sandy filters (model Irritec EGV 2‖), while the ARU 2 includes in series: horizontal sub-surface CW, sandy filters, ring filters (Irritec EUV rotofilter with automatic backwash) and ultraviolet (UV) system (WEDECO AG, LBX 10).
The UV unit was equipped with a three low-pressure mercury lamps (wavelength (λ) = 254 nm) that provide for a maximum flow rate of 6m3 h−1, max pressure 16 bar and a minimum dose of 700 J cm−2 to the water (minimum value for a efficiency water disinfection treatment) with 70% transmittance (Figure 11).
The ARU1 system may represent a valid treatment option for those countries where the irrigation reuse practice is not limited by binding standards, like countries of middle east, or where the WHO guidelines are adopted.
The ARU2 treatment option guarantees the complete removal of the microbiological component of TWW, thus implying high cost for disinfection. The treatment strategy is most suitable in those countries, like Italy, where the high quality standards of the reuse regulation have to be meet.
Figure 11: UV system, mod. WEDECO AG, LBX 10 used in ARU2 treatment system
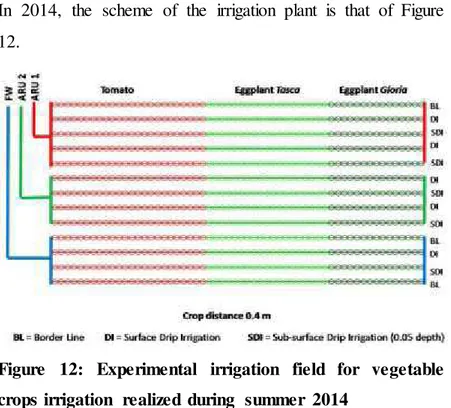
In 2014, the scheme of the irrigation plant is that of Figure 12.
Figure 12: Experimental irrigation field for vegetable crops irrigation realized during summer 2014
In 2014, the total length of the irrigated plots was 30 m. All the plots- (supplied by ARU 1, ARU 2 and FW) were equipped with polyethylene laterals with 16 mm external diameter. All the laterals were supplied by in-line labyrinth drippers (model i-siplast Tape) with a theoretical discharge rate of 0.9 L h-1 at a pressure of 70 kPa.
Emitters were spaced at 0.2 m and the distance between rows was of 1.1 m.
Figure 13 Eggplant (Cv Gloria and Tasca) and Tomato (cv Missouri) irrigated by TWW in 2014 – summer period Tomato (Solanum licopersycum L., Cv Missouri) and eggplant (Solanum melongena L.) of two cultivars Tasca – Ta and Gloria – Gl were both transplanted in May 2014 (Figure
13), at density of 2.2 plants m-2; three replicates of 10 tomato, 5 for eggplants were considered for the all the determinations and comparisons.
For the autumn-winter cycle of the year 2014 (showed in Figure 14), on October 2014 lettuce of two variety (Lactuca
sativa L., Cv Canasta and Romana) and cabbage (Brassica
oleracea gongylodes var. red Acitano and var. white Luna) were planted at density of 3.7 plants m-2; three replicates of 10 lettuce and 10 for cabbage for each variety were used for the all the determinations and comparisons (Figure 15). The experimental scheme includes in-line labyrinth drippers (model i-siplast Tape) with a theoretical discharge rate of 0.8 L h-1 at a pressure of 55 kPa.
2.3.2 Irrigation scheduling for row crops
Irrigation scheduling was based on crop evapotranspiration (ETc, mm d-1) estimation. ETc rate was calculated by
multiplying the reference evapotranspiration (Et0, mm d-1) via
Penman-Monteith method (Allen et al., 1998) with the FAO-56 crop coefficient (Kc). The experimental site was equipped
with an automated meteorological station, installed close to the experimental field for meteorological data monitoring. A Class A PAN evaporimeter was also installed at the field and used for data comparison. The main measured meteorological data were the following:
- Air temperature (°C); - Air humidity (%); - Solar radiation (W m-2);
- Wind velocity and direction (ms-1); - Rain (mm).
The value of Kc was assumed equal 1.0 during first cycle of
the trial, in summer 2013, for all crops.
For second cycle, spring-summer 2014, a variable Kc was
assumed for tomato and eggplant. In particular, at beginning (30 days from plantation) of the growth phase, a KC ini of 0.6
days from planting) was used, and a KC end = 0.9 was used for
the final growth cycle phases.
During the winter cycle of 2014, a Kc,ini=0.7 and a Kc,end=1.1
were adopted for both lettuce and cabbage.
Because soil was mulched, a coefficient Kr to adjust this
situation was applied. Kr was assumed equal to 0.65 for all
the treatments in 2013 and 2014.
Irrigation water requirement (IR, mm g-1) was thus estimated as:
IR = ET0x KC x KR (1)
Water volume (V, m3g-1) for each irrigation was calculated as in Eq.2, where A is the experimental field area.
The time (d, hour) was calculated by Eq.3, where q is the flow rate of each emitter and n the emitters number per plant.
V = IR x A x 103 (2)
d = (V x 103) / (q x n) (3)
Irrigation was applied three times per week in the amount necessary to replace 100% of the established volume, since the previous irrigation. Irrigation rates were adjusted when necessary due to effect of rainfall. Because irrigation water was controlled, deep percolation and runoff were assumed as negligible. The
2.3.3 Water sampling and irrigation system efficiency In order to evaluate the efficiency of the different water treatment systems implemented during the years of trial (i.e. 2013-2015), TWW samples were collected in different selected points (see Figures 6, 9 and 10).
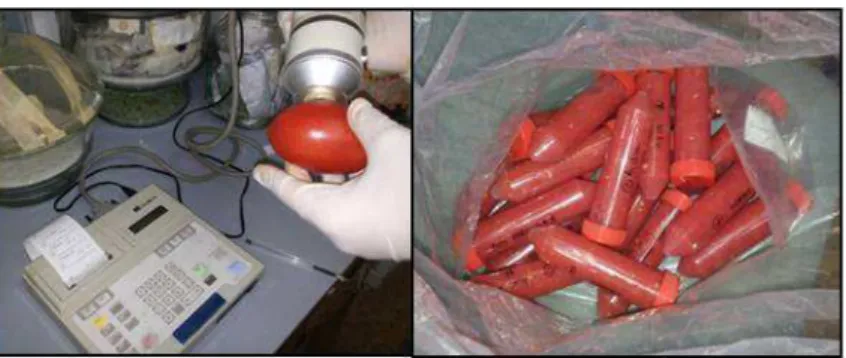
To analyse the main physical-chemical and microbiological TWW characteristics, two sterile samples of 1000 mL were collected (Figure 19).
Figure 19: TWW samples collected during 2013-2015 period
When collected TWW samples were stored at 4°C in a portable fridge and transported to laboratory for analyses. The water sampling campaign has a frequency of 2 times per months, approximately every 15 days.
Standard methods (APHA, 1998) were adopted for laboratory analyses aiming at measuring the parameter reported in Table 2.
Table 3: Physical-chemical and microbiological parameters investigated in laboratory
Water analysis
Chemic-physic and Microbial
pH Sulphate (mg/l) C.E. (µS/cm) Potassium (mg/l) BOD5 (mg/l) CaCO3 (mg/l) COD(mg/l) Magnesio (mg/l) TSS (mg/l) Iron (mg/l) TN (mg/l) SAR TP(mg/l) Surfactant (mg/l) Sodium (mg/l) E. coli (UFC/100ml) Chloride (mg/l) Salmonella
2.3.4 Soil contamination and hydraulic determinations To determine the changes induced in the soil hydraulic and transport properties, laboratory analyses were performed to determine the soil quantitative and qualitative characteristics.
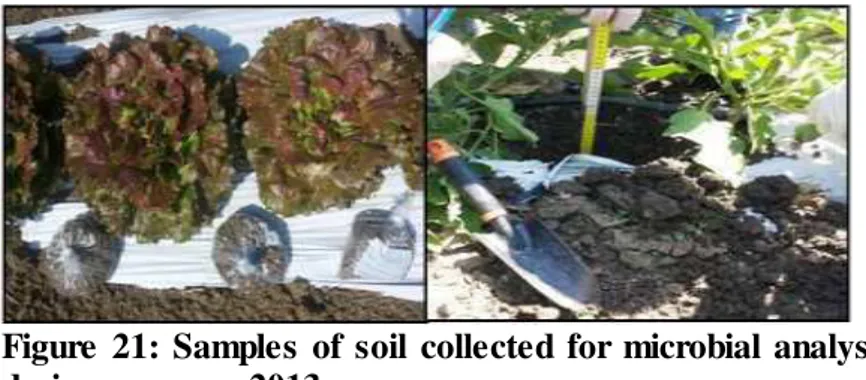
Soil contamination analysis assessed E.coli and Salmonella concentrations within soil columns (i.e. at surface, 0.15 and 0.3 m of depth) near the emitters in the drip (DI) and sub-drip irrigated (SDI) rows. Soil samples were collected in the sectors three times for each experimental cycles. Laboratory processing for soil microbial and constituent analyses were performed as outlined in APHA (2005). Soil samples microbial levels (CFU 100 mL-1) were enumerated using membrane filtration techniques in 100 g of soil samples.
Figure 21: Samples of soil collected for microbial analysis during summer 2013
2.3.5 Crop response
During first experimental cycle in 2013, lettuce heads were harvested in mid-September, corresponding to their commercial stage; zucchini were harvested from mid August through the end of September with a frequency of two times
per week; eggplants were harvested, twice a week, from mid September to the first week of November 2013. During second cycle in 2014, eggplant were harvested from July 21st to September 5th, with a frequency of two times per week; the industrial tomato fruits were harvested only two times during the cycle.
During each harvest operation, for each sector and each repetition, the number of fruits and the fruit weight, were registered; for lettuce, plant weight and the number of leaves per plant were determined (Figure 22).
Figure 22: Lettuce var. Romana (left) and Canasta (right), in winter 2014
Additional laboratory analyses were carried out on fruit quality for all crops to investigate total Coliform, Escherichia
Coli, Salmonella and Listeria. Samples of fruit were collected 3 times during each irrigation cycle for laboratory evaluations and to assess their quality characteristics. For each repetition on DI and SDI sectors, 2 fruits per plants were collected with
sterile gloves and tools. Samples were stored in a fridge at 4°C and then transported to laboratory for analyses (Figure 23).
Figure 23: Laboratory procedures on tomato fruits to determine skin colour (on the left) and antioxidant substance (on the right) – year 2014
Other investigated parameters were: plants height (cm), steam diameter (cm), fresh and dry weight (g), fruit colour, length of fruit (cm), diameters (cm), average weight fruit (g), plant production (g), number of fruit per plant, total yield (kg m2) (Figures 24-26).
Figure 24: Laboratory procedures on tomato fruits to determine fresh and dry weight – year 2014
During the years of experiment, the number of leaves and the total soluble solids (Brix) were evaluated for lettuce and cabbage. Antioxidant substances were also determined.
Figure 25: Lettuce samples in 2013
The effects of water quality, QW (TWW versus FW), micro-irrigation system (IS) performance, and of their interactions on crop production features (i.e. total yield, fruit numbers and fruit mean weight) were evaluated through the analysis of variance (n-ways ANOVA with randomized block design) at significant levels of 0.01<P<0.05, 0.001<P0.01 and P<0.001. An experimental split-plot design was adopted for each crop. The following experimental factors were statistically analysed: (i) water qualities (QW) (i.e. TWW and FW); (ii) irrigation systems (IS) (i.e. surface drip irrigation and sub-surface drip irrigation) and, for eggplants, lettuce and cabbage, (iii) crop cultivars (CV).
The data set obtained from the study was analysed using the ―CoStat‖ software package (version 6.4, CoHort Software). A n-way fixed-effects general linear model (GLM) analysis of variance (ANOVA) was used to determine the effects of RW reuse. When the interaction was significant, data were presented as separate curves to show any differences in the trend. When significant differences were found, a Student-Newman-Keuls post hoc multiple comparison procedure was used to assess significant differences between the individual means.
In this study, polyphenols determinations were carried out as outlined by Soengas et al. (2012), with some modifications. HPLC (high-performance liquid chroma-tographic) analysis was performed using a JASCO system equipped with a diode array detector (MD-910 JASCO). The main compounds observed were caffeic, cicoric, chlorogenic, pherulic and sinapic acids. The quantification was based on calibration curves of external standards. All polyphenols were expressed in terms of sinapic acid. Peaks of polyphenol were identified by direct comparison with commercial standards and their spectral and chromatographic properties, with respect to data reported in the literature.
Fruits in 500 g-samples were used to measure microbial contamination after irrigation. E.Coli and TC were enumerated using membrane filtration techniques (APHA, 2005). Salmonella detection protocol was carried out as outlined by APHA (2005).
Contamination effects on products, evaluated in terms of
E.coli, were determined relative to the Italian wastewater reuse standards (M.D. 185/2003) and WHO guidelines (2006).
Fruits samples of 500 g were harvested from each plot and used to measure microbial contamination. Samples were
collected at the experimental field every fortnight before irrigation. In the laboratory, 100 g of fruits, including fruit skin and flesh, were homogenised with 900 mL of sterile water by a stomacher. Then, ten-fold dilutions were conducted within the same medium. Total coliform, E. Coli and Salmonella were measured using membrane filtration techniques (APHA, 1998).The Salmonella detection protocol consisted of a pre-enrichment stage using a solution of buffered peptone water, which is a non-selective culture medium, to revitalise the microorganism.Then, an inoculum culture was prepared in selenite and cystimmedium and incubated at 36±1 °C for 48 h. After the incubation period, several cultures were inoculated and incubated in parallelonss-agar gel to count the number of Salmonella colonies (Giammanco et al., 2002).
Contamination effects on products, evaluated in term of E.
Coli, were analysed at the light of both the Italian wastewater reuse legislation (M.D. 185/2003) and WHO guidelines (2006).
2.3.6 Irrigation system performance
The performance of drip irrigation (DI) and sub-drip irrigation (SDI) laterals was analyzed by evaluating the emission uniformity (EU, %):
Q Q
EU min1/4
100
(4)
the EU is the ratio between the average discharge of the emitters in the bottom 25th percentile (Qmin1/4) and that of all
the emitters (Q), both expressed in (L s-1) (Keller and Karmeli, 1975). The EU was determined at the beginning and at the end of the irrigation season by measuring the discharge from 30 randomly selected emitters along each pipe (DI and SDI) supplying reclaimed wastewater and FW (Figure 27).
Figure 27: Measurements of Emission Uniformity at the experimental site
For subsurface laterals, EU was determined before they were buried and at the end of the irrigation season.
2.3.7 Biofilm determination within the pipelines
During the year of trial 2014, the presence of microbial biofilm was detected within the pipelines and the filtering system. Traditional laterals (named Conv. DI and Conv. SDI) and bacteriostatic types (produced by Irritec Spa) were compared. Bacteriostatic pipelines were processed with two different bacteriostatic substances (typology ―A‖ and ―B‖) at a concentration of 4%. At the field bacteriostatic pipelines (named Bact. ―A‖ and Bact. ―B) were placed in ARU1, ARU2 and FW irrigation schemes in surface positions (Figure 28).
Figure 28: Irrigation scheme for biofilm growth detection
Small samples of pipelines (i.e. 0.3 m) were collected from June to September and analysed for microbial biofilm detection (Figure 29).
Figure 29: Samples of pipelines collected for microbial biofilm detection in 2014.
Laboratory procedures were adopted for detecting the total number of CFU for each centimetre of sampled pipeline (external diameter 16 mm) and the number of negative Gram bacteria.
3. RESULTS
3.1 WASTEWATER TREATMENT PLANTS
RELIABILITY
Table 4 summarizes the physical-chemical and microbial analyses on TWW and FW during first crop cycle in 2013.
Table 4: Mean concentration and standard deviation of physical-chemical and microbiological parameters
Parame te r
Me an value and standard de viation (in bracke ts) Italian RW re use limits (MD 185/2003) T WW samplin gppoint0 T WW samplingpo int1 T WW samplingpo int2 T WW samplingpo int3 FW T SS (mg L-1) 24.5 (17.9) 9.1 (6.8) 60.0 (45.8) 39.3 (26.6) n.d. 10 BOD5 (mg L-1) 30.1 (6.7) 14.4 (2.4) 26.3 (13.6) 19.4 (7.1) n.d. 20 COD (mg L-1) 62.2 (22.8) 40.2 (25.4) 81.8 (24.3) 65.9 (32.7) n.d. 100 pH 7.5 (0.08) 7.3 (0.03) 8.2 (0.74) 7.8 (0.3) 7.6 6-9.5 EC (dS m-1) 1.01 (0.03) 1.09 (0.05) 1.1 (0.06) 1.1 (0.06) 0.8 3.0 T N (mg L-1) 13.6 7.3 (4.4) 2.9 (3.6) 2.6 (3.3) 0.0 35
Data annual means and standard deviations (± in brackets) were compared with Italian recommended limits (Ministerial Decree n. 185/2003). Water contamination by E. coli varied considerably during the trials at the different sampling points from 103 to 105 CFU/100 mL. None of the TWW samples analyzed in 2013 had E. coli concentrations below the mandatory limit of 50 CFU/100 ml. For 92% of the samples, concentration values were higher (up to 1.7 x 10⁵ CFU/100 mL) than the permitted upper threshold (200 CFU/100 mL) (Figures 30 and 31). Salmonella was not detected in the RW samples. In 15% of samples, E. Coli contamination was above the value of 104 CFU/100 mL fixed by the World Health Organization; this limit was fixed for the ―unrestricted irrigation‖ scenario, in order to reach a median design risk for rotavirus infection of 10-3pppy (per patient per year), considering a 2-3 log unit reduction due to rotavirus die-off between last irrigation and consumption (Figure 5). In particular, according to WHO Guidelines (2006), TWW adopted in this experiment might be used for vegetable crop irrigation by implementing some post-treatment health protection control measures. For example, up to 5 log unit of microbial reduction could be achieved by washing the produce with clean water, disinfection and peeling. The
application of these post-treatment health-protection control measures assures the required log units reduction of E. coli for the tolerable rotavirus infection risk.
Results of the physical-chemical and microbiological analysis on TWW of our study case for the period 2013-2015 are reported in Figures 30-34. 0 20 40 60 80 100 120
CW Inlet CW Outlet Stabilization reservoir
outlet
Filter Outlet or Irrigation system Inlet
m
g
L
-1
BOD COD
Figure 30: BOD and COD concentration in TWW during the year of trial 2013.
Figure 31: E. Coli concentrations in TWW during the year of trial 2013
Figure 32: BOD , COD and TSS concentration in TWW during the year of trial 2014
Figure 33: Microbial concentrations in TWW during the year of trial 2014 – ARU1 treatment system
Figure 34: Microbial concentrations in TWW during the year of trial 2014 – ARU2 treatment system
The emission uniformity (first cycle – summer 2013) of DI and SDI laterals (Figure 35) indicates reductions of 12 and 18% in TWW and FW, respectively. Microbial biofilm growth within the pipelines and the emitters may have caused these reductions, as confirmed by recent literature (Hiskakis et al., 2011; Gamri et al., 2014). In particular, the presence of the microbial biofilm, (i.e. a heterogeneous and functional aggregation containing microbial community), was confirmed in our study (i.e. colonies of Streptococcus
Faecalis and Serratia marcescens) by laboratory analyses. No significant variation in the EU was observed between the two micro-irrigation techniques (DI versus SDI).
90 78 93 82 93 75 91 75 0 20 40 60 80 100 EU ( % ) DI SDI DI SDI RW FW
before planting after harvest
Figure 35: EU values during the year of trial 2013 for TWW (or RW) and FW irrigation systems
Figure 37: EU values during the year of trial 2014 (winter period) for TWW (or RW) and FW irrigation systems
3.2 SOIL MONITORING
Physical-chemical analyses carried out on soil samples were reported in Tables 5 and 6 for the year of trial 2013 and 2014, respectively.
Table 5: Physical-chemical analysis on soil samples collected in 2013 Clay (%) 50.2 Silt (%) 18.12 Sand (%) 31.67 pH 7.83 CE (µS/cm) 155 Nitrogen (%) 0.12 ORGANIC matter 2.46 Phosphorus (ppm) 87.16 Total limestone (%) 4.75 Mg (ppm) 434.37 Na (ppm) 104.5 K exchangeble (ppm) 581.5 K20 (ppm) 697.8 Ca (ppm) 6615.6
Data of Table 5 refers to soil samples collected prior the TWW reuse experiment start.
Table 6: Physical-chemical analysis on soil samples collected in 2013 Clay (%) 43.15 Silt (%) 17.84 Sand (%) 39.01 pH 7.70 CE (µS/cm) 160 Nitrogen (%) 0.11 ORGANIC matter 1.37 Phosphorus (ppm) 46.23 Total limestone (%) 2.92 Mg (ppm) 456.25 Na (ppm) 122.50 K exchangeble (ppm) 643.00 K20 (ppm) 771.60 Ca (ppm) 6355.21
Microbial analyses conducted during 2013 on soil sampled at different depths within the experimental field revealed the presence of E.coli, with a maximum concentration of 2 .101 CFU g-1 at 0.10 m beneath soil surface (Figure 38). In this study, and as confirmed in the literature (Aiello et al., 2007; Cirelli et al., 2012), a certain microbial persistence was individuated along the investigated soil profile. No Salmonella contamination was detected in soil samples.