Marco Romano
Università di Salerno
Dottorato di Ricerca in
Informatica,
X Ciclo
Advisor: Prof. Giuliana Vitiello
Co- Advisor: Prof. Athula Ginige
Coordinator: Prof. Giuseppe Persiano
DESIGNING
USABLE
MOBILE
INTERFACES
Ringraziamenti
Questa dissertazione raccoglie gli sforzi profusi in ambito scientifico durante i tre anni del corso di Dottorato di Ricerca in Informatica. Essa, se da un lato sintetizza i risultati scientifici ottenuti, rappresenta, dal punto di vista umano, il percorso di crescita e trasformazione che mi ha guidato nella realizzazione a livello personale. È per tale motivo che all'interno di un lavoro scientifico mi sento il dovere di ringraziare non solo le persone che mi hanno supportato in ambito accademico ma tutti coloro i quali hanno dato peso e colore a questo percorso di vita-‐studio.
I primi ringraziamenti sono rivolti alla Prof.ssa Giuliana Vitiello e al Prof. Athula Ginige, i miei advisors scientifici in terra patria e straniera. Giuliana della mia formazione accademica ha tracciato la strada consentendomi di crescere confrontandomi con tematiche e sfide importanti oltre che stimolanti. Athula mi ha mostrato il traguardo finale rafforzando la convinzione nei miei mezzi e permettendomi di vivere un'avventura che pochi al mondo possono dire di aver vissuto.
Ringrazio la Dott.ssa Monica Sebillo, alla quale sono grato per aver per prima creduto in me e per avermi trasmesso la passione per la Ricerca, e la Prof.ssa Genny Tortora per tutti i consigli spontanei e il supporto che non ha mai fatto mancare.
Questo ciclo di tre anni inoltre non avrebbe potuto portare buoni risultati se:
• Luca Paolino non avesse speso tanto tempo a:
a) trasmettermi la sua esperienza b) dare consigli accademici e di vita c) dire “te vuo' movere”
• Vincenzo Del Fatto e Davide De Chiara non avessero condiviso:
a) idee
b) conoscenza c) caffè
• Pasquale Di Giovanni non fosse stato
a) supporto morale
b) compagno di confronti accademici c) food provider
• tutti i ragazzi del Laboratorio 8 non avessero speso energia e convinzione (nel
sopportarmi) nei loro lavori di tesi che hanno significativamente arricchito di contenuto ed esperienza il mio.
Il supporto della famiglia è stato fondamentale in ogni momento di questo percorso. In particolare sentire mio padre e mia madre fieri di me è stato la forza portante di tutte le mie avventure oltreoceano e non solo. Per la loro comprensione, severità e supporto sarò per tutta la vita in debito.
Grazie ad Andrea che mi ha insegnato a non prendermi troppo sul serio e a vivere la vita godendone il presente.
Grazie agli amici di sempre e ai nuovi arrivati per essere stati semplicemente se stessi.
Grazie all'Università di Salerno, che è stata “casa” per questi lunghi undici anni di studi accademici.
Acknowledgments
This dissertation presents my efforts in the science field made during the three years of doctoral program in Computer Science. Not only does it summarize the obtained scientific results, but it also represents the path of growth that led me to the realization of my potential. Therefore, in this scientific work it is my duty to thank both people who supported me in academia and those who gave weight and colour to what I consider a life-‐study career.
First of all, I would like to thank my scientific advisors Prof. Giuliana Vitiello and Prof. Athula Ginige. Giuliana charted the academic course that allowed me to grow by dealing with relevant topics and exciting challenges. Athula showed me the finishing line and improved my self-‐confidence. He gave me the opportunity to live a one-‐life experience that hardly anyone else may say to have done.
Moreover, I feel grateful to Doc. Monica Sebillo for believing in me as first and influencing me with her passion for research. I feel also grateful to Prof. Genny Tortora for her genuine advice and endless support.
This three year cycle could not have been the same if:
• Luca Paolino had not spent so much time on:
sharing his experience, giving me both academic and life advice, saying "te vuo' movere"
• Vincenzo Del Fatto e Davide De Chiara had not shared
ideas, knowledge and coffee packs.
• Pasquale Di Giovanni had not been
my moral support, a good partner to brainstorm a while, my food provider
• the students of Lab8 had not spent energy and conviction on their thesis that have
enriched my work with content and experience.
My family support has been fundamental during the whole cycle. The leading strength of all my overseas and continental adventures was feeling my father and my mother always so proud of me. I will always owe them for their comprehension, strictness and support.
Thanks to Andrea for teaching me not to take myself too seriously and how to enjoy the present.
Thanks to those people that made me feel at home even if I was 16321,28 km away. Thanks to all my friends just for being my friends.
Thanks to University of Salerno, my home for eleven challenging years.
Table of Contents
Chapter 1 -‐ Designing Usable Mobile Interfaces for Spatial Data ... 1
1 -‐ Area of interest ... 1
2 -‐ Broader context ... 1
3 – Research question and Research approach ... 4
4 -‐ Outline ... 7
Chapter 2 -‐ Visual Interface for GIS Applications ... 9
1-‐ Introduction ... 9
2 -‐ Related Work ... 10
3 -‐ Design of a new interface ... 12
4 -‐ Evaluating the prototype ... 23
5 -‐ Summary ... 25
Chapter 3 – Enhancing the Visual Interface with Multimodality ... 26
1 -‐ Introduction ... 26
2 – Design of Framy multimodal interface ... 27
3 – A new challenge: adapting Framy to visually-‐impaired users ... 31
4 -‐ Summary ... 37
Chapter 4 – Use of Framy in other Application Contexts ... 38
1-‐ Introduction ... 38
2 -‐ An application to support the onsite emergency management ... 38
2.1 -‐ The Design Process ... 40
2.2 -‐ The Working Scenario ... 45
2.3 -‐ Related work ... 49
3 – A system based on augmented reality and user profile model to support people during exploration activities ... 51
3.1 -‐ The Framy-‐AR multimodal technique ... 51
3.2 -‐ The customization mode ... 54
3.3 -‐ Related work ... 59
4 – An augmented Geo-‐Community ... 60
4.1 -‐ Representation of the geographical information: regrouping methods ... 61
4.2 -‐ Scenario ... 63
5 – Use of Framy for a Spreadsheet-‐Mediated Collaboration Environment ... 67
5.1 – The field study and user Interface requirements ... 68
5.2 -‐ Interaction design for the collaborative environment ... 71
5.3 -‐ Collaboration in mobility ... 72
5.4 -‐ Extending the MVC model to design the collaborative system architecture ... 74
5.5 -‐ Related work ... 75
6 – Summary ... 76
Chapter 5 – Virtual Keyboard Application ... 79
1 – Introduction ... 79
2 -‐ Related Work ... 80
3 -‐ The Tap and Slide Keyboard ... 82
4 – Empirical usability evaluation ... 84
5 -‐ Summary ... 93
Chap 6 -‐ Discussion and Conclusions ... 95
1 -‐ introduction ... 95
2 – Summary ... 95
3 -‐ New interaction design patterns to visualize Spatial Data ... 97
4 -‐ A New interaction design pattern for Virtual Keyboards ... 102
5 -‐ Design science checklist ... 103
6– Conclusions and future works ... 105
Chapter 1 -‐ Designing Usable Mobile
Interfaces for Spatial Data
1-AREA OF INTEREST
This dissertation deals mainly with the discipline of Human-‐Computer Interaction (HCI), with particular attention on the role that it plays in the domain of modern mobile devices.
HCI concerns with the design and the evaluation of interactive systems. The keyword is “interface”, that is a means of interaction between human and computer. Both human and computer sides of this interaction are object of the study of this discipline. This is why this research field is considered as a multidisciplinary field. Indeed it involves computer science as traditionally conceived, for the design and development of interfaces and applications; psychology, sociology and anthropology for the study of users' behaviors and their interactions with the technology and the real world.
Several disciplines of computer science and human science are involved in the study of the communication between men and machines. On the computer side they range from computer graphics to operating systems and programming languages. On the human side, they range over social sciences and psychology.
The area of interest in the information technologies field (IT) which is nowadays growing more than any other is the Ubiquitous Computing (UC), which is a branch of the HCI. In the last years the main goal of ubiquitous computing has been to support users during their daily activities without being invasive [45]. In his early vision, Weiser, who coined the term, predicted that a great number of different devices would be available as a support for users [122].This is exactly the case of our present society, wherein laptops, netbooks, tablets and mobile phones are extensively widespread.
2-BROADER CONTEXT
Mobile devices today offer a crucial support to a plethora of daily activities for nearly everyone. Ranging from checking business mails while traveling, to accessing social networks while in a mall, to carrying out business transactions while out of office, to using all kinds of online public services, mobile devices play the important role to connect people while physically apart. Modern mobile interfaces are therefore expected to improve the user's interaction experience with the surrounding environment and offer different adaptive views
Chapter 1 - Designing Usable Mobile Interfaces for Spatial Data
of the real world.
Designers should strive for usable mobile applications for two main reasons.
The first motivation is that mobile phones are spreading faster than any other information technology. Currently there are 800 million PCs vs approximately 4.5 billion mobile phones so that Weiser’s visionary prediction on ubiquitous computing [122] has come true:
“... [the age] when technology recedes into the background of our lives”
Indeed, many people possess more than one mobile device (tablet, Pda, smart phone). Some people from Western countries own a mobile device but not a PC. A large number of people in developing countries own mobile devices only whilst they have never seen a PC, so that local governments encourage the diffusion of mobile devices as a means of bringing education to masses. Indeed Jain, in “Middle Of the Pyramid” [65], states that mobile phones can bridge the digital divide of the people in developing countries allowing them to reach part of the remaining world population. So the usability of the mobile interfaces is paramount in order to allow people of any cultural level to be involved in this process. The second motivation is the advanced technological configuration of such devices. Single devices encompass different hardware and software technologies such as camera, GPS receiver, movement sensors, 3D graphics, permanent internet connection, Java, Adobe Flash, etc... Their integration of these technologies allows to design advanced mobile applications such as Geo-‐Social networks, augmented reality, life tracking, bank trading and office automation. So that new applications bring forward new challenges, in particular to
usability engineers.
In the book “Designing software for the mobile context” [37], the authors describe the design of usable mobile applications as a real challenging task. Indeed, designers have the difficult problem of dealing with a continuously changing technology that always offers new sets of challenges. As a matter of fact, in the last quarter of century user interfaces have evolved from very simple text interfaces to graphical user interfaces (GUI) both for desktop oriented applications and for the vast world of the Web.
Nowadays mobile interfaces present new challenges and opportunities in the field of the Human-‐Computer interaction (HCI). Many issues are directly linked to the hardware.
First of all, the limited screen size, which causes a lack of room for displaying data is a constraint related to mobile interfaces. To overcome this problem, the Apple HCI lab has proposed a set of generic guidelines to develop user mobile interfaces [7]. These guidelines suggest to simplify the mobile user interfaces, compared to the traditional desktop user interfaces. For example, users should interact with one application at a time, on screen user help should be minimal and the application should have just a single window.
New interaction design challenges are also brought about by the diffusion on mobile devices of the touch-‐screen technologies. These technologies can detect the presence and location of a touch on the screen and allow users to directly interact with on-‐screen objects and controls by performing gestures. Thanks to the gestures, elements on the screen are
Chapter 1 - Designing Usable Mobile Interfaces for Spatial Data
perceived by users as physical objects which can be handled in realistic ways. For this reason, designers who develop gesture based interfaces should always try to use natural or discoverable behaviors closely related to the gestures.
Touch-‐screen technologies also introduce issues related to other fields, among which the issues related to visually impaired users are particularly important. Although visually impaired people constitute a large part of the users, they are seldom considered during the design of mobile interfaces. Touch-‐screens may be a hardware limit for this class of users, because of the lack of tactile controls, but they may also be an opportunity, thanks to the introduction of gesture-‐based interfaces coupled to multimodal feedback.
Another issue is related to the text entry areas. A text input device can turn the information provided by users into data that can be understood by the system. Today hardware text input devices are being replaced by alternative methods based on software interfaces. The goal of this thesis is to enhance the usability of mobile interfaces for spatial data. Spatial data are particular data in which the spatial component plays an important role in clarifying the meaning of the data themselves. Nowadays, this kind of data is totally widespread in mobile applications. Spatial data are present in games, map applications, mobile community applications and office automations. In order to enhance the usability of spatial data interfaces, my research investigates on three main points:
1. enhancing the visualization of spatial data on small screens 2. making the interface accessible to visually impaired users 3. enhancing the text-‐input methods
There are several suggestions and guidelines about how the design of GUI features for mobile devices should be carried out. A different issue is how spatial data should be displayed to the user. No matter you think of a WEB page of a on-‐line newspaper or any document with a great amount of text and images, users should navigate the document following several directions in order to read the text and visualize all the images. Many user mobile interfaces offer an automatic or on users demand readjustment of the document. Images are made smaller and the text is squeezed in order to fit the screen space. In such a way users have to navigate the document essentially from the top to the bottom. However, this strategy does not work with spatial data. It does not work, for example, in the case of a spreadsheet. By readjusting rows and columns the document would lose its peculiar structure. The same happens with geographic data. If displayed in smaller size, these data will be analyzed by the user with difficulty, whilst if displayed with a reasonable map scale, they would lose part of their geographical context.
Devices equipped with touch-‐screen technology usually have totally flat screens, that is, they have no (tactile) reference points. Although this design choice is aimed to make the device very perceptible, it cuts visually impaired users off the mobile devices market. For this reason, multimodal interfaces can help visually impaired users to interact with devices by using gestures and through audio and tactile feedbacks. On the other hand Rana et al.[94] state that mobile devices are primary instruments capable of enhancing visually impaired users’ mobility. So that the current challenge is to reach the goal of universal design to support physical and cognitive disabilities.
Chapter 1 - Designing Usable Mobile Interfaces for Spatial Data
Entering data on mobile devices is boring and requires a certain period of training. Virtual Keyboards (VK, for short), Handwriting Recognition and Voice to Text represent the most popular and effective solutions [125].
3–RESEARCH QUESTION AND RESEARCH APPROACH
By the broader context the usability issue emerges as the main issue relating the world of mobile devices. Therefore starting from the issues described previously my research question is:
“How to enhance the usability of mobile users interfaces for spatial data”
I have to split it into two parts, considering user interface as a means to give and receive information. So the research question will be satisfied by giving a solution to the two following issues:
1. How to display spatial data on small-‐sized screens? 2. How to enhance text input methods?
This thesis mainly focuses on the first issue, but I will also tackle the second one, mentioning some recent investigation I have carried out and the promising results gained so far.
I selected the Design Science Research approach to investigate the above research
questions. The idea underling this approach is “you build artifact to learn from it”, in other
words researchers clarify what is new in their design.
Simon [104] conceptualizes the Design Science. He states that it allows researchers to deal with real-‐world problems by a pragmatic research paradigm that involves the development of innovative Information Technology artifacts. In [56], the authors highlight the importance of this scientific approach in the field of IT. Indeed, it leads towards two main IT issues: the central role of the artifact in the research [121][85][15] and the need of professional relevance of research Information Systems [13][58].
Chapter 1 - Designing Usable Mobile Interfaces for Spatial Data
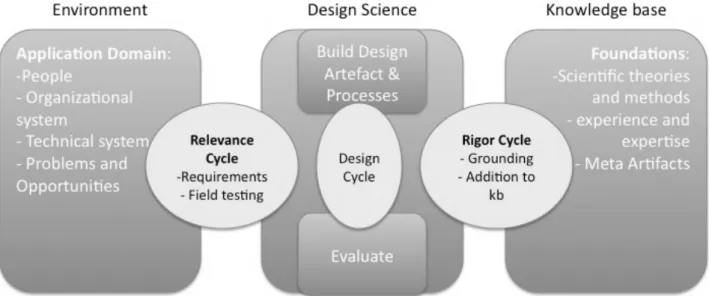
In [55], the authors identify in any design research project three design science cycles, namely: the Relevance Cycle, the Rigor Cycle and the Design Cycle as shown in figure 1. The presence of this three cycles in a research project distinguishes the design science from other research sciences.
The Relevance Cycle puts requirements from the related environment into the research project and immerses the artifact into the field testing.
The Rigor Cycle provides grounding theories and methods along with domain experience and expertise from the foundational knowledge base into the research and adds the new knowledge generated by research to growing knowledge base. The Design Cycle provides the research activity with the building and evaluation of artifact and with design processes.
In [81] the authors describe the design research via a conceptual framework made of guidelines or principles useful to conduct and evaluate a good design science research (see table 1).
Guideline Description
Guideline 1: Design as an
Artifact Design science research must produce a viable artifact in the form of a construct, a model, a method, or an instantiation Guideline 2: Problem relevance The objective of design science research is to develop technology-‐based solutions to important and relevant business problems
Guideline 3: Design evaluation The utility, quality, and efficacy of a design artifact must be rigorously demonstrated via well-‐executed evaluation methods Guideline 4: Research
contributions Effective design science research must provide clear and verifiable contributions in the areas of the design artifact, design foundations, and/or design methodologies
Guideline 5: Research rigor Design science research relies upon the application of rigorous methods in both the construction and evaluation of the design artifact
Guideline 6: Design as a search
process The search for an effective artifact requires utilizing available means to reach desired ends while satisfying laws in the problem environment
Chapter 1 - Designing Usable Mobile Interfaces for Spatial Data
research technology-‐oriented and management-‐oriented audiences
Table 1 – guidelines for the design science research approach
In “Design Science Research in Information Systems”, the authors present a checklist derived from the previous guidelines. The checklist is useful to be sure that projects follow the design science research approach (table 2). Figure 2 shows how the eight questions are mapped into the three design science cycles. This demonstrates the relationship between the checklist and the research cycles.
In the last chapter of this dissertation I shall show how my investigation has answered to the questions of the Design Science Research highlighting the parts of the thesis in which every single question has been answered.
Questions
1. What is the research question (design requirements)? 2. What is the artifact? How is the artifact represented?
3. What design processes (search heuristics) will be used to build the artifact?
4. How are the artifact and the design processes grounded by the knowledge base? What, if any, theories support the artifact design and the design process?
5. What evaluations are performed during the internal design cycles? What design improvements are identified during each design cycle?
6. How is the artifact introduced into the application environment and how is it field tested? What metrics are used to demonstrate artifact utility and improvement over previous artifacts?
7. What new knowledge is added to the knowledge base and in what form (e.g., peer-‐ reviewed literature, meta-‐artifacts, new theory, new method)?
8. Has the research question been satisfactorily addressed?
Table 2 -‐ checklist for the design science research approach
Chapter 1 - Designing Usable Mobile Interfaces for Spatial Data
Figure 2 Questions mapped to three design research cycles
4-OUTLINE
The remaining part of the thesis is organized as follows. In Chapter 2 I present the visualization technique called Framy. The technique is designed to support users in visualizing geographical data on mobile map applications. The chapter also presents the process that led me to design the technique and the first prototype. The usability tests on the prototype will be described and analyzed.
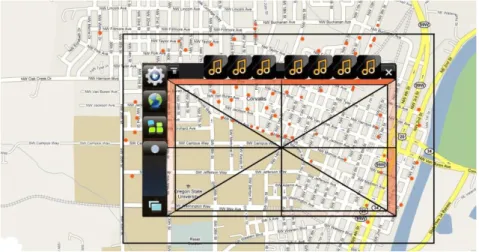
In Chapter 3 I extend the Framy visual interface by adding sounds and vibrations in order to obtain a complete multimodal interface. After that I present the process that turned the multimodal interface into a means to allow visually impaired users to interact with Framy. Chapter 4 shows some projects in which the visualization principles of Framy are involved. The first project exploits the traditional Framy visual interface to provide decision makers with a powerful visual analytics instrument. Moreover in this project the Framy technique is also used to represent temporal information. In the second and in third projects a modified version of Framy is applied to support users during the exploration activities by means of the augmented reality. The last project is a collaborative spreadsheet-‐based system that exploits the Framy technique to support mobile users to work with a complex interface. Chapter 5 introduces focus on the work done in the area of virtual text input, namely the second issue introduced by the research question”. A new kind of virtual keyboard called TaS provides users with an input system more efficient and effective than the traditional QWERTY keyboard. A comparative study is presented and the results analyzed. Although the Framy technique has been modified to fit each different problem, the principles underlining the original multimodal technique have been maintained.
The last chapter discusses the obtained results and presents an interaction design pattern carried out from the proven principles of Framy. It is based on an existing pattern called Infinitive Area Pattern. This pattern is studied to support developers in dealing with issues of visualization of information that is actually infinite such as exactly points of interest and maps. Moreover, a set of guidelines are given by generalizing the principles underling the TaS keyboard. The guidelines support designers in developing virtual gestures based keyboards.
Chapter 1 - Designing Usable Mobile Interfaces for Spatial Data
Finally the chapter summarizes the work done so far and explains how the eight questions of the Design Science approach have been answered during the present work. Considerations on the possible future research directions conclude the thesis.
Chapter 2 -‐ Visual Interface for GIS
Applications
1-INTRODUCTION
The present deals with the issue of spatial data visualization on limited sized screens. Spatial data are characterized by a spatial structure that cannot be modified without compromising their meaning. Therefore when these data are very large and virtually infinite, their representation on small screens will become very challenging. Often they are represented as a single image but the image is so large for the screen that just a portion per time can be visualized and users must perform several actions, such as zooming and panning, in order to explore the whole image.
I especially focus on the field of map based applications and on the deployment of geographical information systems (GIS) through mobile devices. Indeed geographic data such as maps are composed of a structure made of geo-‐referenced geometric elements such as POI (points), streets (arcs) and plans of building (polygons), which would lose their geographic meaning if their structure is modified.
Today map based mobile applications are widespread and many business activities use them to get the best visibility. Advantages deriving from maps are countless, they provide people with the ability to show and analyze the world as they perceive it, namely by verifying topological, directional and metrical relationships. People use maps in a number of tasks, including finding the nearest relevant location, such as a gas station, or for hand-‐optimizing a route. To have a complete and exhaustive evaluation of a region it should be possible for users to:
1) have a global or wide enough view of the map portion they are taking into account and 2) have a vision of the map where details can be well distinguished . If above two features are not supported then comparisons as well as evaluations of spatial relationships may become very difficult because users may be presented with insufficient or excessive amount of information on the screen.
This is especially the case for maps visualized on mobile devices, where viewing a wide portion of the map conflicts with showing features in a well defined and separate fashion, due to the small dimensions of screens.
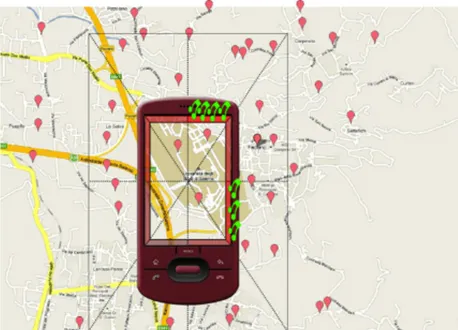
As an example, if we perform a search for the closest hotel from our current location, the result may fall either inside or outside the screen. In the first case, we do not have problems to reach the hotel because we can distinguish it on the map. Vice versa, in the second case, we do not know which direction we have to follow to arrive at the target and we have to gropingly advance.
Visualizing the entire map is not the right solution. This can result in objects from a query task appearing improperly overlapped. As an example, if we are visualizing a layer showing the locations of farmhouses located in a given region and we want to see all of them together, we might want to represent the entire region on the screen, hence using a reduce
Chapter 2 - Visual Interface for GIS Applications
scale for the map. In that case, there is a high probability that, below a certain proximity threshold, farmhouses will be overlapped and will then be hard to distinguish.
In the literature, several techniques have been proposed to display large information spaces on desktop screens. An interesting paper by Chittaro classifies the different approaches adopted to visualize maps and images on small screens [29]. The author argues that the techniques traditionally adopted to combine panning and zooming with either compression (the so-‐called overview-‐detail approach) or distortion operations (known as focus-‐detail approach) may still present severe limitations when applied to mobile devices, due to the very small screen dimensions. A promising approach, specifically conceived for visualizing distance and direction of off-‐screen locations, consists in providing visual references to off-‐ screen areas, by augmenting the detail view with interactive visual references to the context. Such an approach has been successfully adopted in systems like Halo to enable users to complete map-‐based route planning tasks [12].
My work started by an innovative technique called Framy [79, 80]. It has been designed to visualize geographic data on mobile devices. The technique exploits a visual metaphor based on nested frames in order to give information clues about POIs located outside the screen. During my investigation I improved the technique and I have developed some mobile applications based on it in order to experiment Framy in different research environments.
The chapter is organized as follows. In section 2 I present the common approaches followed to visualize geographical data on mobile devices, in section 3 I show the process that led me to developing my technique, namely Framy and the idea underlying it. In the same section I illustrate three typical scenarios where my technique can be employed, which show the effectiveness of Framy. Subsequently (section 4) I present the results of a usability evaluation studyFinally, in section 5, a summary is given.
2-RELATED WORK
There are several works in the scientific literature that show how researchers in the last years tried to tackle the problem of visualization of geographical data on small screens. One of the simplest ways to analyze the information depicted in maps shown on mobile devices is the traditional Pan & Zoom method.
Maps may be seen at different levels of detail by applying the Zoom operation while the visualized region of interest may be changed applying the Pan operation. Typical styles of interaction concerning with the former are the selection of the detail level by means of specific buttons (one for each level), by sliders, by menus or by managing the wheel of the mouse. The Pan operation is usually implemented by dragging the mouse over the map or by scrolling panels.
An approach combining Pan and Zoom together was presented in [68]. At the start of an action, two concentric circles are placed so that the location of the action on the display is at their centre. As the user drags the pointing device, a direction line is drawn between the starting position and its current location, indicating the direction of work. If the pointer remains within the smaller circle, no scaling of the information space occurs, only scrolling. As the pointer moves further away from the starting position, the scroll rate increases.
Chapter 2 - Visual Interface for GIS Applications
When the pointer moves beyond the inner circle, both scaling and scrolling operations take place.
Several papers have been also presented concerning with the technique named “Jump & Refine” [52][96][97]. This technique segments the map into several sub-‐ segments, each of which is mapped to a key on the number keypad of the smartphone. By pressing one of the buttons, the region represented by that button is automatically put in evidence on the screen. At this point the user may either pan the visualized region in order to reach the required zone or recursively apply the segmentation for augmenting the detail level.
Another interesting approach has been presented in [12]. The software implementing this methodology focuses the attention on discovering points of interest located outside the visualized region. As a matter of fact, each point of interest is the center of a circle whose ray raises or decreases as we get close or far from that point. In such a way, we may verify anytime the proximity of the point. A variation of this approach is CityLights [76]. Here, compact graphical representations such as points, lines or arcs which are placed along the borders of a window to provide awareness about off-‐ screen objects located in their direction (fig. 4).
Other interesting techniques for visualizing large amounts of data l spread over map not fitting the available screen size, may broadly be divided into two main categories, Overview&Detail and Focus&Context [69].
In order to have the awareness of a particular region and of its surrounding context, Overview&Detail techniques present simultaneously two maps where one refers to a limited/detailed region and cover the entire screen while the second one is the whole scaled map located just in a corner. Optionally, the detailed region is also highlighted by a rectangle on the whole map. Panning the first map changes the rectangle position on the second one. Even though today this approach is largely used, it was first described in [26]. The perspective overview-‐display is another example of a Overview&Detail technique. Here, two completely distinct areas are used to display the overview (top) and detail (bottom) of an image. To save valuable screen space while displaying the overview, the image is prospectively warped.
The Focus&Context technique is based on the reasonable assumption that the attention of users is focused on the center of the screen. FishEye View [95] is an example of this technique. Here, the center of the map is clearly displayed in the center of the screen while distortion augments starting with less distortion near the focus to strong distortion near the borders of the available display size. Based on the FishEye approach, three possible implementations of the distortion function are provided in [69], uniform context scaling, belt-‐based context scaling, non-‐uniform context scaling.
Finally, an approach merging together Overview&Detail and Focus&Context is presented in [69]. Two different images are used. These images are created by a transformation function. To display the context, the whole image in the logical coordinate system is scaled to the available display size. The focus is created as during panning, but using an equal or smaller size than the available display size. Afterwards the images are combined by the transformation function by applying a fixed or time-‐variant α-‐blending.
Chapter 2 - Visual Interface for GIS Applications
3-DESIGN OF A NEW INTERFACE
In this section I describe my solution Framy that is a visual technique useful to handle with large amounts of geographical data.
Mainly my goal was to develop a mobile user interface usable and useful. In order to achieve this aim, I followed a user-‐centered design approach: I studied potential users and included them in the initial conceptual design activities. During the first step of the develop process I looked into two main factors: the last mobile technologies and advanced user interfaces dealing with similar issues. In particular, I focused on two approaches, namely Halo Halo [12] and CityLights [76]. The former methodology allows users to discover POIs located outside the visualized region. Each POI is the centre of a circle whose ray increases or decreases as the user gets closer or farther. A variation of this approach is CityLights. Here, compact graphical representations such as points, lines or arcs are placed along the borders of a window to provide awareness about off-‐screen objects located in their direction.
Tables 1 amd 2 summarize the strengths and the wiknesses of the two solutions, as they influenced some basic design choices with Framy :
Halo
Strength Weakness
Users may verify anytime the direction and the proximity of the off-‐screen POIs through the dimensions of the circle sector depicted inside the screen.
The technique is not very precise. The precision depends on the POI position: a POI located on the corner direction of the screen produces a circle whose sector could not be fully represented on the screen.
Many POIs produce several circles. The representation of many circles can cause a visual crash so that users cannot well distinguish different sectors of circles and cannot evaluate the distance and the direction.
Table 1 -‐ strengths and weaknesses of Halo technique
Chapter 2 - Visual Interface for GIS Applications
figure 3 – Halo interface
CityLights
Strength Weakness
The technique is developed to work in desktop environments but can be easily adapted to work on mobile devices.
CityLights cannot give qualitative or quantitative information about off-‐screen elements but just indicate their position. In other words it can tell users that something exists in a certain direction but users do not know how many objects can be found and how far they are positioned.
Table 2 -‐ strengths and weaknesses of CityLights technique
Chapter 2 - Visual Interface for GIS Applications
figure 4 – CityLights interface
3.1-FRAMY - A NEW VISUALIZATION TECHNIQUE
Framy is a visualization technique, which aims to provide users an appropriate tradeoff
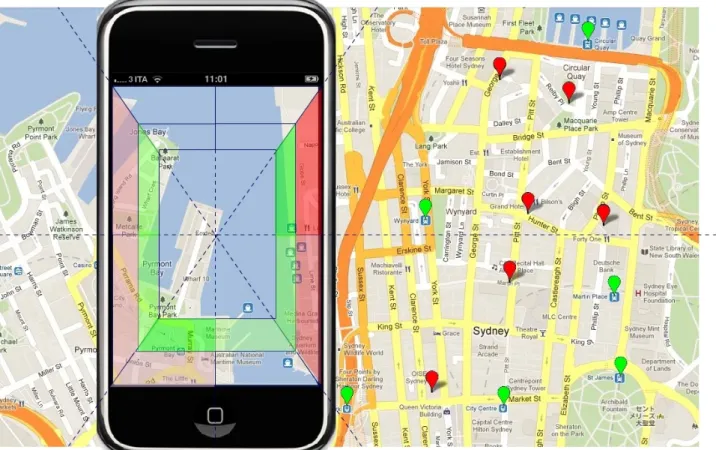
between the zoom level needed to visualize the required features on a map and the amount of information which can be provided through a mobile application. Framy exploits an interaction metaphor for picture frames, to provide hints about off-‐screen objects, resulting from a given query. The idea is to visualize a frame along the border of the device screen. The frame is divided into several semi-‐ transparent colored portions, corresponding to different sectors of the off-‐screen space. For a given query, the color intensity of each frame portion is proportional to the number of resulting objects located in the corresponding map sector. Thus, the frame may indicate both the distance and direction of specific Point Of Interests (POIs), as in Halo, but it may also represent the amount of POIs located towards a specific direction. In general, the frame portion color intensity represents a summary of data located besides the screen border. Moreover, the number of frame portions can be interactively increased so as to refine the query results, indicating, e.g., the exact direction where certain objects can be found. If the query involves several layers, nested frames are visualized along the borders, each one corresponding to a different layer, with a different color.
I developed a prototype of a mobile GIS application, called MapGIS, designed to perform typical GIS operations and queries. MapGIS combines typical mobile interaction controls with the proposed FRAMY visualization technique.
3.2-THE ADOPTION OF FRAMY IN A MOBILE GIS APPLICATION
Framy has been initially experimented on the prototype of a mobile GIS application, called
MapGIS, designed to perform typical GIS operations and queries, combining common
mobile interaction controls with the proposed visualization technique. .
MapGIS is based on a typical GIS architecture realized for different mobile platforms. It actually runs on iOS firmware 4.2.1, Google Android 2.2, Nokia Maemo Linux 2.0. It allows
Chapter 2 - Visual Interface for GIS Applications
pre-‐loaded and stored in a structured repository of the device. It manages the browsing of the map by using a specific pointer that is moved all round the screen through the directional keys on the device.
Two kinds of functionalities are currently available on MapGIS, namely: 4. basic spatial operations, and
5. advanced selection operations.
Panning and zooming are examples of basic operations. They allow users to easily explore maps everywhere and at different scales. So, in order to accomplish such tasks as easily as possible and guarantee a good level of usability, rapid controls have been provided through classic touch-‐screen gestures.
As for the advanced selection operations, they can be used to process both geographic and descriptive data in order to answer specific user’s requests about the real world data. As an example, in MapGIS a search functionality is provided on descriptive data by pointing out specific localities of the map. This functionality represents the operation generally called “Spatial Selection”. It allows users to reference every point located on the map by means of the browsing pointer and returns the descriptive data which are strictly connected to the pointed locality.
Besides the usual route planning functionalities, which also rely on some optimization algorithms, MapGIS provides an advanced search functionality, which allows to localize points of interest of specific categories (theaters, parks, museums, cinemas, etc) by specifying some descriptive information set up by users.
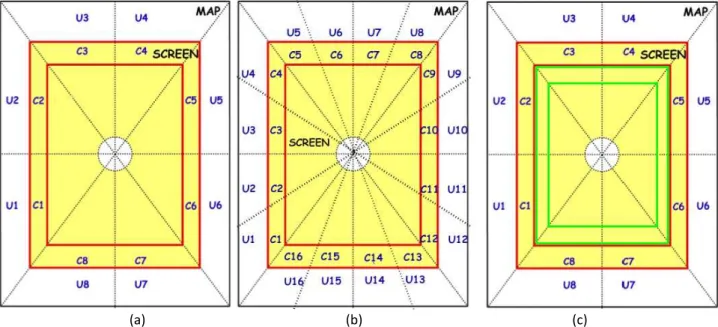
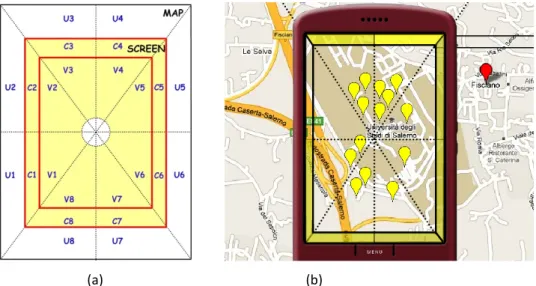
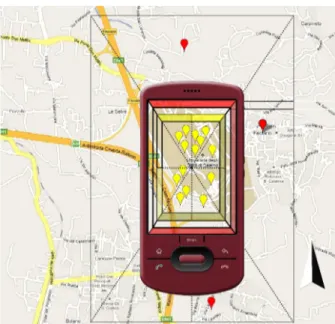
Once the user performs the spatial requests, results are visualized on the map by applying the Framy visualization method which helps users to discover results located off-‐screen. The user may choose to divide the map into any number n. Starting from the center of the screen a fictitious circle is drawn and the map is divided into n sectors of equal width (360°/n ). Figure 5 gives an idea of this subdivision using n = 8, that is I divide the screen into 8 sectors. I use the notation Ui to represent the parts within a sector which lie outside the screen, whereas Vi represents the inside screen parts.