Altered protein expression pattern in skin
fibroblasts from parkin-mutant
early-onset Parkinson's disease patients
Rosa Lippolis
a,⁎
, Rosa Anna Siciliano
b, Consiglia Pacelli
c, Anna Ferretta
d, Maria Fiorella Mazzeo
b,
Salvatore Scacco
d, Francesco Papa
d, Antonio Gaballo
e, Claudia Dell'Aquila
f, Michele De Mari
f,
Sergio Papa
a, Tiziana Cocco
d,⁎⁎
aInstitute of Biomembranes and Bioenergetics, Italian National Research Council (CNR), Via G. Amendola 165/A, Bari, Italy bInstitute of Food Sciences, Italian National Research Council (CNR), Via Roma, 64, Avellino, Italy
c
Department of Pharmacology, Faculty of Medicine, Universitè de Montreal, 2900 Boulevard Edouard-Montpetit, Montreal QCH3T1J4, Canada
d
Department of Basic Medical Sciences, Neurosciences and Sense Organs, University‘A. Moro’, Bari, Italy
e
CNR NANOTEC-Istituto di Nanotecnologia, Polo di Nanotecnologia c/o Campus Ecotekne, via Monteroni, 73100 Lecce, Italy
f
Neurology Unit, Bonomo Hospital, Andria, BA, Italy
a b s t r a c t
a r t i c l e i n f o
Article history:
Received 26 February 2015 Received in revised form 12 June 2015 Accepted 16 June 2015
Available online 19 June 2015 Keywords:
Parkinson's disease Human skinfibroblasts
Two-dimensional gel electrophoresis Mass spectrometry
Proteomics
Parkinson's disease (PD) is the most common neurodegenerative movement disorder caused primarily by selective degeneration of the dopaminergic neurons in substantia nigra. In this work the proteomes extracted from primaryfibroblasts of two unrelated, hereditary cases of PD patients, with different parkin mutations, were compared with the proteomes extracted from commercial adult normal human dermalfibroblasts (NHDF) and primaryfibroblasts from the healthy mother of one of the two patients. The results show that the fibroblasts from the two different cases of parkin-mutant patients display analogous alterations in the expression level of proteins involved in different cellular functions, like cytoskeleton structure–dynamics, calcium homeo-stasis, oxidative stress response, protein and RNA processing.
© 2015 Published by Elsevier B.V.
1. Introduction
Parkinson's disease (PD) is the most frequent ageing-progressive, neurodegenerative movement disorder starting by a selective loss of dopaminergic neurons in the substantia nigra (SN) pars compacta, caused by pathogenetic processes non-completely unveiled yet. It is generally conceived that PD results from a complex interplay between environmental and genetic factors, involving dysfunction in different midbrain dopaminergic neurons, as well as other neuronal populations in the central and peripheral nervous systems.
90% of PD cases are sporadic, 10% represent rare Mendelian heredi-tary forms, caused by a variety of autosomal mutations in more than 10 PARK genes[1,2]. Mutations in mitochondrial DNA have also been
found to contribute to PD development and clinical course[3]. Elucida-tion of the pathogenetic mechanism of familial cases, besides being strategic in designing predictive and therapeutic measures for these cases, can provide clues in identifying susceptible sites and networks, whose acquired alterations might be involved/responsible for develop-ment and progress in the life-course of sporadic PD.
More than 100 different pathogenetic mutations have so far been identified in the parkin (PARK2) gene, encoding parkin, which belongs to the ring between ringfingers (RBR) class of E3 ubiquitin ligases[4, 5]. It is believed that loss of the ubiquitin ligase activity in the parkin mutants impairs degradation by the ubiquitin–proteasome system of specific substrates with accumulation of non-ubiquitinated toxic products leading to neurodegeneration[6,7]. However, it should be noted that there are more than 600 E3 ligases in the human genome, 13 belonging to the RBR family, which could compensate for the loss of the parkin ligase activity[8,9].
On the other hand, investigations on transgenic animal models[10, 11]and parkin transfected cell cultures[12,13]have provided evidence that parkin could also up- or down-regulate the expression of a number of different genes, directly or as a consequence of its E3 ligase activity.
In the present work, a differential proteomic approach has been ap-plied to characterize the protein expression profile of primary fibroblast
Biochimica et Biophysica Acta 1852 (2015) 1960–1970
Abbreviations: ER, endoplasmic reticulum; NHDF, normal adult human dermal fibroblasts; PD, Parkinson's disease; PMF, Peptide Mass Fingerprint; ROS, reactive oxygen species; SN, substantia nigra
⁎ Correspondence to: R. Lippolis, Institute of Biomembranes and Bioenergetics (IBBE), National Research Council (CNR), 70124 Bari, Italy.
⁎⁎ Correspondence to: T. Cocco, Department of Basic Medical Sciences, Neurosciences and Organs of Senses, University of Bari, 70124 Bari, Italy.
E-mail addresses:[email protected](R. Lippolis),[email protected]
(T. Cocco).
http://dx.doi.org/10.1016/j.bbadis.2015.06.015
0925-4439/© 2015 Published by Elsevier B.V.
Contents lists available atScienceDirect
Biochimica et Biophysica Acta
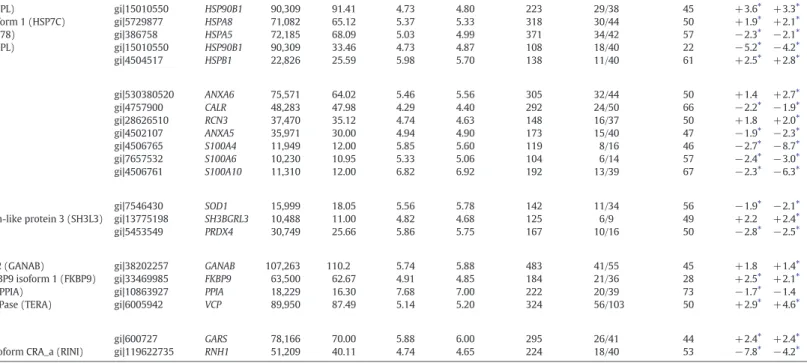
Table 1
Proteins differentially expressed in PDfibroblasts, as identified by Peptide Mass Fingerprinting (PMF) strategy.
Proteins are listed according to their functional categories. Protein spot match identification numbers (ID) are also reported. IDa Protein name Accession number Gene name M.W. (Da)b
Theoretical M.W. (kDa)c Experimental pId Theoretical pIe Experimental
Mascot score Matched peptides Coverage Fold changef
P1 P2 Cytoskeleton structural proteins
1 7 Collagen, type I, alpha 1 (CO1A1) gi|22328092 COL1A1 139,952 139.4 5.70 5.70 549 49/64 48 +2.0⁎ +4.1⁎ 2 8 Collagen, type I, alpha 1 (CO1A1) gi|22328092 COL1A1 139,952 138.8 5.70 5.73 298 46/83 50 +2.5⁎ +7.1⁎ Intermediatedfilament proteins
3 204 Vimentin (VIME) gi|62414289 VIM 53,676 41.43 5.06 4.85 238 21/40 51 −2.9⁎ −2.5⁎
4 205 Vimentin (VIME) gi|62414289 VIM 53,676 41.01 5.06 4.88 294 25/40 60 −3.7⁎ −2.7⁎
5 218 Vimentin (VIME) gi|62414289 VIM 53,676 39.00 5.06 4.81 345 28/40 62 −4.1⁎ −2.7⁎
6 220 Vimentin (VIME) gi|62414289 VIM 53,676 39.47 5.06 7.77 278 25/50 58 −2.8⁎ −2.5
7 233 Vimentin (VIME) gi|62414289 VIM 53,676 37.31 5.06 4.70 204 20/50 48 −4.3⁎ −3.1⁎
8 234 Vimentin (VIME) gi|62414289 VIM 53,676 37.61 5.06 4.67 275 23/40 56 −2.2⁎ −2.2⁎
Microfilament proteins
9 223 Actin, beta (ACTB) gi|14250401 ACTB 41,321 36.27 5.56 5.23 139 12/40 48 +2.1⁎ +1.9⁎
10 242 Actin, beta (ACTB) gi|14250401 ACTB 41,321 36.49 5.56 5.33 246 19/40 53 +2.4⁎ +2.3⁎
11 243 Actin, beta (ACTB) gi|14250401 ACTB 41,321 36.12 5.56 5.15 137 12/40 46 +4.0⁎ +3.8⁎
12 280 Beta tropomyosin (TPM2) gi|6573280 TPM2 29,980 30.79 4.70 4.60 339 29/40 77 +4.5⁎ +7.0⁎
13 291 Tropomyosin alpha-1 chain isoform X10 (TPM1) gi|530406402 TPM1 32,552 30.37 4.69 4.67 263 24/40 58 +5.0⁎ +6.8⁎ 14 295 Tropomyosin alpha-1 chain isoform 5 (TPM1) gi|27597085 TPM1 32,846 30.10 4.69 4.66 179 19/40 58 +3.1⁎ +4.6⁎ 15 301 Tropomyosin alpha-3 chain isoform 2 (TPM3) gi|24119203 TPM3 29,243 28.92 4.75 4.69 261 23/40 77 +2.0⁎ +2.1⁎ 16 302 Tropomyosin alpha-4 chain isoform 2 (TPM4) gi|10441386 TPM4 27,570 28.66 4.77 4.62 263 23/40 57 +2.5⁎ +3.3⁎ Actin binding proteins
17 70 Caldesmon isoform 2 (CALD1) gi|4826657 CALD1 62,683 74.90 6.18 6.14 214 24/37 47 +2.0⁎ +2.2⁎ 18 69 Caldesmon isoform 5 (CALD1) gi|15149465 CALD1 61,233 74.60 6.40 6.06 210 24/70 50 +2.6⁎ +2.9⁎ 19 332 Caldesmon isoform 5 (CALD1) gi|15149465 CALD1 61,233 75.50 6.40 6.27 247 28/40 50 +2.8⁎ +3.2⁎ 20 359 Caldesmon isoform 5 (CALD1) gi|15149465 CALD1 61,233 75.50 6.40 6.03 311 34/86 48 +2.1⁎ +2.2⁎ 21 114 T-plastin polypeptide (PLST) gi|190028 PLS3 64,281 62.28 5.73 5.45 188 18/42 35 +2.1⁎ +2.2⁎ 22 118 Plastin-3 isoform 2 (PLST) gi|288915539 PLS3 68,070 61.83 5.45 5.71 221 19/32 31 +3.4⁎ +3.0⁎
23 250 Moesin (MOES) gi|4505257 MSN 67,892 35.98 6.08 5.75 199 24/42 35 −3.0⁎ −2.2⁎
(continued on next page)
19 61 R. Li pp ol is et al ./ Bi oc h im ic a et Bi op h y sic a Ac ta 18 5 2 (2 01 5 ) 19 6 0– 197 0
Table 1 (continued) IDa
Protein name Accession number Gene name M.W. (Da)b
Theoretical M.W. (kDa)c Experimental pId Theoretical pIe Experimental
Mascot score Matched peptides Coverage Fold changef
P1 P2 Stress response related proteins
24 35 Heat shock protein gp96 precursor (ENPL) gi|15010550 HSP90B1 90,309 91.41 4.73 4.80 223 29/38 45 +3.6⁎ +3.3⁎ 25 95 Heat shock cognate 71 kDa protein isoform 1 (HSP7C) gi|5729877 HSPA8 71,082 65.12 5.37 5.33 318 30/44 50 +1.9⁎ +2.1⁎ 26 78 78 kDa glucose-regulated protein (GRP78) gi|386758 HSPA5 72,185 68.09 5.03 4.99 371 34/42 57 −2.3⁎ −2.1⁎ 27 264 Heat shock protein gp96 precursor (ENPL) gi|15010550 HSP90B1 90,309 33.46 4.73 4.87 108 18/40 22 −5.2⁎ −4.2⁎ 28 319 Heat shock protein beta-1 (HSPB1) gi|4504517 HSPB1 22,826 25.59 5.98 5.70 138 11/40 61 +2.5⁎ +2.8⁎ Calcium related proteins
29 110 Annexin A6 isoform X2 (ANXA6) gi|530380520 ANXA6 75,571 64.02 5.46 5.56 305 32/44 50 +1.4 +2.7⁎
30 154 Calreticulin (CALR) gi|4757900 CALR 48,283 47.98 4.29 4.40 292 24/50 66 −2.2⁎ −1.9⁎
31 256 Reticulocalbin-3 (RCN3) gi|28626510 RCN3 37,470 35.12 4.74 4.63 148 16/37 50 +1.8 +2.0⁎
32 297 Annexin A5 (ANXA5) gi|4502107 ANXA5 35,971 30.00 4.94 4.90 173 15/40 47 −1.9⁎ −2.3⁎
33 327 Protein S100-A4 (S10A4) gi|4506765 S100A4 11,949 12.00 5.85 5.60 119 8/16 46 −2.7⁎ −8.7⁎
34 328 Protein S100-A6 (S10A6) gi|7657532 S100A6 10,230 10.95 5.33 5.06 104 6/14 57 −2.4⁎ −3.0⁎
35 494 Protein S100-A10 (S10AA) gi|4506761 S100A10 11,310 12.00 6.82 6.92 192 13/39 67 −2.3⁎ −6.3⁎ Redox balance related proteins
36 324 Superoxide dismutase Cu–Zn (SODC) gi|7546430 SOD1 15,999 18.05 5.56 5.78 142 11/34 56 −1.9⁎ −2.1⁎ 37 330 SH3 domain-binding glutamic acid-rich-like protein 3 (SH3L3) gi|13775198 SH3BGRL3 10,488 11.00 4.82 4.68 125 6/9 49 +2.2 +2.4⁎
38 338 Peroxiredoxin-4 (PRDX4) gi|5453549 PRDX4 30,749 25.66 5.86 5.75 167 10/16 50 −2.8⁎ −2.5⁎
Protein processing related proteins
39 19 Neutral alpha-glucosidase AB isoform 2 (GANAB) gi|38202257 GANAB 107,263 110.2 5.74 5.88 483 41/55 45 +1.8 +1.4⁎ 40 119 Peptidyl-prolyl cis–trans isomerase FKBP9 isoform 1 (FKBP9) gi|33469985 FKBP9 63,500 62.67 4.91 4.85 184 21/36 28 +2.5⁎ +2.1⁎ 41 489 Peptidyl-prolyl cis–trans isomerase A (PPIA) gi|10863927 PPIA 18,229 16.30 7.68 7.00 222 20/39 73 −1.7⁎ −1.4 42 45 Transitional endoplasmic reticulum ATPase (TERA) gi|6005942 VCP 89,950 87.49 5.14 5.20 324 56/103 50 +2.9⁎ +4.6⁎ RNA processing related proteins
43 72 Glycyl-tRNA synthetase (SYG) gi|600727 GARS 78,166 70.00 5.88 6.00 295 26/41 44 +2.4⁎ +2.4⁎
44 213 Ribonuclease/angiogenin inhibitor 1 isoform CRA_a (RINI) gi|119622735 RNH1 51,209 40.11 4.74 4.65 224 18/40 53 −7.8⁎ −4.2⁎
a
ID spot identification number that represents the protein spot of the 2-DE gels shown inFig. 1.
b
Theoretical molecular weight (Da).
c
Experimental molecular weight (kDa).
d
Theoretical isoelectric point.
e
Experimental isoelectric point.
f Fold change in the protein expression level is calculated, for up-regulated protein, as the ratio between the normalized mean volume of each protein spot in the 2-DE maps of patient'sfibroblasts, P1 and P2 respectively and the combined
nor-malized mean volume of that protein spot in the 2-DE maps of the NHDF and C1fibroblasts. For down-regulated proteins the negative reciprocal value of this ratio is reported. Only spots showing a volume fold change ≥1.7 and a p value b0.0167 (by Bonferroni post-hoc test) are considered as containing up- or down-regulated proteins. For more details seeMaterials and methods. Fold change values for proteins contained in spot ID 110, 256, 330 and 19 in P1 and spot ID 220 and 489 in P2 were not statistically significant. ⁎ p b 0.0167. 19 62 R. Li pp ol is et al ./ Bi oc h im ic a et Bi op h y sic a Ac ta 18 5 2 (2 01 5 ) 19 6 0– 197 0
cultures obtained from skin biopsies of two unrelated patients affected by early-onset, autosomal recessive PD. These patients bore two different compound-heterozygous mutations of parkin, resulting in the absence of the full length 50 kDa parkin protein[14,15].
Parkin is expressed in human skinfibroblasts[14–18]and their primary cultures can be easily obtained from skin biopsies. These cultures represent an ideal model for proteomic analysis of“living cells”[19], to investigate the impact of parkin deletion on the expression pattern of cellular proteins, in the various stages of the disease.
In this study we show that primaryfibroblasts of two unrelated, different cases of parkin-mutant patients, display analogous alterations in the expression level of proteins involved in different cellular functions, like cytoskeleton structure–dynamics, calcium homeostasis, oxidative stress response protein and RNA processing.
2. Materials and methods
2.1. Skinfibroblasts and culture conditions
Primary skinfibroblasts from two unrelated patients affected by an early-onset PD with different parkin compound heterozygous mutations (P1 with del exon2–3/del exon3[14], and P2 with del exon7–9/Glu409X[15]) and from a healthy subject, displaying the heterozygous del exon2–3, (P1's mother, 59 years old, related control, C1)[14,15], were obtained by explants from skin punch biopsy, after informed consent. The biopsies were taken in parallel, processed simultaneously to establish primary cell lines. The P1 patient was a 35 year old woman with a positive familiar history of PD (one sister and one brother) and an age at disease onset of 31 years. Clinical response to dopaminergic treatment was moderate. The P2 patient was a 48 year old woman with a positive familiar history of PD (one sister and one brother) and an age at disease onset of 31 years. Clinical response to dopaminergic treatment was good. Adult normal human dermalfibroblasts (NHDF), from a 56 years old subject, purchased from Lonza Walkersville Inc (Walkersville, MD, USA), were also utilized as unrelated control.
Cells were grown in high-glucose Dulbecco's modified Eagle's medium (DMEM) supplemented with 10% (v/v) foetal bovine serum (FBS), 1% (v/v)L-glutamine, 1% (v/v) penicillin/streptomycin, at 37 °C in a humidified atmosphere of 5% CO2. All experiments were performed
on cells with similar passage numbers, ranging from 5 to 14, to avoid artefacts due to senescence, known to occur at passage numbers greater than 30. In the passage range used,fibroblasts were β-Gal negative[20]. Eachfibroblast sample (NHDF, C1, P1 and P2 fibroblasts) was cultured in triplicate. Cells from each biological repeat, i.e., resulting from the three independent cell cultures, were used for protein sample preparation.
2.2. Two-dimensional gel electrophoresis (2DE)
Thefibroblast cultures from the two controls (C samples) and the two PD patients (PD samples), at 80% of confluence were collected by trypsinization and centrifugation (1 min at 4000 g and 25 °C) and imme-diately frozen in liquid nitrogen. Cells were thawed on ice and suspended in a lysis buffer containing 7 M urea, 2 M thiourea, 4% (w/v) 3-[(3-cholamidopropyl) dimethylammonium]-1-propanesulfonate (CHAPS), 50 mM 1,4-dithio-DL-threitol (DTT), 4 mM phenylmethanesulfonyl fluoride (PMSF) and 5% IPG buffer (GE Healthcare, Amersham Biosciences AB, Uppsala, Sweden). Unbroken cells were removed by centrifugation (5 min at 10,000 g and 4 °C).
Protein concentration offibroblast lysates was determined using the Bio-Rad Protein Assay kit (Bio-Rad Laboratories, Hercules, CA, USA), according to the manufacturer's instruction, and bovine serum albumin as a standard. The extracted proteins were stored at−80 °C until use.
Proteins were separated by 2-DE[21,22], according to manufacturer instructions (GE Healthcare). 250μg of proteins solubilized in IPG strip rehydration buffer (8 M urea, 2% (w/v) CHAPS, 0.5% IPG buffer, 2% (w/v) DTT and trace of bromo-phenol-blue), were loaded on 24-cm IPG strips (GE Healthcare) that provided linear pH gradients 3–10 and 4–7. The first pH gradient is suited for an overview pattern of total cell extracts, the second one is used to zoom the specific region of the gel. Isoelectric focusing was carried out at 20 °C, using the Ettan IPG-Phore Isoelectric Focusing System (GE Healthcare) to 69.5 kVh totally. After focusing, the IPG strips were equilibrated for 12 min in the equilibration buffer (50 mM Tris/HCl pH 8.8, 6 M urea, 30% (v/v) glycerol, 2% (w/v) sodium dodecyl sulphate (SDS)) containing 1% DTT and for 10 min in the same equilibration buffer containing 2.5% iodoacetamide and 0.05% bromophenol blue. For the second dimension, homogeneous SDS-12.5% polyacrylamide electrophoresis gels were used. Electrophoresis was carried out in a Laemmli system[23]at 15 mA per gel constant current at 10 °C.
Molecular mass markers and pI standards were from Bio-Rad. The gels were stained using Coomassie Blue Colloidal dye (Sigma-Aldrich, St. Louis, MO, USA), which enabled quantification of protein staining intensities, allowing quantitative comparison of protein expression levels between the samples. Protein extracts from each biological repeat of control and PD samples were run in triplicate.
2.3. Image analysis
Coomassie stained gel images were acquired using an Image Scanner (GE Healthcare) and analysed with ImageMaster 2D Platinum V.6 software (GE Healthcare). Spot detection was carried out using the optimal values for spot intensity, spot area and saliency determined by applying real timefilters in order to minimise detection of artefacts and to maximise real spots detection. To verify the auto-detected
PH 4-7 KDa 250 150 100 75 50 37 25 20 15 10 7 8 45 119 154 280 301 302 297 264 204 205 233 234 218 256 110 114 243 330 328 327 324 319 338 68 72 69 70 332 118 35 223 242 291 295 95 78 213 NHDF 359 C1 7 8 45 119 154 280 301 302 297 264 204 205 233 234 218 256 110 114 243 330 328 327 324 319 338 68 72 70 332 118 35 223 242 291 295 95 78 213 69 359 78 45 119 154 280 301 302 297 264 204 205 233 234 218 256 110 114 330 328 327 324 319 338 68 72 359 70 332 118 35 243 223 242 291 295 95 78 213 69 P1 69 45 119 154 280 301 302 297 264 204 205 223 233 234 218 256 183 110 330 328 327 324 319 338 68 72 359 70 332 118 35 243 291 295 95 78 213 114 P2 7 8 242
Fig. 1. Representative 2-DE maps (linear IPG 4–7 pH) of the total protein extracts from normal adult human dermal fibroblasts (NHDF), healthy subject fibroblasts (C1) and fibroblasts from the two unrelated PD patients (P1, P2). Protein spots showing different relative volumes in the PD samples compared to the two control samples, are indicated by match ID number and listed inTable 1.
1963 R. Lippolis et al. / Biochimica et Biophysica Acta 1852 (2015) 1960–1970
results, manual spot editing was carried out for each image. Editing consisted of deleting spots at the gel periphery and artifactual material that escaped thefiltering process. Each fibroblast sample (NHDF, C1, P1, P2) was cultured in triplicate (biological replicates) and each biological replicate was subjected to three 2DE. No significant pattern difference was found in the three 2DE gels of eachfibroblast culture sample. In the second step, three gels for eachfibroblast sample (one from each biological replicate) were used to create the four match sets
subjected to image analysis (Fig. 1S). Reproducible landmarks were used to match spots. Relative spot volume (% vol.), i.e., digitised staining intensity integrated over the area of each individual spot divided by the sum of volume of all spots in the gel and multiplied by 100, was used for spot quantification[24]. Spots present in the three gels of the two control samples and in the three gels of the two patient samples, exhibiting a statistical significant difference in their relative spot volume (fold change≥ 1.7; p value b0.05, two-tailed Student's t test) were
A
Fig. 2. An illustrative example of spots containing proteins differentially expressed in PDfibroblasts with respect to control samples and the relative graph displaying the mean values of relative spot volumes ± SD. Panel A: cytoskeleton structural proteins. Panel B: proteins related to stress response, calcium, redox balance and protein processing.
B
Fig. 2 (continued).
1965 R. Lippolis et al. / Biochimica et Biophysica Acta 1852 (2015) 1960–1970
considered to contain differentially expressed proteins and were sub-mitted to further mass spectrometric analysis. For these proteins the mean volumes of each spot in the P1 (n = 3) and P2 (n = 3) samples were independently compared to the combined mean volumes of the corresponding spots of NHDF and C1 samples (n = 6) for calculating the fold change in their relative spot volume (Table 1). Statistical com-parison among the 3 groups (Controls (NHDF + C1), P1, P2) for each protein exhibiting a significant difference in their relative spot volume (fold change≥1.7) was performed using one-way analysis of variance (ANOVA) for multiple groups followed by Bonferroni post-hoc test to evaluate differences among groups; a p valueb0.0167 was set for statis-tically significant differences (Table 1). The match ID number was used to identify all spots in a match.
2.4. Protein identification by Peptide Mass Fingerprint (PMF) strategy Spots of interest were excised from the 2-DE gels and in-gel tryptic digestion was carried out following the procedure described by Shevchenko[25].
Peptide mixtures were analysed using a matrix assisted laser desorption ionization-time offlight-mass spectrometry (MALDI-TOF-MS) instrument (M@LDI, Waters, Milford, MA, USA) operating in positive-ion reflectron mode. The instrument was externally calibrated using signals generated by a peptide mixture of angiotensin (20 fmol/μL, m/z 931.5154), angiotensin II (100 fmol/μL, m/z 1046.5423), ACTH fragment 18–39 (125 fmol/μL, m/z 2465.1989), and insulin oxidized B chain (100 fmol/μL, m/z 3494.6513). Mass spectra, acquired in the m/z range 750–3500, were internally re-calibrated by considering the signal generated by ACTH as lock mass, and processed using MassLynx 2.1 and ProteinLynx Global Server software 2.1 (Waters). Peak lists were manu-ally inspected. Protein identification was achieved by using peak lists for database searches against the NCBInr database by means of the Mascot software (http://www.matrixscience.com/)[26]. Parameters for all searches were as follows: all entries as taxonomic category, trypsin as enzyme, carbamidomethyl asfixed modification for cysteine residues, up to one missing cleavage and up to 50 ppm as mass tolerance. The protein identification was accepted only when the obtained Mascot score was well above the threshold indicated by the software as significant (Mascot score threshold indicates that the probability that the observed match is a random event is minor than 5%). Identified proteins were classified on the basis of their biological and molecular functions using the bioinformatics resource Gene Ontology (GO,www. geneontology.org)
3. Results
3.1. 2-DE-PAGE and data analysis
Differential analysis of the overall intracellular proteome of primary skinfibroblast of two unrelated patients, bearing two different parkin compound heterozygous mutations (P1 and P2), was performed. Commercial adult normal human dermalfibroblasts (NHDF) and skin primaryfibroblasts from a healthy subject (C1), P1's mother, were used as control samples. We have used the primaryfibroblasts of a family member as they can represent an optimal control since should differ from the disease'sfibroblasts only in the mutated gene of interest, while having the same genetic background. The 2-DE protein analysis of thefibroblast lysates was performed in the pH ranges 3–10 and 4–7. In
Fig. 1the representative 2-DE gels of the four samples, in the pH range 4–7, are shown.
Proteomic maps of control samples and PD samples showed several hundreds of well-resolved protein spots distributed over a wide range of pI values and molecular masses. The overall position and the number of protein spots observed was similar in the 2-DE maps of the two con-trol samples (476 ± 24 and 458 ± 32 in NHDF and C1, respectively) and
of the two PD samples (459 ± 37 and 448 ± 43 in P1 and P2, respectively).
The percent of matches between gels from the same class and from the four different classes was similar (around 68%) without statistically significant differences between the classes. To reduce the possibility of false positives, only the protein spots systematically present in all gels of each class were considered in the analysis.
Several protein spots with masses ranging from 140 to 10 kDa and pIs ranging from 4.4 to 6.92 were found to have significantly different relative volumes in the PD samples as compared to control samples. 3.2. Proteins identification
Spots of interest were excised from the gels and proteins contained in these spots were identified by the PMF strategy. The identification was further confirmed by checking that the position of each spot in the 2-DE map was in agreement with the expected molecular weight and pI of the identified protein. Of these, 26 proteins were over-expressed while 18 proteins were under-over-expressed (positive or negative changes in their relative volume ≥ 1.7 fold) as listed in
Table 1and shown inFig. 1(see also Table 1S in Supplementary Material). Illustrative examples of changes in relative volume of some spots and the graph displaying the statistical analysis are shown in
Fig. 2.
The identified proteins could be classified in the following groups: i) Cytoskeleton structural proteins: collagen type I alpha 1 (CO1A1,
spot ID 7 and 8), three isoforms of actin beta (ACTB, spot ID 223, 242 and 243), beta tropomyosin (TPM2, spot ID 280), tropomyo-sin alpha-1 chain isoform X10 and isoform 5 (TPM1, spot ID 291, 295), tropomyosin alpha-3 chain isoform 2 (TPM3, spot ID 301) and tropomyosin alpha-4 chain isoform 2 (TPM4, spot ID 302). All these proteins, which are microfilament components, were over-expressed in the PD samples. Actin-binding proteins: caldesmon isoform 5 (CALD1, spot ID 69, 332 and 359), caldesmon isoform 2 (CALD1 spot ID 70), T-plastin (PLST spot ID 114) and plastin-3 isoform 2 (PLST, spot ID 118) were also over-expressed in PD samples. Conversely, a moesin fragment (MOES, spot ID 250) and six vimentin isoforms (VIME spots ID 204, 205, 218, 220, 233 and 234), components of intermediate filaments, were under-expressed in PD samples.
(ii) Stress response related proteins: heat shock cognate 71 kDa protein isoform 1 (HSP7C, spot ID 95) and heat shock protein beta-1 (HSPB1, spot ID 319) were over-expressed, whereas 78 kDa glucose-regulated protein (GRP78, spot ID 78) was under-expressed in PD samples. Heat shock protein gp96 (ENPL) was present in spot ID 35 (over-expressed) and ID 264 (under-expressed). It is worth to note that the position of spot ID 35 in the 2-DE map was coherent with the pI and molecular mass of the identified protein, while, on the contrary, spot ID 264 was located in a region of the 2-DE map where smaller proteins migrated (about 35 kDa). In agreement with this finding, data from protein identification showed that spot ID 264 actually contained a C-terminal fragment of ENPL, probably originated from a proteolytic processing event of this protein. Recently this protein was shown to undergo calpain-dependent proteolytic cleavage during etoposide-induced apoptosis[27]. (iii) Calcium related proteins: annexin A5 (ANXA5, spot ID 297),
three proteins belonging to the S100 family, namely S100A4, S100A6 and S100A10 (S10A4, S10A6, S10AA, spot ID 327, 328, and 494) and calreticulin (CALR, spot ID154) were under-expressed in PD samples. Annexin A6 isoform X2 (ANXA6, spot ID 110) and reticulocalbin-3 (RCN3, spot ID 256) were signi fi-cantly over-expressed only in P2 cells.
(iv) Redox balance related proteins: Superoxide dismutase Cu–Zn (SODC, spot ID 324) and peroxiredoxin-4 (PRDX4 spot ID 338)
were under-expressed while SH3 domain-binding glutamic acid-rich-like protein 3 (SH3L3, spot ID 330) was significantly over-expressed only in P2 samples.
(v) Protein processing related proteins: peptidyl-prolyl cis–trans isomerase FKBP9, isoform 1 (FKBP9, spot ID 119) and transla-tional endoplasmic reticulum ATPase (TERA, spot ID 45) resulted significantly over-expressed in PD fibroblasts.
(vi) RNA processing related proteins: glycyl-tRNA synthetase (SYG, spot ID 72) was over-expressed in PD fibroblasts while ribonuclease/angiogenin inhibitor 1, isoform CRA_a (RINI, spot ID 213) was markedly under-expressed in PD samples.
4. Discussion
The present proteomic study shows that two unrelated cases of PD patients (P1 and P2) with different pathogenetic compound heterozy-gous PARK2 mutations (del exon2–3/del exon3 in P1 and del exon7–9/Glu409X in P2), both resulting in parkin loss in the primary skinfibroblasts, present analogous alterations in the expression level of proteins pertaining to different cellular processes. Extension of the proteomic analysis tofibroblasts from more cases of PD patients with mutations in PARK2 or in other PARK genes and comparison of the results with proteomic data obtained from brain tissue of sporadic PD patients[28–32], can contribute to shed light on the pathogenetic mechanism of PD and identify specific biomarkers for predictive and therapeutic intervention.
How parkin deletion could modulate the expression level of diverse categories of proteins and how possible interactions of the affected pro-teins could contribute to the pathogenesis of PD are open questions. It is generally believed that the loss of the E3 ligase activity of parkin impairs degradation of altered, unwanted protein species by the proteasome system[7]. It is conceivable that parkin, in addition to proteasomal degradation, modulates, directly or by ubiquitination, factors that control the expression of different proteins at transcriptional and/or translational level[12,13]. Clearly, the present results motivate more work on the cellular impact of parkin pathogenetic mutations.
Among the different proteins whose levels were found to be affected by the parkin mutations, we discuss here possible functional implication of proteins showing significant, around 2 fold, expression changes in the fibroblasts of the two cases of parkin-mutant PD (Table 1).
Several proteins differentially expressed in the PDfibroblasts are cytoskeleton structural proteins related to intermediatefilaments, microfilaments and actin binding proteins. These proteins play a critical role in maintaining cell shape, motility[33–35]and neuron–glia interac-tion[36,37].
It has been reported that several cytoskeleton proteins have altered levels in neurodegenerative disorders[38–40]. A decreased level of six vimentin isoforms was observed in thefibroblasts from the two PD patients. VIME is the major structural component of intermediate filaments and contributes to cell–cell junctions such as desmosomes. It maintains cell shape, cytoskeleton stabilization and spatial localization of cell organelles[41]. Three isoforms of actin beta, components of the cytoskeleton microfilament proteins, were over-expressed in PD samples. It is worth nothing that an increased level of beta actin was also found in the brain of neurotoxin 6-OHDA rat model of PD[42]. An increased level offive isoforms of tropomyosin, components of actin filaments[43], were found in both PD samples.
Isoforms of caldesmon, an actin binding protein, were over-expressed in PDfibroblasts. Caldesmon co-localizes with tropomyosin on thinfilaments in proximity to myosin thick filaments, binds and stabilizes actinfilaments, and regulates actin–myosin interaction in a Ca2 +/calmodulin and/or phosphorylation-dependent manner[44]. Likewise, we observed increased level of plastins. These proteins, characterized by Ca2 +and actin-binding domains, are involved in
actin bundling, assembly, turnover and stabilization. The different expression level of the cytoskeleton structural proteins observed in thefibroblasts of both patients could be related to the molecular[35]
and ultrastructural alterations[14]observed in these cells, and under-score the functional link between parkin and cytoskeleton. Proper cytoskeleton dynamics is fundamental for efficient regulation of mitochondrial mobility, in response to neuronal activity in order to meet increased metabolic requirements at sites distant from the cell body[45].
Cytoskeleton remodelling has also been implicated in different aspects of neuronal morphogenesis, such as growth, guidance, branching, and stability of axons and dendrites. Both neuronal and as-trocytic components are involved in adaptation to pathophysiological processes affecting dopaminergic systems as indicated by the alteration of functional plasticity of neuroglial interaction in toxin animal model of PD[36]. This aspect is critical with respect to the functional involvement of gap junction coupling and connexin expression in modulating neurodegenerative or neuroprotective conditions[37].
Of relevant interest is the presentfinding of a general, significant decreased level in both patient fibroblasts of calcium binding proteins which buffer intracellular calcium concentration within physiological concentration range, thus preventing Ca2+excitotoxicity
[46,47].
The Ca2 +-binding proteins found to be decreased in both PD
samples were: three S100 Ca2+-binding proteins (S100A-4, S100A-6, S100-A10), a protein family involved in the modulations of different cellular processes[48]; calreticulin, a chaperone protein located in the ER lumen, involved in ER Ca2+storage capacity[49], assembly, folding
and quality control of ER proteins[50]; annexin A5, which exhibits a Ca2+-dependent binding to phospholipids and membranes and plays
a role in neuronal cell death [51,52]. Previous studies reported a decrease in Annexin A5 concentration in cerebrospinalfluid (CSF) of PD patients[53].
The decreased cellular level of Ca2+binding proteins in the primary
fibroblasts of the two parkin-mutant patients lend support to the emerging evidence that calcium deregulation has a major role in Parkinson's disease[54,47]. It has been reported that parkin deficiency in cellular model leads to an increase in the calcium level that makes cells more vulnerable to neurotoxins[55].
Hurley et al.[47]found increased expression of Cav1.3 voltage-gated
calcium channel in the post-mortem brain of early stage Parkinson's dis-ease patients together with a reduced level of Ca2+binding proteins.
Both of these changes were proposed to contribute to enhanced cellular Ca2+concentration and consequent Ca2+excitotoxicity. An increased
cytosolic concentration of Ca2 + (N10− 5 M) results in a large
accumulation of Ca2 +in mitochondria[56]where it can induce a
sequential series of deleterious events including: opening of the cyclosporine-sensitive permeability transition pore and loss of cytochrome c and other pro-apoptotic factors from mitochondria
[57]. A previous work has shown in primaryfibroblasts of a patient affected by familial parkinsonism associated with homozygous PINK1 mutation, a loss of mitochondrial cytochrome c, which resulted in the inhibition of mitochondrial respiratory activity, depression of ATP production and increased mitochondrial reactive oxygen species (ROS) production[58].
Our proteomic analysis showed in the two PD samples, altered expression of stress response and redox balance related proteins which exert a protective role against oxidative damage, protein misfolding and inclusion body formation[59].
Some Heat Shock Proteins HSPs were up-regulated by two fold in PD samples and these are: HSP gp96, which chaperones secreted and membrane proteins in the ER lumen[60], HSP7C, which ensures the proper folding of nascent or misfolded proteins [61,62], and HSPB1, which interacts with actin and intermediatefilaments
[63]. Conversely, the 70-kDa-protein GRP78, member of HSP 70 family resulted to be under-expressed in PDfibroblasts. The level
1967 R. Lippolis et al. / Biochimica et Biophysica Acta 1852 (2015) 1960–1970
of GRP78 has been found to be altered in different PD models
[64–66].
Two proteins involved in the regulation of redox processes, namely peroxiredoxin-4 and superoxide dismutase Cu–Zn, were under-expressed. Peroxiredoxin-4 is an ER protein, member of the peroxiredoxin (PRDXs) ubiquitous protein family that protects cells from reactive oxygen species[67]Under-expression of peroxiredoxin-4 and SODC could account for the increased level of H2O2detected in
thefibroblasts of these PD patients[14,15]. Furthermore, the proteomic analysis led to identify some proteins differentially expressed in the PD fibroblasts involved in protein and RNA processing.
Two ER proteins: FKBP and TERA were over-expressed in PD fibroblasts. The FKBP protein family has a prolyl isomerase activity, is enriched in the nervous system and may be involved in PD pathogenesis
[68]. TERA is an ER protein member of the AAA+ ATPase family with a central role in protein folding, vesicle transport and fusion and ubiqui-tin–proteasome and autophagy degradation pathways[69]. Our results showed also an over-expression of glycyl-tRNA synthetase in PD fibroblasts. The activity of this enzyme is regulated by the aminoacyl-tRNA synthetase cofactor p38 (AIMP2), a parkin substrate whose up-regulation in parkin null mice induced apoptosis of neuronal cells
[70].
Ribonuclease/angiogenin inhibitor 1, isoform CRA (RINI) was under-expressed in PDfibroblasts. RNH1 is known to inhibit RNases such as RNASE1, RNASE2 and angiogenin [71]. Its knockdown promotes stress-induced translational silencing[72].
5. Conclusions
Parkin deletion in primaryfibroblasts from the two cases of unrelated, autosomal recessive familial PD patients is shown to result in analogous alterations in the expression level of proteins of different functional cate-gories. These results indicate the complexity of cellular alterations caused by parkin deletion and imply limitations of hypothesis-driven studies concentrated only on a specific cellular function.
Many proteins whose expression was altered in PD samples were cytoskeleton structural proteins. The modulation of vimentin expression level, which resulted to be decreased, might have important implications due to the role of this protein in cell architecture and be indicative of a structural impairment of the cytoskeleton in PD cells[35]. Our presentfinding of a large decrease in the level of Ca2+-binding /
buffering proteins in the parkin-mutantfibroblasts lend support to the concept that Ca2+excitotoxicity plays a central role in Parkinson's
dis-ease[46,47]. A historical cohort study in Denmark[73]has indicated that treatment of patients with dihydropyridine Ca2 +-channels blockers, largely used in therapeutical treatment of hypertension, was associated with a reduced risk of incident PD and reduced mortality among patients. These observations warrant further basic and clinical studies aimed to develop and test blockers of Ca2 +channels in the
prevention and treatment of Parkinson's disease.
A main target of Ca2+excitotoxicity is represented by mitochondria.
Large accumulation of Ca2+in these organelles results in the deleterious
cascade of events discussed above, which ultimately causes impairment of mitochondrial respiration and ATP production and enhancement of ROS production, as observed in our previous work on the PDfibroblasts of the two patients examined here[14,15]. Impaired mitochondrial energy metabolism, oxidative stress and age-related progressive accumulation of oxidatively damaged and misfolded proteins, which aggregate and impair cellular housekeeping and specialized functions, contribute, all together, to the PD pathogenesis[74–76].
Recent studies on Parkin deficient cells showed also an increased vulnerability of the endoplasmic reticulum to oxidative stress[77], representing an additional pathogenetic event in PD[78–81]. All this supports an adjuvant therapeutic action of natural antioxidant substances (see the case of resveratrol[15]and hydroxytyrosol[82]) that can promote the expression and/or the activity of gene products
(so-called vitagens) involved in mitochondrial biogenesis and cell protection against oxidative stress and production/accumulation of damaged/misfolded proteins which ultimately result in neuron loss
[83–85].
Supplementary data to this article can be found online athttp://dx. doi.org/10.1016/j.bbadis.2015.06.015.
Transparency document
TheTransparency documentassociated with this article can be found, in the online version.
Acknowledgements
This work was supported by local grants of the University of Bari to T.C., by Sanofi-Aventis Deutschland GmbH, 65926 Frankfurt am Main, Germany to T.C. and by FIRB-MERIT 2008 No. RBNE08HWLZ012 to S.P.
References
[1] O. Corti, S. Lesage, A. Brice, What genetics tells us about the causes and mechanisms of Parkinson's disease, Physiol. Rev. 91 (2011) 1161–1218,http://dx.doi.org/10. 1152/physrev.00022.2010.
[2] I. Martin, V.L. Dawson, T.M. Dawson, Recent advances in the genetics of Parkinson's disease, Annu. Rev. Genomics Hum. Genet. 12 (2011) 301–325,http://dx.doi.org/10. 1146/annurev-genom-082410-101440.
[3] C. Piccoli, M. Ripoli, G. Quarato, R. Scrima, A. D'Aprile, D. Boffoli, et al., Coexistence of mutations in PINK1 and mitochondrial DNA in early onset parkinsonism, J. Med. Genet. 45 (2008) 596–602,http://dx.doi.org/10.1136/jmg.2008.058628. [4] T. Kitada, S. Asakawa, N. Hattori, H. Matsumine, Y. Yamamura, S. Minoshima, et al.,
Mutations in the parkin gene cause autosomal recessive juvenile parkinsonism, Nature 392 (1998) 605–608,http://dx.doi.org/10.1038/33416.
[5] H. Shimura, N. Hattori, Si Kubo, Y. Mizuno, S. Asakawa, S. Minoshima, et al., Familial Parkinson disease gene product, parkin, is a ubiquitin–protein ligase, Nat. Genet. 25 (2000) 302–305,http://dx.doi.org/10.1038/77060.
[6] T.M. Dawson, Parkin and defective ubiquitination in Parkinson's disease, J. Neural Transm. Suppl. (2006) 209–213.
[7] M.A. Sandebring, A. Cedazo-Minguez, Parkin— an E3 ubiquitin ligase with multiple substrates, J. Alzheimers. Park. S10 (2012) 002, http://dx.doi.org/10.4172/2161-0460.S10-002.
[8] D.M. Wenzel, R.E. Klevit, Following Ariadne's thread: a new perspective on RBR ubiquitin ligases, BMC Biol. 10 (2012) 24, http://dx.doi.org/10.1186/1741-7007-10-24.
[9] J.J. Smit, T.K. Sixma, RBR E3-ligases at work, EMBO Rep. 15 (2014) 142–154,http:// dx.doi.org/10.1002/embr.201338166.
[10] J.J. Palacino, D. Sagi, M.S. Goldberg, S. Krauss, C. Motz, M. Wacker, et al., Mitochondri-al dysfunction and oxidative damage in parkin-deficient mice, J. Biol. Chem. 279 (2004) 18614–18622,http://dx.doi.org/10.1074/jbc.M401135200.
[11] M. Periquet, O. Corti, S. Jacquier, A. Brice, Proteomic analysis of parkin knockout mice: alterations in energy metabolism, protein handling and synaptic function, J. Neurochem. 95 (2005) 1259–1276,http://dx.doi.org/10.1111/j.1471-4159.2005. 03442.x.
[12] P.G. Unschuld, J. Dächsel, F. Darios, A. Kohlmann, E. Casademunt, K. Lehmann-Horn, et al., Parkin modulates gene expression in control and ceramide-treated PC12 cells, Mol. Biol. Rep. 33 (2006) 13–32,http://dx.doi.org/10.1007/s11033-005-3961-5. [13] E.J. Davison, K. Pennington, C.-C. Hung, J. Peng, R. Rafiq, A. Ostareck-Lederer, et al.,
Proteomic analysis of increased Parkin expression and its interactants provides evidence for a role in modulation of mitochondrial function, Proteomics 9 (2009) 4284–4297,http://dx.doi.org/10.1002/pmic.200900126.
[14] C. Pacelli, D. De Rasmo, A. Signorile, I. Grattagliano, G. di Tullio, A. D'Orazio, et al., Mi-tochondrial defect and PGC-1α dysfunction in parkin-associated familial Parkinson's disease, Biochim. Biophys. Acta 1812 (2011) 1041–1053,http://dx.doi.org/10.1016/ j.bbadis.2010.12.022.
[15] A. Ferretta, A. Gaballo, P. Tanzarella, C. Piccoli, N. Capitanio, B. Nico, et al., Effect of resveratrol on mitochondrial function: implications in parkin-associated familiar Parkinson's disease, Biochim. Biophys. Acta 1842 (2014) 902–915,http://dx.doi. org/10.1016/j.bbadis.2014.02.010.
[16] H. Mortiboys, K.J. Thomas, W.J.H. Koopman, S. Klaffke, P. Abou-Sleiman, S. Olpin, et al., Mitochondrial function and morphology are impaired in parkin-mutant fibroblasts, Ann. Neurol. 64 (2008) 555–565,http://dx.doi.org/10.1002/ana.21492. [17] A. Grünewald, L. Voges, A. Rakovic, M. Kasten, H. Vandebona, C. Hemmelmann, et al.,
Mutant Parkin impairs mitochondrial function and morphology in human fibroblasts, PLoS One 5 (2010) e12962,http://dx.doi.org/10.1371/journal.pone. 0012962.
[18] P. del Hoyo, A. García-Redondo, F. de Bustos, J.A. Molina, Y. Sayed, H. Alonso-Navarro, et al., Oxidative stress in skinfibroblasts cultures from patients with Parkinson's disease, BMC Neurol. 10 (2010) 95, http://dx.doi.org/10.1186/1471-2377-10-95.
[19] G. Auburger, M. Klinkenberg, J. Drost, K. Marcus, B. Morales-Gordo, W.S. Kunz, et al., Primary skinfibroblasts as a model of Parkinson's disease, Mol. Neurobiol. 46 (2012) 20–27,http://dx.doi.org/10.1007/s12035-012-8245-1.
[20] G.P. Dimri, X. Lee, G. Basile, M. Acosta, G. Scott, C. Roskelley, et al., A biomarker that identifies senescent human cells in culture and in aging skin in vivo, Proc. Natl. Acad. Sci. U. S. A. 92 (1995) 9363–9367.
[21] A. Görg, W. Postel, S. Günther, The current state of two-dimensional electrophoresis with immobilized pH gradients, Electrophoresis 9 (1988) 531–546,http://dx.doi. org/10.1002/elps.1150090913.
[22] D.F. Hochstrasser, M.G. Harrington, A.C. Hochstrasser, M.J. Miller, C.R. Merril, Methods for increasing the resolution of two-dimensional protein electrophoresis, Anal. Biochem. 173 (1988) 424–435.
[23]U.K. Laemmli, Cleavage of structural proteins during the assembly of the head of bacteriophage T4, Nature 227 (1970) 680–685.
[24] R.D. Appel, D.F. Hochstrasser, Computer analysis of 2-D images, Methods Mol. Biol. Clifton NJ. 112 (1999) 363–381.
[25] A. Shevchenko, M. Wilm, O. Vorm, M. Mann, Mass spectrometric sequencing of proteins silver-stained polyacrylamide gels, Anal. Chem. 68 (1996) 850–858.
[26] D.J. Pappin, P. Hojrup, A.J. Bleasby, Rapid identification of proteins by peptide-mass fingerprinting, Curr. Biol. CB 3 (1993) 327–332.
[27] R.K. Reddy, J. Lu, A.S. Lee, The endoplasmic reticulum chaperone glycoprotein GRP94 with Ca(2+)-binding and antiapoptotic properties is a novel proteolytic target of calpain during etoposide-induced apoptosis, J. Biol. Chem. 274 (1999) 28476–28483.
[28] V. Licker, N. Turck, E. Kövari, K. Burkhardt, M. Côte, M. Surini-Demiri, et al., Proteo-mic analysis of human substantia nigra identifies novel candidates involved in Parkinson's disease pathogenesis, Proteomics 14 (2014) 784–794,http://dx.doi. org/10.1002/pmic.201300342.
[29] V. Licker, E. Kövari, D.F. Hochstrasser, P.R. Burkhard, Proteomics in human Parkinson's disease research, J. Proteomics 73 (2009) 10–29,http://dx.doi.org/10. 1016/j.jprot.2009.07.007.
[30] V. Licker, M. Côte, J.A. Lobrinus, N. Rodrigo, E. Kövari, D.F. Hochstrasser, et al., Prote-omic profiling of the substantia nigra demonstrates CNDP2 overexpression in Parkinson's disease, J. Proteomics 75 (2012) 4656–4667,http://dx.doi.org/10. 1016/j.jprot.2012.02.032.
[31] M. Basso, S. Giraudo, D. Corpillo, B. Bergamasco, L. Lopiano, M. Fasano, Proteome analysis of human substantia nigra in Parkinson's disease, Proteomics 4 (2004) 3943–3952,http://dx.doi.org/10.1002/pmic.200400848.
[32] J. Jin, C. Hulette, Y. Wang, T. Zhang, C. Pan, R. Wadhwa, et al., Proteomic identifica-tion of a stress protein, mortalin/mthsp70/GRP75: relevance to Parkinson disease, Mol. Cell. Proteomics MCP 5 (2006) 1193–1204,http://dx.doi.org/10.1074/mcp. M500382-MCP200.
[33] L. Luo, Actin cytoskeleton regulation in neuronal morphogenesis and structural plasticity, Annu. Rev. Cell Dev. Biol. 18 (2002) 601–635,http://dx.doi.org/10.1146/ annurev.cellbio.18.031802.150501.
[34] F. Bradke, C.G. Dotti, The role of local actin instability in axon formation, Science 283 (1999) 1931–1934.
[35] D. Vergara, M.M. Ferraro, M. Cascione, L.L. Del Mercato, S. Leporatti, A. Ferretta, et al., Cytoskeletal alterations and biomechanical properties of parkin-mutant human primaryfibroblasts, Cell Biochem. Biophys. (2014)http://dx.doi.org/10.1007/ s12013-014-0362-1.
[36] A. Bosson, S. Boisseau, A. Buisson, M. Savasta, M. Albrieux, Disruption of dopaminer-gic transmission remodels tripartite synapse morphology and astrocytic calcium activity within substantia nigra pars reticulata, Glia 63 (2015) 673–683,http://dx. doi.org/10.1002/glia.22777.
[37] R. Parenti, F. Cicirata, A. Zappalà, A. Catania, F. La Delia, V. Cicirata, et al., Dynamic ex-pression of Cx47 in mouse brain development and in the cuprizone model of myelin plasticity, Glia 58 (2010) 1594–1609,http://dx.doi.org/10.1002/glia.21032. [38] D. Cartelli, S. Goldwurm, F. Casagrande, G. Pezzoli, G. Cappelletti, Microtubule
desta-bilization is shared by genetic and idiopathic Parkinson's disease patientfibroblasts, PLoS One 7 (2012) e37467,http://dx.doi.org/10.1371/journal.pone.0037467. [39] D. Cartelli, F. Casagrande, C.L. Busceti, D. Bucci, G. Molinaro, A. Traficante, et al.,
Mi-crotubule alterations occur early in experimental parkinsonism and the miMi-crotubule stabilizer epothilone D is neuroprotective, Sci. Rep. 3 (2013) 1837,http://dx.doi.org/ 10.1038/srep01837.
[40] N.J. Cairns, V.M.-Y. Lee, J.Q. Trojanowski, The cytoskeleton in neurodegenerative diseases, J. Pathol. 204 (2004) 438–449,http://dx.doi.org/10.1002/path.1650. [41] J.E. Eriksson, T. Dechat, B. Grin, B. Helfand, M. Mendez, H.-M. Pallari, et al.,
Introduc-ing intermediatefilaments: from discovery to disease, J. Clin. Invest. 119 (2009) 1763–1771,http://dx.doi.org/10.1172/JCI38339.
[42] A. De Iuliis, J. Grigoletto, A. Recchia, P. Giusti, P. Arslan, A proteomic approach in the study of an animal model of Parkinson's disease, Clin. Chim. Acta Int. J. Clin. Chem. 357 (2005) 202–209,http://dx.doi.org/10.1016/j.cccn.2005.03.028.
[43] P.W. Gunning, G. Schevzov, A.J. Kee, E.C. Hardeman, Tropomyosin isoforms: divining rods for actin cytoskeleton function, Trends Cell Biol. 15 (2005) 333–341,http://dx. doi.org/10.1016/j.tcb.2005.04.007.
[44] E.M. Smolock, D.M. Trappanese, S. Chang, T. Wang, P. Titchenell, R.S. Moreland, siRNA-mediated knockdown of h-caldesmon in vascular smooth muscle, Am. J. Physiol. Heart Circ. Physiol. 297 (2009) H1930–H1939,http://dx.doi.org/10.1152/ ajpheart.00129.2009.
[45] Z.-H. Sheng, Mitochondrial trafficking and anchoring in neurons: new insight and implications, J. Cell Biol. 204 (2014) 1087–1098,http://dx.doi.org/10.1083/jcb. 201312123.
[46] D.J. Surmeier, J.N. Guzman, J. Sanchez-Padilla, P.T. Schumacker, The role of calcium and mitochondrial oxidant stress in the loss of substantia nigra pars compacta dopa-minergic neurons in Parkinson's disease, Neuroscience 198 (2011) 221–231,http:// dx.doi.org/10.1016/j.neuroscience.2011.08.045.
[47] M.J. Hurley, B. Brandon, S.M. Gentleman, D.T. Dexter, Parkinson's disease is associated with altered expression of CaV1 channels and calcium-binding proteins, Brain J. Neurol. 136 (2013) 2077–2097,http://dx.doi.org/10.1093/brain/awt134. [48] R. Donato, Functional roles of S100 proteins, calcium-binding proteins of the
EF-hand type, Biochim. Biophys. Acta 1450 (1999) 191–231.
[49] P. Spee, J. Neefjes, TAP-translocated peptides specifically bind proteins in the endoplasmic reticulum, including gp96, protein disulfide isomerase and calreticulin, Eur. J. Immunol. 27 (1997) 2441–2449,http://dx.doi.org/10.1002/eji.1830270944. [50] B. Kleizen, I. Braakman, Protein folding and quality control in the endoplasmic
reticulum, Curr. Opin. Cell Biol. 16 (2004) 343–349,http://dx.doi.org/10.1016/j. ceb.2004.06.012.
[51] C.P. Reutelingsperger, W.L. van Heerde, Annexin V, the regulator of phosphatidylserine-catalyzed inflammation and coagulation during apoptosis, Cell. Mol. Life Sci. CMLS 53 (1997) 527–532.
[52] M. Walton, E. Sirimanne, C. Reutelingsperger, C. Williams, P. Gluckman, M. Dragunow, Annexin V labels apoptotic neurons following hypoxia–ischemia, Neuroreport 8 (1997) 3871–3875.
[53]I. Vermes, E.N. Steur, C. Reutelingsperger, C. Haanen, Decreased concentration of annexin V in parkinsonian cerebrospinalfluid: speculation on the underlying cause, Mov. Disord. Off. J. Mov. Disord. Soc. 14 (1999) 1008–1010.
[54] A.H.V. Schapira, Calcium dysregulation in Parkinson's disease, Brain J. Neurol. 136 (2013) 2015–2016,http://dx.doi.org/10.1093/brain/awt180.
[55] A. Sandebring, N. Dehvari, M. Perez-Manso, K.J. Thomas, E. Karpilovski, M.R. Cookson, et al., Parkin deficiency disrupts calcium homeostasis by modulating phospholipase C signalling, FEBS J. 276 (2009) 5041–5052,http://dx.doi.org/10. 1111/j.1742-4658.2009.07201.x.
[56] D.G. Nicholls, M. Crompton, Mitochondrial calcium transport, FEBS Lett. 111 (1980) 261–268.
[57] A. Rasola, P. Bernardi, Mitochondrial permeability transition in Ca(2+)-dependent apoptosis and necrosis, Cell Calcium 50 (2011) 222–233,http://dx.doi.org/10. 1016/j.ceca.2011.04.007.
[58] S. Papa, A.M. Sardanelli, N. Capitanio, C. Piccoli, Mitochondrial respiratory dysfunc-tion and mutadysfunc-tions in mitochondrial DNA in PINK1 familial parkinsonism, J. Bioenerg. Biomembr. 41 (2009) 509–516, http://dx.doi.org/10.1007/s10863-009-9252-4.
[59] G.-R. Luo, S. Chen, W.-D. Le, Are heat shock proteins therapeutic target for Parkinson's disease? Int. J. Biol. Sci. 3 (2007) 20–26.
[60] M. Marzec, D. Eletto, Y. Argon, GRP94: an HSP90-like protein specialized for protein folding and quality control in the endoplasmic reticulum, Biochim. Biophys. Acta 1823 (2012) 774–787,http://dx.doi.org/10.1016/j.bbamcr.2011.10.013.
[61]S. Takayama, Z. Xie, J.C. Reed, An evolutionarily conserved family of Hsp70/Hsc70 molecular chaperone regulators, J. Biol. Chem. 274 (1999) 781–786.
[62] F. Kriegenburg, L. Ellgaard, R. Hartmann-Petersen, Molecular chaperones in targeting misfolded proteins for ubiquitin-dependent degradation, FEBS J. 279 (2012) 532–542,http://dx.doi.org/10.1111/j.1742-4658.2011.08456.x.
[63] J. Kayser, M. Haslbeck, L. Dempfle, M. Krause, C. Grashoff, J. Buchner, et al., The small heat shock protein Hsp27 affects assembly dynamics and structure of keratin intermediatefilament networks, Biophys. J. 105 (2013) 1778–1785,http://dx.doi. org/10.1016/j.bpj.2013.09.007.
[64] M.S. Gorbatyuk, O.S. Gorbatyuk, The Molecular chaperone GRP78/BiP as a therapeu-tic target for neurodegenerative disorders: a mini review, J. Genet. Syndr. Gene Ther. 4 (2013)http://dx.doi.org/10.4172/2157-7412.1000128.
[65] W.A. Holtz, K.L. O'Malley, Parkinsonian mimetics induce aspects of unfolded protein response in death of dopaminergic neurons, J. Biol. Chem. 278 (2003) 19367–19377,
http://dx.doi.org/10.1074/jbc.M211821200.
[66] O. Ghribi, M.M. Herman, P. Pramoonjago, J. Savory, MPP+ induces the endoplasmic reticulum stress response in rabbit brain involving activation of the ATF-6 and NF-kappaB signaling pathways, J. Neuropathol. Exp. Neurol. 62 (2003) 1144–1153.
[67] E. Zito, PRDX4, an endoplasmic reticulum-localized peroxiredoxin at the crossroads between enzymatic oxidative protein folding and nonenzymatic protein oxidation, Antioxid. Redox Signal. 18 (2013) 1666–1674,http://dx.doi.org/10.1089/ars.2012. 4966.
[68] S. Chattopadhaya, A. Harikishore, H.S. Yoon, Role of FK506 binding proteins in neu-rodegenerative disorders, Curr. Med. Chem. 18 (2011) 5380–5397.
[69]J.-S. Ju, C.C. Weihl, p97/VCP at the intersection of the autophagy and the ubiquitin proteasome system, Autophagy 6 (2010) 283–285.
[70]O. Corti, C. Hampe, H. Koutnikova, F. Darios, S. Jacquier, A. Prigent, et al., The p38 subunit of the aminoacyl-tRNA synthetase complex is a Parkin substrate: linking protein biosynthesis and neurodegeneration, Hum. Mol. Genet. 12 (2003) 1427–1437.
[71] K.A. Dickson, M.C. Haigis, R.T. Raines, Ribonuclease inhibitor: structure and function, Prog. Nucleic Acid Res. Mol. Biol. 80 (2005) 349–374,http://dx.doi.org/10.1016/ S0079-6603(05)80009-1.
[72] M.M. Emara, P. Ivanov, T. Hickman, N. Dawra, S. Tisdale, N. Kedersha, et al., Angiogenin-induced tRNA-derived stress-induced RNAs promote stress-induced stress granule assembly, J. Biol. Chem. 285 (2010) 10959–10968,http://dx.doi.org/ 10.1074/jbc.M109.077560.
[73] B. Pasternak, H. Svanström, N.M. Nielsen, L. Fugger, M. Melbye, A. Hviid, Use of calcium channel blockers and Parkinson's disease, Am. J. Epidemiol. 175 (2012) 627–635,http://dx.doi.org/10.1093/aje/kwr362.
[74] T.M. Dawson, V.L. Dawson, Molecular pathways of neurodegeneration in Parkinson's disease, Science 302 (2003) 819–822,http://dx.doi.org/10.1126/ science.1087753.
[75] S. Grimm, A. Hoehn, K.J. Davies, T. Grune, Protein oxidative modifications in the ageing brain: consequence for the onset of neurodegenerative disease, Free Radic. Res. 45 (2011) 73–88,http://dx.doi.org/10.3109/10715762.2010.512040.
1969 R. Lippolis et al. / Biochimica et Biophysica Acta 1852 (2015) 1960–1970
[76] S. Paratore, R. Parenti, A. Torrisi, A. Copani, F. Cicirata, S. Cavallaro, Genomic profiling of cortical neurons following exposure to beta-amyloid, Genomics 88 (2006) 468–479,http://dx.doi.org/10.1016/j.ygeno.2006.06.007.
[77] T. Calì, D. Ottolini, A. Negro, M. Brini, Enhanced parkin levels favor ER-mitochondria crosstalk and guarantee Ca(2+) transfer to sustain cell bioenergetics, Biochim. Biophys. Acta 1832 (2013) 495–508,http://dx.doi.org/10.1016/j.bbadis.2013.01. 004.
[78] L. Bouman, A. Schlierf, A.K. Lutz, J. Shan, A. Deinlein, J. Kast, et al., Parkin is transcrip-tionally regulated by ATF4: evidence for an interconnection between mitochondrial stress and ER stress, Cell Death Differ. 18 (2011) 769–782,http://dx.doi.org/10. 1038/cdd.2010.142.
[79] S.S. Cao, R.J. Kaufman, Endoplasmic reticulum stress and oxidative stress in cell fate decision and human disease, Antioxid. Redox Signal. 21 (2014) 396–413,http://dx. doi.org/10.1089/ars.2014.5851.
[80] G. Mercado, P. Valdés, C. Hetz, An ERcentric view of Parkinson's disease, Trends Mol. Med. 19 (2013) 165–175,http://dx.doi.org/10.1016/j.molmed.2012.12.005. [81] T. Omura, M. Kaneko, Y. Okuma, K. Matsubara, Y. Nomura, Endoplasmic reticulum
stress and Parkinson's disease: the role of HRD1 in averting apoptosis in
neurodegenerative disease, Oxidative Med. Cell. Longev. 2013 (2013) 239854,
http://dx.doi.org/10.1155/2013/239854.
[82] A. Signorile, L. Micelli, D. De Rasmo, A. Santeramo, F. Papa, R. Ficarella, et al., Regula-tion of the biogenesis of OXPHOS complexes in cell transiRegula-tion from replicating to quiescent state: involvement of PKA and effect of hydroxytyrosol, Biochim. Biophys. Acta 1843 (2014) 675–684,http://dx.doi.org/10.1016/j.bbamcr.2013.12.017. [83] M. Currò, A. Trovato-Salinaro, A. Gugliandolo, G. Koverech, F. Lodato, D. Caccamo,
et al., Resveratrol protects against homocysteine-induced cell damage via cell stress response in neuroblastoma cells, J. Neurosci. Res. 93 (2015) 149–156,http://dx.doi. org/10.1002/jnr.23453.
[84] V. Calabrese, C. Cornelius, A.T. Dinkova-Kostova, I. Iavicoli, R. Di Paola, A. Koverech, et al., Cellular stress responses, hormetic phytochemicals and vitagenes in aging and longevity, Biochim. Biophys. Acta 1822 (2012) 753–783,http://dx.doi.org/10. 1016/j.bbadis.2011.11.002.
[85] V. Calabrese, C. Cornelius, A.T. Dinkova-Kostova, E.J. Calabrese, M.P. Mattson, Cellular stress responses, the hormesis paradigm, and vitagenes: novel targets for therapeutic intervention in neurodegenerative disorders, Antioxid. Redox Signal. 13 (2010) 1763–1811,http://dx.doi.org/10.1089/ars.2009.3074.