www.maajournal.com
Open Access. Online & Print.
DOI: 10.5281/zenodo.3819595
NEW SPECTROSCOPIC DATA ON “MARMI MISCHI”
BAROQUE GLASS DECORATIONS FROM
“PALLIUM ALTARIS” OF MESSINA (SICILY, ITALY)
Di Bella M.
1, Sabatino G.
2*, Giuliano A.
3, Italiano F.
1, S. Quartieri
2$,
M. Triscari
2$, S. Magazù
2, A. Tripodo
21Istituto Nazionale di Geofisica e Vulcanologia (INGV), Sezione di Palermo, Via Ugo La Malfa 153, 90146
Palermo and Sede Operativa di Milazzo, Via dei Mille 46, 98057, Milazzo (ME), Italy
2Dipartimento di Scienze Matematiche e Informatiche, Scienze Fisiche e Scienze della Terra (MIFT),
Università di Messina, V. Stagno d’Alcontres 31, 98166 Messina S. Agata, Italy
3Museo Regionale di Messina, Viale della Libertà, 465, 98121 Messina (ME), Italy $ now retired
Received: 24/01/2020
Accepted: 07/05/2020 *Corresponding author: [email protected]
ABSTRACT
The ―Marmi Mischi‖ (mixed glass mosaic tesserae) are artificial calcium-rich glass decorations, typically used in southern Italy and Sicily during the Baroque period (1600-1700) to decorate walls and altars of reli-gious edifices. In this study, we provide new archaeometric information on the raw materials, pigments and opacifying agents used to produce ―Marmi Mischi‖ of ―Pallium altaris‖ from the Messina Regional Museum. To reach this objective, all the studied glass decorations were analysed by means of non-destructive portable X-ray fluorescence (pXRF). Some of the decorations were further subjected to Environmental scanning elec-tron microscopy (ESEM) and X-ray powder diffraction (XRPD) in the laboratory. Two types of glasses were recognised. The first one – bluish green in colour – is a basic or slightly modified ―carcara glass‖, character-ized by high concentrations of P. The second type – dark blue, turquoise, light turquoise and red in colour – is a ―carcara glass‖ modified by craftsmen, containing high amounts of colouring agents (Cu, Pb, Sn, Sb). The presence of schreibersite in some of the analysed samples indicates that forming occurred in extremely reducing conditions and proves that the glasses were produced in CaO furnaces called ―carcara‖ and used to produce lime. Moreover, our results suggest that: i) the dark blue, turquoise and bluish green nuances are as a result of Fe2+, with minor contribution by Cu and Co; ii) the light turquoise nuance is related to Fe2+ and Cu2+, with minor contribution by Co; and iii) the red colour is as a result of the reduction of copper to the metallic state by Sn and Pb. Ca-antimonate (Ca2Sb2O7) was identified as an opacifying agent for the blue glassy decorations, whereas metallic Cu was identified for the red. The overall results of the chemical and physical characterization of the ―Pallium altaris‖ glassy decorations from the Messina Regional Museum suggest that the used raw material was ―carcara glass,‖ to which various chemical elements were suitably added to obtain the desired nuances.
1. INTRODUCTION
In Italy the Baroque period began late in the 1500s. The Baroque style flourished in Sicily, especially af-ter the devastating earthquake in 1693 (Abbate, 1997; Sola, 2015). Whole cities had to be rebuilt. Splendid churches and palaces were erected according to a style that has been termed the ―Sicilian Baroque style.‖ The churches were often richly decorated with coloured marble and mosaic inlay called ―Marmi Mischi‖ (Giuffrè, 1992). More precisely, ―mischi‖ refers to flat marble inlays, which become tramischi, trabischior rabischi if elements in relief are inserted, normally in white marble, as occurs during the development of this singular technique (Sola, 2015). In fact, the inlay of coloured stones is one of the characteristics of the Sicilian Baroque (Accascina, 1963; Abbate, 1997). Specifically, the main element of the church, that is the altar, was made of a single piece of polychrome marble and was decorated with gilded volutes and garlands, often inlaid with other stones, such as lapis lazuli, agates and artificial glasses (Napoleone, 2001; Piazza, 2007; Sola, 2015). The artificial glasses are frequently referred to in lo-cal historilo-cal sources as being produced lolo-cally, and they are called ―smaltini‖ or ―pietre di carcara‖ (i.e., lime-kiln stones), with evident reference to their origin (Balenzano and Moresi, 2004; Artioli et al., 2009).
The ―Marmi Mischi‖ (Hills, 1999) inlay technique was introduced in Sicily during the 17th century, af-ter the Baroque style had been established in the Is-land. In general, the inlay technique appeared in Sic-ily around the 8th and 9th centuries, during the Arab dominations that took place in Palermo, although in the Norman churches the use of the polychrome marble became a real mosaic technique. In the fol-lowing years, the interest in this technique continued
to decrease, but the technique re-emerged in the 16th century due to the arrival on the island of Tuscan and Lombard marble workers, which in some way led to a new exploitation of the quarries of semi-precious stones present there. On this occasion, the Sicilian marble-makers made their own style the Ba-roque ideas of the time and created an inimitable artistic expression that distinguished them, aban-doning the severe and refined models of the Norman monuments.
Numerous churches in Palermo, Messina, Trapani, and many other centres of Sicily began to be covered in precious polychrome marble and hard stone in-lays, and gradually the manufacturers became more innovative and diversified the shops, especially those from Palermo and Messina. In the 17th century, the new style had taken root that the island "stones" became indispensable in the Baroque decoration and their exportation to Tuscany, Rome, Naples, and Genoa continued, intensifying even in the following centuries.
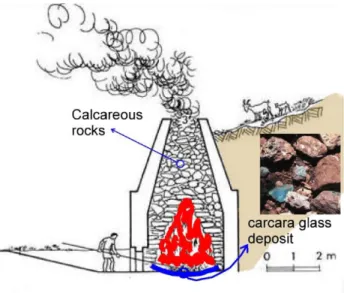
During the Baroque productions of the ―Marmi Mischi‖ in Southern Italy and Sicily, most artificial glasses were classified as ―smaltini‖ or ―vetri di car-cara‖, a term that came from the combustion slags of limestone furnaces (Montana and Gagliardo Briuccia, 1998). As far as the production of the ―Marmi mischi‖ is concerned, the written sources of the time seem to indicate an accidental production during the kiln firing (Mongitore, 1742; Schiavo, 1756; Artioli et al., 2009). The continuous need for adequate binders for buildings and mortars was achieved through the burning, in specific ―furnaces‖ called ―carcare,‖ of carbonatic rocks (such as limestone, marly limestone, and/or dolomitic limestone) good for CaO produc-tion (Fig. 1; Balenzano and Moresi, 2004).
After roasting of huge quantities of these car-bonates at the bottom of the furnaces, glassy to vit-reous materials were found, mostly green-blue in colour (both dark and pale), which were collected and used as glasses in the ―Mischi‖ decorations (Montana and Gagliardo Briuccia, 1998). Many piec-es of thpiec-ese ―Marmi Mischi‖ mosaics (frontal wall of altars, spare mosaic samples, and glassy materials in the form of cakes ready to be cut in fragments and/or slabs) are preserved at the Regional Museum of Messina (Pavone Alajmo, 2001). They are related to the Messina earthquake in 1908. This well-known seismic activity that affected over time the north-eastern portion of Sicily and southern Calabria was responsible – among other damages – for impair-ments to the stone monumental heritage to which we also ascribe the works "Marmi Mischi" and/or the "Marble inlays".
Only Artioli et al. (2009) reported mineralogical and chemical-physical data in their study on the ―smaltini di calcara‖, represented by blue enamels, widely used in the 17th and 18th centuries, to make altar decorations of several baroque churches in Pa-lermo, Sicily. Their study revealed that blue smaltini represent rare ancient blue glasses pigmented by divalent iron cations, in distorted octahedral coordi-nation, and are mixed-alkali glass accidentally pro-duced under severely reducing conditions in the lo-cal kilns during the production of lime.
In order to improve the archaeometric knowledge on the Baroque mosaic glass decorations, we present a study of the ―Marmi Mischi‖, commonly called ―smaltini di calcara‖, which actually turn out to be an unusual historical case of colored glasses decora-tions (for a review on archaeometry, see, Liritzis et al., 2020) . In our investigation, a set of spare mosaic tesserae and glassy materials including green-blue, blue, turquoise and red glasses - recovered at the Messina Regional Museum, have been analyzed. The study aims to investigate the chemical composition and the nature of the glass matrix, colorants, and opacifying agents in all the main nuances of smaltini. The analytical approach adopted includes the min-eralogical and chemical characterization of single pieces of decorations in the laboratory by scanning electron microscopy (SEM-BSE) and X-ray powder
diffraction (XRPD) analyses, and the chemical char-acterization of altar decorations in situ using porta-ble X-ray fluorescence (pXRF). The obtained data have been compared with those of similar glass ma-terials of the same age acquired from some churches in Palermo and studied by Artioli et al. (2009), with the aim of garnering additional information on the used carcara raw glass.
2. MATERIALS
AND
EXPERIMENTAL
METHODS
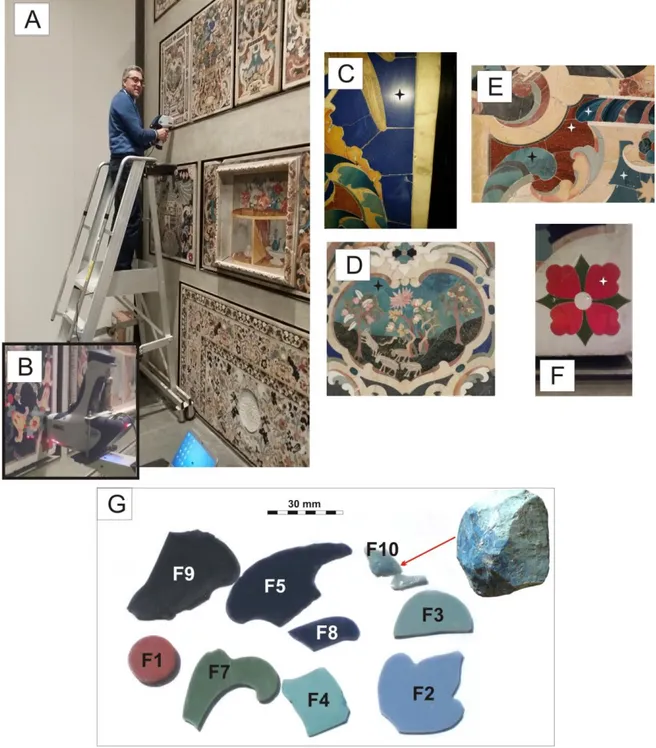
The glass decorations from the altars and walls of churches recovered at the Messina Regional Muse-um were provided by the Soprintendenza BB.CC. of Messina. Fig. 2 reports images of the selected and analysed samples, representative of the various col-ours present in the glassy decorations of the Baroque ―Marmi Mischi‖ mosaics. The studied glassy decora-tions were all opaque and showed intense colouring in red, green, and several nuances of blue, from tur-quoise to dark blue. Two series of samples, making up a total of 40 decorations, were analysed. The first suite (PL series) included 32 decorations directly taken from the ―Pallium altaris‖ located in a room of the Messina Museum: dark blue PL1-PL5, turquoise PL6-PL8, light turquoise PL9-PL14, bluish green PL15-PL24, red PL26-PL32. The other series was composed of erratic fragments of decorations stored in the ―Fiore‖ deposit of the Regional Museum of Messina and belonging to similar Baroque decora-tions. From this second series of materials, 8 frag-ments of the most representative colours were se-lected: red (F1), turquoise (F2, F3), light turquoise (F4), dark blue (F5, F8), bluish green (F7), and one sample of carcara raw glass (F10). All the samples were analysed for major and trace elements compo-sition (Table 1, see Appendix) by handheld XRF spectroscopy (pXRF). Moreover, samples from the ―Fiore‖ deposit were analysed by means of Envi-ronmental Scanning Electron Microscopy (ESEM) in order to identify textures and inclusions, and X-Ray Powder Diffraction (XRPD) were performed on the opaque samples to identify crystalline phases dis-persed in the glass matrix.
Fig. 2 - A) The Baroque “Marmi Mischi” decorations of “Pallium altaris” kept at the Regional Museum of Messina and analysed through portable XRF; B) Particulars of the XRF analyses C) D) E) and F) Particulars of the several variously coloured analysed decorations; G) Fragments of the glassy decorations (F1-F9) and a piece of raw glass (F10) collected
at the “Fiore” deposit in the Regional Museum of Messina.
2.1. HANDHELD X-RAY FLUORESCENCE
(XRF)
Non-destructive in situ analyses were performed using a handheld XRF S1 Titan 600 by Bruker. The TITAN 600 spectrometer (Bruker) is equipped with a silicon‐drift detector FAST SDD®, with a resolution <145 eV and an analytic range from magnesium to uranium. The excitation source was a 4 W Rh target X‐ray tube equipped with an automatic adjustment system that optimizes the analyses of the chemical
species in terms of X‐ray voltage (6 - 50 kV) and cur-rent (5 - 100 μA) values. The spot was 5 mm sized, with five‐position motorized filter changer. The use of 5 filters (Ti 25 µm; Cu 200 µm + Ti 25 µm +Al 300 µm; Al 76 µm; C 60 µm, F 190 µm; no filter) is auto-matically managed by the instrument software on the basis of the X‐ray power of the analysed ele-ments. The nose of pXRF instrument ις in contact with the planar surface of the sample. The instru-ment also employs a patented X‐ray geometry,
namely the Sharp Beam TM Optimized Geometry (patent n. 8.223.925 by Shannon, 2012). It is a 45° an-gle geometry, and the beam size is controlled by a collimator that is placed between the X‐ray tube and the sample. The collimator includes a plurality of ridges extending from the interior surface of the housing towards a centre of the cavity. A laptop computer was used for instrument operation and data storage. X‐ray counts were processed using the S1PXRF spectra program developed by Bruker and converted to concentrations (major elements report-ed as oxides) using a Bruker‐designreport-ed calibration program (GeoChem Trace) verified by use of stand-ard provided by Bruker, which utilizes the Comp-ton's scatter derived from rhodium backscatter. The GeoChem Trace is a calibration software optimized for applications in mineralogical and geochemical fields. This software includes full light element sup-port via dual phase measurement. During pXRF analyses, the surface of the investigated object was carefully cleaned by using analytical acetone.chaeom
2.1.1 Environmental
Scanning
Electron
Microscopy (ESEM)
The textural investigations of the glass matrix were mainly performed to show the presence of crystalline opacifying agents and to define their morphology; EDX analyses were run to obtain quali-tative chemical analysis on these inclusions. The BSE images were obtained by an ESEM-FEI Inspect-S electron microscope coupled with an Oxford INCA PentaFETx3 EDX spectrometer, a Si(Li) detector equipped with an ultra-thin window ATW2, using a resolution of 137 eV at 5.9 keV (Mn Kα1). The energy dispersion spectral data were acquired under the following conditions: a working distance of 10 mm with an acceleration voltage of 20 kV, counting time of 60 s, count per second of approximately 3000 cps with dead time below 30%. The results were pro-cessed by INCA Energy software. This software uses the XPP matrix correction scheme developed by Pouchou and Pichoir (Pouchou and Pichoir, 1984; 1985).
2.1.1.1 X-Ray Powder Diffraction (XRPD)
X-ray diffraction experiments were performed on the opaque samples to identify crystalline phases dispersed in the glass matrix. A non-destructive pro-cedure was followed, working directly on the ―smaltini‖ using an appropriate multi-purpose sam-ple stage. Data were collected using a BRUKER D8 ADVANCE diffractometer with Cu Kα radiation on a Bragg–Brentano theta–theta goniometer, equipped with a SiLi solid-state detector, Sol-X. The patterns were collected from 2 to 80 2θ degrees, with a step size of 0.02° and a count time of 1 s. Observed peak
positions were matched against the ICDD–JCPDS database.
3. DISCUSSION OF RESULTS
The obtained data are addressed to discuss, firstly, the composition of the raw glassy materials, whilst in the following paragraphs data useful for the iden-tification of colouring and opacifying agents are dis-cussed. Then, the obtained data related to the blue decorations are compared with those obtained by Artioli et al. (2009), a study on the Sicilian blue car-cara glassy decorations from the Baroque churches of Palermo city.
3.1 BASE GLASS CHARACTERISTICS
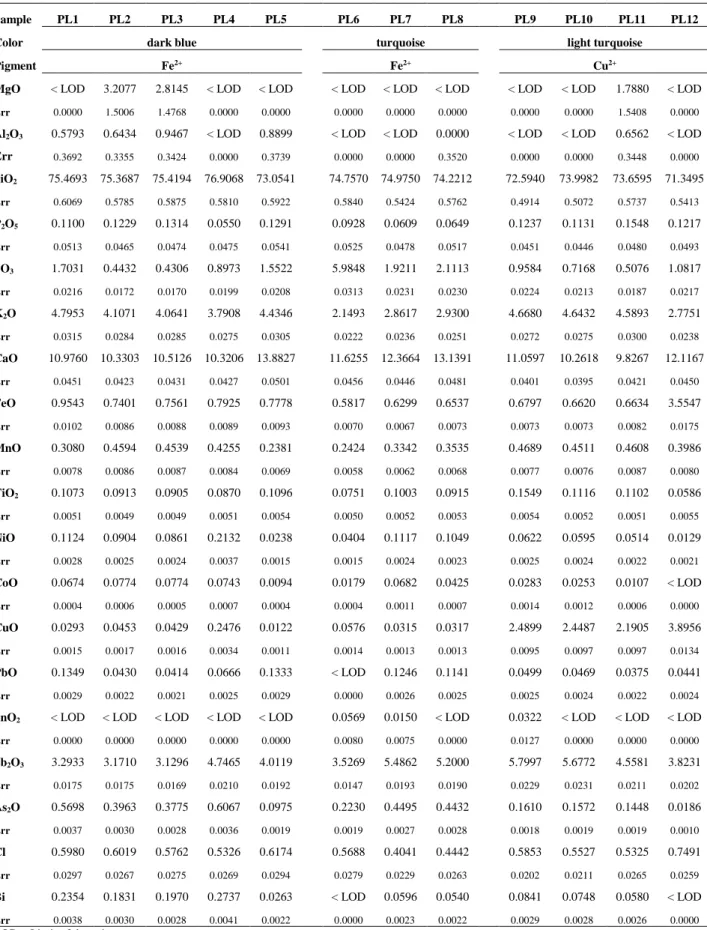
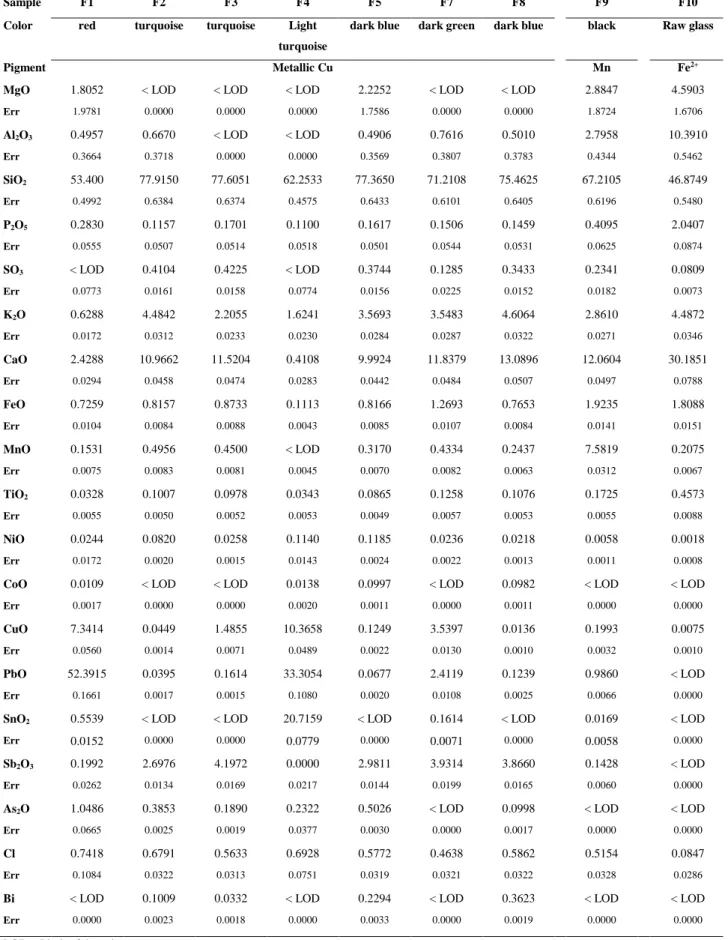
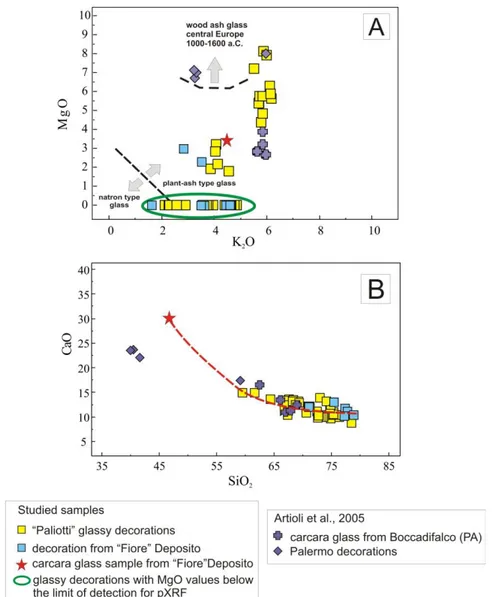
The results of bulk chemistry analyses carried out with handheld XRF on all the studied samples ob-tained from the ―Pallium altaris‖ (PL1-PL32) and the ―Fiore‖ deposit (F1-F10) are reported in Table 1. The major element analysis shows that they are all sili-cate glasses (except for the raw glass sample F10), with silica in the range of 53 % to 79 %. The other major components vary in the following ranges: CaO from 1.4 % to 12.2 %, Al2O3 from 1.3 % to 3 %, K2O from 1.8 % to 5.4 %, and MgO from 1.8 % to 3.5 %. The high amount of K2O and MgO allowed the clas-sification of the raw materials as plant ash to wood ash types (Fig. 3A). The variability in Ca and Mg composition could be attributed to the carbonatic rock charge, used during the production process of lime in the carcara kiln. The consistent amount of K, Na and Ca essentially derived from the plants used as fuel, given that the carbonatic rocks, e.g. limestone, are in themselves totally devoid of alkali cations (Ar-tioli et al. 2009). The plants that are thought to be the sources of alkalis also contribute phosphorus to the glass, because the analysed carcara glass sample (F10) is P-rich, as can be observed in Tab. 1. The var-iation diagram of Fig. 3B shows the negative correla-tion between CaO and SiO2. The decrease in CaO with increasing SiO2, starting from the raw carcara glass to the compositions of the decorations, as can be seen in Fig. 3b, shows that silica was added to the raw materials to obtain the desired glass. Further-more, among the major oxides, MnO (~ 0.11-0.9 %) is present as a minor component in the original raw rocks, TiO2 never exceeds 0.4 %, and hence it is as-cribable to impurities of oxide minerals in the raw rocks. As regards antimony oxide, it is largely used as a decolorizing and opacifying agent, and is par-ticularly abundant in the opaque blue, low in the red, and under detection limit in the bluish green decora-tions (Tab. 1). Lead oxide content is very high in the opaque red decorations, F1 (PbO 52 %) and F4 (PbO 33 %), and very low in the other samples (Tab. 1).Tab. 1 – XRF compositional data (ppm) and the errors of the “Pallium altaris” decorations analysed in situ.
Tab. 1 – Continued.
Sample PL1 PL2 PL3 PL4 PL5 PL6 PL7 PL8 PL9 PL10 PL11 PL12
Color dark blue turquoise light turquoise
Pigment Fe2+ Fe2+ Cu2+
MgO < LOD 3.2077 2.8145 < LOD < LOD < LOD < LOD < LOD < LOD < LOD 1.7880 < LOD
Err 0.0000 1.5006 1.4768 0.0000 0.0000 0.0000 0.0000 0.0000 0.0000 0.0000 1.5408 0.0000
Al2O3 0.5793 0.6434 0.9467 < LOD 0.8899 < LOD < LOD 0.0000 < LOD < LOD 0.6562 < LOD Err 0.3692 0.3355 0.3424 0.0000 0.3739 0.0000 0.0000 0.3520 0.0000 0.0000 0.3448 0.0000 SiO2 75.4693 75.3687 75.4194 76.9068 73.0541 74.7570 74.9750 74.2212 72.5940 73.9982 73.6595 71.3495 Err 0.6069 0.5785 0.5875 0.5810 0.5922 0.5840 0.5424 0.5762 0.4914 0.5072 0.5737 0.5413 P2O5 0.1100 0.1229 0.1314 0.0550 0.1291 0.0928 0.0609 0.0649 0.1237 0.1131 0.1548 0.1217 Err 0.0513 0.0465 0.0474 0.0475 0.0541 0.0525 0.0478 0.0517 0.0451 0.0446 0.0480 0.0493 SO3 1.7031 0.4432 0.4306 0.8973 1.5522 5.9848 1.9211 2.1113 0.9584 0.7168 0.5076 1.0817 Err 0.0216 0.0172 0.0170 0.0199 0.0208 0.0313 0.0231 0.0230 0.0224 0.0213 0.0187 0.0217 K2O 4.7953 4.1071 4.0641 3.7908 4.4346 2.1493 2.8617 2.9300 4.6680 4.6432 4.5893 2.7751 Err 0.0315 0.0284 0.0285 0.0275 0.0305 0.0222 0.0236 0.0251 0.0272 0.0275 0.0300 0.0238 CaO 10.9760 10.3303 10.5126 10.3206 13.8827 11.6255 12.3664 13.1391 11.0597 10.2618 9.8267 12.1167 Err 0.0451 0.0423 0.0431 0.0427 0.0501 0.0456 0.0446 0.0481 0.0401 0.0395 0.0421 0.0450 FeO 0.9543 0.7401 0.7561 0.7925 0.7778 0.5817 0.6299 0.6537 0.6797 0.6620 0.6634 3.5547 Err 0.0102 0.0086 0.0088 0.0089 0.0093 0.0070 0.0067 0.0073 0.0073 0.0073 0.0082 0.0175 MnO 0.3080 0.4594 0.4539 0.4255 0.2381 0.2424 0.3342 0.3535 0.4689 0.4511 0.4608 0.3986 Err 0.0078 0.0086 0.0087 0.0084 0.0069 0.0058 0.0062 0.0068 0.0077 0.0076 0.0087 0.0080 TiO2 0.1073 0.0913 0.0905 0.0870 0.1096 0.0751 0.1003 0.0915 0.1549 0.1116 0.1102 0.0586 Err 0.0051 0.0049 0.0049 0.0051 0.0054 0.0050 0.0052 0.0053 0.0054 0.0052 0.0051 0.0055 NiO 0.1124 0.0904 0.0861 0.2132 0.0238 0.0404 0.1117 0.1049 0.0622 0.0595 0.0514 0.0129 Err 0.0028 0.0025 0.0024 0.0037 0.0015 0.0015 0.0024 0.0023 0.0025 0.0024 0.0022 0.0021 CoO 0.0674 0.0774 0.0774 0.0743 0.0094 0.0179 0.0682 0.0425 0.0283 0.0253 0.0107 < LOD Err 0.0004 0.0006 0.0005 0.0007 0.0004 0.0004 0.0011 0.0007 0.0014 0.0012 0.0006 0.0000 CuO 0.0293 0.0453 0.0429 0.2476 0.0122 0.0576 0.0315 0.0317 2.4899 2.4487 2.1905 3.8956 Err 0.0015 0.0017 0.0016 0.0034 0.0011 0.0014 0.0013 0.0013 0.0095 0.0097 0.0097 0.0134 PbO 0.1349 0.0430 0.0414 0.0666 0.1333 < LOD 0.1246 0.1141 0.0499 0.0469 0.0375 0.0441 Err 0.0029 0.0022 0.0021 0.0025 0.0029 0.0000 0.0026 0.0025 0.0025 0.0024 0.0022 0.0024
SnO2 < LOD < LOD < LOD < LOD < LOD 0.0569 0.0150 < LOD 0.0322 < LOD < LOD < LOD Err 0.0000 0.0000 0.0000 0.0000 0.0000 0.0080 0.0075 0.0000 0.0127 0.0000 0.0000 0.0000 Sb2O3 3.2933 3.1710 3.1296 4.7465 4.0119 3.5269 5.4862 5.2000 5.7997 5.6772 4.5581 3.8231 Err 0.0175 0.0175 0.0169 0.0210 0.0192 0.0147 0.0193 0.0190 0.0229 0.0231 0.0211 0.0202 As2O 0.5698 0.3963 0.3775 0.6067 0.0975 0.2230 0.4495 0.4432 0.1610 0.1572 0.1448 0.0186 Err 0.0037 0.0030 0.0028 0.0036 0.0019 0.0019 0.0027 0.0028 0.0018 0.0019 0.0019 0.0010 Cl 0.5980 0.6019 0.5762 0.5326 0.6174 0.5688 0.4041 0.4442 0.5853 0.5527 0.5325 0.7491 Err 0.0297 0.0267 0.0275 0.0269 0.0294 0.0279 0.0229 0.0263 0.0202 0.0211 0.0265 0.0259 Bi 0.2354 0.1831 0.1970 0.2737 0.0263 < LOD 0.0596 0.0540 0.0841 0.0748 0.0580 < LOD Err 0.0038 0.0030 0.0028 0.0041 0.0022 0.0000 0.0023 0.0022 0.0029 0.0028 0.0026 0.0000
Sample PL13 PL14 PL15 PL16 PL17 PL18 PL19 PL20 PL21 PL22 PL23 PL24
Color light turquoise bluish-green
Pigment Cu2+ Fe2+
MgO < LOD < LOD 5.3911 4.3647 5.3550 4.8030 5.7265 5.7237 5.6232 6.2760 5.8582 8.1146
Err 0.0000 0.0000 1.5227 1.4425 1.4339 1.4712 1.5706 1.5007 1.3117 1.4122 1.6441 1.6167 Al2O3 < LOD 0.5873 3.3894 3.2574 2.8301 3.2341 2.9431 2.9183 3.5939 3.6182 4.1190 3.8624 Err 0.0000 0.3652 0.3895 0.3779 0.3669 0.3818 0.3939 0.3824 0.3504 0.3674 0.4183 0.4110 SiO2 70.6512 71.0846 67.5441 67.6994 68.4221 69.2820 68.3532 69.4192 68.7808 66.8229 66.8269 64.3867 Err 0.5388 0.5688 0.6111 0.5772 0.5856 0.6035 0.6298 0.6202 0.5344 0.5509 0.6381 0.6228 P2O5 0.1162 0.2067 1.6462 1.5879 1.7216 1.6093 1.6823 1.6392 1.2941 1.3685 1.7328 1.6551 Err 0.0481 0.0521 0.0658 0.0634 0.0638 0.0640 0.0675 0.0652 0.0553 0.0589 0.0693 0.0687 SO3 0.9482 0.7962 1.5071 2.1664 1.1721 0.5913 1.1190 0.3329 0.4274 0.8724 1.1529 0.8576 Err 0.0216 0.0204 0.0170 0.0203 0.0166 0.0144 0.0153 0.0128 0.0159 0.0167 0.0156 0.0137 K2O 3.7490 3.5774 5.7343 5.7928 5.7219 5.8508 5.7520 5.8750 6.1808 6.1315 6.1689 5.8807 Err 0.0269 0.0275 0.0354 0.0342 0.0341 0.0350 0.0360 0.0357 0.0329 0.0340 0.0378 0.0370 CaO 10.7235 12.0723 13.3201 13.5479 13.4264 13.1552 13.0419 12.7712 12.3846 13.2810 12.3261 13.5556 Err 0.0427 0.0466 0.0505 0.0490 0.0490 0.0492 0.0507 0.0493 0.0440 0.0470 0.0502 0.0522 FeO 3.2396 3.7786 1.0216 1.0198 0.9558 1.0556 0.9937 0.9574 1.2102 1.1889 1.3356 1.2687 Err 0.0166 0.0190 0.0111 0.0105 0.0102 0.0109 0.0111 0.0106 0.0089 0.0093 0.0113 0.0111 MnO 0.5392 0.5258 0.1213 0.1183 0.1186 0.1187 0.1164 0.1204 0.1495 0.1468 0.1516 0.1522 Err 0.0091 0.0094 0.0054 0.0051 0.0051 0.0052 0.0054 0.0053 0.0044 0.0046 0.0053 0.0054 TiO2 0.0750 0.0738 0.1485 0.1597 0.1356 0.1544 0.1428 0.1435 0.2169 0.2080 0.1906 0.1760 Err 0.0055 0.0056 0.0050 0.0051 0.0049 0.0050 0.0049 0.0049 0.0052 0.0052 0.0053 0.0054 NiO 0.0493 0.0110 0.0013 0.0012 0.0000 0.0010 0.0012 0.0016 0.0017 0.0018 0.0009 0.0014 Err 0.0029 0.0018 0.0007 0.0008 0.0007 0.0007 0.0007 0.0007 0.0007 0.0007 0.0006 0.0006
CoO < LOD < LOD < LOD < LOD < LOD < LOD < LOD < LOD 0.0000 < LOD < LOD < LOD
Err 0.0000 0.0000 0.0000 0.0000 0.0000 0.0000 0.0000 0.0000 0.0005 0.0000 0.0000 0.0000
CuO 4.8057 2.7318 0.0180 0.0962 0.0080 0.0084 0.0347 0.0087 0.0082 0.0078 0.0076 0.0071
Err 0.0152 0.0113 0.0011 0.0021 0.0008 0.0009 0.0014 0.0009 0.0007 0.0007 0.0007 0.0007
PbO 0.0503 0.0442 < LOD < LOD < LOD < LOD < LOD < LOD < LOD 0.0017 0.0196 0.0036
Err 0.0026 0.0023 0.0000 0.0000 0.0000 0.0000 0.0000 0.0000 0.0000 0.0013 0.0014 0.0012
SnO2 < LOD < LOD < LOD < LOD < LOD < LOD < LOD < LOD < LOD < LOD < LOD < LOD Err 0.0000 0.0000 0.0000 0.0000 0.0000 0.0000 0.0000 0.0000 0.0000 0.0000 0.0000 0.0000
Sb2O3 4.3956 3.7544 < LOD < LOD < LOD < LOD < LOD < LOD < LOD < LOD < LOD < LOD Err 0.0225 0.0196 0.0000 0.0000 0.0000 0.0000 0.0000 0.0000 0.0000 0.0000 0.0000 0.0000
As2O 0.0485 0.0243 < LOD < LOD < LOD < LOD < LOD < LOD < LOD < LOD < LOD < LOD Err 0.0014 0.0011 0.0000 0.0000 0.0000 0.0000 0.0000 0.0000 0.0000 0.0000 0.0000 0.0000
Cl 0.5837 0.7269 0.1515 0.1777 0.1268 0.1320 0.0836 0.0881 0.1282 0.0745 0.1050 0.0772
Err 0.0253 0.0283 0.0266 0.0243 0.0242 0.0251 0.0267 0.0257 0.0202 0.0213 0.0287 0.0279
Bi 0.0200 < LOD < LOD < LOD < LOD < LOD < LOD < LOD < LOD < LOD < LOD < LOD
Err 0.0025 0.0000 0.0000 0.0000 0.0000 0.0000 0.0000 0.0000 0.0000 0.0000 0.0000 0.0000
Tab. 1 – Continued.
Samples PL25 PL26 PL27 PL28 PL29 PL30 PL31 PL32
color bluish-green red
Pigment Fe2+ Metallic Cu
MgO 7.8841 1.9044 < LOD < LOD < LOD < LOD < LOD < LOD
Err 1.7030 1.7789 0.0000 0.0000 0.0000 0.0000 0.0000 0.0000 Al2O3 4.6794 1.1191 0.7857 1.0566 0.4236 0.8007 1.6037 1.0999 Err 0.4339 0.3753 0.3780 0.3757 0.3581 0.3544 0.3630 0.3690 SiO2 61.6334 74.9558 76.4533 78.5251 70.4353 67.4367 72.7028 72.8470 Err 0.6170 0.6328 0.6316 0.6507 0.5749 0.5468 0.5959 0.5896 P2O5 2.1823 0.1634 0.1004 0.1989 0.1543 0.3063 0.2738 0.1965 Err 0.0761 0.0507 0.0510 0.0498 0.0511 0.0520 0.0506 0.0516 SO3 0.8100 0.5340 0.6646 0.3028 < LOD 0.3873 0.1489 < LOD Err 0.0135 0.0186 0.0194 0.0164 0.0269 0.0297 0.0239 0.0254 K2O 6.0082 3.8836 3.9890 4.8817 2.2863 2.3137 2.5928 2.5954 Err 0.0378 0.0296 0.0297 0.0326 0.0230 0.0225 0.0242 0.0242 CaO 14.8698 9.5402 9.9190 8.6704 9.4445 10.3017 9.7854 10.1053 Err 0.0552 0.0429 0.0433 0.0409 0.0425 0.0435 0.0429 0.0433 FeO 1.4330 2.2586 2.2940 1.6913 3.0651 3.1550 2.6922 2.7713 Err 0.0120 0.0157 0.0156 0.0135 0.0152 0.0151 0.0145 0.0145 MnO 0.1649 0.7007 0.7052 0.6977 0.9396 0.9438 0.6357 0.6196 Err 0.0056 0.0113 0.0112 0.0112 0.0108 0.0106 0.0093 0.0090 TiO2 0.2261 0.0891 0.0781 0.0669 0.0549 0.0878 0.0681 0.0456 Err 0.0059 0.0048 0.0049 0.0045 0.0052 0.0055 0.0049 0.0051 NiO 0.0014 0.0123 0.0131 0.0107 0.0203 0.0214 0.0130 0.0144 Err 0.0006 0.0018 0.0018 0.0015 0.0025 0.0025 0.0020 0.0021
CoO < LOD < LOD < LOD < LOD < LOD < LOD < LOD < LOD
Err 0.0000 0.0000 0.0000 0.0000 0.0000 0.0000 0.0000 0.0000
CuO 0.0091 3.5482 3.6827 2.9821 4.1978 4.2505 3.0358 3.0788
Err 0.0008 0.0130 0.0131 0.0113 0.0139 0.0137 0.0115 0.0118
PbO 0.0039 0.5107 0.5260 0.0773 3.2376 3.3879 2.7272 2.7993
Err 0.0012 0.0051 0.0051 0.0023 0.0126 0.0127 0.0110 0.0114
SnO2 < LOD 0.0119 < LOD < LOD 4.6269 5.4762 3.0791 3.0988
Err 0.0000 0.0065 0.0000 0.0000 0.0224 0.0254 0.0174 0.0177
Sb2O3 < LOD 0.0368 0.0400 0.0480 0.4309 0.4589 0.0383 0.0432
Err 0.0000 0.0056 0.0056 0.0053 0.0088 0.0089 0.0058 0.0060
As2O < LOD < LOD < LOD 0.0122 < LOD < LOD < LOD < LOD
Err 0.0000 0.0000 0.0000 0.0012 0.0000 0.0000 0.0000 0.0000
Cl 0.0932 0.7311 0.7488 0.7785 0.6791 0.6656 0.6015 0.5979
Err 0.0289 0.0330 0.0327 0.0333 0.0313 0.0294 0.0316 0.0308
Bi < LOD < LOD < LOD < LOD < LOD < LOD < LOD < LOD
Err 0.0000 0.0000 0.0000 0.0000 0.0000 0.0000 0.0000 0.0000
Tab. 1 – Continued.
Sample F1 F2 F3 F4 F5 F7 F8 F9 F10
Color red turquoise turquoise Light turquoise
dark blue dark green dark blue black Raw glass
Pigment Metallic Cu Mn Fe2+
MgO 1.8052 < LOD < LOD < LOD 2.2252 < LOD < LOD 2.8847 4.5903
Err 1.9781 0.0000 0.0000 0.0000 1.7586 0.0000 0.0000 1.8724 1.6706 Al2O3 0.4957 0.6670 < LOD < LOD 0.4906 0.7616 0.5010 2.7958 10.3910 Err 0.3664 0.3718 0.0000 0.0000 0.3569 0.3807 0.3783 0.4344 0.5462 SiO2 53.400 77.9150 77.6051 62.2533 77.3650 71.2108 75.4625 67.2105 46.8749 Err 0.4992 0.6384 0.6374 0.4575 0.6433 0.6101 0.6405 0.6196 0.5480 P2O5 0.2830 0.1157 0.1701 0.1100 0.1617 0.1506 0.1459 0.4095 2.0407 Err 0.0555 0.0507 0.0514 0.0518 0.0501 0.0544 0.0531 0.0625 0.0874 SO3 < LOD 0.4104 0.4225 < LOD 0.3744 0.1285 0.3433 0.2341 0.0809 Err 0.0773 0.0161 0.0158 0.0774 0.0156 0.0225 0.0152 0.0182 0.0073 K2O 0.6288 4.4842 2.2055 1.6241 3.5693 3.5483 4.6064 2.8610 4.4872 Err 0.0172 0.0312 0.0233 0.0230 0.0284 0.0287 0.0322 0.0271 0.0346 CaO 2.4288 10.9662 11.5204 0.4108 9.9924 11.8379 13.0896 12.0604 30.1851 Err 0.0294 0.0458 0.0474 0.0283 0.0442 0.0484 0.0507 0.0497 0.0788 FeO 0.7259 0.8157 0.8733 0.1113 0.8166 1.2693 0.7653 1.9235 1.8088 Err 0.0104 0.0084 0.0088 0.0043 0.0085 0.0107 0.0084 0.0141 0.0151 MnO 0.1531 0.4956 0.4500 < LOD 0.3170 0.4334 0.2437 7.5819 0.2075 Err 0.0075 0.0083 0.0081 0.0045 0.0070 0.0082 0.0063 0.0312 0.0067 TiO2 0.0328 0.1007 0.0978 0.0343 0.0865 0.1258 0.1076 0.1725 0.4573 Err 0.0055 0.0050 0.0052 0.0053 0.0049 0.0057 0.0053 0.0055 0.0088 NiO 0.0244 0.0820 0.0258 0.1140 0.1185 0.0236 0.0218 0.0058 0.0018 Err 0.0172 0.0020 0.0015 0.0143 0.0024 0.0022 0.0013 0.0011 0.0008
CoO 0.0109 < LOD < LOD 0.0138 0.0997 < LOD 0.0982 < LOD < LOD
Err 0.0017 0.0000 0.0000 0.0020 0.0011 0.0000 0.0011 0.0000 0.0000
CuO 7.3414 0.0449 1.4855 10.3658 0.1249 3.5397 0.0136 0.1993 0.0075
Err 0.0560 0.0014 0.0071 0.0489 0.0022 0.0130 0.0010 0.0032 0.0010
PbO 52.3915 0.0395 0.1614 33.3054 0.0677 2.4119 0.1239 0.9860 < LOD
Err 0.1661 0.0017 0.0015 0.1080 0.0020 0.0108 0.0025 0.0066 0.0000
SnO2 0.5539 < LOD < LOD 20.7159 < LOD 0.1614 < LOD 0.0169 < LOD
Err 0.0152 0.0000 0.0000 0.0779 0.0000 0.0071 0.0000 0.0058 0.0000
Sb2O3 0.1992 2.6976 4.1972 0.0000 2.9811 3.9314 3.8660 0.1428 < LOD
Err 0.0262 0.0134 0.0169 0.0217 0.0144 0.0199 0.0165 0.0060 0.0000
As2O 1.0486 0.3853 0.1890 0.2322 0.5026 < LOD 0.0998 < LOD < LOD
Err 0.0665 0.0025 0.0019 0.0377 0.0030 0.0000 0.0017 0.0000 0.0000
Cl 0.7418 0.6791 0.5633 0.6928 0.5772 0.4638 0.5862 0.5154 0.0847
Err 0.1084 0.0322 0.0313 0.0751 0.0319 0.0321 0.0322 0.0328 0.0286
Bi < LOD 0.1009 0.0332 < LOD 0.2294 < LOD 0.3623 < LOD < LOD
Err 0.0000 0.0023 0.0018 0.0000 0.0033 0.0000 0.0019 0.0000 0.0000
Fig. 3 – a) K2O vs MgO classification diagram by Lilyquist and Brill (1995) indicates that different types of wood have
been used during the firing process (Fig. 1); b) SiO2 vs CaO variation diagram suggests the use of low pure limestone.
On the contrary, data of the raw glass sample F10 indicate a composition made up of SiO2 (~ 47 %), MgO (4.37 %), K2O (4.48 %), Al2O3 (10.39 %), FeO (1.8 %), and CaO (30.18 %). The minor oxides are present in very low amount, such as CuO (0.0075 %), or are under the limit of detection, such as PbO, SnO2, Sb2O3 and CoO (Table 1, Appendix). Hence, the craftsmen used the carcara glassy waste re-trieved from the lime kiln and suitably modified it, adding silica and/or other chemical substances, with the aim of obtaining the desired glass compositions for the production of the decorations.
Specifically, the composition of the raw glass sample is very similar to those of the bluish green samples (PL15-PL24), which show comparable high values of P2O5 and FeO (0.95-1.33 %) and very low amount of CuO (0.0180-0.0962 %). Probably, these bluish green glassy decorations were very little pro-cessed, in terms of the added elements, compared to the raw carcara glass.
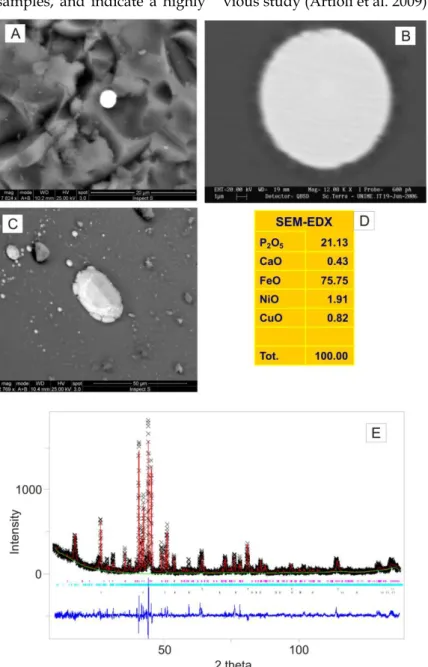
Additional evidence in favor of the use of carcara glass as raw material comes from SEM and XRPD data. Inside the glass, perfectly rounded metal spherules of different sizes and up to 9 mm in diam-eter were seen during SEM-EDX analyses (Fig. 4A, B, C). Among the analysed metal spherules, schreiber-site [(Fe,Ni)3P] was found (Fig. 4d). In most of the XRPD patterns (e.g. Fig. 4E), the presence of the mineral phase schreibersite was detected, in particu-lar, in the blue glassy decorations. Schreibersite is generally a very rare iron nickel phosphide mineral, though common in iron-nickel meteorites. Its pres-ence undoubtedly proves the occurrpres-ence of reducing conditions during the production process, from which derive glass used to realize the studied deco-rations. The forming environment of schreibersite is compatible with the extremely reducing conditions of CaO-producing furnace. The P reacted with Fe during the glass formation to yield unmixed droplets of Fe phosphides that were visible in the SEM
backscattered electron maps, both in the slags and in
the decoration glass samples, and indicate a highly reducing atmosphere as already suggested in a pre-vious study (Artioli et al. 2009).
Fig. 4 – Schreibersite particles and composition. A) rounded particle of schreibersite in blue glass decoration and B) magnification of a rounded particle of schreibersite; c) heuedral crystal of schreibersite in carcara glass, D) semi-quantitative SEM-EDX analysis of schreibersite particles; E) Qualitative Rietveld XRPD pattern performed
on extracted particles of schreibersite .
3.2 PIGMENTS AND OPACIFIERS
Turquoise and blue decorations – The nuances vary from turquoise and light turquoise to dark blue and bluish-green. Specifically, the light turquoise color can be ascribed to the presence of high copper contents, occurring in the form of Cu2+ cations (e.g. Arletti et al. 2006a, b), and/or to the natural color of the raw carcara glass determined by Fe2+ cations (Ar-tioli et al. 2009). In particular, the samples, PL9 - PL13 (CuO=2.1905 ÷ 3.8956 %) and F4 (CuO=10.34 %), contain the highest amounts of CuO (Tab. 1). Turqouise and dark blue decorations are
characterized by very low amount of Cu (0.012 - 0.057 %), and the contribution of Fe2+ is probably important. With respect to the turquoise and dark blue samples, the nuances of the blue tesserae could have been as a result of cobalt (CoO=0.017 - 0.077 %) (Tab. 1). The bluish-green decorations reflect the col-or of the raw carcara glass, since they are very simi-lar to it in terms of major oxides composition (see previous paragraph) and show very low copper con-tent (CuO=0.0071-0962 ppm).
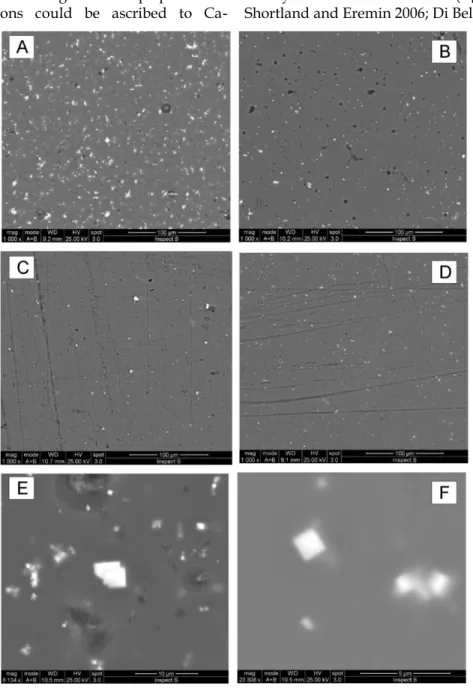
SEM-BSE observations indicate the presence in the glass matrix of minute (3–4 μm) frequently
aggregat-ed euhaggregat-edral Sb, Ca-rich crystals (Fig. 5A, B, C and d and Table 1), demonstrating that the opaque effects of these decorations could be ascribed to
Ca-antimonate (Ca2Sb2O7), a well-known white opacifier widely used in ancient times (e.g. Shortland 2002; Shortland and Eremin 2006; Di Bella et al. 2014).
Fig. 5 - SEM-BSE images of the studied glassy decorations characterized by blue nuances: a) light turquoise glass; b) turquoise c) dark blue glass; d) bluish-green glass; e) Ca-antimonate in turquoise, and f) bluish green glasses.
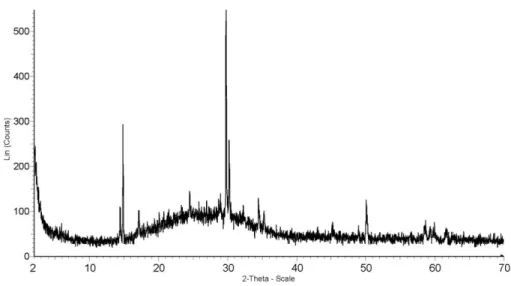
Ca-antimonate crystals are perfectly euhedral (Fig. 5E, F), suggesting that in these decorations the white opacifier was produced in situ by adding Sb-containing raw materials to the glass melt (Di Bella et al. 2014). Detailed XRPD analyses of the glass samples allowed precise identification of the ortho-rhombic Ca-antimonate (PDF number 26-0293). On the XRPD pattern reported in figure 6, the observed peaks are those known in literature for Ca-antimonate phase (Arletti et al., 2006). These peaks overlap with the typical background caused by the amorphous silicate matrix.
A previous study on the blue decorations of the Baroque glass used to decorate altars of several churches of Palermo was carried out by Artioli et al. (2009). The result of the study excluded Co and Cu as colouring agents for their very low or undetected concentrations, and suggested the contribution of iron in divalent form and octahedral coordination as a colouring agent. Our results, however, show that Co, Cu and Fe all contribute to the blue nuances of the glassy decorations from the Messina Museum. These differences could be interpreted as being the result of different recipes or methods locally used in
Sicily by the craftsmen to obtain blue nuances from an original carcara raw material.
Fig. 6 – XRPD pattern of Ca-antimonate.
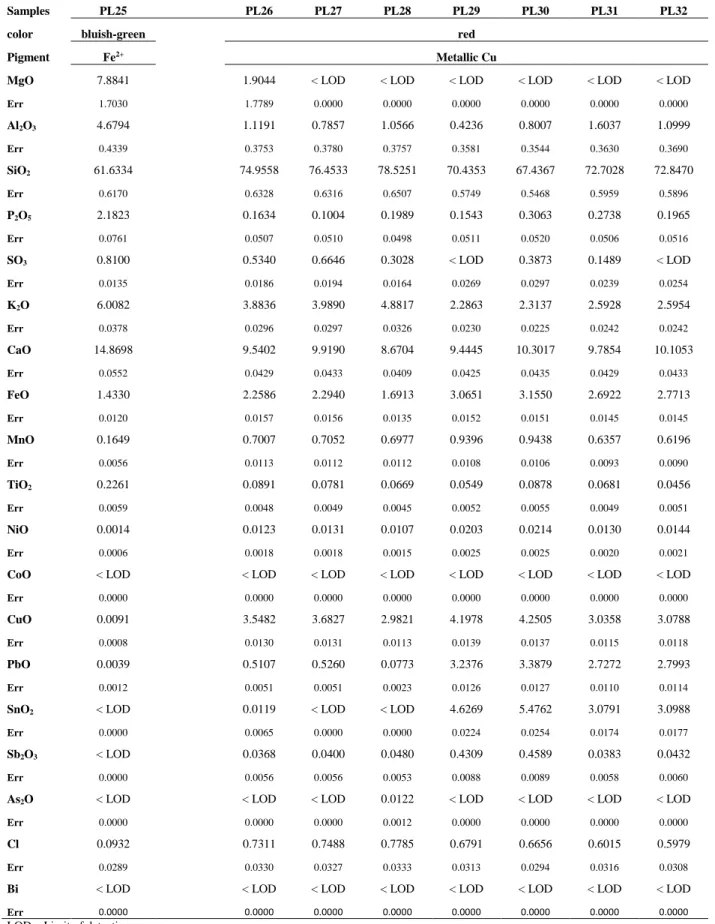
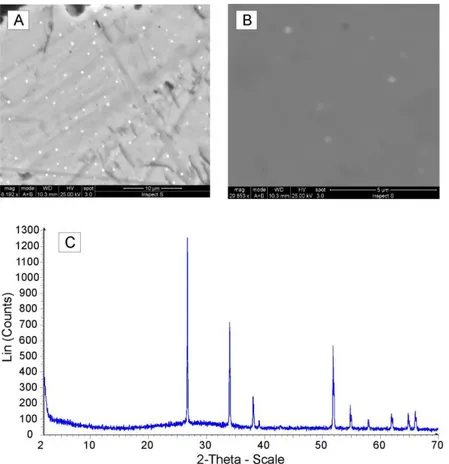
Opaque red decorations – SEM observation of the red glassy decorations F1 and PL26÷32 exhibited textures (Fig. 2A), depending on the different distri-butions of the sub-micrometer clusters of metallic copper widely dispersed in the glass matrix. This feature influenced also the color of the several red nuances. The clusters are almost visible in Fig. 7A-B and, as confirmed by numerous previous investiga-tions (see for example Arletti et al. 2006a-b, and ref-erences herein cited; Sabatino 2007; Di Bella et al. 2014), are the origin of both opacity and the red color. The small size of the Cu clusters made it impossible to accurately avoid the effects of the surrounding glass composition on the chemical analyses reported in Table 1. SEM back-scattered electron images (BSE) revealed cluster dimensions < 200 nm (Fig. 7A, B). Moreover, a detailed observation of the clusters re-vealed the typical rounded morphology of metallic copper clusters. The nature of the clusters was also confirmed by the diffraction patterns, which dis-played the reflections of metallic copper (Fig. 7A, B). In addition to the high copper content, the red tes-serae are also characterized by high concentrations of iron, lead, tin, and phosphorus (Tab. 1).
From a chemical point of view, all the analysed red samples are relatively heterogeneous (Tab. 1).
Specifically, XRF data reveal that the composition of F1 red glass (Tab. 1) is particularly rich in Pb (PbO 52.39 %), with high CuO (7.34 %) and low SnO (0.55 %), whereas the PL red samples, despite their comparable copper content (CuO from about 3.08 to 5.45 %), show variable SnO and PbO contents (Tab. 1). In particular, PL26, PL27 and PL28 (brown-red color with metallic luster, Fig. 1e) are characterized by lower amounts of SnO (≤ 0.0019 %) and PbO (0.007-0.526 %), whereas PL29÷32 group (fire red with slight metallic luster, Fig. 1f) show highest val-ues of SnO (3.07-5.47 %) and PbO (2.72 – 3.38 %). Detailed XRPD analyses of these red samples al-lowed precise identification of the SnO (cassiterite; PDF number 041-1445) phase. The particularly high SnO and PbO content suggests the deliberate addi-tion of Sn- and Pb-containing materials to the melt, with the aim of preventing copper oxidation. Previ-ous studies evidenced the use of cassiterite as an opacifier in decoration works (Panagopoulou et al., 2018).
Therefore, the craftsmen added suitable elements or oxides to the processed carcara glass with the aim of obtaining the desired nuances.
Fig. 7 - SEM-BSE representative images of the studied red glassy decorations. a) main texture; b) Cu nano-clusters in red glass; C) XRPD pattern of SnO.
4. CONCLUSIONS
Chemical XRF data obtained by means of non-destructive analyses of the Baroque glassy decora-tions indicate that the used raw material is composi-tionally homogeneous and belongs to the so-called plant ash to wood ash glass types.
The chromophore species identified in the trans-parent and translucent tesserae — and deduced by comparison with spectroscopic studies in the litera-ture — are 1) Cu2+ cations dispersed in the glass
ma-trix of the light turquoise glass; 2) Fe2+ and Co, with very low Cu, in turquoise and dark blue glasses; 3) high values of Cu in red glass.
SEM and X-ray diffraction investigations of the opaque tesserae allowed the identification of opacifi-er phases, such as 1) metallic CuO, which form clus-ters of different dimensions inside the red tesserae; 2) both the hexagonal CaSb2O6 and the orthorhombic Ca2Sb2O7 calcium antimonate phases in the opaque pale blue, turquoise, and white tesserae.
REFERENCES
Abbate, F. (1997) Storia dell'arte nell'Italia meridionale: il secolo d'oro. Donzelli editore, pp. 1-131. Accascina, M. (1963) A Messina i mischi, trabischi, rabischi, Antichità viva, 2, pp. 9-10.
Arletti, R., Ciarallo, A., Quartieri, S., Sabatino, G. and Vezzalini, G. (2006a) Archaeometric analyses of game counters from Pompeii. In: Maggetti, M., Messiga, B. (eds) Geomaterials in Cultural Heritage, Vol. 257, pp. 175–186. Geological Geological Society of London (UK), London.
Arletti, R., Quartieri, S. and Vezzalini, G. (2006b) Glass mosaic tesserae from Pompeii: an archaeometric al investigation, Periodico di Mineralogia, Vol. 76, pp. 25–38.
Artioli, G., Nicola, C., Montana, G., Angelini, I., Nodari, L. and Russo, U. (2009) The blue enamels in the ba-roque decorations of the churches of Palermo, Sicily: Fe2+-coloured glasses from lime kilns, Archae-ometry, vol. 51, No. 2, pp. 197–213.
Balenzano, F. and Moresi, M. (2004) Scorie vetrose da fornaci per la produzione artigianale Di calce viva (Minervino Murge - Bari), Atti della Società Toscana di Scienze Naturali, serie A, Vol. 109, pp. 57-68.
Di Bella, M., Quartieri, S., Sabatino, G., Santalucia, F. and Triscari, M. (2014) The glass mosaics tesserae of ―Villa del Casale‖ (Piazza Armerina, Italy): a multi-technique archaeometric study, Archaeological and Anthropoogical Sciences, Vol. 6, No, 4, pp. 345-362.
Giuffrè, M. (1992) I marmi mischi delle chiese di Palermo. Palermo: Sellerio.
Hills, H., 1999. Marmi Mischi Siciliani: Invenzione e Identità (Inlaid polychromatic marble decoration in early modern Sicily: Invention and identity), Società Messinese di Storia Patria, Scholarly monograph series, Messina, 1999. 457 pp.
Liritzis, I, Laskaris, N, Vafiadou A, Karapanagiotis I, Volonakis, P, Papageorgopoulou, C, Bratitsi, M (2020) Archaeometry: an overview. SCIENTIFIC CULTURE, Vol. 6, No. 1, pp. 49-98 DOI: 10.5281/zenodo.362522.0
Lilyquist, C. and Brill, R.H. (1995) Studies in ancient Egyptian glass, Metropolitan Museum of Art, New York Mongitore, A., (1742) Della Sicilia ricercata nelle sue cose più memorabili, Palermo.
Montana, G. and Gagliardo Briuccia, V. (1998) I marmi ed i diaspri del Barocco siciliano, S.F. Flaccovio editore, Palermo, 127 pp.
Napoleone, C. (2001) L’impiego dei diaspri e delle agate di Sicilia dal XVI al XVII secolo. In Splendori di Sicilia. Arti Decorative dal Rinascimento al Barocco., pp. 192-203, Ed. Charta.
Panagopoulou, A., Lampakis, D., Christophilos, D., Beltsios, K., Ganetsos, Th. (2018) Technological examina-tion of Iznik ceramics by SEM-EDX, Raman, XRD, PLM: a case study. Scientific Culture, Vol. 4, No. 3, pp. 27-33
Pavone Alajmo, M.P. (2001) Mischi, rabischi e tra mischi: tarsie marmoree policrome del Museo Regionale di Messina. In Splendori di Sicilia. Arti Decorative dal Rinascimento al Barocco, pp. 184-191. Ed. Charta,
Piazza, S. (2007) I colori del Barocco: architettura e decorazione in marmi policromi nella Sicilia del Seicento. Palermo: Flaccovio.
Pouchou, J.L. and Pichoir, L. (1984) Possibilités d’analyse en profondeur à la microsonde électronique. Jour-nal of Microscopic Spectroscopy Electron, Vol. 9, pp. 99–100.
Pouchou, J.L. and Pichoir, L. (1985) Les elements très legers en microanalyse X – Possibilités des modèles récents de quantify cation, Journal of Microscopic Spectroscopy Electron, Vol. 11, pp. 229–250.
Sabatino G (2007) Vetri archeologici di età romana (dal II sec. a.C. al VI sec. d.C.) in Sicilia: attribuzione di provenienza e caratterizzazione delle tecniche costruttive. PhD thesis, Università di Messina Schiavo, D. (1756) Descrizione di alcune produzioni naturali della Sicilia, Venezia.
Shannon, R.F. (2012) Bruker AXS Handled, Inc. United State Patent n. US 8.223.925 B2, July 17, pp. 13. Shortland, A.J. (2002) The use and origin of antimonate colorants in early Egyptian glass, Archaeometry, Vol.
44, pp. 517–31.
Shortland, A.J. and Eremin, K. (2006) The analysis of second millennium glass from Egypt and Mesopota-mia, part 1: new WDS analyses, Archaeometry, Vol. 48, No 4, pp. 581–603.
Sola, V. (2015) Baroque Decoration: the Marble Inlays. Palermo: Regione siciliana, Assessorato dei beni culturali e dell’identità siciliana, Dipartimento dei beni culturali e dell’identità siciliana.