Youth and the Crisis
The recent recession has led to an ongoing crisis in youth labour markets in Europe. This timely book deals with a number of areas related to the context, choices and experiences of young people, the consequences of which resonate throughout their lives. The focus of the contributions to this volume is on issues which, whilst undoubtedly important, have thus far received less attention than they arguably deserve.
The first part of the book is concerned with issues related to education and train-ing, covering matters such as the role of monopsony in traintrain-ing, the consequences of over-education, and the quality of educational institutions from primary to tertiary. The second part is primarily concerned with the long-term consequences of short-term choices and experiences, including contributions on health-related choices, health consequences later in life, factors affecting the home-leaving decision, as well as an analysis of the increasing intergenerational transmission of inequality – a trend which accelerated during the recession. The final part of the book deals with issues related to youth unemployment and young people not in education, employ-ment or training (NEET) – the direct consequences of the recession.
This book contains a number of innovative analyses reporting significant find-ings that contrast with standard models. Some of the more interesting results directly contradict conventional wisdom on a number of topics, from the impor-tance of monopsony in training markets to the imporimpor-tance of transitory income changes on consumption of addictive goods. This book is suitable for those who study labour economics and the political economy, as well as employment and unemployment.
Gianluigi Coppola is Lecturer in Economics at the Department of Economic Science and Statistics, University of Salerno, Italy.
Niall O’Higgins is Senior Research Specialist in the ILO’s Youth Employment Programme and Professor of Economics at the University of Salerno, Italy.
1 Youth and the Crisis
Unemployment, education and health in Europe
Edited by Gianluigi Coppola and Niall O’Higgins
Youth and the Crisis
Unemployment, education and health
in Europe
Edited by Gianluigi Coppola
and Niall O’Higgins
First published 2016 by Routledge
Park Square, Milton Park, Abingdon, Oxon OX14 4RN and by Routledge
711 Third Avenue, New York, NY 10017
Routledge is an imprint of the Taylor & Francis Group, an informa business
© 2016 selection and editorial material, Gianluigi Coppola and Niall O’Higgins; individual chapters, the contributors
The right of the editors to be identified as the authors of the editorial material, and of the authors for their individual chapters, has been asserted in accordance with sections 77 and 78 of the Copyright, Designs and Patents Act 1988.
All rights reserved. No part of this book may be reprinted or reproduced or utilised in any form or by any electronic, mechanical, or other means, now known or hereafter invented, including photocopying and recording, or in any information storage or retrieval system, without permission in writing from the publishers.
Trademark notice: Product or corporate names may be trademarks or
registered trademarks, and are used only for identification and explanation without intent to infringe.
British Library Cataloguing in Publication Data
A catalogue record for this book is available from the British Library
Library of Congress Cataloging in Publication Data
Youth and the crisis : unemployment, education and health in Europe / edited by Gianluigi Coppola and Niall O’Higgins.
pages cm
1. Youth--Employment--Europe. 2. Unemployment--Europe. 3. Labor market--Europe. 4. Manpower policy--Europe. 5. Europe--Economic conditions I. Coppola, Gianluigi, editor. II. O’Higgins, Niall, editor. HD6276.E82Y664 2016
331.3'4094--dc23 2015024834
ISBN: 978-1-138-89777-9 (hbk) ISBN: 978-1-315-70899-7 (ebk) Typeset in Times New Roman by Sunrise Setting Ltd, Paignton, UK
Contents
List of figures vii
List of tables viii
List of contributors xi
Acknowledgements xiii
1 Editors’ introduction 1
NIALL O’HIGGINS AND GIANLUIGI COPPOLA
PART I
Education and training: choices and outcomes 11
2 Monopsony power and work-based training 13
PAUL RYAN
3 Overeducation: a disease of the school-to-work transition system 36 FLORO ERNESTO CAROLEO AND FRANCESCO PASTORE
4 Should I stay or should I go? Dropping out from university:
an empirical analysis of students’ performances 57
ROBERTO ZOTTI
5 University dropout rates in Italy 75
LARA GITTO, LEO FULVIO MINERVINI AND LUISA MONACO
6 The future has early roots: learning outcomes and school
effectiveness in Tuscany’s primary education system 89
PART II
Short-term choices with long-term consequences:
health, leaving home and intergenerational mobility 109
7 Smoking, drinking, never thinking of tomorrow:
income and risky choices amongst young adults in the UK 111
GIANLUIGI COPPOLA, NIALL O’HIGGINS AND CLAUDIO PINTO
8 Obesity and economic performance of young workers in Italy 128 GIOVANNI S. F. BRUNO, FLORO ERNESTO CAROLEO AND ORIETTA DESSY
9 Leaving home and housing prices: the experience of
Italian youth emancipation 146
FRANCESCA MODENA AND CONCETTA RONDINELLI
10 Leaving home and poverty before and after the economic
crisis in southern European Countries 170
FERNANDA MAZZOTTA AND LAVINIA PARISI
11 Youth unemployment and health over 50:
evidence for the European countries 195
ORIETTA DESSY
12 Intergenerational equity and intergenerational mobility
in Italy: an analysis from SHIW 208
FEDERICA ROCCISANO
PART III
Youth labour markets, NEET and the crisis 225
13 Youth re-employment probabilities in a gender
perspective: the case of Italy 227
CHIARA MUSSIDA AND DARIO SCIULLI
14 The regional impact of the crisis on young people in
different EU countries 249
GIOVANNI S. F. BRUNO, ENRICO MARELLI AND MARCELLO SIGNORELLI 15 Young people in transitions: conditions, indicators and policy
implications. To NEET or not to NEET? 272
GUIDO CAVALCA
Index 288 vi Contents
Figures
1.1 Percentage changes in labour market indicators for young people
(15–24) and adults (25–49) in the EU28, 2007–14 2
1.2 Youth unemployment rates and the prevalence of long-term
unemployment amongst young people, 2002–14 3
1.3 Prevalence of temporary employment in the EU, Spain
and Italy, 2000–14 4
3.1 Heckman correction of the wage effect of overeducation/overskilling: (a): job competition. job assignment and human capital model; (b) job
search model 42
4.1 Post-reform persistence indicators, from 2002–3 to 2008–9 58
5.1 Number of university degree courses 79
6.1 Expected maths score for different individual ESCS and school
effectiveness 102 6.2 Ranking of Tuscan primary schools by level-2 residuals from
the maths and reading models of Tables 6.3 and 6.4, column C 102 6.3 Zonal conferences by degree of homogeneity of school effectiveness 104 9.1 Real house and rent prices and per-capita disposable income 151 9.2 Estimated age effect for the probability of leaving home 159
9.3 Simulated hazard by cohorts 163
9.4 Simulated hazard by cohorts for youths 164
9.5 Predicted survival functions for centre and suburbs 165 10.1 Percentage of individuals aged 18–39 living with their parents 171
10.2 Mean age at leaving home 172
10.3 Percentage of people aged 18–24 at risk of poverty and
social exclusion (AROPE) 172
10.4 Risk of entry (exit) into (out of) poverty for a young person who has left home relative to the risk for a young person who stayed at home 182
12.1 Corak’s Great Gatsby curve 209
12.2 Average income by age class 220
12.3 Gini index trend 221
12.4 Great Gatsby curve 222
14.1 Unemployment rate, males and females, by region group 253 14.2 Youth unemployment rate, males and females, by region group 254
Tables
2.1 Fewness of employers and apprentice pay, Switzerland, 2004 19 2.2 Pay of craft apprentices and comparative ratings of its potential
determinants, metalworking industry, Switzerland, Germany
and the UK 21
2.3 Survey estimates of the cost of apprenticeship training to employers in Germany and Switzerland (average net cost in
thousands of euros, current prices, per apprentice per year of training) 23 2.4 Estimates of cost to employers of apprentice training in
Germany, 2007 (average net cost per apprentice per year of training) 24 2.5 Attributes of strike movements by apprentices in
UK metalworking industry, 1910–70 28
3.1 The wage penalty of overeducation and overskilling 46
A.1 Survey of the empirical literature on Italy 51
4.1 Definition of variables and sample means (Standard deviations
in parentheses) 61
4.2 Estimated coefficients from the probit model for
withdrawing students 63
4.3 Estimated coefficients from the probit model for withdrawing
students by gender 66
5.1 Italian universities: descriptive statistics 81
5.2 Estimation results 83
6.1 Descriptive statistics on continuous variables 96 6.2 Descriptive statistics on categorical and dummy variables 97
6.3 Two-level linear model for maths score 99
6.4 Two-level linear model for reading score 100
6.5 Expected scores for different profiles of pupil and school 101 6.6 Best and worst primary schools by zonal conference 103 7.1 Effects of wage changes on smoking, probit model 121 7.2 Effects of wage changes on smoking, probit model, by gender 122 7.3 Effects of wage changes on drinking, probit model 123 7.4 Effects of wage changes on drinking, probit model, by gender 123 7.5 Effects of wage changes on BMI, OLS estimation 124
Tables ix 7.6 Effects of wage changes on self-reported health, ordered
probit model 124
7.7 Effects of wage changes on self-reported health, ordered
probit model, by gender 125
8.1 Descriptive statistics for the ISFOL-PLUS 2006–2008–2010 panel 133 8.2 Aspects of job satisfaction, total sample, probit OLS estimates 135 8.3 Aspects of job satisfaction, male sample, probit OLS estimates 137 8.4 Aspects of job satisfaction, female sample, probit OLS estimates 139
8.5 Gross income (logs), OLS estimates 141
9.1 Descriptive statistics 154
9.2 Estimates for the probability of leaving the parental home 156 9.3 The effect of housing prices and end of education on the
probability of leaving home 158
9.4 The effect of housing prices and occupational status on the
probability of leaving home 161
9.5 The effect of housing prices and household income on the
probability of leaving home 162
10.1 Destination at t + 1, by country (row percentages) 179 10.2 Destination at t + 1, by country and before and after the
economic crisis (number of observations) 179
10.3 Poverty transitions rates, by country (column percentages) 181 10.4 Probability of being poor at t +1, pooled model for SECs
(marginal effect) 184
10.5 Probability of leaving home at t + 1, pooled model for SECs
(marginal effect) 185
10.6 Probability of being poor at t + 1, pooled model for SECs
before and after the economic crisis (marginal effect) 186 10.7 Probability of leaving home at t + 1, pooled model for
SECs before and after the economic crisis 187
10.B1 All individuals in all years considered, distinguishing
between all youths and those who have left home 192 10.B2 Individuals before the economic crisis (2009),
distinguishing between all youths and those who have left home 193 10.B3 Individuals after the economic crisis (2009), distinguishing
between all youths and those who have left home 194 11.1 Distribution of the sample across the European countries 201
11.2 Analysis pooled for the European countries 203
11.3 Cross-country analysis 203
12.1 Descriptive statistics for selected fathers 214
12.2 First-stage regression of fathers’ wage on four variables 214 12.3 First-stage regression of fathers’ disposable income on
four variables 215
12.4 Descriptive statistics for selected sons 215
x Tables
12.6 TS2SLS estimation: elasticity of labour income and
income between fathers and sons 217
12.7 Comparison of β-values 219 13.1 Descriptive statistics by gender and total, 1985–2004 235
13.2 Average hazard rates: gender raw differential 236
13.3 Logit hazard model estimation results 237
13.4 Overall gender gap decomposition 240
13.5 Gender gap decomposition by working area 240
13.6 Gender gap decomposition by age 241
13.7 Gender gap decomposition by occupational qualification 241 13.8 Gender gap decomposition before and after Treu Package 242 14.1 Mean values for regional groups (m) and number of regions (n) 252
14.A1 GMM estimates, male NEET rates 261
14.A2 GMM estimates, female NEET rates 263
14.A3 LSDVC estimates by macro-regions, male NEET rates 264 14.A4 LSDVC estimates by macro-regions, female NEET rates 265 14.A5 LSDVC estimates by macro-regions, with separate impacts
of the crisis years, male NEET rates 266
14.A6 LSDVC estimates by macro-regions, with separate impacts
of the crisis years, female NEET rates 267
14.A7 LSDVC estimates by macro-regions, with separate
impacts of the crisis years, male YUR 268
14.A8 LSDVC estimates by macro-regions, with separate
impacts of the crisis years, female YUR 269
14.A9 LSDVC estimates by macro-regions, with separate
impacts of the crisis years, male total UR 270
14.A10 LSDVC estimates by macro-regions, with separate
impacts of the crisis years, female total UR 271
15.1 Young people (15–24) by employment and
education/training status, 2013 279
15.2 NEETs by age, 2013 280
15.3 NEETs (15–24) by job search and willing to work, 2013 281
5 University dropout rates
in Italy
Lara Gitto, Leo Fulvio Minervini and Luisa Monaco
Introduction
High university dropout rates in Italy have been a widely observed and docu-mented phenomenon for many years. Compared to their OECD counterparts, a large number of Italian students leave university before completing their degree courses, and significant numbers of dropouts occur during the first year of study. Only about one third of students who enrol get a university degree. Moreover, Italian students who graduate tend, on average, to be slower than other OECD students in completing their degree courses (Aina et al. 2011; for recent reports, see, for instance, MIUR 2011; Regini 2009).1
From this perspective, the fact that in Italy a high dropout rate has been observed, especially for first-year students, is considered to be a weakness of the Italian higher education system which policy-makers should take into account.
The issue of university dropout rates has been on the agenda of the Italian gov-ernment. However, even after the 2000–1 reform, which was aimed at improving the situation of the Italian university system in international comparative terms, dropout rates have not changed substantially (Bratti et al. 2008; Cappellari and Lucifora 2009). Furthermore, the Ministry of Education, University and Research (MIUR) closely relates the evaluation of the Italian universities, and their ensu-ing financial incentives, to the dropout phenomenon: in fact, part of the fundensu-ing of Italian universities is distributed according to a series of parameters, which include the number of students who drop out.
A large body of international literature exists on dropout issues; for instance, Mackie (2001), Smith and Naylor (2001), Bennett (2003), Harrison (2006) and the UK National Audit Office (2007) present analyses of dropouts from Anglo-Saxon universities. Nonetheless, research on dropouts from Italian universities is still limited. Most papers take a broad look at the performance of Italian students and suggest reasons for good or bad performance (e.g., Bratti et al. 2008; Checchi 2000), while studies on the specific issue of Italian dropouts are sometimes con-fined to local research carried out occasionally with regard to one or two univer-sities (and selected faculties).
76 Lara Gitto et al.
The aim of this study is to investigate university dropout in Italy, taking a broader perspective. The study considers all Italian universities, excluding only distance learning institutions.2 Moreover, the proposed analysis of university
dropout looks at two key research dimensions: university individual characteris-tics (e.g., number of degree courses and decentralized teaching branches) and stu-dent individual characteristics (e.g., performance in previous stages of education and school background).
The crucial hypothesis that this work intends to test is whether first-year stu-dent dropouts are due to characteristics of the organizational structures of degree courses in individual universities (university dimension), rather than characteris-tics of the student population only (student population dimension). Therefore, this study evolves along two dimensions, whereas existing research on dropout has neglected the former.3 The novelty of the analysis is to assess both university and
student characteristics.
The results may reveal, for instance, that the dropout phenomenon is more closely related to university characteristics than to student characteristics. In this case, a different organization of university courses (with less fragmentation and fewer remote university branches) might have a positive impact on student perfor-mance and reduce dropout. Alternatively, it may be found that students’ character-istics provide a better explanation for the dropout issue. In this case, universities might implement, for instance, better selection procedures to discourage potential entrants who would be likely to abandon their studies, as well as to sustain moti-vated students who are skilled enough to succeed in their courses.
The rest of this paper is organized as follows. We begin with a short literature review of contributions on dropout rates, focusing on recent developments in Ital-ian universities. This is followed by an overview of the ItalItal-ian university system, highlighting some key changes that have occurred in recent years. We then move on to econometric analyses and illustrate the results obtained. The chapter con-cludes by providing policy suggestions.
Literature review
University dropout rates have been exciting researchers’ interest for years. This has produced many analyses of university dropout, which have taken a number of directions. One approach has been to consider high dropout rates as a socially undesirable phenomenon which should be avoided.4 However, some studies have
questioned whether low dropout rates are socially desirable. Montmarquette et al. (2001) provide an overview of studies on this issue; they mention research contri-butions that suggest lowering dropout levels would not necessarily make society better off. Indeed, a few authors state that public policies should not try to influ-ence dropout rates, as trying to reduce the number of university students who do not complete their degree courses might reduce social welfare. For instance, students may rationally choose not to complete their studies in a number of cir-cumstances: firstly, when they see better opportunities in the job market (Di Pietro 2006); and secondly, after revising their prior beliefs about the education process
University dropout rates in Italy 77 (Montmarquette et al. 2001; Belloc et al. 2010). Moreover, it can be argued that the lower the amount of university education costs borne by students, the lower is their private cost of dropout; thus, social costs of dropout are likely to be higher (e.g., lower human capital), especially when dropouts occur in state funded uni-versities (Cappellari and Lucifora 2009).
The relatively high level of dropout rates calculated for Italian university stu-dents, especially in comparisons with students in other OECD countries (see, for instance, OECD 2009, 2010), is brought forward in various contributions (briefly discussed below), which more closely share our concern. Those contributions may be grouped with regard to two different approaches chosen for analysis. The first approach considers dropout rates across the entire Italian university system and, in defining the scope of the analysis, focuses on a relatively small group of vari-ables, usually related to students’ personal characteristics. The second approach considers case studies of particular Italian universities; those studies are quite often motivated by the internal information requirements of a single university.
Studies taking the first approach include Di Pietro and Cutillo (2008), who examine the impact on students’ behaviour of various policy measures, intro-duced in recent years, relating to duration, structure and content of degree courses offered by Italian universities. Those measures have been widely debated, espe-cially after 2001, when Italian degree courses were fundamentally reformed by the introduction of the so-called ‘3+2’ structure, which offers students a univer-sity degree after 3 years of study, with the option to take a two-year postgraduate course afterwards.
The conclusions reached by Di Pietro and Cutillo (2008) highlight the fact that the 2001 reforms have had a positive impact on dropout rates. Similar results are obtained by D’Hombres (2007), who includes the motivational impact of the reform on student behaviour: as a university degree can be obtained after a rela-tively shorter period than in the past, students would be more prone to complete their courses and graduate.
Cingano and Cipollone (2007) combine individual- and aggregate-level data on student educational attainment. They use data from a representative sample of secondary school graduates and local supply of university courses to show that family and educational background are relevant determinants of continuation probability.
A study by Becker (2001) points to a comparison between dropout rates in Germany and Italy in a univariate decisional framework. The author argues that Italian students who abandon university can be separated into two major groups: students who have not chosen the most suitable university degree course (accord-ing to student characteristics); and students who have enrolled in a university course only because they have not received a suitable job offer.5
Published research concerned with dropout rates in individual Italian univer-sities are quite limited. Belloc et al. (2010) studied university dropout in Italy by using data from the Faculty of Economics at the University ‘La Sapienza’ in Rome. Their results show that high dropout probability is related to high second-ary school graduation marks and low performance at university, suggesting that
78 Lara Gitto et al.
the students who drop out are either unsuited to, or dissatisfied with, their chosen course. Moreover, the authors find that student characteristics, such as nationality and income, have a statistically significant impact on dropout rates.
A study by Schizzerotto (2003) analyses dropouts from the University of Milano Bicocca. Results highlight factors which have a bearing on dropout proba-bility more than others; the author finds that crucial factors are the age of students at the time of enrolment, type of secondary school diploma and graduation marks (see also Boero et al. 2005, whose study relates to the University of Cagliari and the Tuscia University), as well as distance between the university and the stu-dent’s home. The study also shows that dropout probabilities are different across different faculties (as in Ugolini 2000); moreover, dropout probabilities show a decrease after academic year 2001–2.6
Finally, Bratti et al. (2010) look at the case of the Faculty of Economics of the University Politecnica of Marche. Their results show that students’ perfor-mances improved after 2001; however, they point out that the 2001 reform has also brought about a reduction in the effort required from students to complete their degree courses, with an indirect effect on the quality.
The Italian university system
The Italian university system has gone through a number of legislative and regu-latory changes in recent years, especially following the ‘Bologna process’, which aimed at the development of an integrated and coherent European higher edu-cation sector (Cappellari and Lucifora 2009). Therefore, the Italian system was partially reshaped. The existing system consists of a greater number of public and private universities than in the past, as well as new distance learning universities. Moreover, for many years, legislation paved the way to a proliferation of decen-tralized structures (i.e., university branches) mostly devoted to teaching activities rather than research.
The most relevant change was the creation of new types of degrees courses, rearranged in a two-tier system with a three-year degree (undergraduate level) and an additional two-year degree (master’s level). Among the motivations behind this change in the traditional system, which was based on a single four- or five-year degree, were the encouragement of university enrolment and the reduction of dropout rates and of time required to get a university degree. Under the reformed system, students can get their first-level university degree in fewer years and decide whether to keep on studying for another 2 years at a later stage. Neverthe-less, research on the impact of such reform suggests that it has had a significantly positive impact only on the probability of enrolment, but not on the probability of obtaining a university degree (Bratti et al. 2008; MIUR 2011).
The rest of this section provides a sketch of recent developments in the Italian university system.7
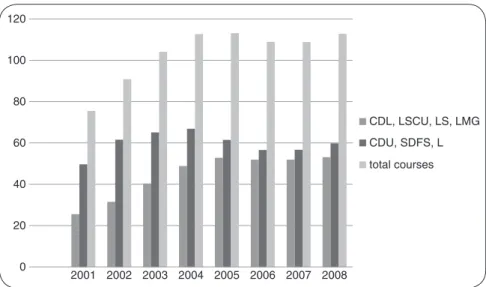
Courses can be grouped into standard degree courses, which have a duration closer to traditional university degrees – usually 5 years – and ‘short’ three-year-degree courses; however, students are allowed to successfully complete their
University dropout rates in Italy 79 courses earlier, provided that they get the necessary amount of university learning credits (CFU) established for their degree.
The first group of degree courses includes corsi di laurea quadriennale (CDL, a four-year degree course), scuole di specializzazione (LSCU, courses that pre-pare for specific professions), corsi di laurea specialistica (LS, usually a two-year degree course requiring a three-two-year degree) and corsi di laurea magistrale (LMG, a five-year degree course).
The second group includes corsi di diploma universitario (CDU, which end up in a university diploma) and scuole dirette a fini speciali (SDFS, which are similar to LSCU, but at a lower educational level).
In the years immediately after the 2001–2 university reform, the number of ‘short’ degree courses increased significantly. However, it then stabilized, and has been paralleled by a slow but steady increase in the number of standard degree courses. Quantitative data on degree courses offered by Italian universities is shown in Figure 5.1.8
The number of degree courses taught in decentralized university remote cam-puses has grown disproportionately compared to the number of decentralized remote campuses itself. Over the same period, numbers of permanent teaching staff increased substantially; the number of assistant professors increased after 2002, whereas the numbers of full and associate professors have slightly declined since 2004–5.
In recent years, universities have also implemented Law no. 240/2010, the so-called ‘Gelmini reform’, which introduced major changes in university gover-nance. In particular, university departments are currently in charge of research as well as teaching activities.
2001 0 20 40 60 80 100 120 2002 2003 2004 2005 2006 2007 2008 CDL, LSCU, LS, LMG CDU, SDFS, L total courses
Figure 5.1 Number of university degree courses
80 Lara Gitto et al.
Finally, we note that, in the time span covered by our research, teaching activ-ities were governed by faculties, so that the data we employed refers to faculties. Methodology and results
This analysis is focused on university student dropout rates. When it is not deter-mined by students’ personal motivations, this phenomenon might signal a gen-eral dissatisfaction with courses and tuition offered by universities (Becker 2001; Belloc et al. 2010), so that action might be required to improve them.
Universities constitute the observed units. The estimation strategy initially selected was a fixed effects (FE) model, in order to isolate the characteristics of each university. An error term is included in the regression equation and is assumed to be constant over time (Hsiao 1986; Arellano 2003; Allison 2009). The model specification is
Yij =(α δ+ i)+Xijβ ε+ it.
The deterministic part of the equation is compounded by the constant term and an element δ varying for each unit i. di can be interpreted as ‘university effect’ (i.e., the unobserved individual factors), and eit is the residual term. The estimator was obtained by applying ordinary least squares to a transformed model, which takes into account mean deviation.9
The regression coefficients and the university effect can be interpreted as policy-relevant effects with further assumptions: εij ∼ i.i.d. N( ,0 e)
2
σ , meaning that the error terms are independently and identically normally distributed with mean 0 and variance s2; and exogeneity of the covariates x
ij, e.g. cov
(
e xij, kij)
= 0 for k= 1, , p.In the FE model, no assumptions are made about the error term, so that the uni-versity effects are treated as nuisance.10 The FE model does not consider
variabil-ity across individuals (‘within’ transformations) and between individuals, because individual time-invariant components yi and xi are removed by each observation. Instead, the generalized least squares (GLS) estimator in a model with random effects uses information on both within and between variability. We can assume the presence of heteroscedasticity as well as autocorrelation in the panel data. In this case the GLS estimator
βGLS
=
(
X′Ω−1X)
−1X′Ω−1Ycan be employed.
The dataset used in the analysis was built with MIUR11 and ISTAT12 data,
relating to 76 Italian universities and with the exclusion of distance learning uni-versities. The observation period, for each university, is the time span between the implementation of the 2001 reform (which introduced the ‘3+2’ degree courses) and the academic year 2007–8. The panel is unbalanced: while for most
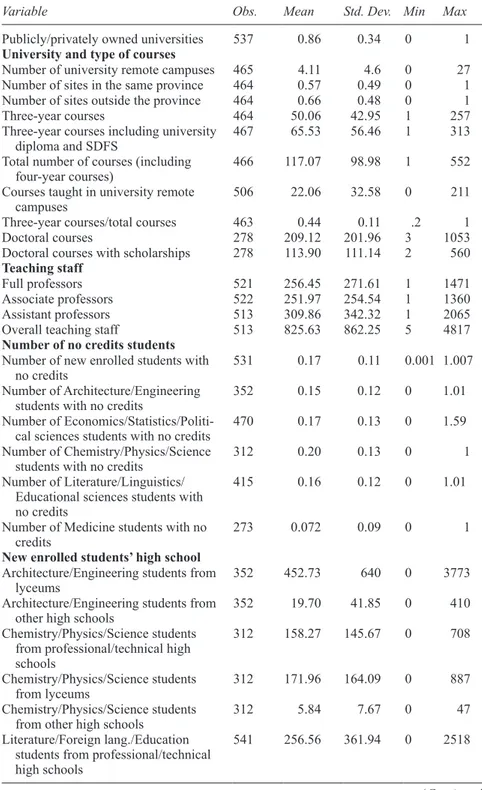
Table 5.1 Italian universities: descriptive statistics
Variable Obs. Mean Std. Dev. Min Max
Publicly/privately owned universities 537 0.86 0.34 0 1
University and type of courses
Number of university remote campuses 465 4.11 4.6 0 27
Number of sites in the same province 464 0.57 0.49 0 1
Number of sites outside the province 464 0.66 0.48 0 1
Three-year courses 464 50.06 42.95 1 257
Three-year courses including university
diploma and SDFS 467 65.53 56.46 1 313
Total number of courses (including
four-year courses) 466 117.07 98.98 1 552
Courses taught in university remote
campuses 506 22.06 32.58 0 211
Three-year courses/total courses 463 0.44 0.11 .2 1
Doctoral courses 278 209.12 201.96 3 1053
Doctoral courses with scholarships 278 113.90 111.14 2 560
Teaching staff
Full professors 521 256.45 271.61 1 1471
Associate professors 522 251.97 254.54 1 1360
Assistant professors 513 309.86 342.32 1 2065
Overall teaching staff 513 825.63 862.25 5 4817
Number of no credits students
Number of new enrolled students with
no credits 531 0.17 0.11 0.001 1.007
Number of Architecture/Engineering
students with no credits 352 0.15 0.12 0 1.01
Number of
Economics/Statistics/Politi-cal sciences students with no credits 470 0.17 0.13 0 1.59
Number of Chemistry/Physics/Science
students with no credits 312 0.20 0.13 0 1
Number of Literature/Linguistics/ Educational sciences students with no credits
415 0.16 0.12 0 1.01
Number of Medicine students with no
credits 273 0.072 0.09 0 1
New enrolled students’ high school
Architecture/Engineering students from
lyceums 352 452.73 640 0 3773
Architecture/Engineering students from
other high schools 352 19.70 41.85 0 410
Chemistry/Physics/Science students from professional/technical high schools
312 158.27 145.67 0 708
Chemistry/Physics/Science students
from lyceums 312 171.96 164.09 0 887
Chemistry/Physics/Science students
from other high schools 312 5.84 7.67 0 47
Literature/Foreign lang./Education students from professional/technical high schools
541 256.56 361.94 0 2518
82 Lara Gitto et al.
Table 5.1 (Continued )
Variable Obs. Mean Std. Dev. Min Max
Literature/Foreign lang./Education
students from lyceums 541 416.81 577.5 0 2935
Literature/Foreign lang./Education
students from other high schools 541 16.5 27.43 0 147
Economics/Statistics/Political sciences students from professional/technical high schools
540 509.47 546.96 0 3793
Economics/Statistics/Political sciences
students from lyceums 540 466.19 526.9 0 3254
Economics/Statistics/Political sciences
students from other high schools 540 27.71 44.48 0 270
Medicine students from professional/
technical high schools 273 286.22 294.02 2 2492
Medicine students from lyceums 273 245.79 200.36 5 1232
Medicine students from other high
schools 273 15.51 18.23 0 137
New enrolled students’ diploma grade
Architecture/Engineering students with
diploma grade 90–100 366 299.51 394.87 0 2328
Economics/Statistics/Political sciences
students with diploma grade 90–100 482 283.15 269.44 0 1543
Chemistry/Physics/Science students
with diploma grade 90–100 335 89.62 83.30 0 335
Literature/Foreign lang./Education
stu-dents with diploma grade 90–100 428 229.24 245.65 0 1219
Medicine students with diploma grade
90–100 males 273 16.9 18.84 0 137
Medicine students with diploma grade
90–100 females 273 71.14 48.04 0 245
universities there are seven observations, for some universities (e.g., Bolzano, Cagliari, Catanzaro), which have implemented the reform since academic year 2001–2, there are eight. Descriptive statistics are presented in Table 5.1.
The dependent variable in the estimations is the number of newly enrolled stu-dents who did not obtain credits out of the total number of stustu-dents enrolled at the first year.13 Regressors relate to university characteristics such as number of
university remote campuses, university remote campus location (inside or outside the province where the core teaching site is located), type of courses offered over the total courses (three-years degrees versus university diplomas), and student background (high school attended and final grade). Results of FE and GLS mod-els, the latter with either heteroscedasticity or panel-specific autocorrelation, are reported in Table 5.2.
The FE model does not show significant coefficients, except for the number of remote campuses and their location within the same province where the main university site is located. The signs of the estimated coefficients are confirmed by the GLS regressions.
University dropout rates in Italy 83
Table 5.2 Estimation results Dependent variable: quota newly enrolled students with no credits
Fixed effects GLS with
heteroscedasticity GLS with panel- specific
autocorrelation Three-year degree courses/total number of courses 0.212 (0.352) (0.125)0.165 (0.078)0.270*** Average course at university remote campuses -0.014 (0.011) -0.005***(0.001) -0.008***(0.002) Number of university remote campuses (0.015)0.052*** (0.002)0.0002 (0.001)0.0001 Remote campuses in
the same province -0.154**(0.065) -0.054***(0.016) -0.071***(0.014) Number of students grade 90-100 -0.572(0.721) -0.298*(0.182) -0.217*(0.131) Number of students from lyceums (0.348)0.227 (0.125)0.486*** (0.087)0.544*** Number of students from profess./ technical schools 0.184 (0.290) -0.043(0.102) -0.110*(0.065) Lecturers/students 0.378 (0.397) -0.555***(0.079) -0.560***(0.068) PhD with scholarship/ total number PhD -0.455(0.305 -0.074(0.074) -0.164***(0.054) Constant 0.247 (0.341) (0.119)0.257** (0.059)0.275*** F-test = 2.12 Prob > F = 0.041 σ2 u = 0.2103; σ2 e = 0.086; ρ = 0.8491 F-test all ui = 0: 2.84 Prob > F = 0.0008 Wald χ2 = 61.45 Prob > χ2 = 0.000 Wald χ 2 = 142.67 Prob > χ2 = 0.000
*** significant at 1%; ** significant at 5%; *significant at 10%
The number of three-year degree courses out of the total number of courses offered by the university (university diplomas, special schools, etc.) is positively correlated with the share of students who did not get any credit; in other words, the higher the number of three-year degree courses, the higher the number of new enrolled students who do not obtain credits. This conclusion might be interpreted as an excessive fragmentation of courses and should be verified by examining the share of students who decide to move to a similar course after the first year.
The results relating to remote campuses are interesting and allow us to draw some policy implications. We considered among the regressors the average num-ber of courses taught at remote campuses, their numnum-ber for each observed unit and their location within the same province. Results suggest that the higher the number of remote campuses (i.e., a highly fragmented supply), the higher the
84 Lara Gitto et al.
share of dropouts.14 But when remote campuses are located within the same
province and offer many courses, the percentage of students who do not get cred-its is likely to be lower.
One of the objectives of the reform was to increase supply by allowing univer-sities to establish decentralized remote campuses, so as to introduce enrolment incentives for students who do not live close to main university sites. However, what was observed was a relocation of students, while the number of students per university did not change significantly.15
The effect due to the location of university remote campuses within the same province implies how the establishment of peripheral sites, close to the main branch, allows for a better control and organization of courses, whereas such monitoring might not be possible when the peripheral site is located outside the province or even in another region.
Other supply variables relate to teaching staff (number of lecturers/number of new enrolled students) and postgraduate programmes (PhD courses with scholarships). Both are significant and inversely correlated with dropouts. A higher lecturer–student ratio is, therefore, seen as a quality indicator. The pros-pect of starting a PhD course could be seen as an incentive for students to pro-ceed with their courses without dropping out, although this evidence should be confirmed by the percentage of graduated students who apply for a PhD after graduation.
Information about students’ background should verify the positive correlation between a good performance at school and university results. Moreover, while a grammar school (e.g., a lyceum) is usually expected to provide a strong back-ground for further academic studies, a professional/technical school should have work and practical skill orientations. A positive correlation between university dropouts and number of students coming from professional/technical schools should confirm this hypothesis.
Similarly, the diploma grade should corroborate the intuitive proposition that students who did well at high school are likely to succeed at university. While this second hypothesis is confirmed by results, so that students who obtained diploma grades between 90 and 100 (the highest) achieved credits during their first year at university, the share of students who attended a lyceum is positively correlated with inactivity at university. This result might signal a general worsening of the education level reached by students when they enrol at the university. Although this evidence is in an opposite direction from that in the main literature (see, for example, Di Pietro and Cutillo 2008; Aina et al. 2011; Cingano and Cipollone 2007; Boero et al. 2005), a possible explanation might be that more and better educated students prefer to change faculty when they are not satisfied with the organization of the degree course or with their marks (Belloc et al. 2010).
Looking at the magnitude of estimated coefficients, it seems that variables related to demand (students’ background) impact more on dropout of newly enrolled students’ than those variables related to educational supply. However, when analysing the phenomenon of dropout, variables related to supply need to be taken into account as well.
University dropout rates in Italy 85
Concluding remarks
The aim of this research was to study whether factors related to supply of univer-sity education (the ‘univeruniver-sity dimension’) might have an impact in determining dropout, thus broadening the analysis of university dropout rates beyond the more traditional research focusing on demand-related factors (the ‘student dimension’). In a nutshell, our study suggests that demand-side factors (i.e., students’ charac-teristics such as their background) are relevant in explaining dropout at a general level. University-related factors do have a significant impact on the probability of dropout too, especially when considering the organization and activities of remote campuses.
A FE model has been applied to take into account characteristics of each university observed. Dropout rates seem to be influenced mainly by students’ background (in line with the main findings in the existing literature); however, some supply factors, such as a high number of remote campuses and geographi-cal fragmentation, also have an influence. Therefore, a less dispersed university organization, focused around a core unit, might offer a more attractive academic environment for students and help to reduce dropout rates.
Our results also suggest that the higher the number of three-year degree courses, the higher the number of new enrolled students who do not obtain credits. This is an interesting result, as one motivation behind the ‘Bologna process’ and the introduction of the three-year degree was to reduce the number of dropouts (as well as of freshmen who do not pass exams). This evidence might be interpreted as a failure of the ‘3+2’ system (Di Pietro and Cutillo 2008; Cappellari and Lucifora 2009, Bratti et al. 2010) and calls into question other important issues about the consequences of universities’ greater autonomy: it seems that the deci-sion to expand the supply in terms of more courses may have a significantly pos-itive impact only on the probability of university enrolment but not on that of obtaining a university degree.
Information about students’ university fee payments (and possibly other major expenses) as well as opportunity costs might help to explain dropout. Indeed, stu-dents could opt to enter the labour market (Di Pietro 2006). With regard to the student dimension, it is likely that the presence of a nearby university remote cam-pus may encourage some students to enrol, even though they would not enrol if universities were located far from their hometown. Those students might be less motivated and less able to gain university course credits. From this perspective, our study suggests additional factors that might have contributed to the reduction of students’ private costs of university education in Italy – and had a bearing on stu-dents’ enrolment decisions – but with poor impact on dropout (Bratti et al. 2008). In line with the literature, we find that students who obtained diploma grades between 90 and 100 achieved credits during their first year at university. However, the share of students who attended lyceums is positively correlated with inactivity at university. This result is associated with Belloc et al. (2010), whose work also finds evidence that students who attended a lyceum (as well as students with a higher secondary school grade) have a higher probability of dropping out.
86 Lara Gitto et al.
Yet it goes in an opposite direction to the main literature (Di Pietro and Cutillo 2008; Aina et al. 2011; Cingano and Cipollone 2007; Boero et al. 2005) and may deserve further investigation in the future.
Teaching staff (the ratio of lecturers to newly enrolled students) exert a nega-tive impact on dropouts. Further analysis should consider indicators of teaching quality that might be identified in advance – for instance, looking at the criteria adopted by ANVUR and CIVR (two national agencies involved in the evaluation of universities and academic research). The role of temporary teaching staff, who usually work on a short-term contract basis, may be worth of further analysis.
Finally, future work could take into account also university financial resources as well as other macroeconomic variables such as employment prospects (see Aina et al. 2011).
Acknowledgements
We would like to thank participants and discussants at the seminar held at the Università di Catania, Department of Economics (March 2011), at the XXIII SIEP conference (September 2011), and at the ‘Youth and their Future: Work, Educa-tion and Health’ workshop (October 2013). We owe special thanks to Pier Luigi Belvisi, Eleonora Cutrini, Calogero Guccio, Mark Hagger, Aline Pennisi and an anonymous referee. Usual disclaimers apply.
Notes
1 A related issue is the high number of students who do not sit or pass exams in the first year. 2 These are different in nature and structure from the traditional ones; in addition, they
have only a relatively short history (therefore, little data is available).
3 Aina et al. (2011) study time to degree for Italian university students. Although this is a different issue, their research approach is similar: they assess the impact of univer-sity inputs (i.e., univeruniver-sity characteristics), labour market characteristics, and students’ individual and family characteristics.
4 This is the approach that can be seen in the background of our introductory discussion. 5 In Germany, where the dropout rates are lower, only students of the first group could be
found; moreover, the group is less numerous than in Italy (see Di Pietro 2006; Belloc et al. 2010).
6 Perotti (2008) criticizes the observation of lower dropout probabilities after 2001 and focuses on the phenomenon of ‘quick graduates’, that is, students who have switched to shorter degree courses after the 2001 reform. This artificially increases the number of students completing degree courses after 2001.
7 Readers familiar with the Italian framework may prefer to move on to the following section.
8 Data used in the present analysis is published by MIUR, available at http://www.miur.it. 9 As observed by Clarke et al. (2010), in performing hierarchical analyses, the fixed
effects model is particularly well suited if the main interest is in a policy relevant infer-ence analysis that considers individual characteristics, but with unclear data selection process. On the other hand, when information about the selection process is available (in this case, for example, the proportion of students with higher final marks at comple-tion of higher school educacomple-tion and enrolling in certain universities/faculties, etc.), the random effects model should be selected.
University dropout rates in Italy 87
10 Moreover, the estimates with the FE approach are not precisely weighted and can be very unreliable where nj is small or the within-universities variance is large relative
to between-universities variance. By making a comparison between fixed and random effects approaches, Wooldridge (2002) outlines how the two estimators are not equal, but in these cases can be very close.
11 http://statistica.miur.it/ustat/Statistiche/IU_home.asp. 12 http://www.istat.it/ambiente/contesto/infoterr/azioneB.html.
13 The National University System Evaluation Council (Comitato Nazionale per la Valu-tazione del Sistema Universitario, CNVSU) considers the phenomenon of dropout when referring to those first-year students who do not enrol in the second year. How-ever, the number of students who did not obtain any credits is a good proxy for the students who drop out, if we assume that freshmen who do not sit or pass any exam during their first year will probably not enrol again in the second year.
14 The number of university remote campuses differs widely from one university to another (for instance, Università di Aosta, a small university, has no remote campuses; whereas Università Cattolica del Sacro Cuore has 27 remote campuses).
15 For instance, Università Cattolica del Sacro Cuore, in Milan, had 13 remote campuses and 7,262 newly enrolled students in the academic year 2001–2 (one year before the reform); in the academic year 2007–8, the number of remote campuses doubled, but the number of new enrolled students (8,385) increased less than proportionately.
References
Aina, C., Baici, E. and Casalone, G. (2011) Time to degree: Students’ abilities, university characteristics or something else? Evidence from Italy. Education Economics, 19(3), 311–25.
Allison, P.D. (2009) Fixed Effects Regression Models. London: Sage.
Arellano, M. (2003) Panel Data Econometrics. Oxford: Oxford University Press.
Becker, S.O. (2001) Why Don’t Italians Finish University? Explaining Enrollment Behaviour in Italy and Germany. European University Institute, Department of Eco-nomics. http://ftp.zew.de/pub/zew-docs/div/becker.pdf.
Belloc, F., Maruotti, A. and Petrella, L. (2010) University drop-out: An Italian experience. Higher Education, 60(2), 127–38.
Bennett, R. (2003) Determinants of undergraduate student drop-out rates in a university business studies department. Journal of Further and Higher Education, 27(2), 123–41. Boero, G., Laureti, T. and Naylor, R. (2005) An Econometric Analysis of Student With-drawal and Progression in Post-Reform Italian Universities. Università di Cagliari. http://veprints.unica.it/248/.
Bratti, M., Broccolini, C. and Staffolani, S. (2010) Higher education reform, student time allocation and academic performance in Italy: Evidence from a faculty of economics. Rivista Italiana degli Economisti, 2(August), 275–304.
Bratti, M., Checchi, D. and de Blasio, G. (2008) Does the expansion of higher education increase the equality of educational opportunities? Evidence from Italy. Labour, 22(s1), 53–88.
Cappellari, L. and Lucifora, C. (2009) The ‘Bologna process’ and college enrollment deci-sions. Labour Economics, 16(6), 638–47.
Checchi, D. (2000) University education in Italy. International Journal of Manpower, 21(3–4), 177–205.
Cingano, F. and Cipollone, P. (2007) University drop-out: The case of Italy. Temi di discus-sione No. 626. Rome: Bank of Italy.
88 Lara Gitto et al.
Clarke, P., Crawford, C., Steele, F. and Vignoles, A. (2010) The Choice between Fixed and Random Effects Models: Some Considerations for Educational Research. University of Bristol. www.bris.ac.uk/cmpo/publications/papers/2010/wp240.pdf.
D’Hombres, B. (2007) The Impact of University Reforms on Dropout Rates and Students’ Status: Evidence from Italy. European Commission, Joint Research Centre. Luxem-bourg: Office for Official Publications of the European Communities.
Di Pietro, G. (2006) Regional labour market conditions and university dropout rates: Evi-dence from Italy. Regional Studies, 40(6), 617–30.
Di Pietro, G. and Cutillo, A. (2008) Degree flexibility and university drop-out: The Italian experience. Economics of Education Review, 27(5), 546–55.
Harrison, N. (2006) The impact of negative experiences, dissatisfaction and attachment on first year undergraduate withdrawal. Journal of Further and Higher Education, 30(4), 377–91.
Hsiao, C. (1986) Analysis of Panel Data. Cambridge: Cambridge University Press. Mackie, S.E. (2001) Jumping the hurdles: Undergraduate student withdrawal behaviour.
Innovations in Education and Teaching International 38(3), 265–76.
Ministero dell’Istruzione, dell’Università e della Ricerca (2011) Undicesimo rapporto sullo stato del sistema universitario. Rome: MIUR.
Montmarquette, C., Mahseredjian, S. and Houle, R. (2001) The determinants of university dropouts: A bivariate probability model with sample selection.Economics of Education Review, 20, 475–84.
National Audit Office (2007) Staying the Course: The Retention of Students in Higher Education. London: The Stationary Office.
Organization for Economic Co-Operation and Development (2009) Education at a Glance 2009. Paris: OECD.
Organization for Economic Co-Operation and Development (2010) Education at a Glance 2010. Paris: OECD.
Perotti, R. (2008) L’università truccata. Gli scandali del malcostume accademico. Le ricette per rilanciare l’università. Turin: Einaudi.
Regini, M. (ed.) (2009) Malata e denigrata. L’università italiana a confronto con l’Europa. Rome: Donzelli.
Schizzerotto, A. (2003) L’esperienza dell’abbandono degli studi nell’Ateneo di Milano Bicocca: un’analisi preliminare sui dati d’archivio. www.unimib.it/upload/03%20 Abbandoni_2003.pdf.
Smith, J.P. and Naylor, R.A. (2001) Dropping out of university: A statistical analysis of the probability of withdrawal for UK students. Journal of the Royal Statistical Society, Series A, 164(2), 389–405.
Ugolini, M. (2000) University dropout: A problem and an opportunity. Sinergie Rapporti di Ricerca No. 9, 417–36.
Wooldridge, J. (2002) Econometric Analysis of Cross Sectional and Panel Data. Cambridge, MA: MIT Press.