Triglyceride/HDL ratio and its impact on the risk of diabetes mellitus
development during ART
Nicola Squillace
1*, Patrizia Lorenzini
2, Giuseppe Lapadula
1, Alessandra Bandera
1, Alessandro Cozzi-Lepri
3,
Stefano Rusconi
4, Massimo Puoti
5, Antonella Castagna
6, Andrea Antinori
2, Andrea Gori
1and Antonella d’Arminio Monforte
7on behalf of the Icona Foundation Study Group†
1Division of Infectious Diseases, Department of Internal Medicine, ‘San Gerardo’ Hospital, University Milano-Bicocca, Monza, Italy; 2
‘Lazzaro Spallanzani’ National Institute for Infectious Diseases-IRCCS, Rome, Italy;3Royal Free Centre for HIV Medicine & Department of Primary Care and Population Sciences, Royal Free and University College Medical School, Royal Free Campus, London, UK;4Infectious Diseases, Department of Biomedical and Clinical Science Luigi Sacco, University of Milan, Milan, Italy;5Infectious Disease Unit, Niguarda Ca`
Granda Hospital, Milan, Italy;6Department of Infectious Diseases, San Raffaele Scientific Institute, University Vita-Salute San Raffaele, Milan, Italy;7San Paolo University Hospital, Milan, Italy
*Corresponding author. Tel:+39-039-233-9588; Fax: +39-039-233-9327; E-mail: [email protected] †Members of the Icona Foundation Study Group are listed in the Acknowledgements section.
Received 14 December 2015; returned 5 February 2016; revised 8 March 2016; accepted 22 April 2016 Objectives: Our primary aim was to study diabetes mellitus (DM) arising during combination ART (cART) and to attempt to identify associations between these cases and triglycerides (TRG) and the TRG to HDL-cholesterol (TRG/HDL) ratio. Our secondary aim was to analyse the association between DM development and hepatic fibrosis. Methods: This was a retrospective cohort study. Patients from the Icona Foundation study initiating first-line cART between 1997 and 2013 were selected and observed until new-onset DM or most recent clinical follow-up. The pre-dictive value of TRG and TRG/HDL ratio levels on DM was evaluated using multivariable Poisson regression models. Results: Three-thousand, five-hundred and forty-six patients (males, 73.7%; median age, 38 years; median BMI, 23.1 kg/m2; and hepatitis C virus antibody positive, 22.1%) were included. Of these, 80 developed DM over 13 911 person-years of follow-up (PYFU), corresponding to 5.7 cases per 1000 PYFU (95% CI¼ 4.6– 7.1). At multivariable analysis, latest TRG/HDL ratio, when high, was associated with significant increases in DM risk [relative risk (RR) ¼ 1.63; 95% CI ¼ 1.32 – 2.01 per 10 points higher], while current TRG, in contrast, was associated with new-onset DM only at crude analysis. Advanced liver fibrosis (defined as fibrosis-4 index .3.25) was also shown to be an independent risk factor for DM (RR¼ 2.91; 95% CI ¼ 1.10–7.72).
Conclusions: High TRG/HDL ratio predicted risk of new-onset DM, independently of other traditional risk factors. Furthermore, our findings suggest that advanced hepatic fibrosis, estimated using the fibrosis-4 score, could pro-vide an additional predictor for DM.
Introduction
Combination ART (cART) has dramatically reduced morbidity and mortality in HIV-infected patients, prolonging their life expect-ancy.1At the same time, ageing and related comorbidities re-present serious challenges in this population. The incidence of comorbidities associated with ageing appears to be much higher and to occur earlier in HIV-infected individuals with respect to their HIV-uninfected counterparts.2
Increased risk of diabetes mellitus (DM) in HIV-infected subjects is a matter of debate. Whilst an association between HIV infection and heightened risk of diabetes has been demonstrated in some stud-ies,3–5other researchers have failed to support such findings.6–8
Dyslipidaemia is a common feature among HIV-infected patients, particularly during cART. According to the American Diabetes
Association, all overweight patients whose HDL-cholesterol (HDL-c) values are ,35 mg/dL (0.9 mmol/L) and whose triglycer-ide (TRG) values are .250 mg/dL (2.8 mmol/L) should undergo testing for diabetes.9Moreover, the ratio between TRG and HDL-c levels (TRG/HDL) has been cited as a marker of insulin resistance, which is the most important risk factor for developing DM.10–12
Although high TRG and low HDL-c are frequently found in HIV-infected patients on cART,13they are not always associated with obesity. This is because HIV-infected patients often have lower BMIs compared with the general population.14In addition,
the relationship between HDL-c and TRG plasma levels has been postulated to be different in patients with HIV-related, with respect to non-HIV-related, dyslipidaemia.15Finally, cART intro-duction heavily alters the lipid profile within the HIV-infected population.16
#The Author 2016. Published by Oxford University Press on behalf of the British Society for Antimicrobial Chemotherapy. All rights reserved. For Permissions, please e-mail: [email protected]
Hence, the predictive roles of TRG, HDL-c and TRG/HDL in the development of DM are not well established in HIV-infected patients, since it is unclear whether abnormalities in these levels are asso-ciated with DM or are merely side effects of cART that have little impact on DM onset. This question merits further evaluation.
Our primary aim was to verify the association between TRG and TRG/HDL ratio and diabetes onset. Our secondary objective was to evaluate associations between DM and liver fibrosis during cART, given the known association between insulin resistance and non-alcoholic fatty liver disease (NAFLD).17,18
Methods
The Icona Foundation Study is a cohort of HIV-infected patients, which superseded the original Italian Cohort of Antiretroviral-Naive Patients study (detailed description of this cohort elsewhere),19 recruiting
HIV-positive naive patients. CD4+ cell counts and viral load are measured at least every 6 months, as are other laboratory parameters as well as clinical and therapeutical data.
Ethics
All patients signed consent forms to participate in the Icona Foundation Study, in accordance with the ethics standards of the committee on human experimentation and the Helsinki Declaration (1983 revision).
Inclusion/exclusion criteria
Patients enrolled in the Icona Foundation cohort were included in the pre-sent analysis if: (i) they had begun cART while naive to antiretrovirals, from 1 January 1997 or later; (ii) they had at least one TRG and HDL-c fasting value before baseline, which was defined as cART initiation; (iii) they had a baseline fasting blood glucose≤126 mg/dL (7 mmol/L); (iv) they were never exposed to antidiabetic or lipid-lowering drugs before baseline; and (v) they had no diagnosis of DM prior to cART initiation.
Definitions
DM was defined as two consecutive blood glucose values of .126 mg/dL (7 mmol/L), clinical diagnosis of DM or start of antidiabetes treatment. Incidence rate of DM was calculated as the number of observed cases of DM subsequent to cART initiation divided by person-years of follow-up (PYFU). The follow-up (FU) period began at commencement of cART and lasted until onset of DM, death or lost to FU, whichever occurred first.
Liver fibrosis was evaluated using the fibrosis-4 (FIB-4) score, calcu-lated as: (age×AST)/[platelets×square root (ALT)], and divided into three categories as follows:20,21(i) FIB-4 value .3.25 as a proxy for advanced
fibrosis; (ii) FIB-4 value between 1.45 and 3.25 for which fibrosis status is considered to be undetermined; and (iii) FIB-4 value ,1.45 considered to be absence of advanced fibrosis.
Statistical analysis
Univariable and multivariable Poisson regression models were fitted to assess factors associated with post-cART DM development. Crude relative risks (RRs) were estimated for the following: (i) fixed covariates (gender, mode of HIV infection, nationality, years of infection and nadir CD4 cell/mm3); (ii) covariates at cART start [age, CDC stage, CD4 and
log10HIV-RNA, hepatitis C virus (HCV) and hepatitis B virus (HBV)
coinfec-tion, total cholesterol and TRG and TRG/HDL]; and (iii) time-dependent cov-ariates that could change value over the course of the observation period and that included all consecutive values of each single variable during the FU and that were called FU variables in the text (BMI, total cholesterol, TRG,
TRG/HDL, type of antiretroviral regimen, type of backbone combination and type of third drug in the regimen, alcohol use and FIB-4).
Patients were pooled according to TRG values at baseline and during FU: (i)≤180 mg/dL (normal TRG); (ii) 181–300 mg/dL (mild hypertriglycer-idaemia); and (iii) .300 mg/dL (moderate/severe hypertriglyceridaemia). Two different multivariable Poisson regression models were fitted, including all factors associated with P values of ,0.2 at univariable ana-lysis. An initial model included time-updated values of TRG/HDL expressed as FU-TRG/HDL (model A) and a second model included time-updated values of TRG expressed as FU-TRG (model B).
Results
Of the 3546 patients included in our analysis, 80 developed DM over 13 911 PYFU, representing an incidence rate of 5.7 per 1000 PYFU (95% CI ¼ 4.6 –7.1). Most patients were males (73.7%) and their median age was 38 years (IQR ¼ 33 – 45). The median BMI at baseline was 23.1 kg/m2 (IQR ¼ 21.1 – 25.2) and 22.1% of patients tested positive for HCV antibodies (HCV-Ab). At baseline, most patients (82.6%) had normal TRG levels, normal HDL (73% of sample) and the median TRG/HDL ratio was 2.8 (IQR¼ 1.8 –4.5). Complete patient characteristics are given in Table1.
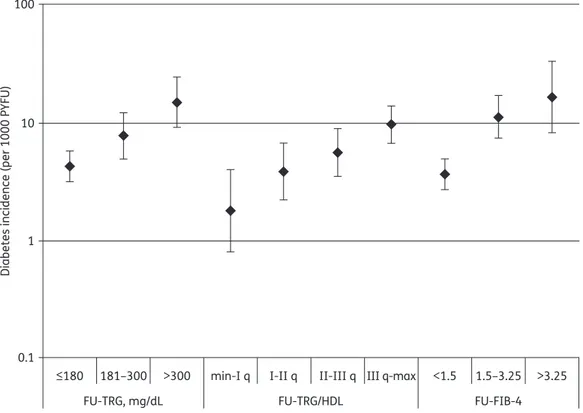
During FU, 28562 TRG/HDL values were calculated. FU-TRG/HDL ratios affected the DM incidence rate: 1.8/1000 PYFU (95% CI¼0.8–4.0) for subjects with ratios lower than the first quartile (TRG/HDL ratio 0–1.69); 3.9/1000 PYFU (95% CI¼2.2–6.8) for ratios between the first and second quartiles (TRG/HDL ratio 1.7–2.69); 5.6/1000 PYFU (95% CI¼3.5–9.0) for ratios between the second and third quartiles (TRG/HDL ratio 2.7 – 4.5); and 9.8/1000 PYFU (95% CI ¼ 6.8 – 14.0) for ratios above the third quartile (TRG/HDL ratio .4.5) (Figure1).
FU-FIB-4 score was also associated with increased DM inci-dence: 3.7/1000 PYFU (95% CI¼ 2.7– 5.0) for subjects with FIB-4 scores of ,1.5; 11.4/1000 PYFU (95% CI ¼ 7.5 – 17.4) for scores between 1.5 and 3.25; and 16.8/1000 PYFU (95% CI¼ 8.4 – 33.6) for FIB-4 scores of .3.25.
At univariable analysis, abnormal values (181 – 300 and .300 mg/dL) of basal TRG as well as time-updated values (FU-TRG) were significantly associated with a higher risk of dia-betes onset compared with normal values (≤180 mg/dL). Patients with mild (TRG between 181 and 300 mg/dL) and mod-erate/severe hypertriglyceridaemia (TRG .300 mg/dL) at baseline had RR¼ 4.16 (95% CI ¼ 2.62–6.62; P,0.001) and RR¼ 2.78 (95% CI ¼ 1.18–6.52; P ¼ 0.019), respectively, versus patients with nor-mal values.
Similarly, patients with FU-TRG in the mild and moderate/severe groups were at higher risk of DM [RR¼1.83 (95% CI¼1.07–3.13; P,0.05) and RR¼ 3.55 (95% CI ¼2.01– 6.28; P,0.001), respect-ively] compared with subjects with normal values.
Additionally, higher TRG/HDL ratio values, both at baseline and during FU, were associated with a higher risk of new dia-betes diagnosis, with RR ¼ 1.16 per 10 points higher (95% CI ¼ 1.06 – 1.27; P ¼ 0.001) and RR ¼ 1.18 (95% CI ¼ 1.10 – 1.26; P, 0.001), respectively.
At univariable analysis, the following risk factors were found to be associated with higher risk of DM: higher age; male gender; nadir CD4 ,200 cells/mm3; CDC C stage versus stage A/B; HCV-Ab positive versus negative; baseline cholesterol between 201 and 239 mg/dL versus normal value≤200 mg/dL; FU-BMI between 25 and 29.9 kg/m2 and FU-BMI ≥30 kg/m2 versus
Squillace et al.
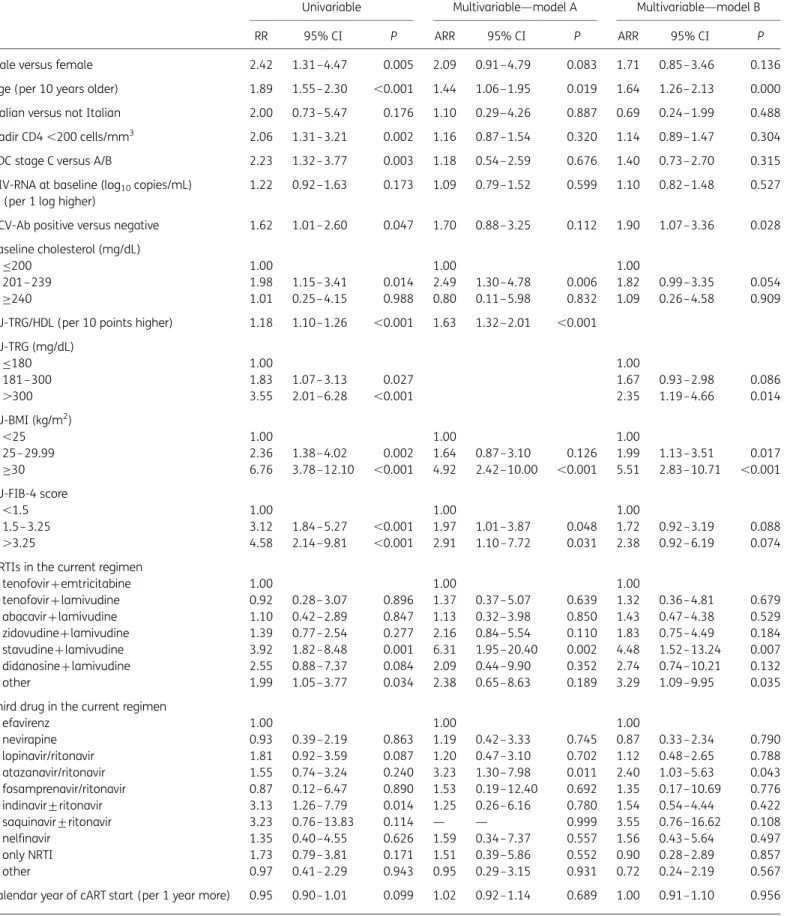
FU-BMI ,25 kg/m2; use of stavudine plus lamivudine in the cur-rent regimen versus tenofovir plus emtricitabine, use of indinavir+ ritonavir in the current regimen versus efavirenz; and FU-FIB-4 score between 1.5 and 3.25 or .3.25 versus ,1.5. Full results are shown in Table2.
Multivariable analysis (models A and B) is shown in Table2. The two models differed by the way FU-TRG was modelled: model A included the FU-TRG/HDL ratio, while model B included FU-TRG. In model A, higher FU-TRG/HDL ratio was associated with higher risk of DM, independently of all factors included and of FU-FIB-4 value. Other factors independently associated with higher risk of diabetes onset were: older age (per 10 year older, RR¼ 1.44; 95% CI ¼ 1.06 – 1.95; P, 0.05); FU-BMI .30 kg/m2 (4.92; 95% CI ¼ 2.42 – 10.00 versus BMI ,25 kg/m2; P, 0.001); use of stavudine+lamivudine in FU regimens (6.31; 95% CI¼1.95–20.40 versus tenofovir+emtricitabine; P,0.01); use of atazanavir/ ritonavir (3.23; 95% CI¼1.30–7.98 versus efavirenz; P,0.05); higher FU-TRG/HDL ratios (per 10 points higher 1.63; 95% CI¼1.32–2.01; P,0.001); baseline cholesterol between 201 and 239 mg/dL (2.49; 95% CI¼ 1.30–4.78 versus≤200 mg/dL; P,0.05); and FU-FIB-4 .3.25 (2.91; 95% CI¼1.10–7.72 versus ,1.5; P,0.05).
Additionally, advanced liver fibrosis (defined as FIB-4 index .3.25) was independently associated with higher risk of DM, par-ticularly in model A, with only marginal association evident in model B (Table2). Of note, this association was much stronger among patients without HCV coinfection (RR ¼ 5.28; 95% CI ¼ 1.25 – 22.27) than in those with positive HCV-Ab (RR ¼ 1.91; 95% CI ¼ 0.61– 6.0; P value for interaction¼ 0.02). In a multivari-ate model excluding FIB-4, HCV-Ab positivity was independently associated with DM development, confirming a strong interaction between FIB-4 and HCV (data not shown).
We also explored the risk of diabetes when high values of TRG/HDL and FIB-4 were coexisting and found that in patients with a TRG/HDL≥4.5 (III quartile) and a FIB-4 .3.25, the RR of diabetes was 4.03 versus those with TRG/HDL ,4.5 and FIB-4 ,1.5 (95% CI ¼ 0.86 – 19.03; P ¼ 0.08), confirming a cumulative effect of the two different markers even if this does not reach stat-istical significance. The interaction test between TRG/HDL and FIB-4 score was not significant (P ¼ 0.33).
Discussion
Our primary goal was to evaluate the incidence and determinants of diabetes in a large cohort of previously ART-naive patients initiating cART in Italy. In this cohort, incidence of new-onset dia-betes was as high as 5.7 per 1000 PYFU, not significantly higher than the incidence reported for uninfected subjects in Italy.22,23
Comparing our data with those obtained from other large cohorts of HIV-infected subjects, we found that our findings were very similar to incidences found in the DAD8and Swiss HIV cohorts,6 but lower than that reported from the ANRS study.5The discrep-ancy between our findings and those of the French study may be attributable to several factors. There were significant age disparities between the two populations: nearly 70% of patients in the French study were .40 years of age, while the median age in our population was 38 years. Also, in our analysis only 37% had started cART before 2005, while the French cohort included patients initiating cART between 1997 and 1999. Such differences Table 1. Study population characteristics, N ¼3546
Male, n (%) 2612 (73.7)
Age (years), median (IQR) 38 (33– 45)
Mode of HIV transmission, n (%)
heterosexual contact 1513 (42.7)
MSM 1224 (34.5)
IVDU 598 (16.9)
other/unknown 211 (6.0)
Italian nationality, n (%) 3045 (85.9)
Duration of HIV infection (years), median (IQR) 1.5 (0.2–5.6)
CDC stage C, n (%) 355 (10.0)
Nadir CD4 cells/mm3, median (IQR) 270 (170–361)
,200 cells/mm3, n (%) 1051 (29.6)
Baseline CD4 cells/mm3, median (IQR) 286 (181–384)
Baseline log10HIV-RNA (copies/mL), median (IQR) 4.8 (4.2–5.2)
HCV positivity, n (%) 766 (22.1) HBV positivity, n (%) 159 (4.5) Baseline BMI, n (%) ,25 kg/m2 1875 (52.9) 25– 29.99 kg/m2 588 (16.6) ≥30 kg/m2 131 (3.7) unknown 952 (26.8)
Baseline total cholesterol, n (%)
≤200 mg/dL 2943 (83.0) 201–239 mg/dL 423 (11.9) ≥240 mg/dL 104 (2.9) unknown 76 (2.1) Baseline HDL-c ,35 mg/dL, n (%) 957 (27.0) Baseline TRG, n (%) ≤180 mg/dL 2929 (82.6) 181–300 mg/dL 489 (13.8) .300 mg/dL 128 (3.6)
Baseline TRG/HDL ratio, median (IQR) 2.79 (1.76–4.53) Baseline FIB-4 score, median (IQR) 0.87 (0.62–1.28) First ARV regimen, n (%)
NRTIs+NNRTI 1486 (41.9)
NRTIs+PI/ritonavir 1467 (41.4)
NRTIs+PI 329 (9.3)
only NRTIs 137 (3.9)
other 127 (3.6)
Years of cART start, n (%)
1997–2001 602 (17.0)
2002–05 754 (21.3)
2006–09 758 (21.4)
2010–14 1432 (40.4)
JAC
in calendar year of inclusion could be an important variable, trans-lating into exposure to different antiretroviral regimens. For example, in the French study, new-onset diabetes peaked in 1999 – 2000 and the subsequent marked decrease is likely to be related to exposure to first-generation antiretrovirals.
In our study, we did not have a control group of HIV-negative subjects; however, the incidence of diabetes we observed in this large cohort of HIV-infected patients was similar to the incidence reported in a sample of HIV-negative subjects of the same age in northern Italy (5.7 versus 5.8 per 1000 PYFU).22Studies conducted
in the USA produced conflicting results when comparing HIV-infected patients with HIV-unHIV-infected controls. In the Multicentre AIDS Cohort Study, Brown et al.4reported a significantly higher inci-dence of diabetes in HIV-infected males on cART compared with HIV-negative males. In contrast, the incidence of diabetes in HIV-infected women in the Women’s Interagency Study, under-taken by Tien et al.,7 was significantly lower than that of the Multicentre AIDS Cohort Study, with no observable differences seen between HIV-infected and -uninfected women. It should be noted, however, that each of these studies used a different definition for diabetes; only the study of Tien et al.,7as ours, used the American Diabetes Association guidelines criteria for definition of DM.
Aiming to define independent predictors of new-onset dia-betes, we have found that TRG levels and TRG/HDL ratios in our cohort are predictive of subsequent diabetes in patients initiating cART. This is consistent with data obtained in the general popula-tion for overweight individuals,24since high prevalence of insulin resistance in subjects with BMI .25 kg/m2usually determines increases in TRG levels and a proportional decrease in HDL.25
Importantly, in our study, more than half of patients had a nor-mal BMI, allowing us to confirm the usefulness of the TRG/HDL
ratio in predicting diabetes, even in non-overweight HIV-infected patients.
One explanation for the association between TRG/HDL ratio and development of diabetes in HIV-infected patients could be that dys-lipidaemia and/or insulin resistance are involved in the pathogen-esis of type 2 diabetes, paralleling data obtained in the general population.23,26Indeed, several reports have suggested that dyslipi-daemia, in particular high TRG and low HDL levels, play a role in the development of diabetes in HIV-negative patients.27–29Lipotoxicity,
inflammation and endoplasmic reticulum stress are the three pathogenetic mechanisms that have been postulated to explain this association30–32 and maintaining healthy HDL-c levels has recently been proposed as a means of preventing diabetes.33
In HIV-positive patients, the relation between HIV replication, chronic subclinical inflammation and use of cART may enhance the link between dyslipidaemia and diabetes and thus needs to be investigated. Vu et al.15recently demonstrated that the inverse correlation between TRG and HDL-c found in the general popula-tion is not present in the HIV populapopula-tion. In determining these results, the authors took into account the CD4 count and detect-able viral load, both of which are possible factors affecting the cor-relation between HDL-c and TRG. Moreover, the authors showed that HIV patients possess a unique cholesteryl ester transfer protein mass, as well as specific activity. With these factors in mind, our study may prove to be a useful tool in confirming an association—already well defined in general population—that merits further investigation in HIV-infected patients on cART, due to the unique characteristics of this population.
The introduction of cART determines an increase in all the lipid profile setting values.16The role of cART in the development of
dyslipidaemia is therefore of great significance. For these reasons,
≤180 181–300 >300 min-I q I-II q II-III q III q-max <1.5 1.5–3.25 >3.25
FU-TRG, mg/dL FU-TRG/HDL FU-FIB-4
0.1 1 10
Diabetes incidence (per 1000 PYFU)
100
Figure 1. Diabetes incidence according to FU-TRG, FU-TRG/HDL and FU-FIB-4.
Squillace et al.
Table 2. Univariate and multivariate models
Univariable Multivariable—model A Multivariable—model B
RR 95% CI P ARR 95% CI P ARR 95% CI P
Male versus female 2.42 1.31–4.47 0.005 2.09 0.91–4.79 0.083 1.71 0.85– 3.46 0.136
Age (per 10 years older) 1.89 1.55–2.30 ,0.001 1.44 1.06–1.95 0.019 1.64 1.26– 2.13 0.000
Italian versus not Italian 2.00 0.73–5.47 0.176 1.10 0.29–4.26 0.887 0.69 0.24– 1.99 0.488
Nadir CD4 ,200 cells/mm3 2.06 1.31–3.21 0.002 1.16 0.87–1.54 0.320 1.14 0.89– 1.47 0.304
CDC stage C versus A/B 2.23 1.32–3.77 0.003 1.18 0.54–2.59 0.676 1.40 0.73– 2.70 0.315
HIV-RNA at baseline (log10copies/mL)
(per 1 log higher)
1.22 0.92–1.63 0.173 1.09 0.79–1.52 0.599 1.10 0.82– 1.48 0.527
HCV-Ab positive versus negative 1.62 1.01–2.60 0.047 1.70 0.88–3.25 0.112 1.90 1.07– 3.36 0.028 Baseline cholesterol (mg/dL)
≤200 1.00 1.00 1.00
201–239 1.98 1.15–3.41 0.014 2.49 1.30–4.78 0.006 1.82 0.99– 3.35 0.054
≥240 1.01 0.25–4.15 0.988 0.80 0.11–5.98 0.832 1.09 0.26– 4.58 0.909
FU-TRG/HDL (per 10 points higher) 1.18 1.10–1.26 ,0.001 1.63 1.32–2.01 ,0.001 FU-TRG (mg/dL) ≤180 1.00 1.00 181–300 1.83 1.07–3.13 0.027 1.67 0.93– 2.98 0.086 .300 3.55 2.01–6.28 ,0.001 2.35 1.19– 4.66 0.014 FU-BMI (kg/m2) ,25 1.00 1.00 1.00 25– 29.99 2.36 1.38–4.02 0.002 1.64 0.87–3.10 0.126 1.99 1.13– 3.51 0.017 ≥30 6.76 3.78–12.10 ,0.001 4.92 2.42–10.00 ,0.001 5.51 2.83– 10.71 ,0.001 FU-FIB-4 score ,1.5 1.00 1.00 1.00 1.5– 3.25 3.12 1.84–5.27 ,0.001 1.97 1.01–3.87 0.048 1.72 0.92– 3.19 0.088 .3.25 4.58 2.14–9.81 ,0.001 2.91 1.10–7.72 0.031 2.38 0.92– 6.19 0.074
NRTIs in the current regimen
tenofovir+emtricitabine 1.00 1.00 1.00 tenofovir+lamivudine 0.92 0.28–3.07 0.896 1.37 0.37–5.07 0.639 1.32 0.36– 4.81 0.679 abacavir+lamivudine 1.10 0.42–2.89 0.847 1.13 0.32–3.98 0.850 1.43 0.47– 4.38 0.529 zidovudine+lamivudine 1.39 0.77–2.54 0.277 2.16 0.84–5.54 0.110 1.83 0.75– 4.49 0.184 stavudine+lamivudine 3.92 1.82–8.48 0.001 6.31 1.95–20.40 0.002 4.48 1.52– 13.24 0.007 didanosine+lamivudine 2.55 0.88–7.37 0.084 2.09 0.44–9.90 0.352 2.74 0.74– 10.21 0.132 other 1.99 1.05–3.77 0.034 2.38 0.65–8.63 0.189 3.29 1.09– 9.95 0.035
Third drug in the current regimen
efavirenz 1.00 1.00 1.00 nevirapine 0.93 0.39–2.19 0.863 1.19 0.42–3.33 0.745 0.87 0.33– 2.34 0.790 lopinavir/ritonavir 1.81 0.92–3.59 0.087 1.20 0.47–3.10 0.702 1.12 0.48– 2.65 0.788 atazanavir/ritonavir 1.55 0.74–3.24 0.240 3.23 1.30–7.98 0.011 2.40 1.03– 5.63 0.043 fosamprenavir/ritonavir 0.87 0.12–6.47 0.890 1.53 0.19–12.40 0.692 1.35 0.17– 10.69 0.776 indinavir+ritonavir 3.13 1.26–7.79 0.014 1.25 0.26–6.16 0.780 1.54 0.54– 4.44 0.422 saquinavir+ritonavir 3.23 0.76–13.83 0.114 — — 0.999 3.55 0.76– 16.62 0.108 nelfinavir 1.35 0.40–4.55 0.626 1.59 0.34–7.37 0.557 1.56 0.43– 5.64 0.497 only NRTI 1.73 0.79–3.81 0.171 1.51 0.39–5.86 0.552 0.90 0.28– 2.89 0.857 other 0.97 0.41–2.29 0.943 0.95 0.29–3.15 0.931 0.72 0.24– 2.19 0.567
Calendar year of cART start (per 1 year more) 0.95 0.90–1.01 0.099 1.02 0.92–1.14 0.689 1.00 0.91– 1.10 0.956
RR, relative risk; ARR, adjusted relative risk.
JAC
and because of the low BMI seen in the majority of HIV-positive patients with or without lipoatrophy,14our finding that the TRG/ HDL ratio is predictive of DM, independently of BMI, is of great sig-nificance and justifies screening for diabetes in HIV-infected patients with high TRG and TRG/HDL ratio.
Another important concern highlighted by our findings is the optimal cut-off for the TRG/HDL ratio in HIV-infected patients. A significant cut-off of TRG/HDL has been proposed in the general population (.3), which has been demonstrated to be effective in overweight subjects.24In our study, we found a significantly higher incidence of new-onset diabetes for patients in the third quartile for TRG/HDL ratio, corresponding to a ratio value of .4.5 with a sensitivity of 45.3% and a specificity of 75%. Considering a cut-off of 3.5, sensitivity was higher (62.5%) and specificity was reduced (64.1%) (data not shown). Therefore, we could argue that a cut-off of 4.5 should be used for the HIV population, espe-cially in patients with a normal BMI.
The relation between type of cART, dyslipidaemia and inci-dence of diabetes is a major issue for the management of HIV patients. We found a strong association between new-onset DM and exposure to cART, especially with stavudine and indinavir use, consistent with the proven ability of these drugs to induce insulin resistance.5,6The association we found with atazanavir is
difficult to explain. It did not change even after correcting for ata-zanavir in the first regimen or as a switch. It may reflect the PI class effect and the wide use of atazanavir in recent years, espe-cially among patients with metabolic complications.
Our study also explored the predictive value of a liver fibrosis marker (FIB-4) in detecting patients at risk of DM. In the general population, advanced liver fibrosis (defined as FIB-4 index .3.25) has been associated with diabetes, due to the high prevalence of NAFLD in diabetic patients and drug-induced steatosis.17,18FIB-4 has therefore been proposed as an indirect marker correlating with progressive metabolic alterations.
In our cohort, a FIB-4 value of .3.25 was significantly asso-ciated with new-onset DM in HCV-Ab-negative subjects; further-more, a strong interaction was found between FIB-4 and HCV, as expected. Hepatic fibrosis could be a marker of increased risk of diabetes both for metabolic steatosis and for viral steatosis due to HCV. The association between HCV and diabetes is well described in literature.34,35Together with the TRG/HDL ratio, FIB-4 .3.25 could therefore prove to be a useful tool for identify-ing patients with hepatic damage caused both by metabolic and HCV-induced steatosis.
Our study has some limitations. We did not collect waist circum-ference, which could allow us to evaluate the prevalence of meta-bolic syndrome in our cohort. Waist circumference is a valid marker of diabetes risk and could add important information to our results. On the other hand we focused our attention on a surrogate marker of insulin resistance (TRG/HDL ratio) that is considered the driving force of metabolic syndrome components. Another limit was the lack of data regarding HCV-RNA replication in patients with HCV-Ab positivity that should have provided the exact impact of HCV-related damage. However, we did not consider HCV role in our conclusions because of this limit. Our analysis is based on an observational study and does not have the strength to define a real causality between the risk factors and development of dia-betes, especially regarding the associations with ART regimens.
In conclusion, in studying a cohort of HIV-infected patients previously naive to cART, we found that incidence of diabetes
was more frequent in subjects with lipid abnormalities, with or without high BMI. The TRG/HDL ratio proved to be an independent predictor of diabetes and thus a simple and useful marker to iden-tify patients with insulin resistance who are at subsequent risk of diabetes, in order to enact early prevention strategies. High TRG levels observed during cART are likely to be not only a conse-quence of therapy, but an effective marker of insulin resistance, even in the presence of normal BMI. Moreover, measurement of liver fibrosis by FIB-4 could be of use as a supplemental DM surro-gate marker.
Acknowledgements
These data were presented at the Twenty-first Conference on Retroviruses and Opportunistic Infections, Boston, MA, USA, 2014 (Poster no. 770).
Members of the Icona Foundation Study Group
Board of Directors
M. Moroni (Chair), M. Andreoni, G. Angarano, A. Antinori, A. d’Arminio Monforte, F. Castelli, R. Cauda, G. Di Perri, M. Galli, R. Iardino, G. Ippolito, A. Lazzarin, C. F. Perno, F. von Schloesser and P. Viale.
Scientific Secretary
A. d’Arminio Monforte, A. Antinori, A. Castagna, F. Ceccherini-Silberstein, A. Cozzi-Lepri, E. Girardi, S. Lo Caputo, C. Mussini and M. Puoti.
Steering Committee
M. Andreoni, A. Ammassari, A. Antinori, C. Balotta, P. Bonfanti, S. Bonora, M. Borderi, M. R. Capobianchi, A. Castagna, F. Ceccherini-Silberstein, A. Cingolani, P. Cinque, A. Cozzi-Lepri, A. d’Arminio Monforte, A. De Luca, A. Di Biagio, E. Girardi, N. Gianotti, A. Gori, G. Guaraldi, G. Lapadula, M. Lichtner, S. Lo Caputo, G. Madeddu, F. Maggiolo, G. Marchetti, S. Marcotullio, L. Monno, C. Mussini, M. Puoti, E. Quiros Roldan, S. Rusconi and A. Saracino.
Statistical and Monitoring Team
A. Cozzi-Lepri, P. Cicconi, I. Fanti, L. Galli, P. Lorenzini, A. Rodano, M. Shanyinda and A. Tavelli.
Participating Physicians and Centres
Italy: A. Giacometti, A. Costantini and S. Mazzoccato (Ancona); G. Angarano, L. Monno and C. Santoro (Bari); F. Maggiolo and C. Suardi (Bergamo); P. Viale, E. Vanino and G. Verucchi (Bologna); F. Castelli, E. Quiros Roldan and C. Minardi (Brescia); T. Quirino and C. Abeli (Busto Arsizio); P. E. Manconi and P. Piano (Cagliari); J. Vecchiet and K. Falasca (Chieti); L. Sighinolfi and D. Segala (Ferrara); F. Mazzotta and S. Lo Caputo (Firenze); G. Cassola, C. Viscoli, A. Alessandrini, R. Piscopo and G. Mazzarello (Genova); C. Mastroianni and V. Belvisi (Latina); P. Bonfanti and I. Caramma (Lecco); A. Chiodera and A. P. Castelli (Macerata); M. Galli, A. Lazzarin, G. Rizzardini, M. Puoti, A. d’Arminio Monforte, A. L. Ridolfo, R. Piolini, A. Castagna, S. Salpietro, L. Carenzi, M. C. Moioli, C. Tincati and G. Marchetti (Milano); C. Mussini and C. Puzzolante (Modena); A. Gori and G. Lapadula (Monza); N. Abrescia, A. Chirianni, G. Borgia, M. G. Guida, M. Gargiulo, I. Gentile and R. Orlando (Napoli); F. Baldelli and D. Francisci (Perugia); G. Parruti and T. Ursini (Pescara); G. Magnani and M. A. Ursitti (Reggio Emilia); R. Cauda, M. Andreoni, A. Antinori, V. Vullo, A. Cingolani, A. d’Avino, L. Gallo, E. Nicastri, R. Acinapura, M. Capozzi, R. Libertone, G. Tebano and M. Zaccarelli (Roma); F. Viviani and L. Sasset (Rovigo); M. S. Mura and G. Madeddu (Sassari); A. De Luca and B. Rossetti (Siena); P. Caramello,
Squillace et al.
G. Di Perri, G. C. Orofino, S. Bonora and M. Sciandra (Torino); M. Bassetti and A. Londero (Udine); and G. Pellizzer and V. Manfrin (Vicenza).
Funding
Icona is supported by unrestricted educational grants from Abbvie, Bristol-Myers Squibb, Gilead Sciences, Janssen-Cilag, Merck Sharp & Dohme and ViiV Healthcare.
Transparency declarations
None to declare.
References
1 Palella FJ Jr, Delaney KM, Moorman AC et al. Declining morbidity and mortality among patients with advanced human immunodeficiency virus infection. HIV Outpatient Study Investigators. N Engl J Med 1998; 338: 853–60.
2 Guaraldi G, Orlando G, Zona S et al. Premature age-related comorbidities among HIV-infected persons compared with the general population. Clin Infect Dis 2011; 53: 1120– 6.
3 Walli R, Herfort O, Michl GM et al. Treatment with protease inhibitors associated with peripheral insulin resistance and impaired oral glucose tol-erance in HIV-1-infected patients. AIDS 1998; 12: F167– 73.
4 Brown TT, Cole SR, Li X et al. Antiretroviral therapy and the prevalence and incidence of diabetes mellitus in the Multicenter AIDS Cohort Study. Arch Intern Med 2005; 165: 1179– 84.
5 Capeau J, Bouteloup V, Katlama C et al. Ten-year diabetes incidence in 1046 HIV-infected patients started on a combination antiretroviral treat-ment. AIDS 2012; 26: 303– 14.
6 Ledergerber B, Furrer H, Rickenbach M et al. Factors associated with the incidence of type 2 diabetes mellitus in HIV-infected participants in the Swiss HIV Cohort Study. Clin Infect Dis 2007; 45: 111– 9.
7 Tien PC, Schneider MF, Cole SR et al. Antiretroviral therapy exposure and incidence of diabetes mellitus in the Women’s Interagency HIV Study. AIDS 2007; 21: 1739–45.
8 De Wit S, Sabin CA, Weber R et al. Incidence and risk factors for new-onset diabetes in HIV-infected patients: the Data Collection on Adverse Events of Anti-HIV Drugs (D:A:D) study. Diabetes Care 2008; 31: 1224–9. 9 American Diabetes Association. Standards of medical care in diabetes— 2014. Diabetes Care 2014; 37 Suppl 1: S14– 80.
10 Gonzalez-Chavez A, Simental-Mendia LE, Elizondo-Argueta S. Elevated triglycerides/HDL-cholesterol ratio associated with insulin resistance. Cir Cir 2011; 79: 126– 31.
11 Kannel WB, Vasan RS, Keyes MJ et al. Usefulness of the triglyceride-high-density lipoprotein versus the cholesterol-high-density lipoprotein ratio for predicting insulin resistance and cardiometabolic risk (from the Framingham Offspring Cohort). Am J Cardiol 2008; 101: 497–501. 12 Li C, Ford ES, Meng YX et al. Does the association of the triglyceride to high-density lipoprotein cholesterol ratio with fasting serum insulin differ by race/ethnicity? Cardiovasc Diabetol 2008; 7: 4.
13 Shafran SD, Mashinter LD, Roberts SE. The effect of low-dose ritonavir monotherapy on fasting serum lipid concentrations. HIV Med 2005; 6: 421–5.
14 Brown TT, Xu X, John M et al. Fat distribution and longitudinal anthropo-metric changes in HIV-infected men with and without clinical evidence of lipodystrophy and HIV-uninfected controls: a substudy of the Multicenter AIDS Cohort Study. AIDS Res Ther 2009; 6: 8.
15 Vu CN, Ruiz-Esponda R, Yang E et al. Altered relationship of plasma tri-glycerides to HDL cholesterol in patients with HIV/HAART-associated dys-lipidemia: further evidence for a unique form of metabolic syndrome in HIV patients. Metabolism 2013; 62: 1014– 20.
16 Anastos K, Lu D, Shi Q et al. Association of serum lipid levels with HIV serostatus, specific antiretroviral agents, and treatment regimens. J Acquir Immune Defic Syndr 2007; 45: 34– 42.
17 Capeau J. Insulin resistance and steatosis in humans. Diabetes Metab 2008; 34: 649–57.
18 Guaraldi G, Squillace N, Stentarelli C et al. Nonalcoholic fatty liver dis-ease in HIV-infected patients referred to a metabolic clinic: prevalence, characteristics, and predictors. Clin Infect Dis 2008; 47: 250– 7.
19 d’Arminio Monforte A, Lepri AC, Rezza G et al. Insights into the reasons for discontinuation of the first highly active antiretroviral therapy (HAART) regimen in a cohort of antiretroviral naive patients. I.CO.N.A. Study Group. Italian Cohort of Antiretroviral-Naive Patients. AIDS 2000; 14: 499– 507. 20 Sterling RK, Lissen E, Clumeck N et al. Development of a simple non-invasive index to predict significant fibrosis in patients with HIV/HCV coin-fection. Hepatology 2006; 43: 1317– 25.
21 Vallet-Pichard A, Mallet V, Nalpas B et al. FIB-4: an inexpensive and accurate marker of fibrosis in HCV infection. Comparison with liver biopsy and fibrotest. Hepatology 2007; 46: 32– 6.
22 Bruno G, Runzo C, Cavallo-Perin P et al. Incidence of type 1 and type 2 diabetes in adults aged 30 –49 years: the population-based registry in the province of Turin, Italy. Diabetes Care 2005; 28: 2613– 9.
23 Bonora E, Kiechl S, Willeit J et al. Population-based incidence rates and risk factors for type 2 diabetes in white individuals: the Bruneck study. Diabetes 2004; 53: 1782–9.
24 McLaughlin T, Abbasi F, Cheal K et al. Use of metabolic markers to iden-tify overweight individuals who are insulin resistant. Ann Intern Med 2003; 139: 802–9.
25 Reaven G. Insulin resistance and coronary heart disease in nondiabetic individuals. Arterioscler Thromb Vasc Biol 2012; 32: 1754– 9.
26 Weyer C, Bogardus C, Mott DM et al. The natural history of insulin secre-tory dysfunction and insulin resistance in the pathogenesis of type 2 dia-betes mellitus. J Clin Invest 1999; 104: 787– 94.
27 Wilson PW, Kannel WB, Anderson KM. Lipids, glucose intolerance and vascular disease: the Framingham Study. Monogr Atheroscler 1985; 13: 1 –11.
28 von Eckardstein A, Sibler RA. Possible contributions of lipoproteins and cholesterol to the pathogenesis of diabetes mellitus type 2. Curr Opin Lipidol 2011; 22: 26– 32.
29 Drew BG, Rye KA, Duffy SJ et al. The emerging role of HDL in glucose metabolism. Nat Rev Endocrinol 2012; 8: 237–45.
30 Samuel VT, Shulman GI. Mechanisms for insulin resistance: common threads and missing links. Cell 2012; 148: 852– 71.
31 Glass CK, Olefsky JM. Inflammation and lipid signaling in the etiology of insulin resistance. Cell Metab 2012; 15: 635–45.
32 Kraegen EW, Cooney GJ, Turner N. Muscle insulin resistance: a case of fat overconsumption, not mitochondrial dysfunction. Proc Natl Acad Sci USA 2008; 105: 7627–8.
33 Mortensen SP, Boushel R. High-density lipoprotein: a new therapeutic target for glucose intolerance? Circulation 2013; 128: 2349– 50.
34 Mehta SH, Brancati FL, Strathdee SA et al. Hepatitis C virus infection and incident type 2 diabetes. Hepatology 2003; 38: 50– 6.
35 Mason AL, Lau JY, Hoang N et al. Association of diabetes mellitus and chronic hepatitis C virus infection. Hepatology 1999; 29: 328–33.