Research Article
Antioxidant Species in Grapes and Wines via Spectrophotometric
Methods: No Quenching Effects by Copper(II) and Yeast
Derivative Treatments
Gabriella Tamasi ,
1,2Alessio Pardini,
1,2Claudia Bonechi ,
1,2Alessandro Donati ,
1,2Gemma Leone ,
1,3Marco Consumi,
1,3Daniele Pagni,
4Renzo Cini,
1Claudio Rossi ,
1,2,5and Agnese Magnani
1,31Department of Biotechnology, Chemistry and Pharmacy, University of Siena, Via Aldo Moro 2, 53100 Siena, Italy 2Centre for Colloid and Surface Science (CSGI), University of Florence, Via della Lastruccia 3, Sesto Fiorentino,
50019 Firenze, Italy
3National Interuniversity Consortium of Materials Science and Technology (INSTM), Via G. Giusti 9, 50121 Firenze, Italy 4Rocca di Castagnoli, Localit`a Castagnoli, Gaiole in Chianti, 53013 Siena, Italy
5Operative Unit, University of Siena, CampoVerde, Calabria, Siena, Italy
Correspondence should be addressed to Gabriella Tamasi; [email protected] and Alessandro Donati; [email protected]
Received 19 December 2018; Revised 11 February 2019; Accepted 19 February 2019; Published 13 March 2019 Academic Editor: Philippe Jeandet
Copyright © 2019 Gabriella Tamasi et al. This is an open access article distributed under the Creative Commons Attribution License, which permits unrestricted use, distribution, and reproduction in any medium, provided the original work is properly cited.
Analytical determinations for selected parameters in grapes/wines help planning technology treatments in the vineyards and cellars, improving the quality of final products and preserving consumers’ health. The study first reports a comparative analysis for selected parameters on juice, must, and wines at alcoholic and malolactic fermentation stages, from 2013 harvest and refined bottled wines from 2010–2012 and 2015 vintages. This was considered preliminary to the main goal of the work that consisted of testing if the contents of certain antioxidant principles were influenced or not by additions of copper(II) and/or selected fer-mentation yeasts. Particular attention was devoted to antioxidant molecule contents: total polyphenols, anthocyanins, trans-resveratrol, and quercetin. Selected samples were then analyzed in absence and in presence excess Cu(II)-sulfate (5 mgCu/L) and/ or yeast derivatives to evaluate possible effects on antioxidant concentrations. The total polyphenols contents in untreated wine samples were as high as 3334 ± 60 mg (gallic acid)/L and averaged 2883 ± 299 mg/L (wines 2010–2013 and 2015). In particular, high contents of quercetin and quercetin glucoside were found in Sangiovese/Canaiolo/Colorino (harvest 2015) wine, being 21 ± 2 and 3.0 ± 0.2 mg/L, respectively. Even resveratrol had high concentrations in 100% Sangiovese wine (1.3 ± 0.1 mg/L, harvest 2015; 2.6 ± 0.3 mg/L, harvest 2010). Interestingly, no significant effect was revealed by Cu(II) and/or yeast derivatives on antioxidant contents for wine matrixes. In fact, determinations (validated through the standard addition methods) of trans-resveratrol for untreated Sangiovese wines (1.18 ± 0.09 mg/L) and for wines treated with excess Cu(II) and excess Cu(II) plus excess yeasts mixtures (1.24 ± 0.09 mg/L and 1.22 ± 0.05 mg/L) did not differ significantly.
1. Introduction
Consumption of alcohol is certainly a serious problem particularly in specific geographic areas and in younger generations. However, the production of high quality wines linked to centenary local traditions is an economic activity
capable of improving the environmental and socioeconomic sustainability of specific territorial areas. The in-depth study of each production, storage, aging and refining stages of wine is essential to improve the knowledge of the chemical complexity of this product that is often present in our dinners. Through the study of chemical processes and their Volume 2019, Article ID 1354382, 9 pages
dynamics, it will be possible to learn more about the properties of a beverage whose very moderate use can also bring beneficial effects and the pleasure of a combination of harmonies between food and drink.
Wine is an alcoholic beverage produced since millennia by populations living in several areas of the world. The experimental practices carried out by very many chemical and biological studies recently performed, allowed to obtain wines, and other spirit drinks of superior quality [1, 2]. The costs of production, storage, marketing, care for consumers’ health increased significantly, because the beverage requires an extreme care for each stage of production: from vines and grapes growths throughout commercialization. Wine mar-ket has a relevant role for financial budgets for several countries, and it is estimated to sum up to many tens of billions Euro/year [3, 4].
Our attention focused mostly on Sangiovese variety, even though some samples that contained wines from other red varieties (Canaiolo, Merlot, and Colorino) were included in the study. The wines were pure Sangiovese (100%) or 80% Sangiovese (minimum, without any white variety), and grapes were cultivated and wines were pro-duced, only in a restricted area [5]. During the last couples of decades, science and technology research focused much on wine analysis from chemical, biological, nutritional, agronomical, and plant/cellar treatments stand points, to improve the quality and to preserve the health of the consumers [6]. Treatments of vines/grapes with copper(II) sulfate/oxychloride are allowed for organic cultivations, and copper chemically interacts with natural/bioactive molecules [7–9]. Certain bioactive molecules present in grapes and wines are particularly relevant to human health because of their antioxidant potential. It is reported that polyphenols (like resveratrol, quercetin, and quercitrin) show high antioxidant [10–13], anticancer [14–17], and cardiovascular system protective activities [18–21] and play important roles in human oral microbiota preserva-tion [22]. Due to its anthocyanins and polyphenols components, wine is comparable, in terms of antioxidant
properties to natural and enriched formulations
[18, 19, 23].
The present work reports the chemical characterization and antioxidant indicators (trans-resveratrol, quercetin, and quercitrin) on selected grapes and wines at different wine-making stages. The main goal and the novelty of this research study was the determination of possible effects by excess copper(II) and yeast derivatives on antioxidant species in wines.
2. Materials and Methods
2.1. Chemicals and Materials. All reagents and analytical
standards were of analytical grade, and solvents were of HPLC grade and purchased from Sigma-Aldrich (Milan, Italy): sodium thiosulfate pentahydrate, sodium carbonate (anhy-drous), potassium chloride, potassium dichromate, iodine, potassium iodide, calcium chloride, copper(II)-sulfate pen-tahydrate, phenolphthalein (3% in ethanol:water, 1 : 1), starch suspension (1% in water), Devarda alloy (5 : 45 : 50%, zinc/
aluminum/copper), sodium hydroxide, hydrochloric acid, sulfuric acid, nitric acid, acetic acid, acetonitrile, methanol, ethylacetate, Folin–Ciocalteu’s phenol reagent, Fehling’s re-agents I and II for total reducing sugar determination, gallic acid, trans-resveratrol, quercetin; quercetin 3-β-D-glucoside, D(−)glucose, and D(−)fructose. Bˆatonnage body (BB), Elevage Glutathione (EGSH), and Tannin Ellagitan rouge (TAN) yeast derivatives were high-purity enology products (UNI EN ISO 9001 : 2008; HACCP Codex Alimentarius) from AEB SpA (San Polo, Brescia, Italy).
2.2. Sample Collection, Pretreatment, and Storage. The grape
samples were collected in the year 2013, from 100% San-giovese grapes (STY13, Chianti area, Tuscany, Italy). The main vineyard characteristics were as follows: altitude, 456–420 m a.s.l.; ground slope, 10% (average); dimension,
250 × 200 m2; plantation, 2002; rows distance, 2.5 m;
dis-tance in a row, 0.8 m; density, ca. 5000 plants/ha; Guyot and spurred cordon pruning methods. The soil nature (calcareous with stones, pebbles, and gravel), sun irradi-ation, general climate were the same for all yards, that received just organic management (organic fertilizer on March once/year; copper(II)-sulphate/calcium hydroxide aqueous suspension from April to July, 8–12 treatments/ year).
The grapes sampling was performed along the two di-agonals (ca. 1/4, 1/2, 3/4, the overall lengths, five spots; in triplicate; 1.5 kg of grapes each). The stalks were removed, and the berries were squeezed to prepare the grape juice
samples (JU), stored in polyethylene bottles (−30 ± 1°C,
dark) before analyses. The waste materials were manually handled (by using plastic knife over a polyethylene sheet) and portions of skins (SK) and seeds (SE) were separated and cleaned by pulp. SE and SK samples underwent freeze-dry
procedure (lyophilizator 5 Pascal, LIO-5P 4 k; −51 ± 2°C,
1.5 ± 0.2 mbar; 3 days), grounded (granulometry, 0.08 mm
sieve), and stored in polyethylene vessels (−30 ± 1°C, dark)
before analyses.
Three samples (0.25 L each) of must (STY13-MU), ob-tained by mechanical removal of stalks and squeezing, were collected from the fermentation tanks (within 24 h from mixing), and the fermentation process was immediately
stopped by freezing (−30 ± 1°C, dark, avoiding head-space).
The alcoholic fermentation of must took place in steel tanks
(max temperature, 29 ± 1°C) with pumping over cycles for
four times a day. Three samples of wine were collected at the end of the alcoholic and malolactic fermentations, re-spectively (1 L each; STY13-AF, STY13-MF). Wines from a second vineyard were studied (SGTY13) having same soil and vine characteristics (excluding the plantation, year 2008), as well as refined bottled wines from 2010–2012 and 2015 harvestings (STY10, STY11, STY12, SGTY12, STY15, and SCCY15). SCC vineyard consisted of Sangiovese 90%, Canaiolo 5%, and Colorino 5%. All the wine samples were collected in triplicate.
To evaluate possible effects on antioxidant parameters, samples of SCCY15 wines were treated by adding ultrapure
derivatives Bˆatonnage body (1.2 gBB/L and 1.2 gBB/ L + 5.0 mgCu/L), Elevage Glutathione (1.2 gEGSH/L and 1.2 gEGSH/L + 5.0 mgCu/L), and Tannin Ellagitan Rouge (0.66 gBB/L + 0.66 gEGSH/L + 0.10 gTAN/L + 5.0 mgCu/L). Each treatment was tested in triplicate, and the treated samples were stored in polyethylene bottles, completely filled
(21 ± 2°C, dark) for 60 days before analysis.
2.3. Analytical Methods
2.3.1. Wine-Making Key Parameters. Several fermentation
parameters were analyzed for a general characterization of the grapes, grape juice (JU and MU), and wines at different
wine-making stages: total sugar (°Brix), reducing sugar
(RSU, gGLU/kg), alcohol content (ALC, % v/v, by
com-paring d20/20values with tabled values, and calculating the
air density as dair(kg/m3) � 0.465Pair(mbar) 0.75/T (K)),
total nitrogen content (TN measured via the Kjeldahl method, gN/kg), total protein contents (TPC, computed as alanine equivalent, 6.36 times TN, gALA/kg), pH values, volatile acidity (VAC, acetic acid equivalent, mgACA/L), and total acidity contents (TAC, titratable; tartaric acid equivalent, gTAA/L), free or volatile sulfur
dioxide (VSO2, mgSO2/L), and total sulfur dioxide
con-tents (TSO2, mgSO2/L). All the procedures were adapted
from the official methods reported by International Or-ganization of Vine and Wine (OIV) [24] and other re-searchers [25].
The absorbance values at λ 420, 520, and 620 nm were recorded via UV-Vis spectrophotometer on wine samples
(decanted or filtered up to clearness; at 21 ± 2°C) and wine
shade (HUE), and the color index (CI) were calculated. The spectrophotometer was a double-beam Lambda-10 (Per-kinElmer, Monza, Italy): resolution, 2 nm; equipped with a continuum flux quartz cuvettes with optical length of 1 or 10 mm, depending on the absorbance values (without any dilution). Each reading was from the mean of ten scans. The instrument was managed by the software UV WinLab, Ver. 2.85 (PerkinElmer). The method was adapted from studies previously reported [26–28], as well as the official methods [24, 25]. Validation parameters and standard errors of the methods just reported were those published by the OIV [24] and the standard errors were <5% for all the methods.
2.3.2. Total Polyphenol Content. The method was based on
the colorimetric technique with external calibration curve using gallic acid (GAA) and Folin–Ciocalteu reactant (FCR) [24, 29, 30]. Aliquots of 100, 500, 750, and 1000 μL of a standard solution of GAA (500 mg/100 mL) or 200 μL of wine samples (or 1000 μL for JU and MU samples) were preliminarily diluted in ultrapure water, by addinf FCR
(5 mL) and Na2CO3aq(20% w/v, 20 mL) and diluted again up
to volume (100 mL). A blank of reactants was also tested.
Incubation was done for 30 min (21 ± 2°C, dark).
Absor-bance was recorded at λ 750 nm through 10 mm optical
length PMMA cuvettes (semi-micro, Brand
®
standard; seeSection 2.3.1 for other instrumental details). The results were
expressed as GAA equivalent, and LOD and LOQ values were 1.0 and 3.0 mg/L, respectively. In all the cases, cali-bration curves (in the range 5.0–50.0 mg/L) were accepted
with a R2> 0.990.
2.3.3. Monomeric Anthocyanin Content. The absorbance
value at λ 520 nm were recorded on wine samples treated
with HCl 1M (at 21 ± 2°C), through 10 mm optical length
PMMA cuvettes (semi-micro, Brand
®
standard; see Section2.3.1 for other instrumental details). ANT values were expressed as malvidin-3-O-glucoside chloride (MVG;
ε, 28000 L/cm·mol; [31]). The LOD and LOQ values were 0.5
and 2.0 mgMVG/L, respectively.
2.3.4. trans-Resveratrol, Quercetin, and Quercetin Glucoside Contents. On the basis of protocols already published
[29, 32, 33], each wine sample replicate (20 mL) was extracted by using ethylacetate (three times, 15 mL each); the organic fractions were collected, added, and evaporated
under vacuum (<35 ± 2°C, dark). The dry residue was
resuspended in 1.0 mL of MeOH/H2O (6 : 4, v/v) mixture
and filtered through PTFE syringe filters (porosity, 0.2 μm). The analytical determination of RES, QUE, and QUEG contents was carried out via isocratic HPLC instrument (Varian Prostar 210; Agilent Technologies, Rome, Italy) equipped with reverse phase C18 column (Varian Polaris
C18-A, 250 mm × 4.6 mm, pore size 180 ˚A, particle size 5 μm),
UV-Vis detector (Varian Star 9050), and software Star-6.41
for instrument management and data collection.
In both cases, the eluent was the mixture 70 : 22 : 8% (w/w;
H2O : CH3CN : CH3OH; H2O was acidified with 1%
CH3COOH); flux rate, 0.75 mL/min; UV detector, λ 306 nm.
Retention times for QUEG, RES, and QUE were 7.0 ± 0.2, 17.5 ± 0.2, 29.9 ± 0.5 min, respectively; total run time, 35 min. The QUE and QUEG quantifications were carried out using external calibration protocol (linearity range 20.0– 300.0 mg/L, using five different standard concentrations).
Calibration curves were accepted with R2> 0.990. The
intra-and interday calibration analysis (on three different days) were carried out and revealed a RSD% of < 1% and 3%, respectively. As regards the selectivity, selected samples were analyzed after spiking with the standards to confirm peak identity. The RES quantification was carried out by the standard addition method [34], and four aliquots of wine extract were added in different volumes of a standard
so-lution (0.3 mg/mL) and MeOH/H2O (6 : 4, v/v) solvent
mixture (to a fixed total volume). Calibration curves were
accepted with R2> 0.990.
Both methods were tested for precision that was eval-uated repeating injections of the sample extracts three times (each replicate, three replicates). The RSD% of peak area were <5% and RSD% of retention times were <2%. LOD and LOQ values were 0.1 and 0.3 mg/L for RES, and 4.0 and 10.0 mg/L for both QUE and QUEG.
2.4. Statistical Analysis. All the samples were collected and
analytical procedures were also performed in triplicates. The final data were then reported as mean values and estimated standard deviations (esd). Statistically significant differences among data were verified carrying out the analysis of var-iance (ANOVA) and Tukey’s test. The data showing p values < 0.05 were considered statistically significant. Cal-culations were carried out using Microsoft Office Excel 2007, implemented with statistical analysis subroutine, and from Origin Pro8 SR2 (v.0891, B891; OriginLab Corporation, Northampton, USA).
3. Results and Discussion
3.1. Selected Nutrients in Grapes and Wine Fermentation Parameters. The content of total nitrogen (TN) for
STY13-JU was 0.24 ± 0.03 gN/L (Table 1) corresponding to total protein content (TPC) of 1.53 ± 0.20 gALA/L. Data of TN in grapes from other works ranged 0.21–0.69 gN/L [35, 36] and underline that contents of TN smaller than 0.14 gN/L may be related to a significant lowering of the fermentation rate and the formation of undesired sulfur compounds. The TN value for STY13-SK + SE (dry samples) was 6.8 ± 0.7 gN/kg, ca. 28 times higher than the value found for JU. As nitrogen starvation was not revealed in the study cases and to maintain the natural high quality of grape/wine, any ni-trogen integrator was not added at fermentation stages.
It is well known that the value of reducing sugar (RSU) in grapes is an important harvesting-time indicator (ripeness range being 150–300 gGLU/kg), and the value for STY13-JU was 226 ± 10 gGLU/kg, which was in line with data pre-viously reported for 98 different grape cultivars (range 93.5–253.9 g/L; [37]). The overall sugar content expressed as Brix for both STY13-JU and STY13-MU was also not sta-tistically different (21.2 ± 1.0 and 22.5 ± 1.0 Brix, re-spectively), and the alcoholic content (ALC) predictable from Brix value was 13.5 ± 0.6% v/v for MU (conversion factor 0.60) comparable with the value, obtained via official density method, for STY13-AF (13.9 ± 0.2% v/v; Table 2). This latter value was also in agreement with data suggested by enologists (13.5–14.5%) for allowing an ideal phenolic maturation and a lower production of astringent tannins.
Values of pH for STY13-MU averaged 3.18 ± 0.03, within the range pH 2.80–3.80, typical for Tuscany musts and dry red wines. The pH value of must influences the speed of fermentation kinetics, through the speed of yeast re-production. The pH value changed from 3.29 ± 0.02 to 3.42 ± 0.02 passing from STY13-AF to STY13-MF, while the total acidity (titratable, TAC) values changed from 6.9 ± 0.3 to 5.7 ± 0.1 gTAA/L. Regarding AF and SGTY13-MF samples, pH and TAC values did not change signifi-cantly 3.20 ± 0.02 and 3.22 ± 0.01, and 6.5 ± 0.1 and 6.3 ± 0.2 gTAA/L.
The TAC is a key parameter for high-quality wine production, particularly relevant to flavor preservation properties upon time elapsing. It is mostly due to tartaric, malic, citric, and lactic acids, ranging usually between 3.5–15.0 gTAA/L [38]. The analyzed wines revealed fresh/ fragrant taste in agreement with TAC values of 5.7 ± 0.1–6.9 ± 0.3 gTAA/L, guaranteeing good lasting flavor
and nice self-preservation. Moreover, TAC and VAC pa-rameters (wine samples) did not reveal any starting of acetic fermentation process, VAC values being 304 ± 20 and 349 ± 41 mgACA/L, for STY13-AF and SGTY13-AF, re-spectively. It is well known that volatile acidity for wine is due to the overall fatty acids from the acetic series that mainly form at the beginning of fermentation process as metabolites of Acetobacter and Gluconobacter species and
from poor wine-making procedures [25, 39]. Total SO2
content (TSO2) was low, ranging from 21.8 ± 1.5 to
66.3 ± 7.1 mgSO2/L, in agreement with present market
re-quirements. In fact, good grape quality and wine-making practices did not require any chemical addition of sulfur dioxide to must or wine.
It is finally, well known that high alcohol contents (ALC) protect against the formation of undesired microorganisms. The study wine samples showed relatively high ALC values, in agreement with other Chianti wines (average 14.2 ± 0.2% v/v, 2013 and 2015 wine samples).
3.2. Antioxidant Parameters in Wine Samples and Copper(II)/ Yeast Derivative Influence. The contents of trans-resveratrol
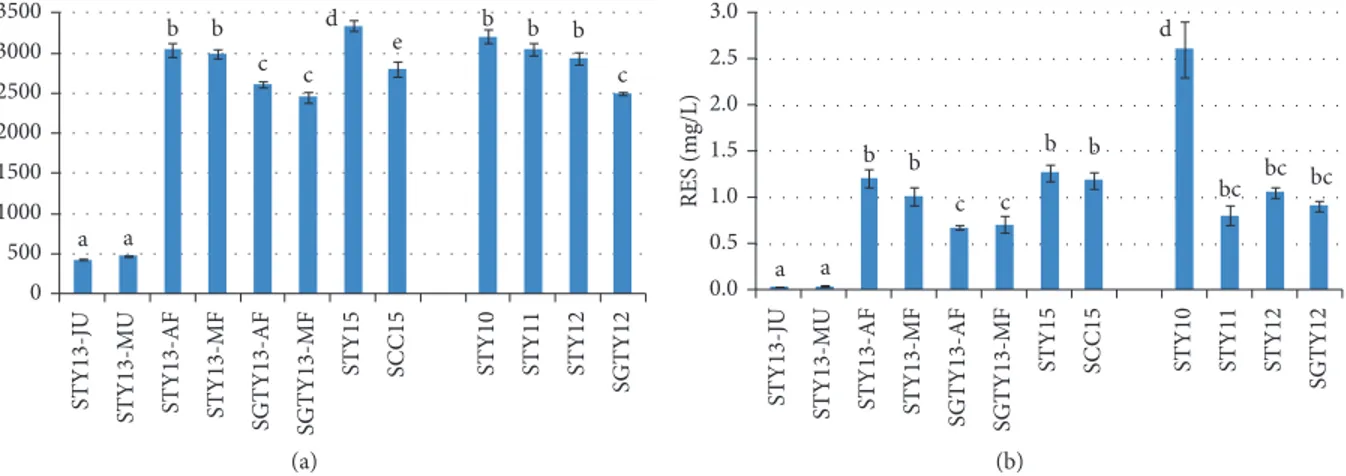
(RES), quercetin (QUE), and quercetin glucoside (QUEG), together with the total polyphenols content (TPP), wine shade (HUE), and color index (CI), were analyzed (Table 3 and Figure 1). Data for RES in wines ranged from 0.67 ± 0.02 to 1.26 ± 0.09 mg/L, showing no statistically significant discrepancies between values found for STY13-AF and SGTY13-MF samples (for same type of wine) and being in agreement with the values previously reported [29, 30, 40]. Interestingly, the values of RES in JU and MU samples were much lower than for the wine samples (0.024 ± 0.002 and 0.032 ± 0.008 mg/L, respectively; not statistically dif-ferent on the basis of Tukey’s test); instead, the content for SE and SK samples was 0.32 ± 0.01 and 10.5 ± 0.1 mg/kg, the last being comparable to data from other Sangiovese grapes (7.3 ± 0.2 mg/kg; [32]). As regards the wine samples, RES values for STY13-MF and SGTY13-MF were 1.0 ± 0.1 and 0.70 ± 0.09 mg/L, respectively (Tukey’s test, p < 0.05), showing a ratio between the two wines, of 1.43, in agreement with the TPP ratio (1.22).
Attention was then devoted to investigate the possible influence of yeasts derivatives and/or copper(II) additions on refining wines. The study was carried out on certain SCCY15 samples that underwent addition of yeast
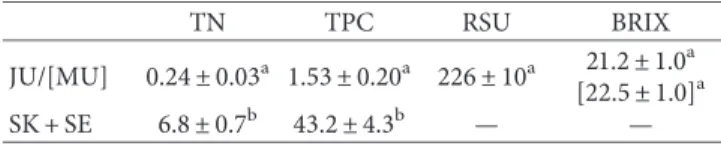
Table 1: Selected parameters for STY13 in grape juice (JU), skin (SK), seeds (SE), and must (MU).
TN TPC RSU BRIX
JU/[MU] 0.24 ± 0.03a 1.53 ± 0.20a 226 ± 10a 21.2 ± 1.0a
[22.5 ± 1.0]a
SK + SE 6.8 ± 0.7b 43.2 ± 4.3b — —
TN, total nitrogen expressed as gN/kg; TPC, total protein content expressed as gALA/kg (alanine equivalent); RSU, reducing sugars expressed as gGLU/ kg (glucose equivalent). Values (mean ± esd) obtained from three samples and three replicates each sample. Different letters in the same column indicate significant differences (p < 0.05, Tukey’s test). Full experimental data sets are reported in Table 1S.
derivatives (allowed by EU regulations [43], see Experi-mental), sixty days before analyses. The analytical results did not show any statistically significant change, in terms of RES
values, that resulted to be 1.16± 0.05 and 1.24 ± 0.10 mg/L
for SCCY15 + BB and SCCY15 + EGSH samples, with
re-spect 1.18± 0.09 mg/L for original SCCY15 (Table 4 and
Figure 1(b); Tukey’s test, p< 0.05 for all data sets).
Fur-thermore, to test the effect of the Cu(II) ions on RES and other antioxidant parameters, aliquots of SCCY15 wines (7 samples, in triplicate) were treated by adding excess Cu(II)
sulfate (5 mgCu/L; incubation 21± 2°C, 60 days). Also, in
these cases, the results did not show any quenching of
trans-Table2: Selected fermentation parameters in STY13 and SGTY13 wine samples at different wine-making stages and STY15 and SCCY15
refined wines.
pH TAC VAC TSO2 VSO2 ALC
STY13-JU 3.13± 0.02a 6.5± 0.4a 279± 15a 21.9± 1.5a 10.8± 0.5a — STY13-MU 3.18± 0.03a 6.4± 0.4a 273± 15a 21.8± 1.5a 10.7± 0.5a — STY13-AF 3.29± 0.02b 6.9± 0.3a 304± 20a 60.7± 3.4b 44.0± 2.3b 13.9± 0.2a STY13-MF 3.42± 0.02c 5.7± 0.2a 450± 30b 41.0± 1.6c 31.0± 1.6c 14.1± 0.2a SGTY13-AF 3.20± 0.02a 6.5± 0.1a 349± 41c 42.1± 1.0c 31.0± 1.0c 13.6± 0.1a SGTY13-MF 3.22± 0.02a 6.3± 0.2a 380± 40c 39.0± 1.2c 27.0± 1.0c 14.6± 0.1a STY15 3.43± 0.03c 5.9± 0.3a 440± 30b 66.0± 3.3b 12.0± 1.0a 14.4± 0.1a SCCY15 3.39± 0.03c 5.9± 0.2a 470± 30b 66.3± 7.1b 14.0± 2.2a 14.4± 0.1a Reference [38] — >3.5 1500 150 — 15
TAC, total or titratable acidity content expressed as gTAA/L (tartaric acid equivalent); VAC, volatile acidity content expressed as gACA/L (acetic acid equivalent); VSO2, free or volatile sulfur dioxide content; TSO2, total sulfur dioxide content both expressed as mgSO2/L; ALC, alcoholic content percentage (% v/v). Values (mean± esd) obtained from three samples and three replicates each sample. Different letters in the same column indicate significant differences (p< 0.05, Tukey’s test). Full experimental data sets are reported in Table 2S.
Table3: Contents of selected antioxidant indicators in STY13 and SGTY13 wine samples at different wine-making stages and STY15 and
SCCY15 refined wines.
TPP RES HUE CI STY13-JU 420± 10a 0.024± 0.002a — — STY13-MU 462± 13a 0.032± 0.008a 1.06± 0.02a 3.97± 0.20a STY13-AF 3033± 90b 1.2± 0.1b 0.77± 0.02b 10.80± 0.32b STY13-MF 2982± 52b 1.0± 0.1b 0.92± 0.04a 11.70± 1.47b SGTY13-AF 2597± 37c 0.67± 0.02c 1.02± 0.07a 9.25± 0.05c SGTY13-MF 2441± 70c 0.70± 0.09c 0.83± 0.01b 10.55± 1.14b STY15 3334± 60d 1.26± 0.09b 0.95± 0.06a 8.20± 0.03d SCCY15 2786± 95e 1.18± 0.09b 0.90± 0.09a 7.11± 0.15e Reference 1100–2700 [40]1200–1500 [41] 0.4–2.6 [40]— 0.63–1.1 [41]— 7.2–12.04 [42]—
TPP, total polyphenols content expressed as mgGAA/L (gallic acid equivalent); RES, trans-resveratrol content expressed as mg/L; HUE, wine shade; CI, color index. Values (mean± esd) obtained from three samples and three replicates each sample. Different letters in the same column indicate significant differences (p< 0.05, Tukey’s test). Full experimental data sets are reported in Table 3S.
0 500 1000 1500 2000 2500 3000 3500 TPP (mg(GAA)/L) a b b c c d e b b b c a STY13-MU STY13-AF
STY15 SCC15 STY10 STY11 STY12 SGTY12 STY13-MF SGTY13-AF SGTY13-MF STY13-JU (a) 0.0 0.5 1.0 1.5 2.0 2.5 3.0 RES (mg/L) a b b c c d bc a b b bc bc STY13-MU STY13-AF
STY15 SCC15 STY10 STY11 STY12 SGTY12 STY13-MF SGTY13-AF
SGTY13-MF
STY13-JU
(b)
Figure1: The content of (a) total polyphenols (TPP, mgGAA/L) and (b) trans-resveratrol (RES, mg/L) in grapes and wines samples. Values
(mean± esd) obtained from three samples and three replicates each sample, different letters indicate significant differences (p < 0.05, Tukey’s
resveratrol for SCCY15 + Cu(II), 1.24± 0.09 mg/L, neither in case of addition of both copper(II) and yeasts derivatives and also tannins (Table 4). Also, the effect of Cu(II) on TPP values was tested, not showing any influence as well
(i.e., 2786± 95 and 2762 ± 131 mgGAA/L for SCCY15 and
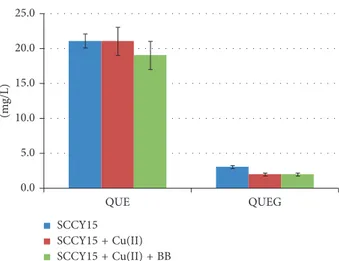
SCCY15 + Cu(II), respectively; not statistically different on the basis of Tukey’s test). Then, the investigation was ex-tended to quercetin (QUE) and quercetin-O-3′-glucoside (QUEG) components both in absence and in presence of copper(II) and yeast derivatives. These molecules belong to the flavonoids family and show a great antioxidant activity, reducing the risk of cardiovascular diseases and cancers [44] and a potential synergic effect with trans-resveratrol [32].
The contents of QUE and QUEG in SCCY15 wine samples
were 21± 2 and 3.0 ± 0.2 mg/L (Figure 2). These analytes also
did not reveal any influence by addition of copper(II) or yeasts
(i.e., SCCY15 + Cu(II) : QUE 21± 2 mg/L and QUEG
2.0± 0.2 mg/L; SCCY15 + Cu(II)+BB : QUE 19 ± 2 mg/L and
QUEG 2.0± 0.2 mg/L; not statistically different on the basis of
Tukey’s test). Wine sample STY15 had RES, QUE, and QUEG
values of 1.26± 0.09, 18 ± 2, and 2.0 ± 0.2 mg/L, respectively, in
agreement with values just mentioned above and previously reported in the literature [32]. Therefore, one can conclude that Cu(II) and tested yeasts derivatives did not quench appreciably RES, QUE, QUEG, and TPP.
The data for wine shade (HUE) and color index (CI)
were in the range of 0.77± 0.02–1.02 ± 0.07 and
7.11± 0.15–11.70 ± 1.47, respectively, and agreed with values
previously reported for other red wines [41, 42]. These parameters are characteristics of the wines components, the absorbance at 520 nm being mainly due to the anthocyanins content; the absorbance at 420 nm, mainly due to tannins content; and the absorbance at 620 nm, typical of oxidized polyphenols [25].
It has to be noted that TPP values for STY13/15 and
SCCY15 (range 3334± 60–2786 ± 95 mgGAA/L) resulted to
be higher with respect to the values previous reported in selected papers [40, 41]. The values found for STY13-JU and -MU were much lower than those for corresponding wines, as polyphenols are more abundant in grape skins that stay (several days) in contact with must, during the initial steps of the alcoholic fermentation process. The difference on TPP from STY13-AF to STY13-MF samples was not statistically significant (Tukey’s test). The TPP contents for SGTY13-AF
and SGTY13-MF samples resulted to be 16% (average) lower than corresponding values for STY13, and this can be explained through the difference of vines aging, SGTY13 being 6 years younger, and with STY15 and SCCY15 (taking
into account the SCC blend nature and age of 14± 3 years).
This value are also in agreement with ANT values for refined
wines (241± 10 and 197 ± 7 mgMVG/L for STY15 and
SCCY15, respectively; Tukey’s test, p< 0.05) and slightly
higher than other bottled red wines (ca. 130 mgMVG/L; [31]). The higher TPP and ANT values for final products showed that the vine variety, the terroir (soil, climate, solar irradiation, etc.) and wine-making procedures guaranteed great quality products, with possible high antioxidant potentials.
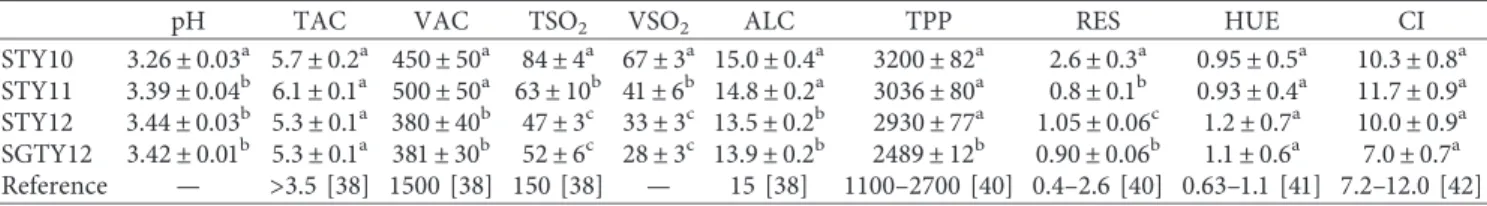
3.3. Analysis of Refined Bottled Wines. For comparison
pur-poses and to estimate the analytical parameters in final mar-ketable products, refined bottled wines were analyzed (STY10, STY11, STY12, and SGTY12) and reported in Table 5. The data confirmed that SGT12 samples had lower values for RES
(0.90± 0.06 mg/L) and TPP (2489 ± 12 mgGAA/L) when
com-pared with STY12 (1.05± 0.06 mg/L and 2930 ± 77mgGAA/L),
in agreement with a lower age of vines (11 and 5 years). It is noteworthy that the values for RES and TPP for the year 2010
(2.6± 0.3 mg/L and 3200± 82 mgGAA/L) were significantly
higher than those for all the other samples. This might be at-tributed to the climate for the year 2010 that was particularly rainy and highly humid (source: LaMMA DataBase 2018), in-ducing vines to overproduce polyphenols to counteract plant diseases.
4. Conclusion
This work brought about data relevant to the content of several analytes of grapes (juice and must) and wines after
Table4: Values for RES (mg/L) in SCCY15 refined bottled wine
and treated samples (incubation: 60 days, 21± 2°C, hermetically
sealed, dark).
Sample (+added species) RES
SCCY15 1.18± 0.09
SCCY15 + Cu(II) 1.24± 0.09
SCCY15 + BB 1.16± 0.05
SCCY15 + Cu(II) + BB 1.15± 0.08
SCCY15 + EGSH 1.24± 0.10
SCCY15 + Cu(II) + EGSH 1.12± 0.04
SCCY15 + Cu(II) + BB + EGSH + TAN 1.22± 0.05
Values (mean± esd) obtained from three samples and three replicates each sample. The data resulted data were not statistically different (Tukey’s test). Full experimental data sets are reported in Table 4S.
0.0 5.0 10.0 15.0 20.0 25.0 QUE QUEG (mg/L) SCCY15 SCCY15 + Cu(II) SCCY15 + Cu(II) + BB
Figure 2: Contents of quercetin (QUE, mg/L) and quercetin
glucoside (QUEG, mg/L) for SCCY15 wine samples before and after additions of Cu(II) and selected yeast derivatives (BB,
Bˆatonnage body). Values (mean± esd) obtained from three
sam-ples and three replicates each sample. Each set of data (QUE and QUEG) was not statistically different (Tukey’s test). Full experi-mental data sets are reported in Table 5S.
alcoholic and malolactic fermentations, produced from the harvests during 2010–2013 and 2015. In conclusion, the following points were stated:
(a) The choice of wine-making protocol allowed the production of high quality wines, as confirmed by antioxidant parameters. The contents of total poly-phenols resulted to be significantly higher than those reported for other red wines.
(b) The optimization of an analytical protocol, based on a calibration via standard additions, allowed to reveal the contents of trans-resveratrol in Sangiovese grapes and wines (LOQ, 0.3 mg/L), overcoming the recent claims that this variety does not contain appreciable amounts of the stilbene [45].
(c) The wines also revealed high quercetin contents (ca. 20 mg/L), suggesting a significant contribution to the overall health benefits from human consumption [46–49]. The work by Ramos-Pineda et al. [49] was related to astringency caused by the content of quercetin glucoside; the concentration of ca. 40 mg/L was estimated as threshold value to perceive as-tringency taste [49]. In case the effect generated by quercetin was equivalent to that estimated for its glucoside derivative, it is evident that values found in the wines from the present work were much below the threshold (QUE + QUEG < 25 mg/L). Also, it has to be noted that Sangiovese wines from nearby areas have usually strong bouquet that attenuates un-pleasant smell/taste [50]. In addition, high alcohol content (ca. 14%) helps smoothness and possibly attenuates astringency.
(d) It has to be also emphasized that the contents of quercetin and quercetin glucoside did not represent a risk for wine organoleptic properties, because of the formation of deposits and haziness, due to pre-cipitation of quercetin. This possible event is excluded in the present wine samples, as the total QUE + QUEG value is below their solubility in wine matrix. (e) Points (a)–(d) constitute the main goal of the
work—the study of possible effects of copper(II) and fermentation yeast derivatives on the contents of antioxidants in real wine—reliable and significant. The work showed that the administration of copper(II) and/or yeast derivatives to vines/grapes, as allowed by
regulation for organic cultivations, does not affect the content of antioxidant species. It can be noted that the matter of copper in wine, even though white ones, was widely studied [51–54], but it was always aimed to study the mechanisms of sulfides removal, relevant to model wine systems, and never to study the possible effects by the metal on the contents of polyphenols in general, and particularly of resveratrol, quercetin, and quercetin glucoside in the real wine matrix.
Data Availability
The analytical data used to support the findings of this study are included within the article, and the values of the triplicate analytical determinations for each replicate and three rep-licates are included within the supplementary information file.
Disclosure
Renzo Cini former full professor at Department of Bio-technology, Chemistry and Pharmacy, actually retired.
Conflicts of Interest
The authors declare that they have no conflicts of interest.
Acknowledgments
The authors thank Rocca di Castagnoli (Gaiole in Chianti, Siena, Italy) wine-maker farm for grapes and wines samples. The authors also gratefully acknowledge the Department of Biotechnology Chemistry and Pharmacy (Department of Excellence 2018–2022, University of Siena) and the CSGI (Centre for Colloid and Surface Science) for supporting the research and Dr Zeno Tabani for some experimental determinations.
Supplementary Materials
Values of the three determinations for each replicate and three replicates (samples/extracts) for the analytical param-eters in grapes and wines at different wine-making stages are reported: total nitrogen (Table 1Sa), total protein content (Table 1Sb), reducing sugar concentration (Table 1Sc), total sugar content (Table 1Sd), pH values (Table 2Sa), total acidity content (Table 2Sb), volatile acidity content (Table 2Sc), total
Table 5: Selected fermentation parameters and antioxidant indicators in STY10, STY11, STY12, and SGTY12 bottled wine samples.
pH TAC VAC TSO2 VSO2 ALC TPP RES HUE CI
STY10 3.26 ± 0.03a 5.7 ± 0.2a 450 ± 50a 84 ± 4a 67 ± 3a 15.0 ± 0.4a 3200 ± 82a 2.6 ± 0.3a 0.95 ± 0.5a 10.3 ± 0.8a
STY11 3.39 ± 0.04b 6.1 ± 0.1a 500 ± 50a 63 ± 10b 41 ± 6b 14.8 ± 0.2a 3036 ± 80a 0.8 ± 0.1b 0.93 ± 0.4a 11.7 ± 0.9a
STY12 3.44 ± 0.03b 5.3 ± 0.1a 380 ± 40b 47 ± 3c 33 ± 3c 13.5 ± 0.2b 2930 ± 77a 1.05 ± 0.06c 1.2 ± 0.7a 10.0 ± 0.9a
SGTY12 3.42 ± 0.01b 5.3 ± 0.1a 381 ± 30b 52 ± 6c 28 ± 3c 13.9 ± 0.2b 2489 ± 12b 0.90 ± 0.06b 1.1 ± 0.6a 7.0 ± 0.7a
Reference — >3.5 [38] 1500 [38] 150 [38] — 15 [38] 1100–2700 [40] 0.4–2.6 [40] 0.63–1.1 [41] 7.2–12.0 [42]
TAC, total or titratable acidity content expressed as gTAA/L (tartaric acid equivalent); VAC, volatile acidity content expressed as gACA/L (acetic acid equivalent); VSO2, free or volatile sulfur dioxide content; TSO2, total sulfur dioxide content expressed as gSO2/L; ALC, alcoholic content percentage (% v/v); TPP, total polyphenols content expressed as mgGAA/L (gallic acid equivalent); RES, trans-resveratrol content expressed as mg/L; HUE, wine shade; CI, color index. Values (mean ± esd) obtained from three samples and three replicates each sample. Different letters in the same column indicate significant differences (p < 0.05, Tukey’s test).
sulfur dioxide content (Table 2Sd), volatile sulfur dioxide content (Table 2Se), alcohol content percentage (Table 2Sf), total polyphenol content (Table 3Sa), total anthocyanin content (Table 3Sb), trans-resveratrol content (Table 3Sc), quercetin content (Table 3Sd), quercetin glucoside content (Table 3Se), wine shade and color index values (Table 3Sg), and relevant absorbance values (Table 3Sf). Tables 4S and 5S report the contents of trans-resveratrol, quercetin, quercetin glucoside (QUEG, mg/L), and total polyphenols (TPP, mgGAA/L) contents in refined and bottled wine samples (harvesting 2015) and the corresponding samples treated with excess copper(II) and/or yeasts derivatives and incubated for
60 d at 21 ± 2°C (dark, hermetically sealed). (Supplementary
Materials)
References
[1] R. S. Jackson, Wine Science, Principles and Applications, Academic Press, Burlington, MA, USA, 4th edition, 2014. [2] G. Tamasi, A. Donati, G. Leone et al., “Grappa quality from
the Chianti and Montepulciano AREAS (Tuscany, Italy): monitoring the leaching of copper from distillation columns,”
International Journal of Food Science & Technology, vol. 53,
no. 6, pp. 1558–1565, 2018.
[3] E. Marone, M. Bertocci, F. Boncinelli, and N. Marinelli, “The cost of making wine: a Tuscan case study based on a full cost approach,” Wine Economics and Policy, vol. 6, no. 2, pp. 88–97, 2017.
[4] A. Urso, G. Timpanaro, F. Caracciolo, and L. Cembalo, “Efficiency analysis of Italian wine producers,” Wine
Eco-nomics and Policy, vol. 7, no. 1, pp. 3–12, 2018.
[5] DPR 09 August 1967, Disciplinare di produzione dei vini a denominazione di origine controllata e garantita Chianti e Chianti Classico, Gazzetta Ufficiale 217 (30/08/1967) and subsequent updating DM 30 November 2011 (Chianti) and DM 07 March 2014 (Chianti Classico) published on Mipaaf website.
[6] M. A. G´omez Gallego, E. G´omez Garc´ıa-Carpintero, E. S´anchez-Palomo, M. A. Gonz´alez Viñas, and I. Hermos´ın-Guti´errez, “Evolution of the phenolic content, chromatic characteristics and sensory properties during bottle storage of red single-cultivar wines from Castilla La Mancha region,”
Food Research International, vol. 51, no. 2, pp. 554–563,
2013.
[7] G. Tamasi, C. Bonechi, A. Donati et al., “Analytical and structural investigation via infrared spectroscopy and density functional methods of cuprous complexes of the antioxidant tripeptide glutathione (GSH): synthesis and characterization of a novel Cu I -GSH compound,” Inorganica Chimica Acta, vol. 470, pp. 158–171, 2018.
[8] G. Tamasi, C. Bonechi, C. Rossi, R. Cini, and A. Magnani, “Simulating the active sites of copper-trafficking proteins: density functional structural and spectroscopy studies on copper(I) complexes with thiols, carboxylato, amide and phenol ligands,” Journal of Coordination Chemistry, vol. 69, no. 3, pp. 404–424, 2016.
[9] G. Tamasi, S. Mangani, and R. Cini, “Copper(I)-alkyl sulfide and -cysteine tri-nuclear clusters as models for metallo proteins: a structural density functional analysis,” Journal of
Biomolecular Structure and Dynamics, vol. 30, no. 6,
pp. 728–751, 2012.
[10] M. D. Rivero-P´erez, P. Muñiz, and M. L. Gonz´alez-Sanjos´e, “Contribution of anthocyanin fraction to the antioxidant
properties of wine,” Food and Chemical Toxicology, vol. 46, no. 8, pp. 2815–2822, 2008.
[11] J. Bao and Z. Zhen-Wen, “Comparison on phenolic com-pounds and antioxidant properties of cabernet sauvignon and merlot wines from four wine grape-growing Regions in China,” Molecules, vol. 17, no. 8, pp. 8804–8821, 2012. [12] M. Fernandez-pachon, D. Villaño, M. C. Garcia-Parrilla, and
A. M. Troncoso, “Antioxidant activity of wines and relation with their polyphenolic composition,” Analytica Chimica
Acta, vol. 513, no. 1, pp. 113–118, 2004.
[13] D. Di Majo, M. La Guardia, S. Giammanco, L. La Neve, and M. Giammanco, “The antioxidant capacity of red wine in relationship with its polyphenolic constituents,” Food
Chemistry, vol. 111, no. 1, pp. 45–49, 2008.
[14] J. Dai and R. J. Mumper, “Plant phenolics: extraction, analysis and their antioxidant and anticancer properties,” Molecules, vol. 15, no. 10, pp. 7313–7352, 2010.
[15] E. M. Varoni, A. F. Lo Faro, J. Sharifi-Rad, and M. Iriti, “Anticancer molecular mechanisms of resveratrol,” Frontiers
in Nutrition, vol. 3, pp. 1–15, 2016.
[16] G. Tamasi, A. Merlino, F. Scaletti et al., “{Ru(CO)x}-Core complexes with benzimidazole ligands: synthesis, X-ray structure and evaluation of anticancer activity in vivo,” Dalton
Transactions, vol. 46, no. 9, pp. 3025–3040, 2017.
[17] A. S. Azmi, S. H. Bhat, and S. M. Hadi, “Resveratrol-Cu(II) induced DNA breakage in human peripheral lymphocytes: implications for anticancer properties,” FEBS Letters, vol. 579, no. 14, pp. 3131–3135, 2005.
[18] C. Bonechi, S. Lamponi, A. Donati et al., “Effect of resveratrol on platelet aggregation by fibrinogen protection,” Biophysical
Chemistry, vol. 222, pp. 41–48, 2017.
[19] C. Bonechi, A. Donati, G. Tamasi et al., “Protective effect of quercetin and rutin encapsulated liposomes on induced ox-idative stress,” Biophysical Chemistry, vol. 233, pp. 55–63, 2018.
[20] R. F. Pastor, P. Restani, C. Di Lorenzo et al., “Resveratrol, human health and winemaking perspectives,” Critical Reviews
in Food Science and Nutrition, vol. 5, pp. 1–19, 2017.
[21] Z. Rasines-Perea and P.-L. Teissedre, “Grape polyphenols’ effects in human cardiovascular diseases and diabetes,”
Molecules, vol. 22, no. 1, pp. E68–E87, 2017.
[22] A. Esteban-Fern´andez, I. Zorraqu´ın-Peña, M. D. Ferrer et al., “Inhibition of oral pathogens adhesion to human gingival fibroblasts by wine polyphenols alone and in combination with an oral probiotic,” Journal of Agricultural and Food
Chemistry, vol. 66, no. 9, pp. 2071–2082, 2018.
[23] G. Leone, M. Consumi, S. Pepi et al., “New formulations to enhance lovastatin release from red yeast rice (RYR),” Journal
of Drug Delivery Science and Technology, vol. 36, pp. 110–119,
2016.
[24] International Organization of Vine and Wine (OIV),
Com-pendiumof International Methods of Wine and Must Analysis,
Vol. 1-2, OIV, Paris, France, 2018.
[25] B. W. Zoecklein, K. C. Fugelsang, B. H. Gump, and F. S. Nury,
Wine Analysis and Production, Springer Nature Customer
Service Center LLC, New York, NY, USA, 1999.
[26] L. Babincev, D. Guresic, and R. Simonovic, “Spectrophoto-metric characterization of red wine color from the vineyard region of Metohia,” Journal of Agricultural Sciences, Belgrade, vol. 61, no. 3, pp. 281–290, 2016.
[27] Y. Glories, “La couleur des vins rouges. lre partie: les ´equilibres des anthocyanes et des tanins,” OENO One, vol. 18, no. 3, pp. 195–217, 1984.
[28] Y. Glories, “La couleur des vins rouges. 2e partie: mesure, origine et interpr´etation,” OENO One, vol. 18, no. 4, pp. 253–271, 1984.
[29] M. N. Bravo, S. Silva, A. V. Coelho, L. Vilas Boas, and M. R. Bronze, “Analysis of phenolic compounds in muscatel wines produced in Portugal,” Analytica Chimica Acta, vol. 563, no. 1-2, pp. 84–92, 2006.
[30] M. ˇSeruga, I. Novak, and L. Jakobek, “Determination of polyphenols content and antioxidant activity of some red wines by differential pulse voltammetry, HPLC and spec-trophotometric methods,” Food Chemistry, vol. 124, no. 3, pp. 1208–1216, 2011.
[31] J. Bakker, N. W. Preston, and C. F. Timberlake, “The de-termination of anthocyanins in aging red wines: comparison of HPLC and spectral methods,” American Journal of Enology
and Viticulture, vol. 37, no. 2, pp. 121–126, 1986.
[32] P. Iacopini, M. Baldi, P. Storchi, and L. Sebastiani, “Catechin, epicatechin, quercetin, rutin and resveratrol in red grape: content, in vitro antioxidant activity and interactions,”
Journal of Food Composition and Analysis, vol. 21, no. 8,
pp. 589–598, 2008.
[33] G. Tamasi, M. Cambi, N. Gaggelli, A. Autino, M. Cresti, and R. Cini, “The content of selected minerals and vitamin C for potatoes (Solanum tuberosum L) from the high Tiber Valley area, southeast Tuscany,” Journal of Food Composition and
Analysis, vol. 41, pp. 157–164, 2015.
[34] P. Steliopoulos, “Extension of the standard addition method by blank addition,” MethodsX, vol. 2, pp. 353–359, 2015. [35] A. Guti´errez, R. Chiva, M. Sancho, G. Beltran, F. N.
Arroyo-L´opez, and J. M. Guillamon, “Nitrogen requirements of commercial wine yeast strains during fermentation of a synthetic grape must,” Food Microbiology, vol. 31, no. 1, pp. 25–32, 2012.
[36] N. Moreira, P. Guedes de Pinho, C. Santos, and I. Vasconcelos, “Relationship between nitrogen content in grapes and volatiles, namely heavy sulphur compounds, in wine,” Food Chemistry, vol. 126, no. 4, pp. 1599–1607, 2011. [37] H.-F. Liu, B.-H. Wu, P.-G. Fan, S.-H. Li, and L.-S. Li, “Sugar and acid concentrations in 98 grape cultivars analyzed by principal component analysis,” Journal of the Science of Food
and Agriculture, vol. 86, no. 10, pp. 1526–1536, 2006.
[38] Council Regulation EC. No. 1493/1999 on the common or-ganization of the market in wine.
[39] R. P. Vine, E. M. Harkness, and S. J. Linton, Wine Making
from Grape Growing to Marketplace, Springer Science +
Business Media, Inc., New York, NY, USA, 2nd edition, 2002. [40] V. Rastjia, G. Sreˇcnik, and M. Medi´c-Sari´c, “Polyphenolic composition of croatian wines with different geographical origins,” Food Chemistry, vol. 115, no. 1, pp. 54–60, 2009. [41] G. Gonzalez-Nevez, G. Favre, and G. Gil, “Effect of fining on
the colour and pigment compositions of young red wines,”
Food Chemistry, vol. 157, pp. 385–392, 2014.
[42] Z. Czibulya, I. Horv´ath, L. Kuns´agi-M´at´e, and S. Kunsagi-Mat`e, “Unexpected effect of potassium ions on the copig-mentation in red wines,” Food Research International, vol. 45, no. 1, pp. 272–276, 2012.
[43] Commission Regulation EC. No. 606/2009 laying down certain detailed rules for implementing Council Regulation No. 479/2008 as regards the categories of grapevine products, oenological practices and the applicable restrictions. [44] K. Griffiths, B. B. Aggarwal, R. B. Singh, H. S. Buttar, D. Wilson,
and F. De Meester, “Food antioxidants and their anti-inflammatory properties: a potential role in cardiovascular
diseases and cancer prevention,” Diseases, vol. 4, no. 4, pp. 28–42, 2016.
[45] M. M. Panteli´c, D. C. Dabi´c Zagorac, S. M. Davidovi´c et al., “Identification and quantification of phenolic compounds in berry skin, pulp, and seeds in 13 grapevine varieties grown in Serbia,” Food Chemistry, vol. 211, pp. 243–252, 2016. [46] G. Carullo, M. T. Badolato, and F. Aiello, “Bioavailability and
biochemistry of quercetin and applications to health and disease,” in Polyphenols: Mechanisms of Action in Human
Health and Disease, Chapter 26, pp. 361-371, 2018, 2nd
edition, 2018.
[47] R. V. Patel, B. M. Mistry, S. K. Shinde, R. Syed, V. Singh, and H.-S. Shin, “Therapeutic potential of quercetin as a cardio-vascular agent,” European Journal of Medicinal Chemistry, vol. 155, pp. 889–904, 2018.
[48] T. M. C. Belmiro, C. F. Pereira, and A. P. S. Paim, “Red wines from South America: content of phenolic compounds and chemometric distinction by origin,” Microchemical Journal, vol. 133, pp. 114–120, 2017.
[49] A. M. Ramos-Pineda, I. Garc´ıa-Est´evez, M. Dueñas, and M. T. Escribano-Bail´on, “Effect of the addition of man-noproteins on the interaction between wine flavonols and salivary proteins,” Food Chemistry, vol. 264, pp. 226–232, 2018.
[50] G. Tamasi, N. F. Owens, F. Cascella, M. Cerqua, and R. Cini, “A case study of selected volatile phenols from brettanomyces and micronutrients Mn, Fe, Cu, Zn in Chianti red wines,”
Journal of Food Research, vol. 2, no. 1, pp. 31–40, 2013.
[51] A. C. Clark, E. N. Wilkes, and G. R. Scollary, “Chemistry of copper in white wine: a review,” Australian Journal of Grape
and Wine Research, vol. 21, no. 3, pp. 339–350, 2015.
[52] N. Kontoudakis, A. Mierczynska-Vasilev, A. Guo et al., “Removal of sulfide-bound copper from white wine by membrane filtration,” Australian Journal of Grape and Wine
Research, vol. 25, no. 1, pp. 53–61, 2018.
[53] A. C. Clark, P. Grant-Preece, N. Cleghorn, and G. R. Scollary, “Copper(II) addition to white wines containing hydrogen sulfide: residual copper concentration and activity,”
Austra-lian Journal of Grape and Wine Research, vol. 21, no. 1,
pp. 30–39, 2015.
[54] N. Kontoudakis, M. Smith, A. Guo et al., “The impact of wine components on fractionation of Cu and Fe in model wine systems: macromolecules, phenolic and sulfur compounds,”
Tribology
Advances in Hindawi www.hindawi.com Volume 2018 Hindawi www.hindawi.com Volume 2018International Journal ofInternational Journal of
Photoenergy
Hindawi www.hindawi.com Volume 2018 Journal ofChemistry
Hindawi www.hindawi.com Volume 2018 Advances inPhysical Chemistry
Hindawi www.hindawi.com Analytical Methods in Chemistry Journal of Volume 2018 Bioinorganic Chemistry and Applications Hindawi www.hindawi.com Volume 2018Spectroscopy
International Journal ofHindawi
www.hindawi.com Volume 2018
Hindawi Publishing Corporation
http://www.hindawi.com Volume 2013 Hindawi www.hindawi.com
The Scientific
World Journal
Volume 2018Medicinal ChemistryInternational Journal of
Hindawi www.hindawi.com Volume 2018
Nanotechnology
Hindawi www.hindawi.com Volume 2018 Journal ofApplied Chemistry
Journal of Hindawi www.hindawi.com Volume 2018 Hindawi www.hindawi.com Volume 2018 Biochemistry Research International Hindawi www.hindawi.com Volume 2018Enzyme
Research
Hindawi www.hindawi.com Volume 2018 Journal ofSpectroscopy
Analytical Chemistry International Journal of Hindawi www.hindawi.com Volume 2018Materials
Journal of Hindawi www.hindawi.com Volume 2018 Hindawi www.hindawi.com Volume 2018 BioMedResearch International
Electrochemistry
International Journal of Hindawi www.hindawi.com Volume 2018