Environmental Research Letters
LETTER • OPEN ACCESS
Variability of particulate organic carbon in inland
waters observed from MODIS Aqua imagery
To cite this article: Hongtao Duan et al 2014 Environ. Res. Lett. 9 084011View the article online for updates and enhancements.
Recent citations
Using VIIRS/NPP and MODIS/Aqua data to provide a continuous record of suspended particulate matter in a highly turbid inland lake
Zhigang Cao et al
-Determination of the Downwelling Diffuse Attenuation Coefficient of Lake Water with the Sentinel-3A OLCI
Ming Shen et al
-Remote sensing estimation algorithm of diffuse attenuation coefficient applicable to different satellite data in Lake Taihu, China
SHEN Ming et al
-Variability of particulate organic carbon in
inland waters observed from MODIS Aqua
imagery
Hongtao Duan
1, Lian Feng
2, Ronghua Ma
1, Yuchao Zhang
1and
Steven Arthur Loiselle
31
State Key Laboratory of Lake Science and Environment, Nanjing Institute of Geography and Limnology, Chinese Academy of Sciences, Nanjing 210008, People’s Republic of China
2
State Key Laboratory of Information Engineering in Surveying, Mapping and Remote Sensing, Wuhan University, Wuhan 430079, People’s Republic of China
3Dipartimento Farmaco Chimico Tecnologico, CSGI, University of Siena, Siena, Italy
E-mail:[email protected]@gmail.com Received 25 March 2014, revised 7 July 2014 Accepted for publication 21 July 2014 Published 19 August 2014
Abstract
Surface concentrations of particulate organic carbon (POC) in shallow inland lakes were estimated using MODIS Aqua data. A power regression model of the direct empirical
relationship between POC and the atmospherically Rayleigh-corrected MODIS product (Rrc,645 -Rrc,1240)/(Rrc,859-Rrc,1240) was developed (R2= 0.72, RMSE = 35.86μgL−1, p < 0.0001, N = 47) and validated (RMSE = 44.46μgL−1, N = 16) withfield data from 56 lakes in the Middle and Lower reaches of the Yangtze River, China. This algorithm was applied to an 11 year series of MODIS data to determine the spatial and temporal distribution of POC in a wide range of lakes with different trophic and optical properties. The results indicate that there is a general increase in minimum POC concentrations in lakes from middle to lower reaches of the Yangtze River. The temporal dynamics of springtime POC in smaller lakes were found to be influenced by local meteorological conditions, in particular precipitation and wind speed, while larger lakes were found to be more sensitive to air temperature.
Keywords: POC, algorithm, inland lakes, remote sensing, carbon cycling
1. Introduction
Lakes and inland water bodies are active, changing, and important regulators of the carbon cycle and global climate (Tranvik et al 2009). Collectively, nearly half as much organic carbon is buried in lakes globally as in the world’s oceans, and small lakes (<500 km2) account for 60–70% of this total organic carbon (TOC) burial (Alin and John-son2007). Particulate organic carbon (POC) is generally the form of carbon that most readily undergoes sedimentation and in-ecosystem loss. Even though POC is a small fraction of
TOC present in most lakes (with respect to dissolved organic carbon, DOC), it plays an important role in sequestering carbon and associated compounds downward as part of the biological pump (Dhillon and Inamdar2013, Son et al2009). To better explore carbon cycling in the freshwater ecosystems and understand the fate of the main organic components, it is important to quantify POC as well as DOC effectively (Jiang et al2012).
Satellite remote sensing observations provide a suitable means to explore temporal and spatial properties of inland lakes, allowing the possibility of measuring the limnological properties of many lakes simultaneously. Over the last three decades, significant contributions have been made to estimate the concentrations of phytoplankton pigments (e.g. chlor-ophyll a, Chla) using remote sensing (Clark 1981, Duan et al2010, Mittenzwey et al1992). However, the estimate of
Environmental Research Letters Environ. Res. Lett. 9 (2014) 084011 (10pp) doi:10.1088/1748-9326/9/8/084011
Content from this work may be used under the terms of the
Creative Commons Attribution 3.0 licence. Any further distribution of this work must maintain attribution to the author(s) and the title of the work, journal citation and DOI.
total dissolved and particulate carbon presents a larger chal-lenge, as optical properties of these two carbon pools can vary significantly in relation to their sources and sinks. The POC pool, in particular, may contain a wide variety of optically distinct components, from bacteria to macrophyte detritus (Morel and Ahn 1990) while the optical properties of DOC are highly sensitive to degradation processes (Loiselle et al2009).
To better understand the C cycling in surface waters, algorithms have been developed to estimate POC concentra-tions in the open ocean (Gardner et al 2006, Mishonov et al2003, Stramski et al1999). In the first published algo-rithm for estimating POC from remote sensing, a two-step process was based on (Stramski et al 1999): (1) the depen-dence of the backscattering coefficient (bbp) by particles suspended in seawater on the POC concentration; (2) the dependence of the spectral remote-sensing reflectance (Rrs(λ)) on bbp. The resulting correlation was associated to the dom-inance of the biologically produced POC in controlling changes in bbpin open oceans (Gardner et al2006, Legendre and Michaud 1999). There are clear difficulties in applying this to turbid inland waters, where inorganic particles play a more important role in the optical backscattering properties of the water body (Ma et al 2009, Tzortziou et al 2007). Algorithms to estimate POC concentrations in inland waters remain a challenge.
The objective of the present study is to develop an optical algorithm for the retrieval of surface water POC concentra-tions in inland water bodies from satellite imagery. To our knowledge, this is thefirst estimate of POC concentrations in inland lakes using MODIS Aqua data.
2. Study region
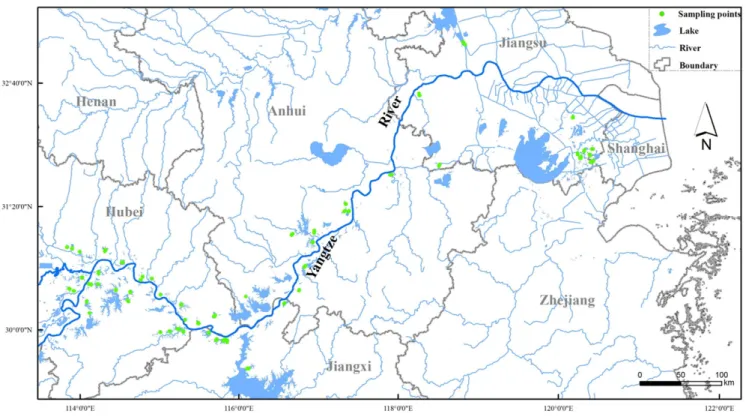
The Yangtze River (known locally as Chang Jiang, or‘Long River’), is the longest river in Asia and third in the world (6300 km). The middle and lower reaches of the Yangtze River (28°50′–33°50′N and 113°30′–121°00′E, figure 1) have a total drainage area of about 8.0 × 10⁴km2 (Chen et al2001) which include some of the most important agri-cultural areas in China. The Middle and Lower Reaches of the Yangtze River basin (MLY) contain 529 lakes (areas ⩾1 km2), accounting for 18.57% of all lakes in China, with
most water bodies (94.52%) less than 50 km2 (Ma
et al2010,2011).
In this study,field measurements were made in 56 lakes and used to develop a POC algorithm for inland water bodies (table 1 and figure 1). These lakes, distributed along the Yangtze River, are subject to various degrees of human impact from agricultural activities as well as effluent disposal from small villages and mega-urban areas, such as Wuhan and Nanjing.
3. Methods 3.1. Field data
Water samples and optical data were collected at 177 stations (3 or 4 stations per lake) by two survey groups using identical methodologies between 7 April and 20 April 2012. The selection of 56 sample lakes was made to be representative of water bodies along the MLY. Access to lakes for multiple sampling along a lake transect was also considered. POC
concentrations were determined by combustion of sample filters through pretreated 47 mm Whatman GF/F filters (6 h at 450 °C) by an EA3000 elemental analyzer. Thefilters were dried at 50 °C for 8 h and then wrapped in aluminum foil. Acidification treatment was performed to remove the carbo-nates from thefilter, after which the filters were dried again and weighed. POC concentrations were measured by com-bustion of sample filters in an EA3000 elemental analyzer
(Biddanda and Benner 1997).Chla concentrations were
extracted using 90% ethanol and measured with a UV2401 spectrophotometer (Duan et al 2012, Gitelson et al 2008). Suspended particulate matter (SPM) concentrations were determined gravimetrically from samples collected on pre-combusted and pre-weighed GF/Ffilters with a diameter of 47 mm, dried at 95 °C overnight. SPM was differentiated into suspended particular inorganic matter (SPIM) and suspended particular organic matter (SPOM) by burning organic matter from thefilters at 550 °C for 3 h and weighing the filters again (Duan et al2012,2014a).
3.2. Satellite data processing
Seven scenes of MODIS Aqua Level-0 (raw digital count) data were obtained from the US NASA Goddard Space Flight Center (GSFC) from 7 April 2012 to 20 April 2012 and therefore consistent with the field sampling. Level-0 data were processed using SeaDAS version 6.0 to generate
calibrated at-sensor radiance. An initial attempt to use Sea-DAS to generate above-water remote-sensing reflectance (Rrs) was unsuccessful. This was due to elevated aerosol con-centrations and sun glint, even after adjusting processing options (e.g., the default limit of aerosol optical thickness at 869 nm was raised from 0.3 to 0.5, the default cloud albedo was raised from 2.7% to 4.0%, etc) (Feng et al2012). Ray-leigh-corrected reflectance Rrc,λ was derived after correction for Rayleigh scattering and gaseous absorption effects as (Hu et al2004):
θ
= × −
λ λ
(
λ)
λRrc, πLt,*/ F0, cos 0 Rr, , (1)
whereλ is the wavelength of the MODIS spectral band, Lt* is the calibrated at-sensor radiance after correction for gaseous absorption, F0is the extraterrestrial solar irradiance,θ0is the solar zenith angle, and Rris the reflectance due to Rayleigh (molecular) scattering estimated using the 6S radiative transfer code. The Rrc data were geo-referenced into a cylindrical equidistance (rectangular) projection.
Concurrent datasets of MODIS reflectance data and in situ POC measurements were made using a time window of ±24 h between MODIS and in situ measurements. To avoid potential influence of patchiness in the optical properties of the measurement, a homogeneity test of the 3 × 3-pixel box centered at the in situ station was performed (note that each MODIS pixel represents 250 m × 250 m). If the variance of
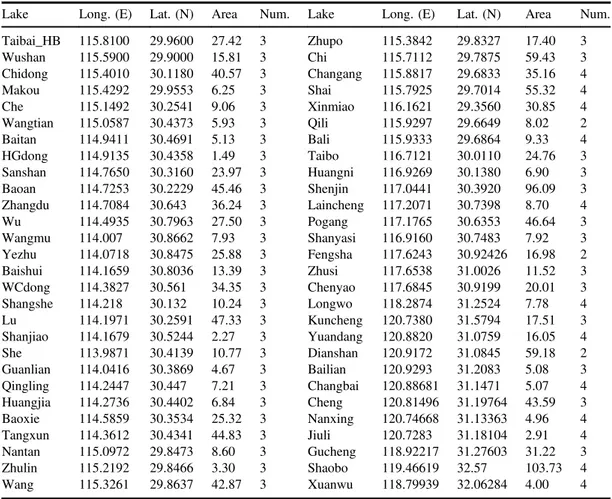
Table 1.Location, area, number of samples taken for each of the 56 lakes along the Yangtze River.
Lake Long. (E) Lat. (N) Area Num. Lake Long. (E) Lat. (N) Area Num.
Taibai_HB 115.8100 29.9600 27.42 3 Zhupo 115.3842 29.8327 17.40 3 Wushan 115.5900 29.9000 15.81 3 Chi 115.7112 29.7875 59.43 3 Chidong 115.4010 30.1180 40.57 3 Changang 115.8817 29.6833 35.16 4 Makou 115.4292 29.9553 6.25 3 Shai 115.7925 29.7014 55.32 4 Che 115.1492 30.2541 9.06 3 Xinmiao 116.1621 29.3560 30.85 4 Wangtian 115.0587 30.4373 5.93 3 Qili 115.9297 29.6649 8.02 2 Baitan 114.9411 30.4691 5.13 3 Bali 115.9333 29.6864 9.33 4 HGdong 114.9135 30.4358 1.49 3 Taibo 116.7121 30.0110 24.76 3 Sanshan 114.7650 30.3160 23.97 3 Huangni 116.9269 30.1380 6.90 3 Baoan 114.7253 30.2229 45.46 3 Shenjin 117.0441 30.3920 96.09 3 Zhangdu 114.7084 30.643 36.24 3 Laincheng 117.2071 30.7398 8.70 4 Wu 114.4935 30.7963 27.50 3 Pogang 117.1765 30.6353 46.64 3 Wangmu 114.007 30.8662 7.93 3 Shanyasi 116.9160 30.7483 7.92 3 Yezhu 114.0718 30.8475 25.88 3 Fengsha 117.6243 30.92426 16.98 2 Baishui 114.1659 30.8036 13.39 3 Zhusi 117.6538 31.0026 11.52 3 WCdong 114.3827 30.561 34.35 3 Chenyao 117.6845 30.9199 20.01 3 Shangshe 114.218 30.132 10.24 3 Longwo 118.2874 31.2524 7.78 4 Lu 114.1971 30.2591 47.33 3 Kuncheng 120.7380 31.5794 17.51 3 Shanjiao 114.1679 30.5244 2.27 3 Yuandang 120.8820 31.0759 16.05 4 She 113.9871 30.4139 10.77 3 Dianshan 120.9172 31.0845 59.18 2 Guanlian 114.0416 30.3869 4.67 3 Bailian 120.9293 31.2083 5.08 3 Qingling 114.2447 30.447 7.21 3 Changbai 120.88681 31.1471 5.07 4 Huangjia 114.2736 30.4402 6.84 3 Cheng 120.81496 31.19764 43.59 3 Baoxie 114.5859 30.3534 25.32 3 Nanxing 120.74668 31.13363 4.96 4 Tangxun 114.3612 30.4341 44.83 3 Jiuli 120.7283 31.18104 2.91 4 Nantan 115.0972 29.8473 8.60 3 Gucheng 118.92217 31.27603 31.22 3 Zhulin 115.2192 29.8466 3.30 3 Shaobo 119.46619 32.57 103.73 4 Wang 115.3261 29.8637 42.87 3 Xuanwu 118.79939 32.06284 4.00 4 3
the 3 × 3 box was >0.4, the corresponding matching pair was discarded from the regression. With this strict quality control criteria, a total of 63 matching pairs were selected. 47 samples (2/3) of this dataset were selected for training, while the other 16 samples were used for the algorithm validation.
The Normalized Difference Vegetation Index (NDVI), defined as (RNIR–RRED)/(RNIR+RRED) was used to distinguish water bodies from surrounding dry soil or vegetation with threshold value set to zero (Haas et al2009, Kaptué Tchuenté et al2011). However, nonwater features in the NDVI image may not be completely eliminated in shallow turbid lakes. A modified NDVI threshold (<−0.05) was used to provide more accurate estimates of lake borders (Ma et al2011).
3.3. Statistical analysis
Daily data of precipitation rate (mm), wind speed (ms−1) and air temperature (°C) were obtained from the China Meteor-ological Data Sharing Service System (http://cdc.cma.gov.cn/
). Distance between lakes was determined using the ‘haver-sine’ formula (Rick 1999). Correlations between POC esti-mates, distance and meteorological data were identified using a linear model where direct correlations (increasing) had positive Pearson correlation coefficients (r) and indirect cor-relations (decreasing) had negative coefficients. A multiple regression of POC estimates with meteorological data was performed using a linear least squaresfitting procedure.
4. Results and discussion 4.1. POC sources in inland waters
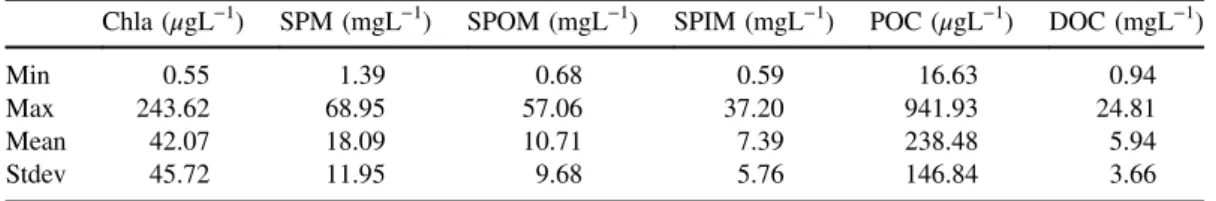
Field data indicated a large variability in the properties of 56 lakes studied, with a 50-fold range in POC (17–942 μgL−1), a 60-fold range in SPM (1.39–68.95 mgL−1), a 400 fold range in Chla (0.55–240 μgL−1) (table 2, figure 2). The average Chla concentration was high, 42μgL−1, as would be expected from an area which includes hyper-eutrophic waterbodies such as Lakes Taihu and Chaohu (Duan et al 2009, Jin et al2012). SPM concentrations were dominated by SPOM, indicating that plankton and resuspended organic matter played an important role (Upsdell, 2005). POC correlated well with SPM (r = 0.88) and SPOM (r = 0.80) (figure3(a)). Generally, the organic content of suspended matter from terrigenous sources can be expected to have a similar organic carbon content (Cauwet and Mackenzie,1993). The correla-tion between POC and Chla (r = 0.27, figure3(b)) was low, indicating that phytoplankton was not the dominant source particulate carbon in these waters. The mean ratio of DOC to
POC concentrations indicated that DOC accounted for 96% of TOC in the study lakes.
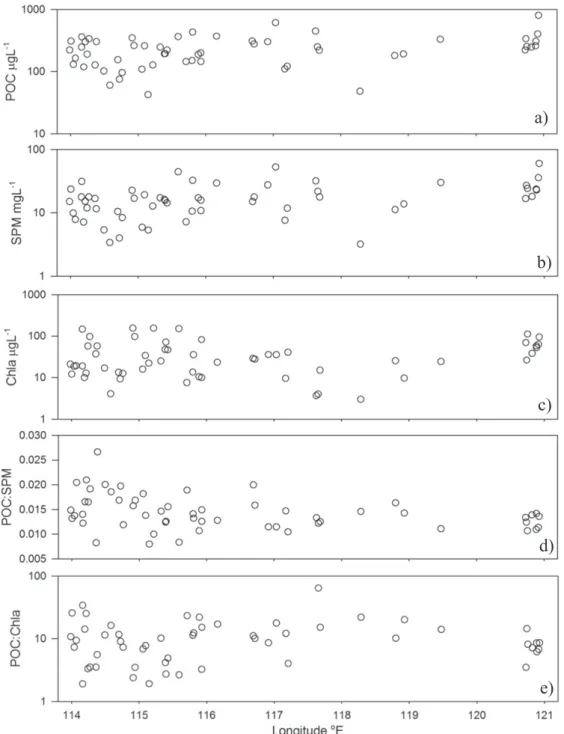
The ratio of POC to SPM (POC%) was used to describe the relative fraction of organic matter composing the sus-pended particulate matter assemblage. The POC:Chla ratio was used to describe the relative proportion of organic material (both living and nonliving) relative to autotrophic organisms. The latter index is also influenced by variations in the intracellular photosynthetic pigment concentrations when diverse water bodies are compared (Loisel and Morel 1998, Vantrepotte et al 2012). POC% ranged between 0.80% and 2.66% (average at 1.44%) (figure2(d)), which is similar to that reported for the Yellow River (0.50%–5.00%) (Zhang et al2012). The POC:Chla ratio of the 56 lakes averaged 13 (0.75–157) (figure2(e)), much smaller than that measured in Yangtze River (48–136) or similar rivers globally (Yellow River: 3988; lower Mississippi River: 256) (Duan and Bian-chi,2006, Zhang et al2012), typical coastal waters (Charente estuary: 232–13 152; English Channel, Southern North Sea and French Guiana: 24–686) (Modéran et al 2012, Van-trepotte et al 2012), or marine waters (20–200) (Cifuentes et al1988).
Freshwater ecosystems receive organic matter from two distinct sources: primary production occurring within the waterbody (autochthonous production) and external loading of terrestrial organic matter from the watershed (allochtho-nous loading) (Prokushkin et al 2011). As the POC con-centrations were well correlated to the concon-centrations of SPM and SPOM but poorly correlated to Chla, the source of POC in many of these lakes was more closely tied to catchment sources or resuspended organic detritus. These lakes were small- to moderate-sized and surrounded by highly productive wetlands and agricultural lands that represent major sources of organic matter loading (Wetzel1984). It should be noted that allochthonous and autochthonous POC sources will vary seasonally, typically with maximum phytoplankton produc-tion in summer and peak allochthonous inputs in the fall (Bianchi and Argyrou1997, Cauwet and Mackenzie1993).
4.2. POC algorithm development
Several POC algorithms have been proposed in the past, including the semi-analytical algorithms based on radiative transfer theory and empirical regression algorithms (Gardner et al 2006, Son et al2009, Stramski et al 1999). However, these algorithms were developed for ocean waters and rely on the dominance of phytoplankton biomass in the total POC concentration (Morel 1988, Pabi and Arrigo 2006). The optical properties of these study lakes were influenced not
Table 2.Water quality characteristics of the 56 lakes studied along the Yangtze River, China. Chla (μgL−1) SPM (mgL−1) SPOM (mgL−1) SPIM (mgL−1) POC (μgL−1) DOC (mgL−1)
Min 0.55 1.39 0.68 0.59 16.63 0.94
Max 243.62 68.95 57.06 37.20 941.93 24.81
Mean 42.07 18.09 10.71 7.39 238.48 5.94
only by phytoplankton and related (co-varying) particles, but also by inorganic particles and organic detritus (Duan et al 2014a, IOCCG 2000). Hence, new algorithms were required for these more complex optical conditions and multiple POC sources.
As typical ocean bands often saturate over turbid lake waters, an approach using MODIS land bands to determine Rrc,λ was developed. Regressions between in situ POC and single-band Rrc,λ showed a very poor correlation (r < 0.4), suggesting that aerosol contributions could not be ignored. In
addition to the single-band algorithms, simple band-ratios were also explored but did not provide strong correlations.
Aerosol contributions to the satellite signal vary spatially along the Yangtze River (He et al2010). Water reflectance at 1240 nm is virtually null in coastal and inland waters (Hu et al 2000). Assuming spectrally consistent but spatially variable impacts of aerosols, reflectance bands were corrected for aerosols using Rrc,1240(Feng et al 2012). For the atmo-spherically corrected data, (Rrc,645–Rrc,1240)/(Rrc,859–Rrc,1240) showed the best relationship with POC concentrations
Figure 2.Characteristics of suspended particulate matter measured on surface samples in 56 lakes along the Yangtze River, China. From top to the bottom, the graphs show the concentration of particulate organic carbon (POC), the concentration of suspended particulate matter (SPM), the concentration of chlorophyll-a (Chla), the ratio of POC to SPM, and the ratio of POC to Chla. Average values for each lake are shown.
5
(R2= 0.72, p < 0.0001) (figure4(a), equation (2)). The fitted POC algorithm was:
= × − − − ⎡⎣ ⎤⎦
(
)
(
) (
)
μg R R R R POC L 228.06 exp 0.0966 rc rc rc rc .(2) 1 ,645 ,1240 ,859 ,1240The validation of this relationship showed a strong cor-relation between in situ measured POC and MODIS estimated POC (figure4(b)).
This is thefirst algorithm focused on POC dominated by detrital matter. It should be noted that this algorithm was developed and tested for the POC present in predominantly shallow lakes in the period of the year when algal blooms are low (Duan et al2014b, 2009). To best capture the seasonal variability of POC in these lakes, additional efforts would be required to develop and test POC algorithms for periods of
algal blooms (May–August) and periods of low winds
(October–November). Correction using Rrc,1240 would be important in both cases to reduce the effect of seasonal var-iation in atmospheric conditions. The resulting seasonal set of POC algorithms could be adapted for routine processing of MODIS data to produce maps of surface POC in these lakes using the same empirical approach.
Optical wavebands in the red and NIR have been widely used to examine different types of particulates, including floating algal biomass (Hu et al 2010), general turbidity (Chen et al2007), dredging water plumes (Kutser et al2007), SPM (Feng et al 2012) and Chla concentrations (Dall’Olmo et al2005). To date, these approaches have been most success when there is one dominating particulate, as they do not allow for differentiation between high concentrations of POC, Chla or SPM.
Figure 3.Relationship between the concentrations of POC and: (a) suspended matter ([POC] = 10.88[SPM] + 42.29, N = 177, R2= 0.78, p < 0.001); (b) Chlorophyll-a.
Figure 4.Relationships between surface concentration of particulate organic carbon, POC, and MODIS reflectance ratios: (a) algorithm developed; (b) validation result. Note that Rayleigh-corrected reflectance Rrc,λwas used herein and their combination (Rrc,645-Rrc,1240)/
MODIS images have been used widely in routine mon-itoring of oceanic, coastal and inland lakes (Feng et al2014, Hu et al2012, Zhang et al 2010). To monitor lakes across a range of sizes requires the spatial resolution of the 250 and 500 m bands. However, the spectral resolution of the 250 and 500 m bands limits their use of lake color assessment, com-pared to the more appropriate spectral characteristics of the 1000 m bands (Kaptué et al 2013, Olmanson et al 2011). Nonetheless, our analysis shows that it is possible to develop appropriate algorithms to monitor key carbon components of complex inland waters using the spectral characteristics of the MODIS 250 and 500 m bands, taking advantage of its high temporal resolution and wide swath.
4.3. Inter-annual variability of POC
The POC algorithm (equation (2)) and water area-delineation methods developed for the April 2012 dataset were then used with Rayleigh-corrected reflectance to explore a series of
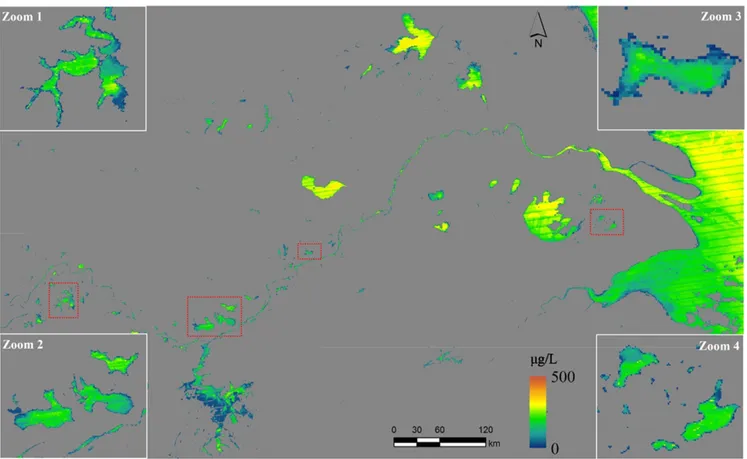
MODIS Aqua images from 2003 to 2013 (figure 5). All
images were obtained in the same month (April) of each year to minimize seasonal variations in aquatic optical conditions (e.g. algal blooms) (Duan et al2014b,2009). The number of lakes explored in each image depended on the presence of clouds. The average POC concentrations for each lake were used to examine the inter-annual variability of all lakes in the MLY. Only lakes with at least 5 measurements in the 11-year dataset were considered. These lakes (55) were located
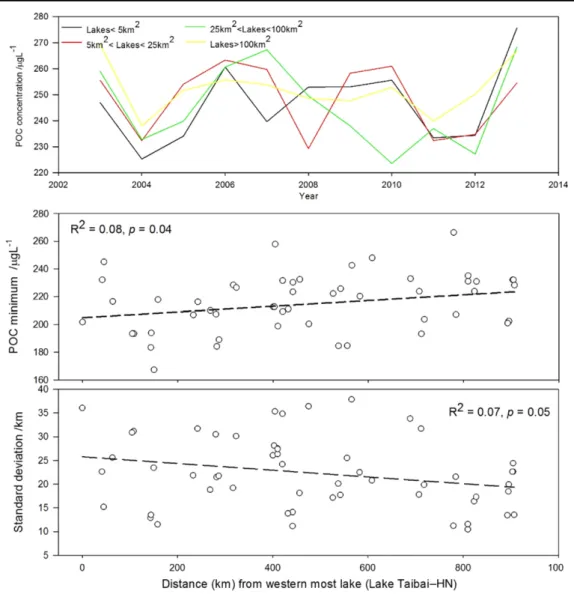
throughout the MLY and represented a wide range of lake conditions, with lake area ranging from 0.32 to 2508 km2. The yearly lake POC averages demonstrated a high inter-annual variability, with POC concentrations generally highest in 2013 and lowest in 2004 (figure 6(a)). Interannual varia-bility of individual lakes was compared to local meteor-ological data (rain, wind, and air temperature) to identify commonalities.
Lakes were grouped according to lake size in four cate-gories: less than 5 km2, between 5 km2and 25 km2, between 25 km2 and 100 km2, and above 100 km2 (figure6(a)). The inter-annual POC dynamics of each lake category were compared to average meteorological conditions. Direct cor-relations were identified for one lake size category (n = 11, p < 0.01). The inter-annual POC concentrations in the third lake category (25 km2< lake area < 100 km2) were found to be well described by a linear equation that included the max-imum air temperature on the preceding day of measurement (day2-maxtemp, 0.1 °C) (POC = 322− 0.40 day2-maxtemp, R2= 58%, F-ratio = 4.49, p = 0.006), indicating the higher sensitivity of these water bodies to temperature and mixing. Comparisons using multiple linear regression indicated that the inter-annual POC concentrations in the smaller lake category (lake area < 5 km2) were found to be well described by linear combination of precipitation on the day of estima-tion (day-rain, 0.1 mm), on the preceding day (day2-rain) and wind speed on the same day (wind, 0.1 ms−1) (POC = 274− 0.99 wind + 0.40 day2-rain− 20.0 day-rain, R2= 86%,
F-Figure 5.Mean MODIS-derived POC distributions in April between 2003 and 2013. Zoom 1: Lake Liangzi; Zoom 2: Lake Longgan, Lake Huangda and Lake Bo; Zoom 3: Lake Baidang; Zoom 4: Lake Chen and Lake Dianshan.
7
ratio = 14.65, p = 0.002) indicating the sensitivity of these water bodies to mixing, run-off and dilution.
Spatially, there was a low correlation between lake geographic position in the MLY and its POC concentration (figure6(b)). While the specific catchment land cover for each lake was not determined, the general trend from the Middle to Lower Yangtze is one of increasing crops cover and decreasing pasture cover (Ellis et al 2010). The minimum POC concentrations in the 11-year dataset of each of the 56 lakes were positively correlated (n = 56, r = 0.28, p = 0.03) to increasing distance from Lake Taibai_HN, the westernmost study lake in the Middle Yangtze (29.0 °N, 112.1 °E) (figure1). In addition, the standard deviations of 11-year POC dataset for each lake were negatively correlated (n = 56, r =−0.26, p = 0.05) with distance from Lake Taibai_HN. These correlations indicated a general tendency for dimin-ished inter-annual variability of POC and higher minimum POC in lakes of the Lower Yangtze. Higher agricultural activity favors increased nutrient inputs (promoting auto-chthonous POC production) as well as increased sediment
inputs (including allochthonous POC) (Martinuzzi
et al2014). A more detailed study of individual catchments of each lake would provide a more complete analysis of the causes of inter-lake differences.
5. Conclusions
An empirical approach used to examine the surface con-centrations of POC in inland lakes using optical remote sensing data was demonstrated to be robust. Among the algorithms examined, a power relation of the atmospherically Rayleigh-corrected reflectances at 645 nm, 859 nm and 1240 nm was found to provide the most accurate estimates. The algorithm provided good estimates of POC concentra-tions across a range of inland lakes over a large geographical area. This algorithm was used to study the inter-annual and spatial variation of POC concentrations of a large number of lakes, with varying characteristics, and provided new infor-mation on the dynamics of this important component of the aquatic carbon cycle. The data series was limited to a single
Figure 6.(a) Inter-annual dynamics of average POC concentrations of different lake size categories. (b) Relationship between geographic position in MLY and POC concentrations (lake averages) estimated using MODIS data.
month (April) that is characterized by higher winds, lower rain and low algal blooms in the MLY lakes.
Acknowledgements
The authors would like to thank all participants and voluntary contributors (Feizhou Chen, Min Zhang, Guangjia Jiang, Jiahui Huang and Changfeng Wang (Nanjing Institute of Geography and Limnology, Chinese Academy of Sciences: NIGLAS)). Thank also for climate data provided by the China Meteorological Data Sharing Service System (http://cdc.cma. gov.cn/), and MODIS data provided by the NASA ocean color web (http://oceancolor.gsfc.nasa.gov/). This study was support by the National High Technology Research and Development Program of China (2014AA06A509), the National Natural Science Foundation of China (41171271, 41171273 and 41101316), the ESA-MOST Dragon 3
Coop-eration program (10561) and the 135-Program
(NIGLAS2012135014 and NIGLAS2012135010).
References
Alin S and Johnson T C 2007 Carbon cycling in large lakes of the world: a synthesis of production, burial, and lake-atmosphere exchange estimates Glob. Biogeochem. Cycl.21 GB3002 Bianchi T and Argyrou M 1997 Temporal and spatial dynamics of
particulate organic carbon in the Lake pontchartrain estuary, southeast louisiana, USA Estuarine, Coastal Shelf Sci.45 557–69
Biddanda B and Benner R 1997 Carbon, nitrogen, and carbohydrate fluxes during the production of particulate and dissolved organic matter by marine phytoplankton Limnol. Oceanogr.42 506–18
Cauwet G and Mackenzie F 1993 Carbon inputs and distribution in estuaries of turbid rivers: the Yang Tze and Yellow rivers (China) Mar. Chem.43 235–46
Chen Z, Li J, Shen H and Zhanghua W 2001 Yangtze River of China: historical analysis of discharge variability and sediment flux Geomorphology41 77–91
Chen Z Q, Hu C M and Muller-Karger F 2007 Monitoring turbidity in tampa bay using MODIS/Aqua 250 m imagery Remote Sens. Environ.109 207–20
Cifuentes L A, Sharp J H and Fogel M L 1988 Stable carbon and nitrogen isotope biogeochemistry in the delaware estuary Limnol. Oceanogr.33 1102–15
Clark D K 1981 Phytoplankton pigment algorithms for the Nimbus-7 CZCS(coastal zone color scanner) Oceanography From Space: Marine Science (New York: Springer) pp 227–37 Dall’Olmo G, Gitelson A A, Rundquist dc, Leavitt B, Barrow T and
Holz J C 2005 Assessing the potential of SeaWiFS and MODIS for estimating chlorophyll concentration in turbid productive waters using red and near-infrared bands Remote Sens. Environ.96 176–87
Dhillon G S and Inamdar S 2013 Extreme storms and changes in particulate and dissolved organic carbon in runoff: Entering uncharted waters? Geophys. Res. Lett.40 1322–7
Duan H, Ma R and Hu C 2012 Evaluation of remote sensing algorithms for cyanobacterial pigment retrievals during spring bloom formation in several lakes of East China Remote Sens. Environ.126 126–35
Duan H, Ma R, Loiselle S A, Shen Q, Yin H and Zhang Y 2014a Optical characterization of black water blooms in eutrophic waters Sci. Total Environ.482–483 174–83
Duan H, Ma R, Zhang Y and Loiselle S A 2014b Are algal blooms occurring later in Lake Taihu? Climate local effects
outcompete mitigation prevention J. Plankton Res.36 866–71 Duan H T et al 2009 Two-decade reconstruction of algal blooms in
China’s Lake Taihu Environ. Sci. Technol.43 3522–8 Duan H T et al 2010 A new three-band algorithm for estimating
chlorophyll concentrations in turbid inland lakes Environ. Res. Lett.5 044009
Duan S and Bianchi T S 2006 Seasonal changes in the abundance and composition of plant pigments in particulate organic carbon in the lower Mississippi and Pearl Rivers Estuaries Coasts29 427–42
Ellis E C, Goldewijk K K, Siebert S, Lightman D and Ramankutty N 2010 Anthropogenic transformation of the biomes, 1700 to 2000 Glob. Ecol. Biogeogr.19 589–606
Feng L, Hu C, Chen X and Song Q 2014 Influence of the three gorges dam on total suspended matters in the Yangtze Estuary and its adjacent coastal waters: observations from MODIS Remote Sens. Environ.140 779–88
Feng L, Hu C, Chen X, Tian L and Chen L 2012 Human induced turbidity changes in poyang lake between 2000 and 2010: observations from MODIS J. Geophys. Res.117 C07006 Gardner W D, Mishonov A and Richardson M J 2006 Global POC
concentrations from in-situ and satellite data Deep-Sea Research Part Ii-Topical Studies in Oceanography53 718–40 Gitelson A A et al 2008 A simple semi-analytical model for remote estimation of chlorophyll-a in turbid waters: Validation Remote Sens. Environ.112 3582–93
Haas E M, Bartholome E and Combal B 2009 Time series analysis of optical remote sensing data for the mapping of temporary surface water bodies in sub-Saharan western Africa J. Hydrol. 370 52–63
He Q S, Li C C, Tang X, Li H L, Geng F H and Wu Y L 2010 Validation of MODIS derived aerosol optical depth over the Yangtze River Delta in China Remote Sens. Environ.114 1649–61
Hu C, Cannizzaro J, Carder K L, Muller-Karger F E and Hardy R 2010 Remote detection of Trichodesmium blooms in optically complex coastal waters: examples with MODIS full-spectral data Remote Sens. Environ.114 2048–58
Hu C, Carder K L and Muller-Karger F E 2000 Atmospheric correction of seaWiFS imagery over turbid coastal waters: a practical method Remote Sens. Environ.74 195–206 Hu C, Chen Z, Clayton T D, Swarzenski P, Brock J C and
Muller-Karger F E 2004 Assessment of estuarine water-quality indicators using MODIS medium-resolution bands: initial results from tampa bay, FL Remote Sens. Environ.93 423–41 Hu C, Lee Z and Franz B 2012 Chlorophyll a algorithms for
oligotrophic oceans: A novel approach based on three-band reflectance difference J. Geophys. Res.: Oceans 117 C01011 IOCCG 2000 Remote sensing of ocean colour in coastal, and other
optically-complex, waters ed S Sathyendranath Reports of the International Ocean Colour Coordinating Group No. 3 (Dartmouth, Canada: IOCCG)
Jiang G, Ma R, Loiselle S A and Duan H 2012 Optical approaches to examining the dynamics of dissolved organic carbon in optically complex inland waters Environ. Res. Lett.7 034014 Jin J W, Duan H T, Zhao C L, Zhou L, Shang L L and Jiang G J
2012 Remote estimation of phytoplankton pigments in inland lake waters with algae J. Infrared Millim. Waves31 132–6 Kaptué A T, Hanan N P and Prihodko L 2013 Characterization of
the spatial and temporal variability of surface water in the Soudan-Sahel region of Africa J. Geophys. Res.: Biogeosci. 118 1–12
Kaptué Tchuenté A T, De Jong S M, Roujean J-L, Favier C and Mering C 2011 Ecosystem mapping at the African continent 9
scale using a hybrid clustering approach based on 1 km resolution multi-annual data from SPOT/VEGETATION Remote Sens. Environ.115 452–64
Kutser T, Metsamaa L, Vahtmäe E and Aps R 2007 Operative monitoring of the extent of dredging plumes in coastal ecosystems using MODIS satellite imagery J. Coast. Res.SI 50 180–4
Legendre L and Michaud J 1999 Chlorophyll a to estimate the particulate organic carbon available as food to large
zooplankton in the euphotic zone of oceans J. Plankton Res.21 2067–83
Loisel H and Morel A 1998 Light scattering and chlorophyll concentration in case 1 waters: a reexamination Limnol. Oceanogr.43 847–58
Loiselle S A, Bracchini L, Cozar A, Dattilo A M, Tognazzi A and Rossi C 2009 Variability in photobleaching yields and their related impacts on optical conditions in subtropical lakes J. Photochem. Photobiol. B-Biol.95 129–37
Ma R H et al 2010 A half-century of changes in China’s lakes: Global warming or human influence? Geophys. Res. Lett.37 L24106
Ma R H et al 2011 China’s lakes at present: Number, area and spatial distribution Sci. China-Earth Sci.54 283–9
Ma R H, Pan D L, Duan H T and Song Q J 2009 Absorption and scattering properties of water body in Taihu Lake, China: backscattering Int. J. Remote Sens.30 2321–35
Martinuzzi S et al 2014 Threats and opportunities for freshwater conservation under future land use change scenarios in the United States Glob. Change Biol.20 113–24
Mishonov A V, Gardner W D and Richardson M J 2003 Remote sensing and surface POC concentration in the South Atlantic Deep-Sea Research Part Ii-Topical Studies in Oceanography 50 2997–3015
Mittenzwey K H, Gitelson A A and Kondratiev K Y 1992 Determination of chlorophyll-a of inland waters on the basis of spectral reflectance Limnol. Oceanogr.37 147–9
Modéran J, David V, Bouvais P, Richard P and Fichet D 2012 Organic matter exploitation in a highly turbid environment: planktonic food web in the charente estuary, france Estuarine, Coastal Shelf Sci.98 126–37
Morel A 1988 Optical modeling of the upper ocean in relation to its biogenous matter content (case-I waters) J. Geophys. Res.: Oceans93 10749–68
Morel A and Ahn Y-H 1990 Optical efficiency factors of free-living marine bacteria: Influence of bacterioplankton upon the optical properties and particulate organic carbon in oceanic waters J. Mar. Res.48 145–75
Olmanson L G, Brezonik P L and Bauer M E 2011 Evaluation of medium to low resolution satellite imagery for regional lake water quality assessments Water Resour. Res.47 W09515 Pabi S and Arrigo K R 2006 Satellite estimation of marine
particulate organic carbon in waters dominated by different phytoplankton taxa J. Geophys. Res.: Oceans111 C09003 Prokushkin A S et al 2011 Sources and theflux pattern of dissolved
carbon in rivers of the Yenisey basin draining the Central Siberian Plateau Environ. Res. Lett.6 045212
Rick D 1999 Deriving the haversine formula The Math Forumwww. movable-type.co.uk/scripts/latlong.html
Son Y B, Gardner W D, Mishonov A V and Richardson M J 2009 Multispectral remote-sensing algorithms for particulate organic carbon (POC): The gulf of Mexico Remote Sens. Environ.113 50–61
Stramski D, Reynolds R A, Kahru M and Mitchell B G 1999 Estimation of particulate organic carbon in the ocean from satellite remote sensing Science285 239–42
Tranvik L J et al 2009 Lakes and reservoirs as regulators of carbon cycling and climate Limnol. Oceanogr.54 2298–314 Tzortziou M, Subramaniam A, Herman J R, Gallegos C L,
Neale P J and Harding L W 2007 Remote sensing reflectance and inherent optical properties in the mid Chesapeake Bay Estuarine Coastal Shelf Sci.72 16–32
Upsdell B 2005 The carbon and nitrogen composition of suspended particulate matter in lake erie, selected tributaries, and its outflow (Ontario, Canada: University of Waterloo)
Vantrepotte V, Loisel H, Dessailly D and Mériaux X 2012 Optical classification of contrasted coastal waters Remote Sens. Environ.123 306–23
Wetzel R G 1984 Detrital dissolved and particulate organic-carbon functions in aquatic ecosystems Bull. Mar. Sci.35 503–9 Zhang L J, Wang L, Cai W J, Liu D M and Yu Z G 2012 Organic
carbon transport and impacts of human activities in the Yellow River Biogeosci. Discuss.9 14365–405
Zhang M W, Tang J W, Dong Q, Song Q T and Ding J 2010 Retrieval of total suspended matter concentration in the Yellow and East China Seas from MODIS imagery Remote Sens. Environ.114 392–403