2015
Publication Year
2020-05-21T11:40:22Z
Acceptance in OA@INAF
Are the Bulk of z > 2 Herschel Galaxies Proto-Spheroids?
Title
Pozzi, F.; CALURA, Francesco; GRUPPIONI, Carlotta; GRANATO, Gian Luigi;
CRESCI, GIOVANNI; et al.
Authors
10.1088/0004-637X/803/1/35
DOI
http://hdl.handle.net/20.500.12386/25045
Handle
THE ASTROPHYSICAL JOURNAL
Journal
803
ARE THE BULK OF
z
>
2 HERSCHEL GALAXIES PROTO-SPHEROIDS?
F. Pozzi1,2, F. Calura2, C. Gruppioni2, G. L. Granato3, G. Cresci4, L. Silva3, L. Pozzetti2,F. Matteucci3,5, and G. Zamorani2
1
Dipartimento di Fisica e Astronomia, Università degli Studi di Bologna, Viale Berti Pichat 6/2, I-40127 Bologna, Italy;[email protected] 2
INAF—Osservatorio Astronomico di Bologna, Via Ranzani 1, I-40127 Bologna, Italy
3INAF—Osservatorio Astronomico di Trieste, Via G. B. Tiepolo 11, I-34131, Trieste, Italy 4
INAF—Osservatorio Astronomico di Arcetri, Via Largo Enrico Fermi 5, I-50125 Firenze, Italy
5
Dipartimento di Fisica, Università degli Studi di Trieste, Via Valerio 2, I-34127 Bologna, Italy Received 2014 July 30; accepted 2015 February 10; published 2015 April 13
ABSTRACT
We present a backward approach for the interpretation of the evolution of the near-IR and the far-IR luminosity functions(LFs) across the redshift range < <0 z 3. In our method, late-type galaxies are treated by means of a parametric phenomenological method based on PEP/HerMES data up to z∼ 4, whereas spheroids are described by means of a physically motivated backward model. The spectral evolution of spheroids is modeled by means of a single-mass model, associated with a present-day elliptical with a K-band luminosity comparable to the break of the local early-type LF. The formation of proto-spheroids is assumed to occurr across the redshift range1⩽ z⩽ 5. The key parameter is represented by the redshift z0.5at which half of all proto-spheroids are already formed. For
this parameter, a statistical study indicates values between z0.5=1.5 and z0.5=3. We assume z0.5~2 as the
fiducial value and show that this assumption allows us to describe accourately the redshift distributions and the source counts. By assumingz0.5~2at the far-IRflux limit of the PEP-COSMOS survey, the PEP-selected sources observed atz>2 can be explained as progenitors of local spheroids caught during their formation. We also test the effects of mass downsizing by dividing the spheroids into three populations of different present-day stellar masses. The results obtained in this case confirm the validity of our approach, i.e., that the bulk of proto-spheroids can be modeled by means of a single model that describes the evolution of galaxies at the break of the present-day early-type K-band LF.
Key words: galaxies: evolution– galaxies: formation – galaxies: luminosity function, mass function – infrared: galaxies
1. INTRODUCTION
Achieving a complete understanding of the origin of the local dichotomy of spheroids and disk galaxies has been one of the main objectives in astrophysics during the past several years, as well as obtaining an accurate measure of the star formation history over cosmic time.
From the pioneering IRAS satellite results in the local universe(e.g., Soifer et al.1987) and the detection of a cosmic
infrared (IR) background as energetic as the optical/near-IR background(e.g., Puget et al.1996), it is now well established
that most energy radiated by newly formed stars is heavily absorbed by dust and re-emitted in the IR band. In the last decade, the ISO and the Spitzer satellite individually detected IR sources up to z ∼ 1 (e.g., Elbaz et al. 1999; Gruppioni et al. 2002) and z ∼ 2 (e.g., Papovich et al. 2004; Shupe et al.2008) in the mid-IR band, but their capabilities at far-IR
wavelengths(i.e., where the dust reprocessed emission peaks) were still strongly limited by source confusion.
More recently, the Herschel Space Observatory (Pilbratt et al. 2010) has allowed us to properly measure the IR
luminosity function (LF) of galaxies up to z ∼ 4 (Gruppioni et al. 2013,hereafter GPR13; see also Magnelli et al. 2013),
thanks to its mirror of 3.5 m and observing spectral range between 60 and 670μm. The derived IR luminosity density (rIR) confirms the Spitzer 24 μm based results (e.g., Caputi
et al.2007; Magnelli et al.2009; Rodighiero et al.2010) up to z
∼ 2, revealing that the IR luminosity density increases steeply from z= 0 up to z ∼ 1, then flattens between z ∼ 1 and z ∼ 3, to decrease at z>3.
In a recent paper by Burgarella et al.(2013), the IR Herschel
LF derived byGPR13 has been combined with the LF in the far-UV from Cucciati et al. (2012) in order to achieve an
estimate of the redshift evolution of the total(far-UV + IR) star formation rate density (SFRD). The SFRD is always dominated by the IR emission, whereas the UV contribution increases steeply from z= 0 up to z ∼ 2.5, where it flattens and settles on a plateau up to the highest redshift sampled by the survey (z ∼ 3.6). This suggests that the peak of the dust attenuation, occurring at z∼ 1, is delayed with respect to the SFRD plateau(z ∼ 2−3), derived from the far-UV.
The accurate determination of the star formation history up to z ∼ 4 has rendered particularly urgent the issue of theoretically explaining this behavior as well as understanding how the observed SFRD evolution is linked to the galaxy formation process.
Within the current “concordance” cosmological paradigm, which employs a Λ cold dark matter (ΛCDM)-dominated universe, the formation of structures is hierarchical since small dark matter(DM) halos are the first to collapse, then interact and merge to assemble into larger halos (e.g., Lacey et al.2008; Fontanot et al.2009).
In cosmological ΛCDM-based semi-analytical models (SAMs) for galaxy formation, the most uncertain assumptions concern the behavior of the baryonic matter. In the first classical SAM implementations, baryonic matter was assumed to follow the DM in all the interaction and merging processes and spheroid galaxies were formed from several merging episodes of smaller sub-units with the most massive galaxies as the last systems to assemble. Indeed, more recent results
The Astrophysical Journal, 803:35 (16pp), 2015 April 10 doi:10.1088/0004-637X/803/1/35
suggest that spheroids may form over a wide redshift range by means of both galaxy mergers and disk instabilities (e.g., De Lucia et al. 2011; Porter et al. 2014). In particular, the latter
process should be of fundamental importance if the vast majority of z ≈ 2 quasi-stellar objects is associated with unperturbed systems, as indicated by recent results (e.g., Schawinski et al. 2012).
Although accounting for the recent updatings, SAM galaxy formation models still encounter difficulties to reconcile properly with the well established anti-hierachical evolution of spheroids, a feature which is known as “downsizing” and which is supported by a large amount of observational data (Matteucci1994; Cowie et al. 1996; Kodama et al.2004; but see also Marchesini et al.2009).
Moreover,ΛCDM models highlight difficulties for reprodu-cing the evolution of IR galaxies (in particular the bright-end IR LF at high-z; see, e.g., Fontanot & Somerville2011; Niemi et al.2012; C. Gruppioni et al. 2015, in preparation). The basic problem of the dominance of a merger-driven evolution is the duration of the star formation in spheroids, which extends over times much longer than those indicated by the basic stellar population diagnostics of local ellipticals (Matteucci 1994; Renzini2006).
Doubts on the dominant role of mergers in driving the star formation histories of galaxies is also supported by the observation of systems with regular kinematics and showing little signs of major mergers (Cresci et al. 2009; Förster Schreiber et al.2009; Gnerucci et al.2011), as well as the tight
scaling relations of star-forming galaxies such as the mass –star-formation-rate (SFR) plane (Rodighiero et al. 2011) and the
fundamental metallicity relation (Mannucci et al. 2010; Lara-López et al.2010), which are apparently incompatible with the
stochastic nature of galaxy mergers (see, e.g., Genzel et al.2008).
In Dekel et al. (2009), a new scenario is proposed where
galaxy formation is not mainly merger-driven, but occurs instead via a“cold stream accretion” process, which represents the dominant mode for galaxy formation. Such a scenario is able to account for several galaxy properties at high-z(i.e., gas richness and extended rotationally supported disks). In the proposed model, the streams responsible for the creation of rotationally supported disks could also supply the turbulence necessary for the formation of spheroids.
Cook et al. (2009), building upon the model by Granato
et al.(2004), proposed an alternative scenario for the origin of
the local dichotomy between spheroids and disks in galaxies in the context of the hierarchical buildup of DM halos. Noting that the growth of DM halos occurs in two phases (e.g., Zhao et al.2003), namely a fast collapse phase featuring a few major
merger events followed by a late, quiescent accretion onto the halo outskirts, they proposed that thefirst and second phases of halo growth drive two distinct modes for the evolution of baryonic matter, favoring the development of the spheroidal and disk components of galaxies, respectively. As a result, in that semi-analytic model, the spheroidal component develops rapidly and at early times ( z 2), mimicking the classic “monolithic model” (e.g., Larson 1976; Matteucci1994.)
Although a similar picture can account for the duality between spheroids and disks, obtaining a full, theoretical understanding of the basic properties of galaxies as traced by current multi-wavelength surveys over cosmic time is still a challenging task.
At present, the lack of a complete theoretical picture for galaxy formation encouraged several attempts to reproduce the basic observational properties of galaxies over cosmic time via “hybrid” models, which generally match simple physical models to parametric approaches. A few attempts (i.e., Silva et al.2005; Lapi et al.2011; Cai et al.2013; Bonato et al.2014)
have been able to provide a reasonable description of the multi-wavelength properties of galaxies, from the near-IR up to sub-mm wavelengths. However, the treatment of the chemical evolution of dust grains in such systems has often been simplistic, i.e., assuming a constant carbon-to-silicate ratio or constant dust-to-gas ratios simply scaling with metallicity.
In the work of Schurer et al.(2009) detailed predictions on
the evolution of the dust chemical composition in galaxies of different morphological types have been matched to the spectrophotometric code GRASIL (Silva et al. 1998), which
takes into account dust reprocessing, to analyze the evolution of the resulting spectral energy distributions (SEDs). Schurer et al. (2009) showed that a detailed treatment of the dust
chemical composition is particularly important when the proto-spheroids SEDs are taken into account since dust assumptions tuned to match the dust depletion pattern of the Milky Way turned out to be particularly inadequate for describing their observables.
In this paper, we present a new backward phenomenological approach where the spectrophotometric evolution of dust in proto-spheroids is calculated self-consistently, i.e., from idealized star formation histories able to account for a large set of observational data at various redshifts including their dust content and local abundances ratios (Calura et al. 2008 hereafter CPM08; Pipino et al.2011) and the evolution of their
SEDs(Schurer et al. 2009). Beside our physically motivated
“backward” model for the evolution of proto-spheroids, the evolution of late-type galaxies is also taken into account through a parametric, phenomenological approach.
Our aim is to reproduce a variety of multi-wavelength observables, including source counts, redshift distributions, and LFs at various redshifts and from the near-IR to the far-IR.
The basic questions we aim to address are to which extent the star-forming galaxies detected by Herschel at high-z, could be considered as the progenitors of local early galaxies (i.e., proto-spheroids), and which quantitative constraints can be achieved from current observations regarding the dominant epoch for spheroid formation.
The paper is structured as follows: in Section2we describe how the model deals with the late-type and proto-spheroids populations, in Section3 we compare the far-IR and K-band observables with the model predictions, and in Section 4 we discuss the formation redshift and mass buildup of the proto-spheroid population.
All magnitudes reported in this paper are in the AB system (Oke & Gunn1983). Throughout this paper, we adopt a flat L
CDM cosmology with H0=71kms−1, Ωm=0.27e
ΩΛ= 0.73.
2. MODEL DESCRIPTION
The basic idea behind our approach is similar to the one of previous “hybrid” models used to interpret far-IR and optical data(see Silva et al. 2005; Lapi et al. 2011; Cai et al. 2013)
where galaxies are divided into two main classes, i.e., early-type and late-early-type galaxies, and each class is treated in a different way.
The evolution of late-type galaxies is followed by means of a parametric, classical “backward” approach, which consists in evolving a local luminosity function(LLF) back with redshift (Gruppioni et al. 2011). The observables are reproduced by
evolving the LLF of different populations, each characterized by a set of SEDs, in density and luminosity. This approach has been traditionally used to interpret far-IR source counts (e.g., Pozzi et al.2004; Valiante et al.2009; Franceschini et al.2010; Béthermin et al. 2011; Gruppioni et al.2011).
The evolution of proto-spheroids is followed by means of a model in which the chemical composition of dust is calculated in detail and self-consistently on the basis of its star formation history. In this model, the evolution of the SED of the proto-spheroid is followed as a function of time.
The main reason for developing this approach derives from the need offinding a model able to account for data in various bands. Up to now, IR backward evolutionary models, although accurately accounting for the dust far-IR emission (linked to the ongoing star formation, hence to young stellar populations), have neglected the need to account for other observables related to evolved stellar populations, such as the K-band data, which trace the oldest stellar populations. Data from K-band up to far-IR wavelengths can be simultaneously reproduced only if a self-consistent model that accounts for the time-dependent galaxy SED is considered.
The description of our method can be subdivided into three steps. First, we divide far-IR sources into late-type galaxies and “potential” proto-spheroids on the basis of their SEDs and, more importantly, on the basis of the evolution (positive or negative) of their comoving number density as a function of redshift z(see Section2.1). This approach is different from that
used in other works such as Cai et al.(2013) where IR galaxies
are classified according to their redshift, with high-z ( >z 1.5) star-forming sources generally interpreted as proto-spheroids and sources at lower-z( <z 1.5) as late-type galaxies. Second, we normalize the proto-spheroid galaxy number density according to the local K-band LF. Finally, we use our physical, chemo-spectrophotometric SED evolution(Schurer et al.2009)
to calculate the source counts and redshift distributions for the proto-spheroid population. The proto-spheroids formation redshift is left as the only free parameter; for this quantity, we explore an appropriate range in order to simultaneously reproduce the K-band and far-IR observables.
The main difference between the approach used in this paper and previous “hybrid” models (Silva et al. 2005; Lapi et al. 2011) is that in the latter, the abundance of spheroids
as a function of redshift is calculated by means of a simplified treatment of the merging history of DM halos described by the Press & Schechter (1974) formalism. In this paper, the
statistics of spheroidal galaxies are determined purely on a phenomenological basis, i.e., from their present-day K-band LF, with their backward evolution describing their abundance at redshift z>0.
2.1. IR Populations
Our division of IR sources into late-types and proto-spheroids is based on the results ofGPR13. In that paper, the IR LFs of galaxies and active galactic nuclei(AGNs) up to z ∼ 4 were presented. The IR LFs were derived by exploiting the deep and extended data sets of the Herschel GTO PACS Evolutionary Probe (PEP, Lutz et al. 2011). Different
cosmological fields at different depths were included from
the shallow COSMOSfield (3σ depth of 10.2 mJy at 160 μm) up to the pencil-beam GOODS-Sfield (3σ depth of 2.4 mJy at 160μm). Far-IR Herschel data from the PEP survey (at 70, 100 and 160μm) were exploited together with data in the sub-millimeter band from the HerMES survey(Oliver et al.2010at 250, 350, and 500μm) and taking advantage of the extensive multi-band coverage.
In GPR13, the sources were classified on the basis of an accurate SED fitting by comparing data with semi-empirical models from different libraries (Polletta et al. 2007; Rieke et al. 2009; Gruppioni et al. 2010). According to the best-fit
templates, sources were divided intofive different populations: spiral and starburst galaxies(i.e., galaxies with no evidence of an AGN, and characterized by <Tdust> ~20 and 40–50 K, respectively), AGN1, AGN2 and star-forming (SF)-AGN. The latter class represents the largest fraction (∼48%, see also Sajina et al. 2012) of the PEP-selected sources and includes
systems whose SEDs were fitted by means of empirical templates of nearby ULIRGs/Seyferts containing an obscured or low-luminosity AGN. However, the obscured/low-luminos-ity AGN does not dominate the energetic budget in these sources; its presence is detected mostly in the narrow mid-IR range, where theflux of the host galaxy presents a minimum. Spiral galaxies constitute the second more numerous class (∼38%), followed by starburst galaxies representing ∼7% of the far-IR selected sources, and lastly by the AGN1 and AGN2 (only 3% and 4%, respectively).
Given the large fraction of sources presenting an SF-AGN SED and the large heterogeneity of the templates in this category, SF-AGNs in GPR13 were further divided in two classes depending on their far-IR/near-IR colors (e.g., S100 S1.6): specifically, galaxies fitted by cold Seyfert2/
1.8 templates were classified as SF-AGNs (spiral) with far-IR/ near-IR colors typical of spiral/late-type sources, while sources showing the presence of a warmer dust component, such as NGC 6240, were classified as SF-AGNs (SB), with colors typical of starburst galaxies.
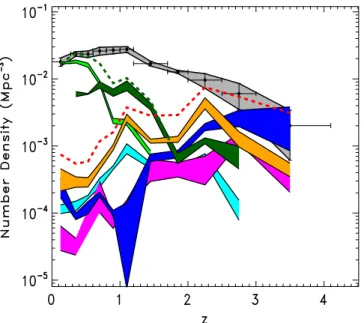
In Figure 1 the comoving number density of the different populations has been reported as taken from Figure 18 of
GPR13 (top panel). The number density in GPR13 was computed by integrating the modified Schechter functions that best reproduced the different populations down to luminosity
~
L 108L . As already noted by GPR13, the different populations behave in significantly different and rather opposite ways: while the comoving number density of spiral and SF-AGN(spiral) strongly increases going from high-z to the local universe, the number density of starbursts, SF-AGN (SB), AGN1, and AGN2 sources significantly decreases with decreasing redshift.
In detail, spiral galaxies dominate the global density of galaxies in the local universe(followed by the SF-AGN(spiral) systems), but their number density at z ∼ 1 already drops by nearly one order of magnitude. Starbursts, SF-AGN(SB), AGN1, and AGN2, instead dominate the number density at
>
z 1.5, whereas their contribution to the local number density is negligible. We caution the reader that the described trends in the number densities, in particular those referring to the spiral galaxies, are not in contrast with the observed decrease of the star formation density from z∼ 1 to z ∼ 0 (i.e., Hopkins & Beacom 2006), directly proportional to the IR luminosity
density(reported in Figure 18 ofGPR13, lower panel) and not to the number density.
In this work, we interpret the evolution of the IR comoving number density of starbursts, SF-AGN(SB), AGN1, and AGN2 sources, progressively decreasing from z ∼ 3 to z = 0, as the transition of all these systems to a population of passive objects. In other words, in our scheme, we regard all these classes of objects as the progenitors of local spheroids. In our formalism, the evolution of the SED of this class of objects is taken into account by means of the physical model described in Section2.2.
On the other hand, on the basis of their SED classification and on the positive evolution of their comoving number density as a function of the cosmic time, we classify spiral and SFR-AGN(spiral) sources as late-type galaxies. As already intro-duced in Section2, for these galaxy classes, we do not consider any physical model, but we adopt the same parametric LF evolution as reported inGPR13. More specifically, to describe the LF evolution of these populations at different cosmological times, we consider both the LLF (computed as a modified Schechter function) and the evolution of the Lstar and Φstar parameters as presented inGPR13.
2.2. The Proto-spheroid Model
A long-lasting debate is still open on the formation of spheroids. Although use of the dominant merger-driven scenario has had remarkable success, it has also encountered several difficulties in reproducing some basic properties related to the scaling properties of spheroids and their evolution (Matteucci 1994; Renzini 2006; Ciotti 2009; Pozzetti et al. 2010). For this reason, the old idea (i.e., Larson1976)
that large elliptical galaxies formed their stars at high redshift in a huge burst of star formation is now being revisited (see Driver et al. 2013and references therein).
The model we adopt for proto-spheroids is based on this idea and is similar to the classic“monolithic model” proposed by various authors (e.g., Larson 1976; Matteucci 1994). More
detailed descriptions of the model can be found in CPM08, Schurer et al.(2009), and Pipino et al. (2011).
The model described here is designed to reproduce an elliptical galaxy of present-day stellar mass M*~ 1011M,
which corresponds to the stellar mass at the break of the local early-type stellar mass function(MF; Baldry et al. 2004). Its
basic assumptions are the following.
In our scheme, proto-spheroid galaxies form as the result of a rapid collapse of a homogeneous sphere of primordial composition, generating an intense star formation event (see also Pipino et al. 2002, 2005). After the initial collapse, the
galaxy is allowed to evolve as an“open box” into the potential well of a DM halo.
The system is assumed to accrete gas via an infall episode; the infall rate as a function of time t can be expressed as:
t
µ
-( )
G˙ inf exp t inf. (1)The quantity tinf determines the timescale of the collapse; in
this paper, we adopt tinf= 0.4Gyr(Pipino et al. 2011).
The SFR(expressed inM yr −1) is calculated as:
y( )t =nMgas( ),t (2)
i.e., it is assumed to be proportional to the gas mass Mgasvia the star formation efficiency ν according to the Schmidt (1959) law.
The star formation is assumed to halt as the energy of the ISM, heated by stellar winds and supernova(SN) explosions, exceeds the binding energy of the gas. At this stage, a galactic wind is triggered, sweeping away all the residual gas. From this point on, the galaxy is assumed to evolve passively.
As described in detail in Schurer et al.(2009), in our model
we assume a star formation efficiency ν = 15 Gyr−1 and a Salpeter(1955) initial MF (IMF) in the mass interval 0.1–100
M . Under these conditions, the time of the onset of the galactic wind is∼0.7 Gyr.
In the model, the evolution of the chemical composition of the ISM is followed in detail and as a function of time. The model also takes into account how the interstellar dust composition varies as a function of time instead of assuming a non-evolving dust composition similar to that of the Milky Way(see Draine & Li2007).
Also, our model includes a detailed treatment of the rate of SNe Ia, which are assumed to originate from white dwarfs in binary systems, as well as a computation of their energetic feedback to the ISM(Pipino et al.2005). These SNe continue
exploding even after star formation has been quenched by the galactic wind. For this reason, they may have an important role in keeping the galaxy free of gas and passively evolving. Indeed, these events occur in a medium already hot and rarefied, where radiative cooling is inefficient and radiative losses are negligible, so that most of their blast wave energy can be transferred as thermal energy into the interstellar medium. Actually, in the context of our model, no additional source of feedback is required to avoid subsequent episodes of star formation. It is, however, worth noting that SAMs, which, at variance with respect to our simplified treatment, do include a computation of the gas accretion from the intergalactic medium and in recent years have begun to take into account the
Figure 1. Evolution of the comoving number density of the PEP sources up to z∼ 4 (taken from Figure 18 ofGPR13). Black filled dots with error bars within
the±1σ uncertainty region (gray filled area) represent the total sample. The colored shaded areas represent the contribution from different populations, highlighted as follows: green: spiral; dark green: SF-AGN(spiral); cyan: starburst; orange: SF-AGN(SB); magenta: AGN2; blue: AGN1. The dark green dashed line corresponds to the sum of the spiral+SF-AGN(spiral) populations; the red dashed line corresponds to the sum of the
effects of SNe Ia(e.g., Yates et al.2013; Gargiulo et al.2014),
still indicate that “radio-mode” AGN feedback is required in order to avoid low-redshift star formation episodes in ellipticals.
The chemical evolution model for proto-spheroids of
CPM08 has then been used by Schurer et al. (2009) to
calculate how the theoretical SED is expected to vary as a function of time once the chemical evolution of interstellar dust is taken into account in a self-consistent way. For this purpose, the spectrophotometric code GRASIL (Silva et al. 1998) has
been used. The unique feature of GRASIL is that it allows one to track the luminosity evolution of composite stellar popula-tions by taking into account the effects of interstellar dust.
In this paper, the spectral evolution of the proto-spheroid population is modeled by means of the theoretical SEDs calculated by Schurer et al.(2009).
No attempt is made to model composite galaxies, i.e., objects including both bulges and disks. These systems are particularly complex since they may present composite star formation histories and geometries for their dust and stellar components in principle different than those assumed in this paper.
3. RESULTS
In this section, we present the model predictions(in terms of source counts, redshift distribution, and LF), together with the corresponding observables. As reference bands we choose the K band, probing the old stellar populations, and the far-IR 160μm band, probing the still-forming stellar populations.
For the far-IR, we use the PEP survey as a reference. In this survey, sources are selected at 100μm and 160 μm (also at 70μm, but only in the GOODS-S field). We consider the 160μm sample as our reference sample to allow a direct comparison with the results of GPR13, also based on the 160μm PEP catalog. Moreover, the 160 μm sample reaches slightly higher redshifts.
As already mentioned in Section2, we normalize the number density of late-type galaxies according to the IR LF as determined by GPR13. The LF in the K band as a function of redshift is calculated on the basis of appropriate color transformations from the best-fitting SED templates.
At z= 0, the assumed LF of spheroids is the LLF of early-type galaxies from Kochanek et al.(2001); at redshifts greater
than zero and in the IR, the proto-spheroid LF is determined on the basis of the evolution of their SEDs, calculated self-consistently by means of the chemo-spectrophotometric model described in Section2.2. No evolution is assumed for the faint-end slopeα. At redshifts greater than zs, corresponding to the beginning of the proto-spheroid formation epoch, the normal-ization is set to zero.
3.1. Source Counts and Redshift Distributions At any given flux S, we calculate the differential number counts(per unit solid angle) of proto-spheroids galaxies from the integral:
ò
= Féë ùû ( )
(
)
(
)
dN dSd S L S z z dL S z dS dV dzd dz Ω , , , Ω (3) z 0 maxwhere F L z( , ) is the luminosity function calculated at the redshift z, dV dzdΩ is the comoving volume per unit of solid angle and zmax is the maximum redshift where the proto-spheroid LF is sampled (i.e., corresponding to the formation
redshift.) The relation between the rest-frame luminosity L and the observedfluxS at a given redshift z is:
= + + + +
(
)
L S z S D E z K zlog , log 2 log
const ( ) ( ), (4)
L
where DL is the luminosity distance, E(z) is the evolutionary correction, K(z) is the K correction, and const is a constant term(Poggianti1997; Shimasaku & Fukugita 1998).
Similarly, we calculate the source redshift distribution(i.e., number of sources above a givenflux limit Slim, in a redshift rangez1< <z z2and per unit of solid angle) from the integral:
ò ò
> = F ´ ¥(
)
N S L S z z dL S z dV dzd dz [ ( , ), ] ( , ) Ω (5) ( ) z z L lim S z 1 2 min lim,where Lmin(Slim,z) is the rest-frame minimum luminosity
corresponding to theflux limit Slimat a given redshift z. 3.2. A Continuous Formation for Proto-spheroids In this work, we assume a continuous formation6of proto-spheroids, described by the function d
d N
z and occurring
throughout an extended redshift range, which starts at redshift zsand ending at ze.
The local number density of spheroids is determined by the local K-band LF of Kochanek et al. (2001). For the sake of
simplicity, we assume that d
d N
z is a mass-independent function
over a given redshift range D =z zs-ze. By means of this
function, the global spheroid population is divided into various sub-populations, each one born at a different epoch, and thus characterized by a different age at the present day. Each sub-population is evolved backward in luminosity by means of a single spectrophotometric model calculated for a galaxy with a present-day stellar mass of ~1011M, corresponding roughly
to the break of the present-day early-type K-band LF. We believe that ze= 1 can be regarded as a reasonable value for the end of the formation epoch of M 1011Mspheroids. This value is consistent with their stellar population diagnos-tics, globally indicating that the bulk of the most massive early types were already in place at z= 1 (Renzini2006). Moreover,
Ilbert et al. (2013; see also Cimatti et al. 2006 and Pozzetti et al.2010), using the new data from the UltraVISTA survey
(McCracken et al. 2012) in the COSMOS field, showed that
quiescient galaxies more massive than 1011.2M
do not show
any evidence of density evolution between0.8< <z 1.1 and < <z
0.2 0.5.
The assumption of ze= 1 is also reasonable in light of the steep decrease atz<1 of the comoving number density of PEP sources associated with proto-spheroids, as discussed in Section2.1.
The assumption that star formation in proto-spheroids is complete at z∼ 1 prevents our model from accounting for the presence of starbursts, AGN1, AGN2, and SF-AGN(SB) objects atz<1. However, as visible in Figure1, such objects contribute less than∼10% to the number density of IR sources at0 ⩽z1.
6
Throughout this work, the proto-spheroids in formation are those that have started forming stars at a given redshift.
The quantity zsis the redshift at which star formation starts and is set to zs= 5. We checked that zsvalues larger than 5 do not change our results appreciably.
Our aim is to test whether the proto-spheroid formation rate
d d N
z can be described by a piecewise-constant function. For the
sake of simplicity, we considered the most basic piecewise-constant function, i.e., we divided the redshift rangeΔz in two intervals, divided by a value z0.5, defined as the redshift at
which half of the proto-spheroid population have formed, which is the only free parameter of our analysis.
The quantity z0.5 is determined by means of a “merit
function,” which takes into account the four observables represented by the source counts and redshift distribution (at theflux limit of the COSMOS field) at 160 μm and the source counts and redshift distribution (at the flux limit of the K20 survey) in the K band. This merit function may be intended as a modified reduced χ2, estimated as the sum of theχ2obtained for each of the four observables and where the number of degrees of freedom is replaced by the number of data bins(flux or redshift bins, depending on the observable; see Vignali et al.2009).
The result of our analysis is shown in the top panel of Figure2, where the merit function is plotted as a function of the quantity z0.5in various separate cases, in which the counts and
the redshift distributions have been regarded as single observables, and in the case where these quantities have been considered altogether.
When the redshift distributions and the source counts are considered as a single observable, the minimum of the reduced χ2 falls at z =
3.0
0.5 and at z0.5=1.5, respectively. On the
other hand, if the four observables are considered altogether, our analysis indicates a minimum of the merit function extending over a region spanning from z0.5=1.5 and
= z0.5 3.0.
In the remainder of this work, we choose the redshift at which half of the proto-spherids have formed, z0.5~2, as the fiducial value, i.e., a value approximately in between the extremes ofz0.5=1.5andz0.5=3.0.
The assumption of a value for z0.5 beyond the extremes of
the distribution causes either a poor description of the 160μm redshift distribution (middle panel of Figure 2, considering
=
z0.5 1.2) or a significant underestimation of the 160 μm counts at bright fluxes (S160 mμ ⩾ 30 mJy; lower panel of Figure2, consideringz0.5=3.5).
To summarize, we assume that half of the proto-spheroids form, at a constant rate, over the redshift range1 < <z z0.5,
and half over the redshift intervalz0.5⩽z<5.
All the results shown in the remainder of this work have been obtained with ourfiducial assumption, i.e., withz0.5~2.
3.3. Model Results versus Observations
In Figure3, the observed differential far-IR counts calculated at 160μm (upper panel) and the corresponding redshift distribution for the PEP-COSMOS data (lower panel) are shown, together with the results obtained with our model.
As shown by the 160μm band counts, the agreement between data and model results is remarkably good. In particular, the proto-spheroid population contributes signi fi-cantly (being almost half of the source counts), in the flux range where the differential Euclidean normalized source counts peak(S160~20-30mJy).
Also the observed redshift distribution computed at the COSMOS flux limit of 20 mJy (Figure 3, bottom panel) is reproduced by our model. As discussed byGPR13, at thisflux limit, the completeness is close to 100%.
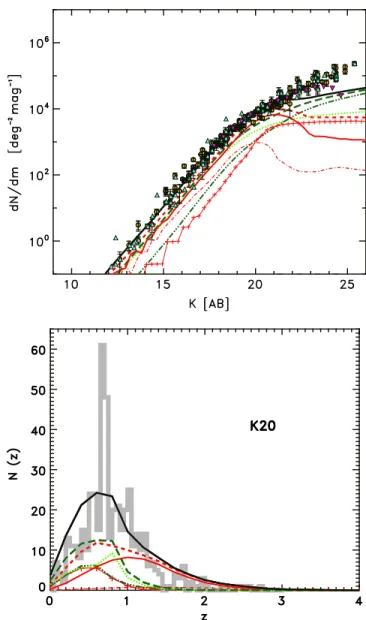
In Figure 4, the observed and predicted K-band source counts(upper panel) and redshift distribution (lower panel) are shown, respectively. The model K-band redshift distribution shown in Figure 4 is compared with the results of the K20 survey7(Cimatti et al.2002; Mignoli et al.2005)
The K-band source counts are well reproduced down to K∼ 23(Figure4, top panel), whereas at fainter magnitudes they are underpredicted by our model. This result is satisfactory considering that, for late-type galaxies, the K-band counts are calculated from the best-fitting SEDs and from the parametric IR LF evolution obtained in GPR13, whereas the SED evolution of proto-spheroids is computed solely on the basis of the model described in Section2.2.
The agreement between our model and data is also evident from the computed K-band source redshift distribution (Figure 4, bottom panel). The K20 distribution has been reported since it represents the most complete spectroscopic survey of a K-band-selected sample (i.e., spectroscopic completeness of ∼96%, Mignoli et al.2005). At z ⩾ 1.5, our
analysis indicates that nearly all the sources in the redshift distribution are proto-spheroids. It may be interesting to compare this result with the morphological classification of the K20 survey (Cassata et al. 2005). Of ∼300 objects
belonging to the CDFS region,∼20–25 sources lie at z ⩾ 1.5, and a large fraction of them(>80%) are classified as irregulars and ellipticals galaxies, whereas a small fraction (∼10–20%) are classified as spiral galaxies. The irregular and elliptical systems may be identified with our proto-spheroids, caught during their star-forming phase and already passive, respec-tively. Despite the poor statistics of the K20 sample at z⩾ 1.5, we can regard this result as encouranging.
In the upper panel of Figure 5, we show the predicted differential K-band counts computed for proto-spheroids in various redshift bins. As visible also from the redshift distribution plot, the bulk of the proto-spheroids is between z ∼ 0 and z ∼ 2, with the counts at K>19 dominated by spheroids at z>1 and the counts at brighter magnitudes dominated byz<1 sources. Proto-spheroids at high-z( >z 2) give a significant contribution only at very faint magnitudes (K ∼ 23–25). As shown in the lower panel of Figure5, at 160μm, instead, most of the proto-spheroid population lies at z1, peaking between1< <z 2.
The predicted K-band and far-IR proto-spheroid redshift distribution are significantly different (i.e., the K-band redshift distribution extending atz<1 is at odds with that of the far-IR), since in our model at z ∼ 1.6, the star formation is completed in half of the proto-spheroids (corresponding to ∼0.7 Gyr after z = 2, see Section3.2); i.e., at lower redshifts,
they will appear as red, passive objects. The redshift at which the star formation in all spheroids is complete is z ∼ 0.8 (considering the spheroids formed, at the latest times, at z ∼ 1). At lower redshifts, the totality of these galaxies will evolve as passive systems.
7
The K20 survey(area ∼52 arcmin2) is composed by sources selected in two independent sky regions, one centered in the Chandra Deep field South (CDFS, ∼32.2 arcmin2
) and the second centered around the quasi-stellar object 0055–269 (∼19.8 arcmin2). More detailed information can be found in Cimatti
Later, in Section 3.4, we will discuss some implications of our results regarding the stellar mass buildup in early-type galaxies.
3.4. The Evolution of the K-band LF
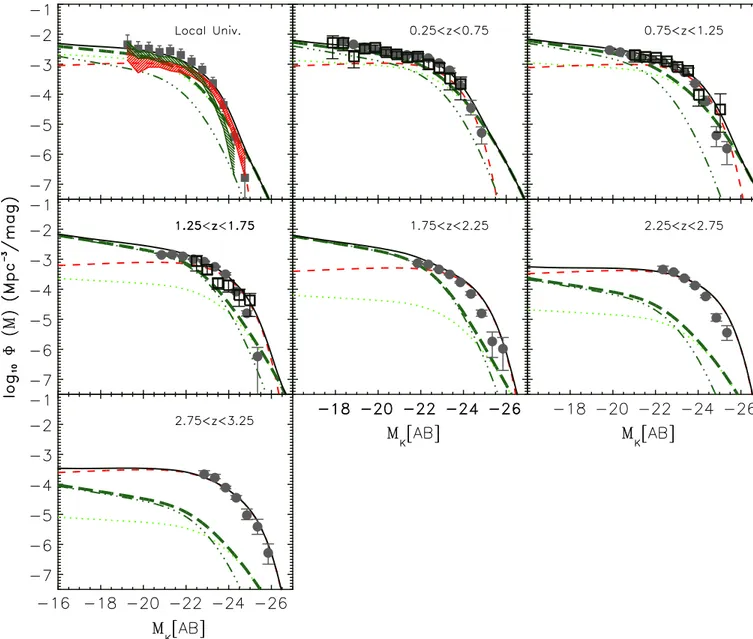
Figure 6 shows the comparison between the K-band LFs observed at various redshifts and the one derived by our model
assuming a continuous proto-spheroid formation, as discussed in Section3.2.
In the local universe, we show the observed total K-band LF as determined by Kochanek et al.(2001), together with the LF
derived for early- and late-type galaxies, represented by the red and green dashed areas, respectively. At higher redshift, the data are taken from the K20 survey up to z ∼ 1.75 (Pozzetti et al.2003) and from the UKIDSS Ultra Deep Survey (K ∼ 23
over 0.7 deg2, Cirasuolo et al. 2010) in the redshift range
< <z
0.25 3.
Figure 2. Top panel: merit function as defined in Section3.2as a function of z0.5. The red dashed, green dashed, and black solid lines are the merit function
calculated considering only the K band and 160μm redshift distributions, the K band and 160μm source counts, and the four observables altogether, respectively. Middle panel: 160μm redshift distribution obtained considering
=
z0.5 1.2. Bottom panel: 160μm source counts obtained considering =
z0.5 3.5.
Figure 3. Upper panel: 160 μm differential extragalactic source counts normalized to the Euclidean slope. Herschel data from PEP (Berta et al. 2011) are represented by red filled circles (GOODS-N), blue filled
squares (Lockman Hole), green triangles (COSMOS), and cyan pentagons (GOODS-S). The gray shaded area represents the 1σ uncertainty region of the Spitzer data(Dole et al.2004; Frayer et al.2006; Béthermin et al.2010). The
Herschel data from the combined PEP/GOODS-H map(Magnelli et al.2013)
are represented by yellow dots(GOODS-S ultra-deep) and yellow pentagons (GOODS-N/S deep). Lower panel: Redshift distribution of the PEP sources with 160μm flux >20 mJy (gray histogram, bin = 0.2). The model curves for the different populations are plotted in different colors (black solid: total; dotted green: spiral; dot-dot-dot-dashed dark green: SF-AGN(spiral), long-dashed dark green: spiral+SF-AGN(spiral); dashed red: proto-spheroids). For the model results, a piecewise-constant continuous formation for proto-spheroids has been assumed as described in Section3.2.
We find an overall good agreement between the expected model LF and the data in most of the redshift bins of Figure6. In the local universe, the early-type LF model estimate is consistent with the data by construction since the spheroid LF has been normalized to the local K-band LF. On the other hand, the good agreement between the computed late-type LF and the data imply that the far-IR selection is not missing a significant number of sources also classified as late-types in the NIR and that the SED-fitting procedure used for the classification is nearly accurate. The slightly shallower decline, at bright K-band magnitudes, of the computed late-type LF with respect to the observed one reflects the shape of IR-derived LFs, typically well fitted by a modified Schechter function rather than by a pure Schechter (e.g., Saunders et al. 1990; Pozzi et al.2004; Salim & Lee2012).
Wefind that the late-type population exhibits a steeper faint-end slope than early types, and that they dominate the LF at the fainter luminosities up to z∼ 2.
The largest discrepancy between the model predictions and the data is visible in the redshift range1.75 z 2.75, where our model overpredicts the number of luminous galaxies at the bright end of the LF(MK -24.5).
Possible reasons for the discrepancy are the simplicity of our model (i.e., recall that we are using only one proto-spheroid model for the whole luminosity range; see Section2.2) and the
cosmic variance, whose effects are also visible from the difference between the bright-end LF of the K20 survey (Pozzetti et al. 2003) and that of the UKIDSS survey
(Cirasuolo et al.2010).
At high redshift (2.7 z 3.25), the agreement between model results and the observed LF is remarkable.
Considering the whole redshift range, our results indicate that the contribution of late-type galaxies to the total LF is significant up to z ∼ 2. At >z 2, the K-band LF is dominated by proto-spheroids.
Figure 4. Upper panel: observed and predicted K-band differential extra-galactic source counts. Observational data are from the Durham public compilation (website: http://star-www.dur.ac.uk/~nm/pubhtml/counts), from
Madau & Pozzetti(2000) and from the UltraVISTA survey (95% complete to
K= 23.8, McCracken et al. 2012), and are shown as yellow circles, cyan
triangles, and pink triangles, respectively. The curves represent the same model predictions as in Figure3. Lower panel: redshift distribution of the K-band-selected sources from two surveys. Top: K20 survey(Mignoli et al.2005) at a
magnitude limit of K∼ 21.9 (K [Vega]=20) and over an area of 55 arcmin2 (bin = 0.05). The curves represent the model predictions shown in Figure3.
Figure 5. Theoretical differential proto-spheroids source counts in various redshift bins. Upper panel: K-band counts. Lower panel: 160μm counts (normalized to the Euclidean slope). A piecewise-constant continuous formation for proto-spheroids has been assumed as described in Section3.2.
3.5. Observed and Predicted SEDs
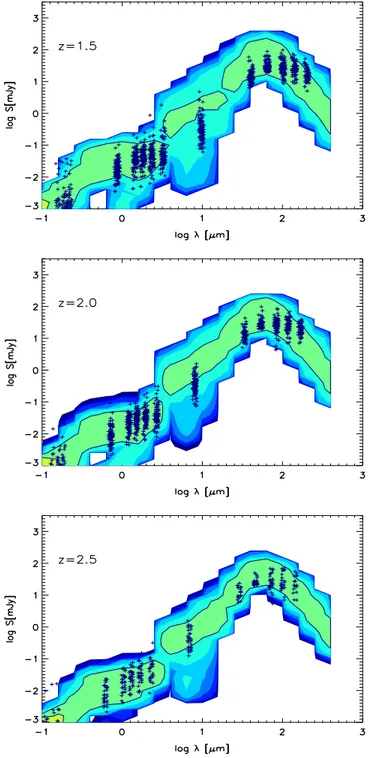
As further check, in this section we aim at testing how the SEDs of our proto-spheroid model galaxies compare with the observed SEDs of the non-spiral galaxies of theGPR13sample. In Figure 7, the theoretical proto-spheroid rest-frame SEDs are compared with the observed SEDs at high redshift (z ⩾ 1.5). The comparison has been performed in the COSMOS field, considering the 160 μm flux limit of 20 mJy, at which the completeness of the survey is close to 100%(see Section3.3).
The model predictions have been computed at three redshifts (z = 1.5, 2 and 2.5), while the observed SEDs have been selected in the redshift bins 1.3 <z<1.7, 1.8 <z<2.2 and 2.3 <z<2.7.
The expected model SEDs have been simulated, at each redshift, starting from the theoretical proto-spheroids LF calculated at 160μm. By construction, the total proto-spheroid
LF at a given redshift z is the sum of LF of the proto-spheroid sub-populations formed at different epochs and present at that redshift. At each luminosity and at each redshift, we can define a weight wirelative to an extant sub-population, given by the ratio between its LF and the total LF at that redshift. The SEDs plotted in Figure7are those of the extant i–th sub-populations at z= 1.5, z = 2, and z = 2.5, each multiplied by its weight wi. Overall, the theoretical SEDs are in satisfactory agreement with the observations of GPR13, in particular at z = 2.5. At lower redshift, the model SEDs are a factor∼5 larger than the ones observed in the mid-IR regime, indicating a warm dust temperature higher than that inferred from the observed galaxies. However, this discrepancy does not affect the main results of this study, which is based on near-IR and far-IR data, where the observed SEDs are in good agreement with the model results.
Figure 6. Observed and predicted K-band rest-frame luminosity function in eight different redshift bins. The model curves for the different populations are plotted in different colors(black solid: total; dotted green: spiral; dot-dot-dot-dashed dark green: SF-AGN (spiral), long-dashed dark green: spiral+SF-AGN (spiral); dashed red: proto-spheroids). Observational data in the local universe are from Kochanek et al.2001(gray squares). In the local universe plot, the red and green shaded areas
represent the 1σ uncertainty regions of the observed LF for early-type and late-type galaxies, respectively. Data points at higher redshift are from Pozzetti et al.2003
3.6. The Effects of Downsizing
The single-mass model described above is designed to describe the evolution of the bulk of the population of spheroids. A more sophisticated treatment should include proto-spheroid models of various masses, suited to study the differential evolution of populations of various masses,
including their downsizing behavior. To this purpose, we use chemo-spectrophotometric models of proto-spheroids of three different present-day stellar masses, and we investigate the effects of downsizing on the main observables considered in this paper.
The three models are characterized by present-day stellar masses of 3 ´1010M, 1011M, and 1012M. The main
parameters describing the models are the star formation efficiency (from 5 up to 20 Gyr−1 for masses between
´
3 1010 and 1012M) and the time of the onset of the
galactic wind(from 0.3 Gyr up to 0.9 Gyr). For further details, the reader is referred to Calura et al.(2014) where the models
are fully described.
In analogy with the method described in Section 3.2, the present-day K-band LF of Kochanek et al. (2001) is used to
normalize the total number density of local spheroids. In this case, the present-day early-type K-band LF is divided into three parts, each one corresponding to a different population. Each population is then evolved backward by means of the corresponding SED, as earlier computed with GRASIL, starting from the star formation history and from the chemical evolution. The three models of different masses are associated with the three proto-spheroid populations as follows. The evolution of the faintest galaxies, i.e., those at K-band magnitudes MK[AB]21, are described by the3´1010M
model. The intermediate mass model, characterized by a present-day stellar mass of1011M, describes the evolution of
galaxies with magnitudes 21MK[AB]23. Finally, the evolution of the brightest galaxies( 23 MK[AB]) is described by the highest-mass model, with a present-day stellar mass of
M
1012 . The stellar masses have been converted to K-band
magnitudes by means of the mass-to-light ratios LM( )t
K
, calculated for each model as a function of the age.
In this case, for each population, the functional form of the formation rated
d N
z is not assumed a priori; this approach would
generate a considerably wide parameter space and a significant degeneracy in the results.
In the last few years, various observational investigations of early-type galaxies have been focused on the determinations of the ages of their stellar populations(Renzini2006), providing
clear relations between present-day stellar masses and forma-tion redshift. Here we assume the relaforma-tion between formaforma-tion epoch and mass as determined by Moresco et al.(2010), based
on the multi-band SED-fitting analysis of a zCOSMOS sample of early-type galaxies up to z= 1. The work of Moresco et al. (2010) presents measures of the lookback time to formation for
galaxies of stellar mass between 1010 and1011M.
In our picture, for each population, the formation rate d
d N
t is
given by a Gaussian function centered at the age measured by Moresco et al. (2010), where the standard deviation
corre-sponds to the associated age dispersion. It is worth stressing that the ages measured by Moresco et al. (2010) have been
converted to our cosmology.
For galaxies of1012M, we assume a mean present-day age
of 12 Gyr, in agreement with other independent studies (see, e.g., Renzini 2006), and we adopt the same s1 uncertainty as the one of the systems of mass1011M.
The three band magnitudes used to divide the local K-band LF have been calculated from the present-day SEDs of our models, computed at the mean age of each population, i.e.,
Figure 7. Comparison between the observed and predicted rest-frame SEDs for proto-spheroids in the COSMOSfield, calculated at the 160 μm survey flux limit, and at three different redshifts(from top to bottom: z = 1.5, z = 2.0, and z= 2.5). In each panel, the observed SEDs are shown as crosses and represent the sources selected in the redshift range1.3< <z 1.7,1.8< <z 2.2 and
< <z
2.3 2.7. The model SEDs have been calculated as described in
Section 3.5 and are represented by the color-coded regions, which express the expected number of sources at wavelengthλ and with flux S, normalized to the total number of sources at that wavelength. The green areas represent regions where the probability offinding a source is greater than 10%.
following Moresco et al.(2010), at ∼7.8, 10.5 and 12 Gyr for
the3´1010, 1011and
M
1012 model, respectively.
In Figure 8, we show our division of the local K-band LF. The vertical dashed lines mark the extremes of the three intervals the LF has been divided into. Each line corresponds to a magnitude value falling halfway between the present-day magnitudes of two contiguous models. The total population of spheroids has then been divided into three populations of different masses. In analogy with our single-mass model, the backward evolution of each population is determined by the evolution of the SED of the corresponding model.
The evolution of the K-band LF obtained by taking into account the effects of downsizing is shown in Figure 9. At redshiftz>2, the observed LF is now slightly underestimated at the break magnitudes, i.e., at MK ~ -22. In principle, this discrepancy could be reduced byfine-tuning the adopted mean age of the 3´1010 and
M
1011 proto-spheroids, e.g., by
slightly increasing this quantity, in agreement with the results of other studies of local early-type galaxies(see Renzini2006).
However, we choose to use the age–mass relation of Moresco et al.(2010) at face value and to not regard this disagreement
as particularly worrying, considering the uncertainty of the present-day age of such objects, of the order of 1 Gyr(Moresco et al.2010).
Another remarkable effect of downsizing in the predicted high-z LF is in the slope of the faint end: in our picture, the least-massive progenitors are very rare atz>2 and this causes a strong fall-off of the LF at MK > -22. In general, at lower redshift, the predicted total K-band LF is in good agreement with the observations.
The effects of the proto-spheroids of various masses are also visible in Figure 10, where we show the far-IR differential counts and redshift distribution. From the top panel of Figure 10, we can see that the total proto-spheroidal
contribution is similar to the ones computed with the single-mass model, shown in Figure3.
The1011M mass model gives a dominant contribution to
the far-IR source counts, in particular in theflux range between ∼2 and ∼30 mJy, and to the redshift distribution from z ∼ 0.8 to z∼ 2 (lower panel of Figure10).
It is also worth noting that the introduction of downsizing allows us to reproduce slightly better than the observed redshift distribution of far-IR sources at z>2.5, thanks to the contribution of the most-massive systems(i.e.,1012M).
The predicted K-band differential counts and the redshift distribution of K-band sources are shown in the top and bottom panels of Figure 11, respectively. In general, the total counts are very similar to the ones shown in Figure4 (upper panel,
i.e., assuming a single-mass model to describe the whole population of proto-spheroids), with the exception of the faint end, where the disagreement between the data and model results is slightly more marked. Once again, this effect could be reduced by fine-tuning the mean age of the 3 ´1010 and
M
1011 mass model (i.e., moving the peak of formation to
higher redshift).
The similarity of the results computed with the single-mass model and obtained with the three-mass models are in agreement with other previous chemical evolution studies of early-type galaxies. In fact, Matteucci & Vettolani (1988)
showed that the chemical enrichment of the intra-cluster medium is dominated by galaxies withL ~L*.
The 1011M mass model dominates the K-band
proto-spheroids source counts from the brighter magnitudes down to K∼ 22, while at fainter magnitudes the low-mass population (i.e., ´3 1010M) becomes the prevailing one.
Consistent with the source counts, the K-band redshift distribution(at the limit magnitude of K ∼ 21.9) shows that the proto-spheroids of 1011M make the main contribution at
>
z 0.5; at lower redshifts, the major contribution is made by the lowest-mass population (i.e., ´3 1010M). The
highest-mass model (i.e., 1012M) population is always negligible
(given the small area of the K20 survey and its low volume density); in the source counts, this population makes a contribution only at very bright magnitudes( K 19).
It is worth stressing that the formation rate provided by the age measures of Moresco et al.(2010) allows us to reproduce
the observed distributions with good accuracy: nofine-tuning of any formation rate was required in this case.
Our main conclusion is that at most magnitudes/fluxes, the main contributors of the total differential far-IR and K-band counts of proto-spheroids are represented by a population of present-day mass which corresponds roughly to the break of the local early-type stellar MF.
3.7. Formation Redshift Distribution and Mass Assembly In Sections3.2and3.6we have shown that it is possible to reproduce a set of multi-wavelength galactic observables across a wide redshift range( ⩽ ⩽0 z 3) by means of a population of late-type galaxies whose behavior is determined empirically by the evolution of their far-IR LF plus a population of proto-spheroids. In Section 3.2, we have assumed a piecewise-constant formation rate across the redshift range 1⩽z⩽5, whereas in Section3.6we have divided the proto-spheroids in three classes of different mass and, for each class, we have assumed an observationally derived age–mass relation. In
Figure 8. Observed local early-type K-band LF from Kochanek et al. (2001).
The red short-dashed line and the red shaded area represent the Schechterfit to the local K-band LF and the associated 1σ uncertainties, respectively. The long-dashed black vertical lines mark the portions of the local LF associated to the three-mass models as described in Section3.6
Figure 12, we show the evolution of the formation rate dN dzform computed in the case of the single-mass model
(dashed line) together with the formation rates of the three populations of spheroids described in Section 3.6 (dashed
areas). These latter curves have been normalized according to the local stellar mass density (SMD) of the corresponding populations and the sum of their integrals has been normalized to one as for the single-mass model. Wefind that the combined contributions of low-mass ( ´3 1010M) and high-mass
(1012M
) spheroid populations sum up to ∼35% of the
present SMD(we adopted 108to 1013Mas extremes for the
integration).
As visible in the plot, the dN dzform function calculated in
the case of the single-mass model is in fairly good agreement with the one corresponding toM*=1011Mof the three-mass
model(i.e., in both cases, at z ∼ 2 half of the total present-day mass has already formed) and obtained by a completely independent method. The global consistency of the two curves,
together with the dominance of theM*=1011M population
atz<2.5(see Section3.6), outlines the validity of our basic
assumption, i.e., that the evolution of the whole proto-spheroid population can be traced by the evolution of galaxies at the break of the present-day early-type K-band LF.
The most direct observables suited to studying the mass assembly history of spheroids is the evolution of their SMD (i.e., Dickinson et al.2003). From the theoretical point of view,
studying how the stellar mass of galaxies grows with time is fundamental to assessing the role of various processes in determining one of the most basic galactic parameters, including the roles of mergers and the relative roles of various quenching mechanisms in driving the galactic star formation histories.
On the other hand, one should bear in mind that the stellar mass is not a direct observable as its observational determina-tion depends on a number of model-dependent assumpdetermina-tions, including the a priori choice of an IMF, a star formation history, and a metallicity: these factors constitute major sources
Figure 9. Observed and predicted K-band rest-frame luminosity function in eight different redshift bins. The solid lines represent the total K-band LFs calculated taking into accounts the effects of downsizing of proto-spheroids as described in Section3.6. The dashed lines represent the contribution of late-type galazies. The shaded areas, solid circles, and open squares are as described in Figure6.
of uncertainty in the observational determination of the stellar mass in galaxies (see, e.g., Pozzetti et al. 2007; Maraston et al.2010).
To calculate this quantity, we convert the K-band LFs as calculated at various redshifts (Section 3.4) and shown in
Figure6 into stellar MFs by means of the mass-to-light ratios t
( )
M LK
computed at the time t and, at each epoch, by properly taking into account the contributions of galaxies born at different epochs.
Our mass-to-light ratios range from R~0.2M L,K,
characterizing the end of the SF epoch, up to a present-day value ofR~1M L,K. Such values are comparable to those
used by other authors(see, e.g., Drory et al. 2004; Narayanan & Davé2013) in theoretical studies of the stellar populations of
early-type galaxies.
The SMD is calculated from the integral of the stellar MF f
(
M,z)
over the mass range 108to 1013M, according to:ò
r z = f
(
M¢ z M d)
¢ M¢*( ) 8 , log . (6)
13
* * *
In the bottom panel of Figure13, we compare the evolution of the stellar mass density calculated for spheroids with various estimates from the literature (see the caption of Figure13for details). The SMD from Ilbert et al. (2013) has been derived in
the COSMOS field from a K-band-selected sample down to K= 24 and using the new UltraVISTA DR1 data release. In Figure13, we show the total SMD as derived by Ilbert et al. (2013), i.e., including both quiescent and late-type systems; the
original values have been divided by 0.55 to convert them from
Figure 10. Upper panel: differential extragalactic source counts normalized to the Euclidean slope at 160μm. The curves represent the model predictions, calculated by taking into account the downsizing of proto-spheroids. The thin solid line with crosses, the thick solid line, and the dot-dashed line represent the contribution of the proto-spheroid population of present-day stellar mass
´
3 1010, 1010, and1012M, respectively; the dotted green line represents the
spiral, the dot-dot-dot-dashed dark green the SF-AGN(spiral), while the long-dashed dark green the spiral+SF-AGN(spiral) populations. The observational data are as described in the top panel of Figure3. In the lower panel, the redshift distribution is shown. The curves are as in the top panel and the observational data are as described in the bottom panel of Figure3.
Figure 11. Upper panel: K-band differential extragalactic source counts calculated taking into account the effects of downsizing in proto-spheroids as described in Section3.6. The curves are as in Figure10. The observational data as described in Figure4. Lower panel: predicted redshift distribution of the K-band-selected sources calculated by taking into account the effects of downsizing. The curves are as above and the observational data are as described in Figure4.
a Chabrier(2003) to a Salpeter (1955) IMF. In Figure13, we also show a compilation of observational data by Santini et al.(2012).
In our scenario, at z>2, the cosmic star formation is dominated by proto-spheroids; in this redshift range, the SMD calculated in this work is consistent with the total estimates of Ilbert et al. (2013) and Santini et al. (2012) within the
uncertainties. This result supports a scenario in which most of the mass at high-redshift (i.e., observed at >z 2) is in spheroids. Moreover, our results indicate that half of the proto-spheroids mass must have formed atz>2, and the remaining mass between z∼ 1 and z ∼ 2.
At lower redshift, the SMD values of Ilbert et al.(2013) and
Santini et al.(2012) are slightly larger than our estimates; this
result is not surprising, as our estimates are lacking the contribution from late-type galaxies.
A detailed study of the contribution of late-type systems to the SMD evolution requires the construction of a library of template SEDs similar to those used in this paper to study proto-spheroids; such a task is deferred to future work.
4. CONCLUSION
In this paper we have interpreted a set of multi-wavelength observations of galaxies across a large fraction of the cosmic epoch ( ⩽ ⩽0 z 3) by means of a new phenomenological approach. Our approach matches a “backward” parametric evolution of late-type galaxies based on the observed IR LFs of
GPR13 to a model for proto-spheroids where the spectro-photometric evolution of dust has been calculated self-consistently on the basis of idealized star formation histories able to account for a large set of observational data. These data include the dust budget observed in local passive galaxies and detected in high-redshift massive starbursts (CPM08; Pipino et al. 2011) and their SEDs as observed in both the local and
distant universe(Schurer et al.2009). This approach has been
developed in order to simultaneously account for observables related mostly to the star formation process and young stellar
populations, traced by far-IR emission, and also for the ones associated with evolved stellar populations whose presence is detected in the near-IR.
As a first step, following GPR13, IR sources have been divided into late-type and potential progenitors of present-day spheroids on the basis of their SEDs and of the evolution of their comoving number density. The number density of late-type galaxies has been parameterized as inGPR13. The number density of proto-spheroids has then been normalized according to the local K-band LF of early-type galaxies from Kochanek et al.(2001). Finally, the evolution of their K-band and far-IR
LFs has been calculated by means of the model SEDs from the physical chemo-spectrophotometric model described in Schurer et al. (2009). We have also tested the effects of mass
downsizing on the observables studied in this paper by dividing the proto-spheroid population into three populations of different masses and tracing their backward evolution by means of chemo-spectrophotometric models of galaxies of present-day stellar masses of3´1010, 1011, and
M 1012 . Our
main conclusions can be summarized as follows.
1. We have considered a continuous formation for proto-spheroids, occurring across the redshift range1⩽z⩽5. In this picture, the proto-spheroid formation is described by a piecewise-constant function, where the key para-meter is the redshift z0.5at which half the population has
formed. To constrain this parameter, we have performed a statistical test by taking into account the following four observables: the source counts and redshift distribution (at the flux limit of the COSMOS field) at 160 μm and the source counts and redshift distribution (at the flux limit of the K20 survey) in the K-band. Our analysis shows that our full set of observables can be reproduced by assuming z0.5 in the interval 1.5⩽ z0.5⩽3. The
adoption of values for z0.5lower than 1.5 implies a poor
description of the 160μm redshift distribution; on the
Figure 12. Differential proto-spheroid formation rate computed in the case of the single-mass model(dashed line) together with the formation rates of the three populations(dashed areas). Each curve is normalized to the present-day stellar mass density of the corresponding population. The curve of the single-mass model is normalized to the total present-day stellar single-mass in early-type galaxies.
Figure 13. Observed and predicted evolution of stellar mass density as a function of cosmic time. The solid and dashed lines are the theoretical SMD calculated for the one-mass and the three-mass models, respectively. The gray circles are the SMD values from the compilation of Santini et al.(2012). The
dashed region represents the estimates from Santini et al.(2012) which take
into account all the glocal sytematic uncertainties. Thefilled gray triangles represent the total SMD as derived in Ilbert et al.(2013).