Do university hospitals perform better
than general hospitals? A comparative
analysis among Italian regions
Sabina Nuti, Tommaso Grillo Ruggieri, Silvia Podetti
To cite: Nuti S, Grillo Ruggieri T, Podetti S. Do university hospitals perform better than general hospitals? A comparative analysis among Italian regions. BMJ Open 2016;6:e011426. doi:10.1136/bmjopen-2016-011426
▸ Prepublication history and additional material is available. To view please visit the journal (http://dx.doi.org/ 10.1136/bmjopen-2016-011426).
Received 5 February 2016 Revised 29 April 2016 Accepted 14 June 2016
Management and Health Laboratory, Institute of Management, Scuola Superiore Sant’Anna, Pisa, Italy
Correspondence to Professor Sabina Nuti; [email protected]
ABSTRACT
Objective:The aim of this research was to investigate how university hospitals (UHs) perform compared with general hospitals (GHs) in the Italian healthcare system.
Design and setting:27 indicators of overall performance were selected and analysed for UHs and GHs in 10 Italian regions. The data refer to 2012 and 2013 and were selected from two performance evaluation systems based on hospital discharge administrative data: the Inter-Regional Performance Evaluation System developed by the Management and Health Laboratory of the Scuola Superiore
Sant’Anna of Pisa and the Italian National Outcome
Evaluation Programme developed by the National Agency for Healthcare Services. The study was conducted in 2 stages and by combining 2 statistical techniques. In stage 1, a non-parametric Mann-Whitney U test was carried out to compare the performance of UHs and GHs on the selected set of indicators. In stage 2, a robust equal variance test between the 2 groups of hospitals was carried out to investigate differences in the amount of variability between them.
Results:The overall analysis gave heterogeneous results. In general, performance was not affected by being in the UH rather than the GH group. It is thus not possible to directly associate Italian UHs with better results in terms of appropriateness, efficiency, patient satisfaction and outcomes.
Conclusions:Policymakers and managers should further encourage hospital performance evaluations in order to stimulate wider competition aimed at assigning teaching status to those hospitals that are able to meet performance requirements. In addition, UH facilities could be integrated with other providers that are responsible for community, primary and outpatient services, thereby creating a joint accountability for more patient-centred and integrated care.
INTRODUCTION
University hospitals (UHs) can be considered as complex organisations given that their mission includes three different objectives: patient care, education and research.1 UHs
combine all the features of Mintzberg’s Professional Bureaucracy2 embedded within both the healthcare organisations and the university context. In addition, UHs are usually referral centres for most complex care within a hub-and-spoke hospital network.3
Given the threefold mission of these insti-tutions and the specific role that they play in the healthcare system, should UHs be consid-ered as a ‘cluster’ with specific performance patterns?
This study investigates whether UHs behave homogeneously regarding perform-ance results with substantial differences with respect to general hospitals (GHs).
Evidence on this topic could provide important information for policymakers and managers in defining specific policies and actions in order to improve the quality of care within the regional network of hospitals, where UHs play a specific and strategic role, and in order to pursue their specific mission. In particular, in Italy as in other countries, UHs are in charge of the strategic role of training doctors of the future. Therefore, since health professionals are the most import-ant assets for the healthcare organisations, policymakers should ensure that clinicians are
Strengths and limitations of this study
▪ This study provides evidence about differences
in terms of performance between university hospitals and general hospitals that was lacking in Italy.
▪ The analysis shows new results about hospital
performance that can contribute to the debate on this topic.
▪ For the first time, a non-parametric approach of
analysis was applied to this topic in the Italian context.
▪ The study is limited to the Italian healthcare
system and its organisational structure.
▪ There could be other performance indicators that
are as valuable and informative as those mea-sures included in the analysis.
Nuti S, et al. BMJ Open 2016;6:e011426. doi:10.1136/bmjopen-2016-011426 1
Open Access Research
group.bmj.com on September 1, 2016 - Published by
http://bmjopen.bmj.com/ Downloaded from
trained and supported by institutions that can ensure the appropriate requirements in terms of quality of care and research productivity. The analysis was carried out in Italy.
BACKGROUND
Teaching status has been already investigated from several perspectives by studying whether it affects the results of UHs compared with other hospitals in terms of out-comes, quality of care, productivity, costs, etc.
First, reviews on outcomes, quality of care and pre-vention of adverse events reached mixed conclusions and highlighted the need for evidence on differences between UHs and GHs.4 5 Some reviews underlined better overall results for UHs,6 7 whereas a systematic review highlighted no differences between UH and GH outcomes.8
Second, studies on productivity and efficiency have usually applied Data Envelopment Analysis (DEA) and frequently highlighted better performance of GHs with respect to UHs.9 10
Indeed, training resident students carrying out research activities besides patient care and the role of referral centres for complex care have often been iden-tified as elements that can increase costs.11–13 This frequently drives additional financial resources to UHs (eg, an increased markup in the reimbursement system for UH discharges).6
Research on this topic presents several differences in terms of data sources, measurement processes and methodology for data analysis.4 This could raise poten-tial issues regarding external validity and result generalis-ability.6–9Examples of these differences are:
▸ The data sources: for example, medical records or administrative data;
▸ The definition of UHs and their ownership (public, private, for-profit, non-profit): for example, some studies consider only major UHs, whereas others include all the hospitals with a residency programme; ▸ The indicators included in the analysis (usually
out-comes, quality of care or efficiency) and the different calculation criteria and risk-adjustment procedure used for the same measures (mortality rates, process measures, etc);
▸ The statistical methods used to compare hospitals ( parametric and non-parametric approaches and tests such as DEA, analysis of variance (ANOVA), Kruskal-Wallis, Mann-Whitney, etc).
These differences may partially explain why research looking at different performance or outcomes in UHs or controlling for a potential effect of the teaching status has not led to straightforward results.
Finally, results may be also associated with the specific geographical context. For instance, in one of the most recent systematic reviews on this topic, more than three-fourths of the studies included in the analysis were con-ducted in the USA.8However, each specific geographical and health system context may play an important role in explaining results.
With reference to Italy, detailed studies are also lacking on this topic. Scholars have focused on govern-ance issues or research evaluations (see, for instgovern-ance, refs. 14–17). There have been no systematic comparisons of performances between the two groups of hospitals and related research.
The Italian context
The national healthcare system in Italy follows a Beveridge Model by providing universal coverage through general taxation. Regional governments are responsible for organising and delivering health services and being accountable for performance. The national government monitors the pursuit of the universal cover-age, in particular with respect to a package of essential services (nationally defined basic health benefit package —Livelli Essenziali di Assistenza). The national gov-ernment allocates financial resources to the regional governments on an adjusted capitation basis. Regions then reallocate resources to Local Health Authorities (LHAs), through a regionally adjusted capitation formula.
In Italy, hospital care is delivered by public GHs directly managed by the LHAs, private or public autono-mous hospitals (AHs), private or public UHs and research hospitals (RHs). AHs, UHs and RHs are autono-mous organisations with respect to LHAs managing the healthcare delivery in their own geographical area.
UHs can be classified considering ownership and dif-ferent institutional and organisational settings.18In Italy, the teaching status can be attributed to hospitals owned by private university medical schools, hospitals owned by public university medical schools and hospitals jointly owned by both public university medical schools and the regional administration. In this last case, the chief execu-tive officer (CEO) is jointly appointed by the two institu-tions. Following the national laws (D.Lgs 502/92 and D. Lgs 517/99), these hospitals are identified as teaching facilities by the Ministry of Health, the Ministry of Education and the Regional Administrations. Regardless of the ownership and the organisational settings, health professionals employed by universities, besides teaching and carrying out research, also provide patients care and receive an additional 30% remuneration. These costs are directly sustained not by the universities but by the hospital administration.
Considering patient care activity, since UHs are autonomous authorities, they are not financed through capitation-based funding as the LHAs, but through dif-ferent financing mechanisms depending on regional strategies.
At the national level, UH inpatient services delivered for residents of other regions are reimbursed considering a diagnosis related group (DRG) tariff increase of 7%.
At the regional level, UHs can befinanced through a pay for service system based on DRG tariffs (eg, Lombardy region) or through a budget-cost control system. In thefirst case, UH DRG tariffs are increased by
2 Nuti S, et al. BMJ Open 2016;6:e011426. doi:10.1136/bmjopen-2016-011426
Open Access
group.bmj.com on September 1, 2016 - Published by
http://bmjopen.bmj.com/ Downloaded from
a certain percentage (usually the 3% circa), depending on the case-mix delivered and the regional strategy. In the second case, as well as in other countries,19 regions usually assign additional resources to UHs through specific funds linked to education, research and complex care delivery (eg, in Tuscany, the amount of these funds accounted for 30% of the UH overall budget). Therefore, UHs receive an additional amount of resources with respect to GHs, but this varies depending on the regional policies.14
Italian UHs have on average a much higher number of hospital beds with respect to GHs and are referral centres for highly complex and highly specialised care, such as neurosurgery, cardiosurgery, radiotherapy, most critical intensive care, paediatric highly complex surgery, etc.
Evidence from Italy on the comparison of UH per-formance with respect to GHs may provide valuable information for both healthcare policymakers and man-agers, at both regional and national levels and not only
in Italy. Indeed, if UHs behave as a specific ‘cluster’, new policies and focused actions could be defined to support the specific role of these authorities within the hospital network in the regional and national contexts. Evidence of similar patterns of performance between these two groups of hospitals may highlight the need to look for other sources of variation. Therefore, other features from the teaching and research status may be relevant to inform policies on hospital governance, financing and network organisation, considering the crucial role of UHs in train-ing the future clinicians for the healthcare system.
The aim of this paper is thus to investigate how UHs perform in comparison to GHs.
METHODS
Data sources and hospital selection
The data used in this analysis were selected from two performance evaluation systems based on the same hos-pital discharge administrative database:
Table 1 IRPES indicators
IRPES indicators Rationale
Efficiency and appropriateness
Relative stay index (case-mix adjusted differential average LOS days)
Measure of the average difference from the standard LOS for admitted patients with adjustments for case-mix.
Percentage of medical discharges with
LOS over the threshold for patients aged 65 and over
Measure of the hospital compliance with the Italian Ministry of Health standards for the LOS for medical inpatient activity for elderly patients. This measure is a proxy for the effective implementation of integrated pathways between home, community-based and hospital care for elderly patients.
Percentage of ED green-coded patients visited within 1 hour
Measure of timely emergency care for ED patients whose treatment may be delayed without risk.
Percentage of ED patients referred for hospital
admission with ED LOS≤8 hours
Measure of overall timely emergency care. Percentage of medical inpatient discharges within
2 days (National Healthcare Agreement 2010)
Measure of hospital compliance in avoiding short ordinary
hospitalisations for patients who could be treated in outpatient clinics or in other care settings, as requested by the Italian Ministry of Health standards in the National Healthcare Agreement of 2010. Percentage of day case surgery for specific
procedures (National Healthcare Agreement 2010)
Measure of hospital compliance with Italian Ministry of Health standards for delivering specific, not complex, surgical procedures in day case surgery or in outpatient clinics rather than through ordinary hospitalisations.
Patient satisfaction
Percentage of patients leaving ED against/without medical advice
Proxy of patient satisfaction on ED services and waiting times. Percentage hospitalised patients leaving against
medical advice
Proxy of patient satisfaction for the inpatient activity. Economic and financial evaluation
Average cost per weighted case Measure of the ratio of a hospital acute inpatient care expenses to
the number of acute inpatient cases weighted for the DRG
complexity. The weighting enhances comparability across hospitals. The measure includes the percentage cost of hospital university staff financed by the regional administration for their patient care activity. This allows to take into account the overall hospital staff costs. Average expenditure per diagnostic imaging weighted
for tariff
Measure of efficiency that compares costs and the value of the delivered diagnostic activity (sum of ambulatory tariffs).
DRG, diagnosis related group; ED, emergency department; IRPES, Inter-Regional Performance Evaluation System; LOS, length of stay.
Nuti S, et al. BMJ Open 2016;6:e011426. doi:10.1136/bmjopen-2016-011426 3
Open Access
group.bmj.com on September 1, 2016 - Published by
http://bmjopen.bmj.com/ Downloaded from
▸ The Inter-Regional Performance Evaluation System (IRPES) developed by the Management and Health Laboratory of the Scuola Superiore Sant’Anna of Pisa (MeS-Lab)—where the authors of this paper are researchers. This system provides a multidimensional evaluation of performance including efficiency, appropriateness, integration and quality of care. This system was first implemented by the regional govern-ment in Tuscany20 21 and was then adopted—on a voluntary basis—by the majority of other Italian regions.i 22 23 The evaluation process measures through benchmarking and with specific risk adjust-ment processes the results achieved every year by all the Health Authorities (the LHAs, the UHs, the RHs and the AHs) located in these regions. Results are publicly reported.24
▸ The Italian National Outcome Evaluation Programme (NOEP) developed by the National Agency for Healthcare Services on behalf of the Ministry of Health. This system measures outcomes nationwide,25 that is, for each Italian hospital. On the basis of rigor-ous risk adjustment processes,26 27 these measures represent assessment tools to support clinical and organisational audit programmes aimed at improving outcome and equity in the National Health Service. Data refer to the years 2012 and 2013, apart from two economic indicators related to balance sheets, which are available only for 2011 and 2012.
Two groups of hospitals were considered in the ana-lysis. The groups differed in particular in terms of whether they had teaching status, and in the organisa-tional autonomy with respect to the LHAs. They also dif-fered in terms of the average number of hospital discharges (in 2012, 32 632 for UHs and ∼17 606 for GHs) and the average DRG weight (in 2012, 1.3 for UHs and 1.06 for GHs). The whole study included all the 15 UHs and 73 LHAs of the 10 IRPES regions.
Performance indicators
For the purposes of this study, 27 performance indica-tors were selected, 10 from IRPES (table 1) and 17 from NOEP (box 1).
Eight IRPES indicators regard efficiency and appro-priateness, patient satisfaction, and economic and financial dimensions. Two indicators regard economic and financial evaluation. This selection was shared by the group of IRPES regional representatives. This group is in charge of systematically reviewing and discussing the measures included in the IRPES as rele-vant proxies for measuring performance in a multidi-mensional perspective in all the different settings of care.22
For both sources of the selected indicators, the time coverage and the number of providers needed to perform the statistical test were guaranteed, thus ensuring the consistency of the comparative analysis between the two groups of hospitals in this single-country study.28 29
The number of observations for the NOEP indicators may differ because not all the hospitals included in the analysis provide all the healthcare services linked to the included measures. However, the selection of these mea-sures took into account the services usually provided by both LHA-GHs and UHs.
The analysis for the IRPES indicators compared the 15 UHs to the 73 LHAs. On the other hand, the analysis for the NOEP indicators was carried out at the hospital level, thus comparing the (at most) 19 facilities of the 15 UHs to the individual (at most) 187 GHs led by the 73 LHAs (see online supplementary appendix I for the complete list of hospitals considered and the number of observations included for each indicator).
Statistical methods
The study was conducted in two stages and by combin-ing two statistical techniques. Data were processed uscombin-ing Stata software, V.12. In stage 1, a non-parametric Mann-Whitney U test was carried out to compare the performance of UHs and GHs on the selected set of indicators. This analysis determines whether UHs and GHs were drawn from the same target population. Previous studies have already applied this univariate ana-lysis to illustrate differences between hospitals30 because of its appropriateness with small samples.31–35 For the purposes of this study, this test verified whether there
Box 1 National Outcome Evaluation Programme (NOEP)
indicators
Outcome: measures of 30-day mortality or readmissions for rele-vant inpatient activity
AMI: 30-day mortality
AMI without PTCA: 30-day mortality
AMI with PTCA within 2 days: 30-day mortality AMI with PTCA after 2 days: 30-day mortality AMI: 1-year mortality
AMI: MACCE after 1 year
Isolated aortocoronary bypass: 30-day mortality
Valvuloplasty or heart valve replacement: 30-day mortality Congestive heart failure: 30-day mortality
Ischaemic stroke: 30-day mortality Ischaemic stroke: 30-day readmission
Chronic obstructive pulmonary disease (COPD) exacerbation: 30-day mortality
COPD: 30-day readmission Proportion of caesarean section Femur fracture: 30-day mortality
Femur fracture: percentage of operations carried out within 2 days Colon cancer surgery: 30-day mortality
AMI, acute myocardial infarction; MACCE, major adverse cardiac and cere-brovascular event; PTCA, percutaneous transluminal coronary angioplasty.
iThe IRPES in 2014 included Basilicata, Emilia-Romagna, Friuli
Venezia Giulia, Liguria, Marche, Autonomous Province of Bolzano, Autonomous Province of Trento, Toscana, Umbria, Veneto. In 2015 Lombardia, Calabria, Lazio, Puglia and Sardegna joined the network.
4 Nuti S, et al. BMJ Open 2016;6:e011426. doi:10.1136/bmjopen-2016-011426
Open Access
group.bmj.com on September 1, 2016 - Published by
http://bmjopen.bmj.com/ Downloaded from
were differences between UH and GH performance, or, in other words, whether UHs and GHs could be consid-ered as two different clusters. In stage 2, we carried out a robust equal variance test to investigate differences in the amount of variability between UHs and GHs.36This test is usually used to verify the assumption of homogen-eity of variance across groups, meaning that the internal variability of one group of hospitals is not significantly different with respect to the other one.
To be in line with the assumptions of the Mann-Whitney U test, we used an extension of Levene’s test as suggested by Brown and Forsythe.37 We applied the test only for those indicators in which the Mann-Whitney U test did not show significant differences between UH and GH performances. Indeed, in those cases where the performance between the two groups did not show significant differences, we tested whether there were specific patterns in terms of variability.
RESULTS
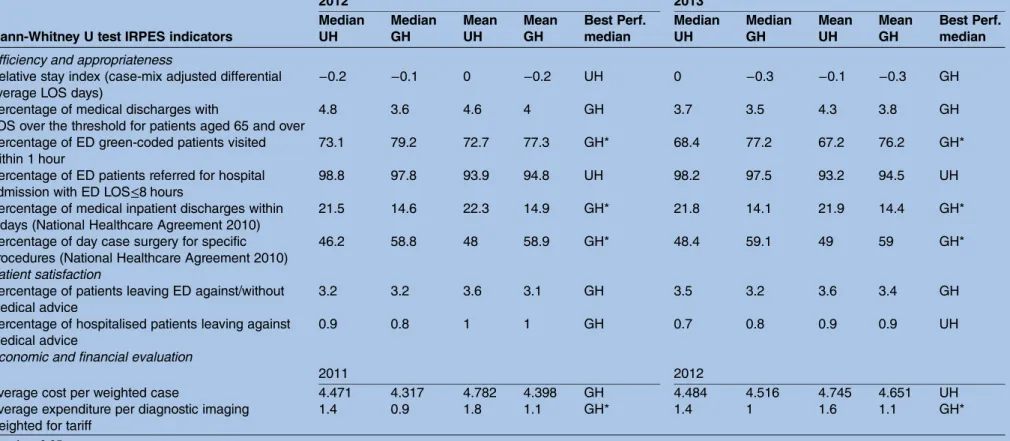
The Mann-Whitney U test on IRPES indicators showed that in relation to four measures of‘Efficiency and appro-priateness’ and ‘Economic and financial evaluation’ dimensions, there were differences in performance between UHs and GHs. The test, in fact, was significant both in 2012 and 2013 for the‘Percentage of emergency department (ED) green-coded patients visited within one hour’, the ‘Percentage of medical inpatient discharges within two days’ and the ‘Percentage of day case surgery for specific procedures (National Healthcare Agreement 2010)’. The test was significant also in 2011 and 2012 for the‘Average expenditure for diagnostic imaging weighted for tariff’. For these indicators, GHs seemed to perform better than UHs.
On the other hand, with reference to the indicators ‘Relative stay index’, ‘Percentage of medical discharges with length of stay (LOS) over the threshold for patients aged 65 and over’, and ‘Percentage of ED patient referred for hospital admission with ED LOS≤8 hours’, the Mann-Whitney U test was rejected for both 2012 and 2013. Moreover, no significant differences were found for patient satisfaction proxies‘Percentage of patients leaving ED against/without medical advice’ and of ‘Percentage of hospitalised patients leaving against medical advice’. Moreover, in 2013, UHs accounted for fewer patients who were discharged against medical advice, whereas in 2012 the GHs achieved better results. The test was also not sig-nificant for the ‘Average cost per weighted case’ and this occurred also after deleting outliers.
Table 2 summarises the results of the test and illus-trates the average and the median values of the two groups of hospitals for each of the indicators.
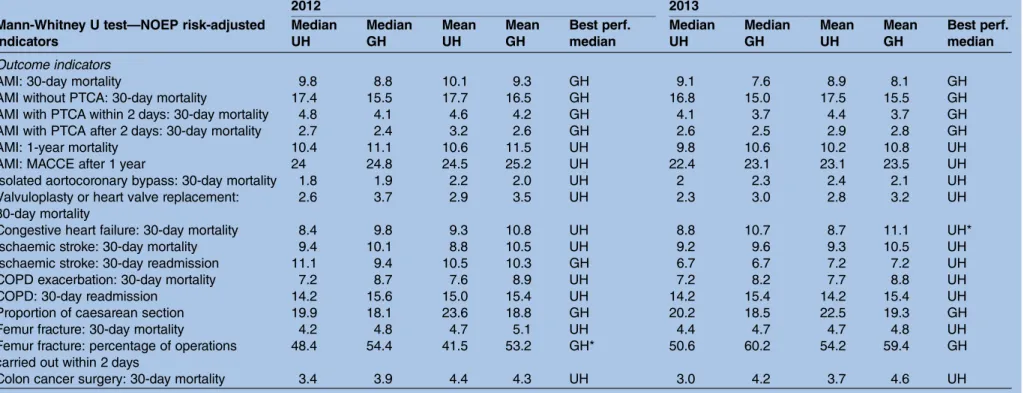
Regarding the test for the NOEP indicators, for all the tested measures, the Mann-Whitney U test was not sig-nificant except for two measures that showed mixed results in 2012 and 2013 (table 3) (in online supplemen-tary appendix II, box plots for IRPES and NOEP
indicators with significant differences between UHs and GHs are shown).
For the‘Congestive heart failure: 30-day mortality’, the test showed no statistical differences between UHs and GHs in 2012. However, a significantly better perform-ance for UHs was found in 2013. Similarly, in the case of the indicator ‘Femur fracture: percentage of operations carried out within two days’, the Mann-Whitney U test showed significant differences between UHs and GHs in 2012, but not for 2013, with GHs having the best median performance.
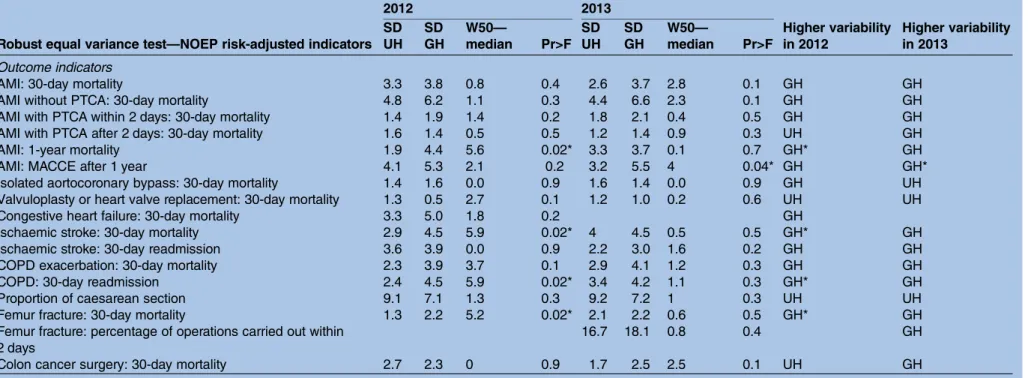
In order to investigate different variations between the two groups of hospitals, the robust equal variance test37 was carried out for a set of 23 indicators (6 IRPES indi-cators and 17 NOEP indiindi-cators) that rejected the Mann-Whitney U test.
Regarding IRPES indicators, the test was always not sig-nificant for both years included in the analysis (table 4). UHs and GHs showed a higher SD depending on the measures considered.
For the 2012 results of NOEP indicators, the test was significant for four measures (table 5):
▸ ‘Acute myocardial infarction (AMI): 1-year mortality’ ( p value=0.02)
▸ ‘Ischaemic stroke: 30-day mortality’ (p value=0.02) ▸ ‘Femur fracture: 30-day mortality’ (p value=0.02) ▸ ‘Chronic obstructive pulmonary disease (COPD):
30-day readmission’ (p value=0.02)
In 2013, the test was significant only for the indicator ‘AMI: major adverse cardiac and cerebrovascular event (MACCE) after 1 year’ (p value=0.04). For these mea-sures, GHs showed a higher SD with respect to UHs. This was also the case for most of the other outcome measures included for 2012 and 2013, apart from the ‘Proportion of caesarean section’ and the ‘30-day mor-tality rate for valvuloplasty or heart valve replacement’.
DISCUSSION
The overall analysis showed heterogeneous results when comparing the two groups of hospitals. Considering the IRPES indicators of appropriateness, we found a higher compliance of GHs in pursuing the Italian Ministry of Health standards on directing patients to the appropri-ate care settings for surgical treatments as well as in avoiding short medical hospitalisations and giving pref-erence to outpatient clinics or day cases. This may be due to the lower complexity of general LHA-led hospi-tals and to a related lower complex management.
Regarding efficiency, in 2013, GHs seemed to perform better than UHs but these results are slightly different in 2012, thus leading to ambiguous conclusions. Therefore, the threefold mission and the greater organisational complexity of UHs seemed to lead to lower but not sig-nificantly different efficiency with respect to GHs. The more straightforward results in terms of the waiting times in ED may be due to the greater pressure in the UH EDs, which are usually located in city centres.
Nuti S, et al. BMJ Open 2016;6:e011426. doi:10.1136/bmjopen-2016-011426 5
Open Access
group.bmj.com on September 1, 2016 - Published by
http://bmjopen.bmj.com/ Downloaded from
Table 2 Mann-Whitney U test for IRPES indicators
2012 2013
Mann-Whitney U test IRPES indicators
Median UH Median GH Mean UH Mean GH Best Perf. median Median UH Median GH Mean UH Mean GH Best Perf. median Efficiency and appropriateness
Relative stay index (case-mix adjusted differential average LOS days)
−0.2 −0.1 0 −0.2 UH 0 −0.3 −0.1 −0.3 GH
Percentage of medical discharges with
LOS over the threshold for patients aged 65 and over
4.8 3.6 4.6 4 GH 3.7 3.5 4.3 3.8 GH
Percentage of ED green-coded patients visited within 1 hour
73.1 79.2 72.7 77.3 GH* 68.4 77.2 67.2 76.2 GH*
Percentage of ED patients referred for hospital admission with ED LOS≤8 hours
98.8 97.8 93.9 94.8 UH 98.2 97.5 93.2 94.5 UH
Percentage of medical inpatient discharges within 2 days (National Healthcare Agreement 2010)
21.5 14.6 22.3 14.9 GH* 21.8 14.1 21.9 14.4 GH*
Percentage of day case surgery for specific procedures (National Healthcare Agreement 2010)
46.2 58.8 48 58.9 GH* 48.4 59.1 49 59 GH*
Patient satisfaction
Percentage of patients leaving ED against/without medical advice
3.2 3.2 3.6 3.1 GH 3.5 3.2 3.6 3.4 GH
Percentage of hospitalised patients leaving against medical advice
0.9 0.8 1 1 GH 0.7 0.8 0.9 0.9 UH
Economic and financial evaluation
2011 2012
Average cost per weighted case 4.471 4.317 4.782 4.398 GH 4.484 4.516 4.745 4.651 UH
Average expenditure per diagnostic imaging weighted for tariff
1.4 0.9 1.8 1.1 GH* 1.4 1 1.6 1.1 GH*
*p-value<0.05.
ED, emergency department; GH, general hospital; IRPES, Inter-Regional Performance Evaluation System; LOS, length of stay; UH, university hospital.
6 Nuti S, et al . BMJ Open 2016; 6 :e011426. doi:10.1136/ bmjopen-20 16-011426 Ope n Ac cess group.bmj.com on September 1, 2016 - Published by http://bmjopen.bmj.com/ Downloaded from
Table 3 Mann-Whitney U test for NOEP risk-adjusted indicators
2012 2013
Mann-Whitney U test—NOEP risk-adjusted indicators Median UH Median GH Mean UH Mean GH Best perf. median Median UH Median GH Mean UH Mean GH Best perf. median Outcome indicators
AMI: 30-day mortality 9.8 8.8 10.1 9.3 GH 9.1 7.6 8.9 8.1 GH
AMI without PTCA: 30-day mortality 17.4 15.5 17.7 16.5 GH 16.8 15.0 17.5 15.5 GH
AMI with PTCA within 2 days: 30-day mortality 4.8 4.1 4.6 4.2 GH 4.1 3.7 4.4 3.7 GH
AMI with PTCA after 2 days: 30-day mortality 2.7 2.4 3.2 2.6 GH 2.6 2.5 2.9 2.8 GH
AMI: 1-year mortality 10.4 11.1 10.6 11.5 UH 9.8 10.6 10.2 10.8 UH
AMI: MACCE after 1 year 24 24.8 24.5 25.2 UH 22.4 23.1 23.1 23.5 UH
Isolated aortocoronary bypass: 30-day mortality 1.8 1.9 2.2 2.0 UH 2 2.3 2.4 2.1 UH
Valvuloplasty or heart valve replacement: 30-day mortality
2.6 3.7 2.9 3.5 UH 2.3 3.0 2.8 3.2 UH
Congestive heart failure: 30-day mortality 8.4 9.8 9.3 10.8 UH 8.8 10.7 8.7 11.1 UH*
Ischaemic stroke: 30-day mortality 9.4 10.1 8.8 10.5 UH 9.2 9.6 9.3 10.5 UH
Ischaemic stroke: 30-day readmission 11.1 9.4 10.5 10.3 GH 6.7 6.7 7.2 7.2 UH
COPD exacerbation: 30-day mortality 7.2 8.7 7.6 8.9 UH 7.2 8.2 7.7 8.8 UH
COPD: 30-day readmission 14.2 15.6 15.0 15.4 UH 14.2 15.4 14.2 15.4 UH
Proportion of caesarean section 19.9 18.1 23.6 18.8 GH 20.2 18.5 22.5 19.3 GH
Femur fracture: 30-day mortality 4.2 4.8 4.7 5.1 UH 4.4 4.7 4.7 4.8 UH
Femur fracture: percentage of operations carried out within 2 days
48.4 54.4 41.5 53.2 GH* 50.6 60.2 54.2 59.4 GH
Colon cancer surgery: 30-day mortality 3.4 3.9 4.4 4.3 UH 3.0 4.2 3.7 4.6 UH
*p-value<0.05.
AMI, acute myocardial infarction; COPD, chronic obstructive pulmonary disease; GH, general hospital; MACCE, major adverse cardiac and cerebrovascular event; NOEP, National Outcome Evaluation Programme; PTCA, percutaneous transluminal coronary angioplasty; UH, university hospital.
Nuti S, et al . BMJ Open 2016; 6 :e011426. doi:10.1136/ bmjopen-2016 -011426 7 Open Acces s group.bmj.com on September 1, 2016 - Published by http://bmjopen.bmj.com/ Downloaded from
Although the differences between GHs and UHs were always not significant, in 2012 GHs accounted for higher patient satisfaction. These results changed in 2013. However, previous research focused only on the patient experience with hospital medical staff in Tuscany showing a higher patient satisfaction for patients dis-charged by UHs with respect to patients hospitalised in GHs (see, among others, ref. 38).
In addition, the test on variability for IRPES indicators showed homogeneous patterns of performance regard-less of the teaching status. In particular, UHs showed a larger variation in the average cost per weighted case, which measures efficiency by comparing the average costs of inpatient cases weighted for the DRG complex-ity. This suggests that, as a group, UHs do not generally account for higher costs, contrary to what has been stated by other scholars.11–13 UHs, as individuals, show highly heterogeneous results. Hence, based on our ana-lysis, the financial and economical sustainability of UHs could be related to the individual internal organisation or other factors rather than to the teaching status.
Finally, for the tested IRPES indicators and consider-ing both the years considered in the analysis, a ‘cluster effect’ linked to the teaching status did not seem plausible.
This is also confirmed by the analysis on the NOEP indicators, which suggested that UHs did not generally achieve better outcomes. These results contribute to the research on this topic by suggesting that there is no straightforward evidence for better outcomes associated with UHs. Interestingly, GHs performed better (although not significantly) considering indicators related to the waiting time for femur fracture surgery and to the recourse to caesarean sections. In most of the mortality and readmission indicators, UHs did perform better but without a significant effect. Considering that UHs are referral centres with higher delivered volumes and patients, it is possible that these better results could also be explained by their role in the hospital network, rather than only by the teaching status, as suggested in other studies.39
In addition, GHs account for a generally higher vari-ability compared with UHs, but without significant dif-ferences. This means that although UHs seem to be generally more concentrated around average values, the extreme values of GH results towards the maximum and minimum of the distribution do not affect the overall analysis results. In conclusion, straightforward evidence identifying better performance and less variability for UHs also does not seem plausible for NOEP indicators.
Summarising these results, from a multidimensional perspective being in the UH rather than the GH group, does not generally affect performance. Hence, the dif-ferent institutional and organisational settings between them do not seem to result in significant dissimilarities. Instead, the variations in hospital performance could be linked to particular features of each individual hospital or its managerial approach. Furthermore, these
T able 4 R obus t equal variance tes t for IRPES indica tors 2012 2013 R obus t equal variance tes t— IRPES indica tors SD UH SD GH W50 — median Pr>F SD UH SD GH W50 — median Pr>F Higher variability in 2012 Higher variability in 2013 Efficiency and appr opria teness R ela tiv e s ta y inde x (case-mix adjus ted differ ential a v er age L OS da y s) 0.9 1.4 0.2 0.6 0.8 1.2 0.7 0.4 GH GH P er centage of medical discharges with L OS o v er the thr eshold for pa tients aged 65 and o v er 1.7 2 0.1 0.8 1.7 2.1 0.7 0.4 GH GH P er centage of ED pa tients referr ed for hospital admission with ED L OS ≤ 8 hours 9 6.7 0.5 0.5 9.7 7.7 0.3 0.6 UH UH P a tient sa tisfa ction P er centage of pa tients lea ving ED agains t/without medical advice 1.9 1.8 0.1 0.8 2 2.1 0 1 UH GH P er centage of hospitalised pa tients lea ving agains t medical advice 0.7 0.7 0.1 0.8 0.6 0.6 0 1 GH GH Economic and financial evalua tion 2011 2012 Higher variability in 2011 Higher variability in 2012 A v er age cos t per w eighted case 1068 785 1.1 0.3 962 850 0.8 0.4 UH UH ED, emerg ency depa rtment; GH, gener al hospi tal; IRPES, Inter-R egion al P erfor mance E valua tion Sy s te m; L OS, length of s ta y; UH, univ ers ity hosp ita l.
8 Nuti S, et al. BMJ Open 2016;6:e011426. doi:10.1136/bmjopen-2016-011426
Open Access
group.bmj.com on September 1, 2016 - Published by
http://bmjopen.bmj.com/ Downloaded from
Table 5 Robust equal variance test for NOEP risk-adjusted indicators
2012 2013
Robust equal variance test—NOEP risk-adjusted indicators SD UH SD GH W50— median Pr>F SD UH SD GH W50— median Pr>F Higher variability in 2012 Higher variability in 2013 Outcome indicators
AMI: 30-day mortality 3.3 3.8 0.8 0.4 2.6 3.7 2.8 0.1 GH GH
AMI without PTCA: 30-day mortality 4.8 6.2 1.1 0.3 4.4 6.6 2.3 0.1 GH GH
AMI with PTCA within 2 days: 30-day mortality 1.4 1.9 1.4 0.2 1.8 2.1 0.4 0.5 GH GH
AMI with PTCA after 2 days: 30-day mortality 1.6 1.4 0.5 0.5 1.2 1.4 0.9 0.3 UH GH
AMI: 1-year mortality 1.9 4.4 5.6 0.02* 3.3 3.7 0.1 0.7 GH* GH
AMI: MACCE after 1 year 4.1 5.3 2.1 0.2 3.2 5.5 4 0.04* GH GH*
Isolated aortocoronary bypass: 30-day mortality 1.4 1.6 0.0 0.9 1.6 1.4 0.0 0.9 GH UH
Valvuloplasty or heart valve replacement: 30-day mortality 1.3 0.5 2.7 0.1 1.2 1.0 0.2 0.6 UH UH
Congestive heart failure: 30-day mortality 3.3 5.0 1.8 0.2 GH
Ischaemic stroke: 30-day mortality 2.9 4.5 5.9 0.02* 4 4.5 0.5 0.5 GH* GH
Ischaemic stroke: 30-day readmission 3.6 3.9 0.0 0.9 2.2 3.0 1.6 0.2 GH GH
COPD exacerbation: 30-day mortality 2.3 3.9 3.7 0.1 2.9 4.1 1.2 0.3 GH GH
COPD: 30-day readmission 2.4 4.5 5.9 0.02* 3.4 4.2 1.1 0.3 GH* GH
Proportion of caesarean section 9.1 7.1 1.3 0.3 9.2 7.2 1 0.3 UH UH
Femur fracture: 30-day mortality 1.3 2.2 5.2 0.02* 2.1 2.2 0.6 0.5 GH* GH
Femur fracture: percentage of operations carried out within 2 days
16.7 18.1 0.8 0.4 GH
Colon cancer surgery: 30-day mortality 2.7 2.3 0 0.9 1.7 2.5 2.5 0.1 UH GH
*p-value<0.05.
AMI, acute myocardial infarction; COPD, chronic obstructive pulmonary disease; GH, general hospital; MACCE, major adverse cardiac and cerebrovascular event; NOEP, National Outcome Evaluation Programme; PTCA, percutaneous transluminal coronary angioplasty; UH, university hospital.
Nuti S, et al . BMJ Open 2016; 6 :e011426. doi:10.1136/ bmjopen-2016 -011426 9 Open Acces s group.bmj.com on September 1, 2016 - Published by http://bmjopen.bmj.com/ Downloaded from
variations may also be determined by the Regional Healthcare System, rather than by a specific cross-regional group affiliation.
In Italy, there is evidence that hospital performance improvement may be affected by regional strategies com-bining different tools.22 This is the case of the Tuscany and Basilicata regions, which applied a combination of different integrated governance tools and registered a higher performance improvement in the past years with respect to other regions.
In fact, with reference to Tuscany, the regional UHs generally achieve a higher performance with respect to the UHs of the other IRPES regions.23–25 40 Nevertheless, the analysis of the impact of these regional strategies on performance of UHs needs to be investi-gated further.
As a preliminary study on this topic, this research pre-sents some limitations. First, the study context focused on the Italian healthcare system and its organisational structure. We believe, however, that the contextual factors strongly influence the results. Therefore, these factors cannot be excluded when the research is aimed at supporting decision-making processes. This study pro-vides evidence to enlarge the debate on this relevant topic in Italy and also in those countries aiming at linking teaching status attribution to performance eation. Second, there could be other indicators as valu-able and informative as those measures included in the analysis. However, we included the ones that regional policymakers and healthcare managers in Italy share as valuable measures to assess and guide the system.
Further studies will investigate the relevance of individ-ual and regional factors in affecting UH and GH results in this multidimensional perspective.
CONCLUSIONS
The mainfinding of this study is that Italian UHs cannot straightforwardly be associated with better results in terms of appropriateness, efficiency, patient satisfaction, eco-nomic and financial evaluation, and outcomes. However, this preliminary evidence may inform the debate on the future role of UHs and encourage further considerations with regard to the Italian healthcare system.
First, if UHs wish to maintain their role of leading players in the hospital network and to be the main actors in charge of training clinicians of the future, hos-pital performance evaluations should be further encour-aged in order to inform the attribution of teaching status based on performance results. This could stimulate wider competition between Italian hospitals aimed at assigning teaching status to those hospitals that achieve the best performance in specific care paths. In this respect, medical schools should base their teaching activ-ities for both undergraduate and resident students in the hospitals that can ensure the best results and prac-tices, since the future generation of clinicians has a crucial role in improving the quality of care.
Second, considering the pressure towards more population-based-oriented healthcare systems, the tional structure of Italian UHs as an independent organisa-tion could be revised towards a more integrated network with other facilities delivering community, primary and outpatient care. UH facilities could therefore be directly integrated with the other LHA-led providers also creating a joint accountability for more patient-centred care. In this perspective, in Italy, recent national legislation (Disegno di Legge n. 2111-B/2016) has allowed as a pilot experience the Special Administrative Regions (such as Friuli Venezia Giulia) to incorporate the UHs within the LHAs.
In conclusion, further studies on this topic will investi-gate whether performance of Italian UHs may be affected by regional strategies and systems of govern-ance, such as the use of a transparent performance evaluation system.
Acknowledgements The authors wish to thank all the IRPES regional representatives and their staff for their invaluable suggestions and collaboration and the MeS-Lab researchers for their help during data processing and results interpretation. They also wish to thank the participants at the Wennberg International Collaborative Spring Policy Meeting 2015 held in June 2015 for their comments on the draft version of this paper. Contributors SN, the lead author, led the study design. TG-R and SP carried out the data collection and the empirical analyses. All the authors were responsible for writing the manuscript and were involved in interpreting the findings and approving the final manuscript.
Funding This work was financed by the Network of Regions adopting the Inter-Regional Performance Evaluation System (IRPES), coordinated by the Management and Health Laboratory of Scuola Superiore Sant’Anna of Pisa, Italy (http://www.meslab.sssup.it).
Competing interests SN, TG-R and SP have support from the network of Italian regions that adopted the IRPES for the submitted work.
Provenance and peer review Not commissioned; externally peer reviewed. Data sharing statement Full dataset is available at https://archiviomes.sssup. it:443/share.cgi?ssid=00AaCOb with open access. No informed consent was necessary because the data used in this study are publicly reported on the following websites: http://performance.sssup.it/netval (IRPES) and http://95. 110.213.190/PNEed15/index.php (NOEP).
Open Access This is an Open Access article distributed in accordance with the Creative Commons Attribution Non Commercial (CC BY-NC 4.0) license, which permits others to distribute, remix, adapt, build upon this work non-commercially, and license their derivative works on different terms, provided the original work is properly cited and the use is non-commercial. See: http:// creativecommons.org/licenses/by-nc/4.0/
REFERENCES
1. Smith T, Whitchurch C. The future of the tripartite mission: re-examining the relationship linking universities, medical schools and health systems.Higher Educ Manag Policy2002;14:39–52. 2. Mintzberg H. Structure in fives: designing effective organizations.
Upper Saddle River, NJ: Prentice Hall, 1983.
3. Palm W, Glinos IA, Garel P, et al. Building European reference networks: exploring concepts and national practices in the European Union. Copenhagen: WHO Regional Office for Europe on behalf of the European Observatory on Health Systems and Policies, 2013. http://www.euro.who.int/__data/assets/pdf_file/0004/184738/ e96805-final.pdf (accessed 26 Jan 2016).
4. Clark J, Tugwell P. Does academic medicine matter?PLoS Med
2006;3:e340.
5. International Working Party to Promote and Revitalise Academic Medicine. Academic medicine: the evidence base.BMJ
2004;329:789–92.
10 Nuti S, et al. BMJ Open 2016;6:e011426. doi:10.1136/bmjopen-2016-011426
Open Access
group.bmj.com on September 1, 2016 - Published by
http://bmjopen.bmj.com/ Downloaded from
6. Ayanian JZ, Weissman JS. Teaching hospitals and quality of care: a review of the literature.Milbank Q2002;80:569–93.
7. Kupersmith J. Quality of care in teaching hospitals: a literature review.Acad Med2005;80:458–66.
8. Papanikolaou PN, Christidi GD, Ioannidis JP. Patient outcomes with teaching versus nonteaching healthcare: a systematic review.PLoS Med2006;3:e341.
9. Hollingsworth B. Non-parametric and parametric applications measuring efficiency in health care.Health Care Manag Sci
2003;6:203–18.
10. Grosskop S, Margatitis D, Valdmanis V. Comparing teaching and non-teaching hospitals: a frontier approach (teaching vs. non-teaching hospitals).Health Care Manag Sci2001;4:83–90. 11. Sloan F, Feldman R, Steinwald B. Effects of teaching on hospital
costs.J Health Econ1983;2:1–23.
12. Iezzoni LI, Shwartz M, Moskowitz MA, et al. Illness severity and costs of admissions at teaching and nonteaching hospitals.JAMA
1990;264:1426–31.
13. Mechanic R, Coleman K, Dobson A. Teaching hospital costs: implications for academic missions in a competitive market.JAMA
1998;280:1015–19.
14. Carbone C, Lega F, Prenestini A. La governance delle Aziende Ospedaliero-Universitarie: perché non funziona, come potrebbe migliorare. In: Cantù E. ed. L’aziendalizzazione della sanità in Italia —Rapporto OASI 2010. Milano, IT: EGEA, 2010.
15. Roversi Monaco MG. Università e Servizio Sanitario Nazionale: L’azienda ospedaliera universitaria. Padova, IT: CEDAM, 2011. 16. Leardini C, Sala GA, Campedelli B. L’azienda ospedaliera
universitaria integrata. Un modello di integrazione tra attività di cura, ricerca e formazione. Milano, IT: Franco Angeli, 2015.
17. Barsanti S, Giovanelli S, Nuti S. Come valutare la ricerca nelle Aziende Ospedaliero-Universitarie? Metodi e proposte operative.
Mecosan2014;90:9–32.
18. Bevan G, Rutten F. The organisation and functions of university hospital in different countries. Finance Account Manag 1987;3:77–115.
19. Bevan G. The medical service increment for teaching (SIFT): a £400 m anachronism for the English NHS?BMJ1999;319:908. 20. Nuti S, Seghieri C, Vainieri M. Assessing the effectiveness of a performance evaluation system in the public health care sector: some novel evidence from the Tuscany Region experience.J Manag Gov2012;17:59–69.
21. Nuti S. La valutazione della performance in sanità. Bologna, IT: Il Mulino, 2008.
22. Nuti S, Vola F, Bonini A, et al. Making governance work in the healthcare sector: evidence from a‘natural experiment’ in Italy.
Health Econ Policy Law2015;11:17–38.
23. Nuti S, Vola F, Amat P. Evaluating the network healthcare system performance. In: Bolzano AP, Trento AP, eds. Apulia, Basilicata, Calabria, Emilia-Romagna, Friuli Venezia Giulia, Lazio, Liguria,
Lombardy, Marche, Sardinia, Tuscany, Umbria, Veneto. 2014 Results of the Italian Regional Collaborative. Pisa, IT: ETS, 2016. 24. Inter-Regional Performance Evaluation System (IRPES). http://
performance.sssup.it/netval (accessed 25 Jan 2016).
25. Italian National Outcome Evaluation Programme (NOEP). http://95. 110.213.190/PNEed15/index.php (accessed 25 Jan 2016). 26. Ash AS, Fienberg SE, Louis TA, et al. Statistical issue in assessing
hospital performance. Quantitative health sciences publications and presentations. Centers for Medicare and Medicaid Services, 2012. http://www.cms.gov/Medicare/Quality-Initiatives-Patient-Assessment- Instruments/HospitalQualityInits/Downloads/Statistical-Issues-in-Assessing-Hospital-Performance.pdf (accessed 25 Jan 2016). 27. Iezzoni LI. Risk adjustment for measuring healthcare outcomes. 2nd
edn. Chicago, IL: Health Administration Press, 1997. 28. Campbell SM, Braspenning J, Hutchinson A, et al. Research
methods used in developing and applying quality indicators in primary care.Qual Saf Health Care2002;11:358–64.
29. Ibraihm JE. Performance indicators from all perspectives.Int J Qual Health Care2001;13:431–2.
30. Garcia-Lacalle J, Martin E. Rural vs urban hospital performance in a‘competitive’ public health service.Soc Sci Med2010;71: 1131–40.
31. Mann HB, Whitney DR. On a test of whether one of 2 random variables is stochastically larger than the other.Ann Math Stat
1947;18:50–60. http://projecteuclid.org/euclid.aoms/1177730491 (accessed 26 Jan 2016).
32. Lehmann EL. Nonparametrics: statistical methods based on ranks. J Appl Math Mech 1977;57:562.
33. Zimmerman DW. Comparative power of Student t test and
Mann-Whitney U test for unequal sample sizes and variances.J Exp Educ1987;55:71–174.
34. Siegel S, Castellan NJJ. Nonparametric statistics for the behavioral sciences. New York, NY: McGraw-Hill, 1988.
35. Hollander M, Wolfe DA. Nonparametric statistical methods, solutions manual. 2nd edn. Chichester, UK: Wiley and Sons Ltd, 1999. 36. Levene H. Robust testes for equality of variances. In: Olkin I. ed.
Contributions to probability and statistics. Palo Alto, CL: Stanford University Press, 1966:278–92.
37. Brown MB, Forsythe AB. Robust tests for the equality of variances.
J Am Stat Assoc1974;69:364–7.
38. Murante AM, Seghieri C, Brown A, et al. How do hospitalization experience and institutional characteristics influence inpatient satisfaction? A multilevel approach.Int J Health Plann Manage
2014;29:e247–60.
39. Dimick JB, Cowan JA, Colletti LM, et al. Hospital teaching status and outcomes of complex surgical procedures in the United States.Arch Surg2004;139:137–41.
40. Nuti S, Marcacci L. The Performance Evaluation System of Health Care in Tuscany—Report 2010. Calenzano, IT: Edizioni del Poligrafico Fiorentino, 2012.
Nuti S, et al. BMJ Open 2016;6:e011426. doi:10.1136/bmjopen-2016-011426 11
Open Access
group.bmj.com on September 1, 2016 - Published by
http://bmjopen.bmj.com/ Downloaded from
among Italian regions
general hospitals? A comparative analysis
Do university hospitals perform better than
Sabina Nuti, Tommaso Grillo Ruggieri and Silvia Podetti
doi: 10.1136/bmjopen-2016-011426
2016 6:BMJ Open
http://bmjopen.bmj.com/content/6/8/e011426 Updated information and services can be found at:
These include:
References
#BIBL
http://bmjopen.bmj.com/content/6/8/e011426
This article cites 25 articles, 4 of which you can access for free at:
Open Access
http://creativecommons.org/licenses/by-nc/4.0/
non-commercial. See:
provided the original work is properly cited and the use is
non-commercially, and license their derivative works on different terms, permits others to distribute, remix, adapt, build upon this work
Commons Attribution Non Commercial (CC BY-NC 4.0) license, which This is an Open Access article distributed in accordance with the Creative
service
Email alerting
box at the top right corner of the online article.
Receive free email alerts when new articles cite this article. Sign up in the
Collections
Topic
Articles on similar topics can be found in the following collections(1087)
Health services research
(522)
Health policy
Notes
http://group.bmj.com/group/rights-licensing/permissions To request permissions go to:
http://journals.bmj.com/cgi/reprintform To order reprints go to:
http://group.bmj.com/subscribe/ To subscribe to BMJ go to: group.bmj.com on September 1, 2016 - Published by http://bmjopen.bmj.com/ Downloaded from