The Transponder Data Recorder: final implementation and
former results
Gaspare Galati1, Mauro Leonardi1, Emilio G. Piracci1, Sandra Costanzo2, Giuseppe Di Massa2, Nicolas Petrochilos3
(1) DIE and Vito Volterra Centre, Tor Vergata University Via del Politecnico, 1 00133 Rome, Italy {gaspare.galati, leonardi.utv, e.piracci }@gmail.com
(2) D.E.I.S. University of Calabria, Rende (CS), Italy, {dimassa, costanzo }@deis.unical.it (3) CReSTIC-LAM University of Reims, Reims, France, [email protected]
Abstract— The Transponder Data Recorder (TDR), equipment implemented for
research purposes at Tor Vergata University, is a designed to receive and to record signals emitted by airborne and vehicular transponders at 1090 MHz (Mode S replies and 1090 ES signals). The prototypal version of the TDR, a mono-channel device, was presented at the ESAV’11 conference in Capri (Italy). Such a prototype has been used to evaluate the design and to define the final version of the TDR. The latter is composed by a uniform linear array with six special wide-band patch elements, five receiving channels (four linear and one logarithmic) and a programmable digital section. Presently the antenna system is placed on the top of the engineering building of Tor Vergata University, in the neighbors of Rome, Italy. The system is used to analyze and record the 1090 MHz channel radio load and to test signal processing algorithms on real signals. Thanks to the cooperation by the Era Company (Czech Republic), the TDR is used in conjunction with two Squid (i.e. Era squitter beacons). The activity goal is to evaluate the performance of vehicular surveillance in an airport area characterized by several 1090 MHz signals sources and a significant multipath scenario.
Keywords- 1090 MHz signals receiver, Mode S, ADS-B, Multilateration, array signal processing
I. INTRODUCTION
Currently, in the frame of air traffic control, several surveillance systems are based on 1090 MHz signals: Secondary Surveillance Radar (SSR) [7], multilateration systems (MLAT) [3], Automatic Dependent Surveillance Broadcast systems (ADS-B) [2], Traffic Information System Broadcast (TIS-B) [2]. The pertaining signals are emitted by: airborne transponders as replies to the SSR interrogations or spontaneously (named squitters, and used by ADS IN systems); vehicular transponders that emits their signals as a reply to an interrogation of a dedicated system (a typical SSR does not include the vehicular transponders surveillance), or unsolicited signals, squitters, used by ADS IN systems; TIS-B stations, that periodically transmit on 1090 MHz signals the information about no-ADS-B-equipped aircraft. All these signals should be used by a multilateration system to locate the source. In this frame it is necessary to have a signals receiver and recorder that provides the 1090 MHz channel live traffic in order to compare with the real environment the proposed algorithms. Therefore, a receiver of the previous mentioned signals was designed and developed. It is named Transponder Data Recorder (TDR in the following); it is a multi-channel receiver, designed and realized at the Radar and Navigation Laboratory of Tor Vergata University, with the collaboration of University of Calabria (antenna design and realization) [4], and Delft University/University of Reims [5] (analog front-end design and signal processing algorithms). A prototypal version [6], made-up by only one receiving channel, was implemented first. It was used to evaluate the choices about the receiver band, dynamic range and to choose the final analog front-end components. The TDR system provides the possibility to receive, record and apply any signal processing techniques, to the 1090 MHz traffic. It is possible to analyze the channel load and characteristics, and to test and evaluate the algorithms under study.
II. TDR SYSTEM DESIGN AND IMPLEMENTATION
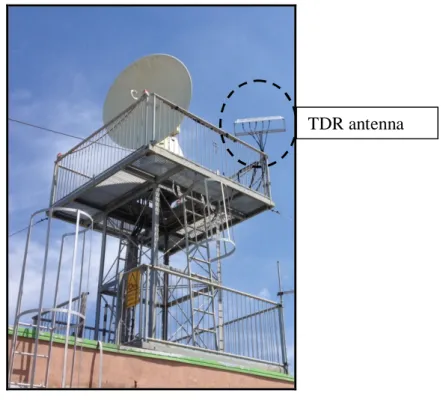
The TDR is a multi-channel receiver composed by four independent linear channels and one logarithmic channel. Each receiving channel is connected to an array element. This layout permits to use array processing techniques with the linear channels, but also to use the TDR as a mono-channel receiver. The logarithmic channel, that provides a base-band signal, is used in those applications which are based on signal amplitude and also as a signal detector. The system is deployed in the engineering faculty of Tor Vergata University in Rome, Italy. The antenna system, that is an array of six patch elements, is placed on the building roof. (the side elements smooth the side discontinuity effect for the inner array at four elements). Figure 1 show a photo of the installation.
Figure 1. Photo of the antenna placement
The system has been designed in order to receive 1090 MHz signals from airborne transponders in a range from 100 m up to 200 km, and from vehicular transponders (Squid) from 5 m up to 5 km. The sensitivity, the dynamic range and the receiver band necessary to attain these specifications have driven the design for the analog front-end. The digital section of the system, samples and acquires the signals and permits the signal processing after recording. The chosen digital section is an integrated commercial solution, with three acquisition cards (each one with two input channels), with a high sampling rate, in order to acquire the linear channels directly at the intermediate frequency (21,5 MHz). This digital acquisition system provides a software development environment, useful to implement the receiving and decoding routines. It is usable not only as a TDR component but also for other applications. Figure 2 shows the overall block diagram of the TDR system.
Figure 2. Overall structure of the TDR
A. The antenna
The antenna is an array of six patch elements, placed at half wave-length distance, over a metallic ground plane. It was designed and implemented by Microwave Lab at Università della Calabria. The return loss of each patch element immersed into the array has been experimentally characterized, and the radiation patterns provided by the various array elements have been measured. Figure 3 shows a photo of the antenna.
Figure 3. Photo of the six elements antenna
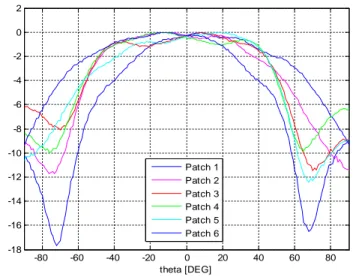
The patch element is placed on a stratified dielectric support, and it is excited by a coaxial probe. The design and implementation provides a return loss less than -10 dB in a band wider than 40 MHz centered at 1090 MHz. This is more than enough for the TDR purposes. Figure 4 shows the experimental radiation patterns of each element, according to the measurements developed in the anechoic chamber at Università della Calabria [8]. The radiation pattern has an useful wide pattern in both directions, by setting a properly tilt, to cover air and surface traffic.
-80 -60 -40 -20 0 20 40 60 80 -18 -16 -14 -12 -10 -8 -6 -4 -2 0 2 theta [DEG] Patch 1 Patch 2 Patch 3 Patch 4 Patch 5 Patch 6
Figure 4. Radiation pattern of each array element
Figure 5 shows the antenna location, in Rome, close to Ciampino airport and 30 Km away from the Rome International airport Fiumicino, Leonardo da Vinci, the dotted line highlights the boresight pointing between both airports.
Figure 5. TDR antenna location
The antenna can be tilted from 0° to 90°. For air traffic recording sessions the tilt was set at 45°, and for vehicular recording sessions it was set at 90° (figure 6).
Figure 6. TDR antenna tilt
The four central elements of the array are connected to four linear channels, one side patch is connected to the logarithmic receiver, while the other side element is connected to a matched (50 Ohm) load. Finally the implemented antenna has shown full compliance to the requirements, in terms of pass-band and coverage. Using the antenna with a commercial mode S receiver (the Air Nav system Radar Box [12]), it was possible to characterize the general antenna behavior in azimuth by plotting the position of the aircraft equipped with ADS transponders. Figure 7 shows the results of this recording session, highlighting the compliance of the measured antenna pattern, with the typical azimuth beam of a patch, including the secondary lobes.
Figure 7. TDR antenna coverage pattern
B. The analog front-end
As mentioned above, the design of the analog front-end for the linear channels and the logarithmic receiver was driven by the requirements on minimum and maximum targets range. Considering an airborne transponder transmitting between 21 and 27 dBW (standard [10]), and a vehicular non-transponder device with an emitting power between 10 and 13 dBW, and setting the requirements on the maximum and minimum target range (5 km / 5 m for vehicles,
200 km / 100 m for aircraft), the needed dynamic range and sensitivity have been derived. It results a signal level at the antenna of:
- 93,72 dBm to -10,20 dBm for aircraft - 70,18 dBm to + 1,82dBm for vehicles.
To be in compliance with the requirements, it was decided to fix the nominal gain of the chain, and to shift the dynamic of the receiver using a variable attenuation, in order to use the receiver in a ‘near-airport area’ where the closeness of the sources should saturate the receiver, and in a ‘en route area’. The necessary gain of the chain is demanded to two amplifiers among which is placed the supplementary attenuation. Figure 8 shows this concept. It is possible to change the attenuation of the logarithmic channel independently from the linear channels.
Figure 8. Receiver dynamic range
The linear chains are composed by the RF section, from the antenna cable to the mixer, and by the IF section from the mixer to the channel output. The RF section is composed by power limiter, a first band-pass filter, the first low noise amplifier, the variable attenuator, the second low noise amplifier and the second filter, then there is the mixer. The IF section is composed by a band-pass filter and a DC-block. The RF signal is down-converted at the intermediate frequency of 21,5 MHz. This value of the IF permits to use commercial components for the IF band-pass filter, and permits also the direct sampling at 50 MS/s as well as at 100 MHz. The local oscillator provides a reference at 1068,50 MHz; it is composed by a quartz oscillator at 10 MHz and a PLL (phase-locked loop). There is only one PLL in the TDR, and its reference signal is split into four signals to feed each mixer on the four linear chains, then each linear channel use the same phase reference for the downconversion. Figure 9 shows the block diagram of a linear channel
Figure 9. Analog linear channel
The band-pass filter of the RF section are of the SAW (surface acoustic wave) type, characterized by a low insertion loss (2,3 dB) and a good rejection at 1030 MHz (40 dB). The pass-band at 3 dB is 30 MHz enough for the interesting signals band. The low noise amplifier is characterized by a low noise figure ( 0,8 dB) and a nominal gain of 30 dB with a gain flatness of ± 0,5 dB in the interesting band. After the mixer, that has a loss of 8 dB, the signal is converted at IF and it is filtered with a band-pass centered at 21,5 MHz, finally there is DC block to avoid bias components. The nominal gain of the linear channel is 40 dB. The logarithmic channel is quite similar, with the output of the second SAW filter being connected with the logarithmic receiver. The logarithmic receiver, has an RF input linear dynamic range of 60 dB, from -65 dBm to -5 dBm.
All the components chosen to realize the analog linear and logarithmic channels are connectors models, this allowed to avoid the costs of the PCB studying and developing (critical at RF) versus the greater space needed and the greater attenuation due to connectors and cables. Moreover this choice permits the easy change of the components. The analog section of the TDR (linear channels, logarithmic channel, PLL and power supply devices) is contained in three rack frames.
C. The digital section
The digital section samples the channels with a common clock, with potential for high sampling rate (up to 100 MSamples/s) to perform a fine reconstruction of the signals from the various channels. To acquire the linear channel directly at IF the sampling frequency can be 50 or 100 Msamples/s, while for the logarithmic channel a lower value can be at least equal to 10 MHz. The core of the digital section is based on the NI PXI 1082 controller. There are three acquisition cards (NI PXI 5122), with two analog input channels each. Figure 10 shows a photo of the analog and digital sections of the TDR, and the photo of figure 11 shows a screen shot of the acquisition software developed in the NI programming environment. On the bottom, to the right is visible on the control display a received mode S signal.
Figure 10. Digital (on the left) and analog sections of the TDR
III. TDR RESEARCH FRAME
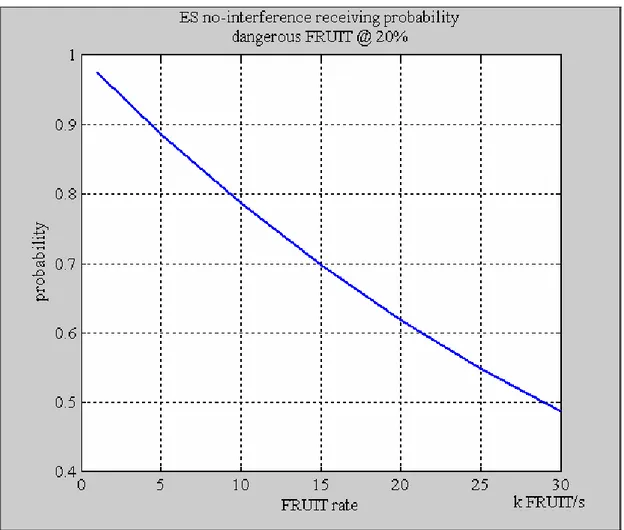
The TDR system is currently operating at Tor Vergata University, with the antenna boresight directed between two airports that are 6 km and 30 km away (fig. 5). The coverage area is characterized by a fairly high air traffic density. Actually the TDR is involved in activities of 1090 MHz signals processing methods: study and developing of algorithms to avoid the problems of signals interferences. As stated before, several air and airport surveillance systems are based on airborne and vehicular transponders. Considering the sources (transponders) emissions as asynchronous, (transponders with squitter capability), the probability of interferences between signals from different sources are not negligible, especially in high density traffic area and/or when using omnidirectional antenna. As shown in figure 12 the free-interference probability for an extended squitter could decrease dramatically as the FRUIT (false replies unsynchronized in time), that is representative of the traffic load, increases.
Figure 12. Extended Squitter (ES), probability of no-interference versus the FRUIT rate The plot is obtained by the poissonian law ( )
exp
! n T P n T n
, deriving the probability of no interference (n = 0) in the time support of an extended squitter (T = 120 μs), and varying λ (FRUIT rate) from 103 to 30 * 103. Moreover λ was weighted with the constant 0,2 in order to take in account that only the 20% of the FRUIT emitters are in a range such that their messages could have an amplitude to be considered as interfering.
In this context one research activity at Tor Vergata University is focused on the study of blind source separation signal processing algorithms useful to detect and solve interference event. The usage of the TDR consist in: a) the recording and signals detection, using the logarithmic channel, in order to analyze the traffic characteristics and obtain statistical indicators to implement an air traffic model; b) the acquisition and recording of signals by the linear
channels, to be used as live signals database for the signal processing algorithms tests; c) acquisition and recording session using the Era Squid [14] vehicular squitter beacon, d) implementing a software for signals detection and decoding, capable to extract the sources, in order to evaluate the system performance for vehicular localization. The following three sub-paragraphs introduce a brief presentation of the mentioned activities.
A. Channel traffic model
Using the logarithmic channel of the TDR, it was possible to record the data stream to perform a channel traffic analysis. As presented in [13], the analysis of the received signals power, considering the receiving chain gain, the antenna gain and the assumed transponder power, allows us to estimate the range distribution of aircraft that transmitted the received signals. The detection and decoding of 1090 MHz signals allows us to measure the traffic load and its characteristics, interferences rate included. From [13], the FRUIT rate in the area around the actual TDR placement is low, but the probability to receive interfered mode S signals is not negligible (about 8% over all the received mode S signals). A complete air traffic model is useful for an analytic evaluation of the effectiveness of the implemented algorithms.
B. Blind Source Separation algorithms for 1090 MHz signals
Receiving superimposed signals from different sources often results in the complete loss of the received signals, especially with the actual receiver technologies. We studied different signal processing algorithms in order to discriminate and separate overlapping sources: one method is a single channel BSS algorithm [13], the others are space-time algorithms and thus need a multi-channel receiver and an antenna array [9]. One difficulty is due to the interfering signals, although emitted by different sources, having nominally the same central frequency and the same spectral occupancy. The aspect that is useful for our scope is the sparsity property of the sources. The array processing methods exploit the signals diversity in terms of different impinging directions at the array. The sparsity property permits to use time support in which only one source is present to derive the beamformers. The methods belonging to the
projection family [9] have been analyzed and implemented. In this case the TDR is useful to
extend the records for the algorithms trials. The geometric class methods [15] need a depth study and an implementation work, for which the TDR will play an important role during the study phase and for the performance evaluation test. Currently, the single channel method, which is based on joint exploiting of sources sparsity and diversity, in terms of frequency shift, is under study to complete the evaluation phase. In this case the TDR is used as a mono-channel receiver, acquiring by only one linear mono-channel. The single-mono-channel algorithm, named
PASA (Projection Algorithm for Single Antenna) as illustrated in [16] and in [13], performs
overlapping sources separation by exploiting the signals diversity due to the tolerance of the transponder central frequency . The array processing methods presented in [9] separate sources by exploiting the signals direction of arrival as signals diversity, needing an array antenna and a multi-channel receiver. On the other hand, PASA is based on a signal vector reshaping that reorganize the acquired signal samples into a matrix. The last results obtained using single channel signals recorded with the TDR, shows a success rate of 93,5% for the leading reply and 64,2% for the trailing reply. These results are observed over a set of 109 signals composed by two overlapping mode S replies, and a success event is when after the algorithm application the reply is detectable and decodable without errors. Figure 13 shows one linear channel at IF where a signal is composed by two overlapping mode S replies, figure 14 shows the sources separation achieved by the application of PASA algorithm The planned work on PASA consists of a extended tests with more signals, and the correlation between the overlapping signals characteristics (frequency shift, time delay, amplitude ratio) and the algorithm behavior.
20 40 60 80 100 120 -0.01 -0.008 -0.006 -0.004 -0.002 0 0.002 0.004 0.006 0.008 0.01 s V Linear channel
Figure 13. Two overlapping mode S signals – linear channel
0 2000 4000 6000 8000 10000 12000 14000 0 0.2 0.4 0.6 0.8 1 sample first reply 0 2000 4000 6000 8000 10000 12000 14000 0 0.2 0.4 0.6 0.8 1 second reply sample
C. Era Squid test
TDR is involved also in a study devoted to implement enhanced technique for ground surveillance by vehicular squitter in a complex area like an airport. The scope is to develop a system and signal processing techniques useful to improve the probability of detection of vehicles and some aircraft at ground. The project, that is at preliminary phase, include experimental surveillance using a Squid provided by Era. Figure 15 shows the Squid track acquired during a trial. The figure is composed using Google Earth centered on the TDR antenna position. The plots are represented with white squares, and the dotted magenta line is the direction of the antenna boresight.
Figure 15. Vehicular surveillanc test
To complete the project a real time decoding and plot extracting software is needed, to avoid blind period. The experimental sessions will be useful also to evaluate if there is necessary an antenna study, to avoid the air traffic signals. Finally, thanks to Era double supply of Squid, it will be possible also to analyze signals interferences between ground sources.
IV. CONCLUSIONS AND FUTURE WORK
The transponder data receiver (TDR) is a multi-channel system useful to receive, record and process 1090 MHz signals from airborne and vehicular transponders (SSR mode S and conventional). It is composed by a six patch elements array antenna, connected to 4 linear channels, one logarithmic receiver and a dummy load. The digital section is based on COTS technologies. The TDR system has been designed in the research frame on the ADS-B/MLAT to develop and test new signal processing algorithms, to analyze the 1090 MHz channel traffic and to study a ground dedicated surveillance system. Actually it is operating at the Tor Vergata University in Rome, Italy. The TDR is involved in research programs for the enhancement of airport and ATC surveillance systems. It is useful to create live signals database, implement real-time systems with signal processing capabilities, and to analyze air traffic characteristics.
Acknowledgements
The authors are grateful to ERA A.S. who supplied the two Squid devices used for the measurements.
References
[1] M. Kayton, W. Fried, “Avionics Navigation Systems”, Wiley Interscience 1997.
[2] MOPS for 1090 MHz ES ADS-B and TIS-B, Volume 1, RTCA DO-260A, 2003 RTCA Inc.
[3] MOPS for mode S multilateration systems for use in ASMGCS, ED117, Eurocae 2003 [4] G. Di Massa, S. Costanzo, A. Borgia, I. Venneri, G. Galati, M. Leonardi, E.G. Piracci,
“Multiple sources discriminationa by array processing”, Proceedings of EuCAP’11, Rome 11-15 April 2011.
[5] N. Petrochilos, Algorithms for separation of SSR replies, PhD thesis, Delft University Press 2002
[6] G. Galati, M. Leonardi, E.G. Piracci, N. Petrochilos, S. Samanta, “ The Trasponder Data Recorder: first implementation and applications”, in: Proceedings of TIWDC/ESAV 2011, September 12-14, 2011, Capri, Italy
[7] M.C. Stevens, “Secondary Surveillance Radar”, Artech House 1988.
[8] G. Amendola, S. Costanzo, V. Martire and G. Di Massa, “A broadband microstrip antenna for SAR applications,” in Proc. of 1999 IEEE AP-S Int. Symposium, 1999, Orlando (Florida)
[9] N.Petrochilos, G. Galati, and E. Piracci, “Application of array processing to receiving stations of multilateration systems based on SSR signals,” IEEE Transactions on
Aerospace and Electronic Systems, Vol. 45 n.3 pp. 965-982, July 2009.
[10] ICAO Annex 10 to the convention on international civil aviation, Vol. IV, 1998. [11] DO260A, RTCA MOPS for 1090 Extended squitter ADS-B and TIS-B.
[12] Website: http://www.airnavsystems.com/radarbox/
[13] E.G. Piracci, N. Petrochilos, G. Galati, “1090 ES receiving capacity improvement using ADS-B ground receivers with signals discrimination capability”, in: Proceedings of ESAVS’10, Berlin, Germany 16-17 March 2010.
[14] http://era.aero/products/squid-by-era/
[15] N. Petrochilos, G. Galati, E.G. Piracci, “Coherent sources separation based on sparsity: an application to SSR signals”, International Journal of Microwave and Wireless Technologies, Vol. 1 Issue 3 pag. 185-191, Cambridge University Press 2009
[16] E.G. Piracci, N. Petrochilos, G. Galati, “Super imposed Mode S signals: Single Antenna Projection Algorithm and processing Architecture”, IEEE International Symposium on Signal processing and information technology ISSPIT 2007, Cairo, Egypt, 15-18 December 2007
[17] C. Reck, U. Berold, J. Schuer, and L.P. Schmidt, “Direction of arrival sensor calibration based on ADS-B Airborne position telegrams”, in: Proceedings of European Radar Conference, Rome, Italy 2009