POLITECNICO DI MILANO
Corso di Laurea MAGISTRALE in Ingegneria Biomedica Dipartimento di Elettronica e Informazione
Brain plasticity mechanisms underlying
motor control reorganisation: a
longitudinal study on post-stroke subjects
NEAR Lab
Neuroengineering and Medical Robotics
Relatore: Prof.ssa Alessandra Pedrocchi Correlatore: Ing. Marta Gandolla
Tesi di Laurea di: Lorenzo Niero, matricola 859230
Contents
Sommario 9
Summary 21
1 Introduction 33
2 Dynamic Causal Modeling 41
2.1 Introduction – DCM for fMRI . . . 41
2.2 Neuronal state equations . . . 43
2.3 Hemodynamic model . . . 45
2.4 Parameters Estimation . . . 48
2.5 Model priors . . . 50
2.6 Inference . . . 51
2.6.1 Bayesian Model Selection (BMS) . . . 51
2.6.2 Model Space . . . 54
2.6.3 Post-hoc BMS (model reduction) . . . 55
2.6.4 Inference on parameter space . . . 57
2.6.5 Parametric Empirical Bayes (PEB) . . . 58
3 Materials and Methods 65 3.1 Subjects . . . 65
3.2 Capacity Score (CS) and Carryover Effect (CE) . . . 67
3.3 Experimental set-up . . . 69
3.4 fMRI task design . . . 70
3.4.1 FES stimulation paradigm . . . 71
3.5 fMRI pre-processing . . . 71
3.6 Statistical analysis and DCM analysis . . . 72
3.6.1 ROIs selection . . . 72
3.6.2 Model Selection procedure - inference about model structure . . . 75
3.7 Objectives of the study and starting hypotheses . . . 81
4 Results and Discussion 83
4.1 Results . . . 83
4.1.1 Participants . . . 83
4.1.2 DCM results . . . 83
4.2 Discussion . . . 89
5 Conclusions and Future research directions 99 Bibliography 103 A MRI and fMRI principles 119 A.1 MRI principles . . . 119
A.1.1 The net Magnetisation Vector . . . 120
A.1.2 Effects of Radio frequency Pulses . . . 121
A.1.3 MR relaxation processes . . . 122
A.1.4 MR Imaging . . . 124
A.1.5 MRI sequences . . . 126
A.2 BOLD signal . . . 128
A.3 fMRI artifacts and Noise . . . 130
B Statistical Parametric Mapping (SPM) 131 B.1 fMRI analysis . . . 131
B.1.1 Image pre-processing . . . 132
B.1.2 The General Linear Model (GLM) . . . 146
B.1.3 Statistical Inference (Contrasts) . . . 151
C Expectation-Maximisation (EM) algorithm 157 C.1 E-step . . . 157
List of Figures
1 . . . 15
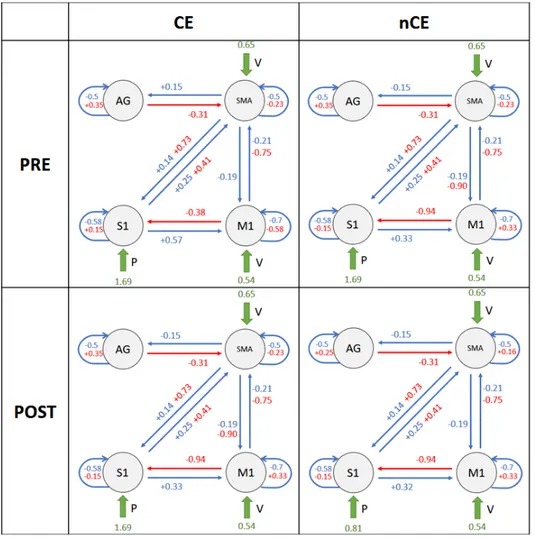
2 2 × 2 factorial representation of patients model structure, along with estimated parameter posterior means. Values are obtined as θi = βmean± βcarryover± βtime. Blue values are
relative to intrinsic connections in matrix A, red values are relative to modulatory effects of input E (FES) in matrix B, green values indicate driving inputs (V, E, P) contribution in matrix C. Values are reported for each subgroup, localised as follows: in the upper left panel is the CE-PRE subgroup; in the upper right panel is the nCE-PRE subgroup; in the lower left panel is the CE-poST subgroup; in the lower right panel is the nCE-POST subgroup . . . 17
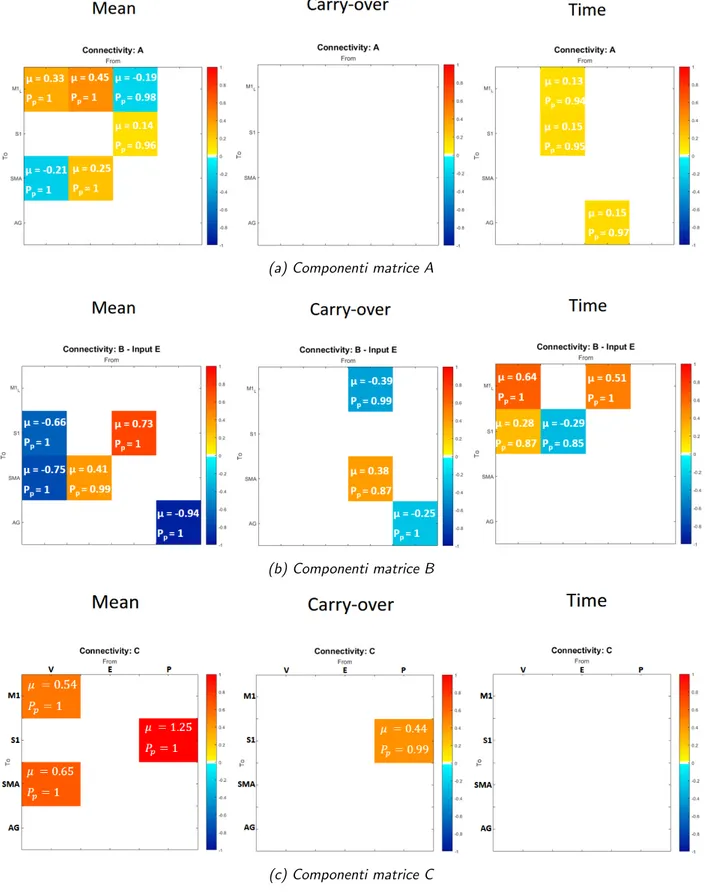
3 Valori stimati a secondo livllo, suddivisi per ognuna delle ma-trici a primo livello (A, B, C), relativi ai 3 regressori. Da si-nistra a destra i pannelli riportano: media di gruppo (βmean);
effetto carryover (βcarryover); tempo (βtime). . . 19
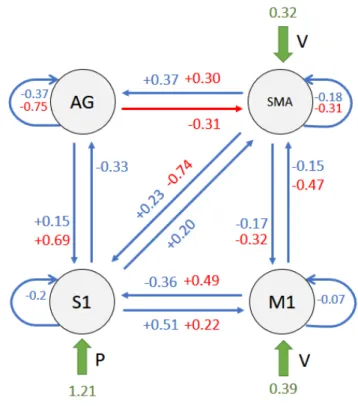
4 Model connectivity structure. Overall representation of final resulting model for healthy subjects; blue values are relative to intrinsic connections in matrix A, red values are relative to modulatory effects of input E (FES) in matrix B, green values indicate driving inputs (V, E, P) contribution in matrix C. . 26
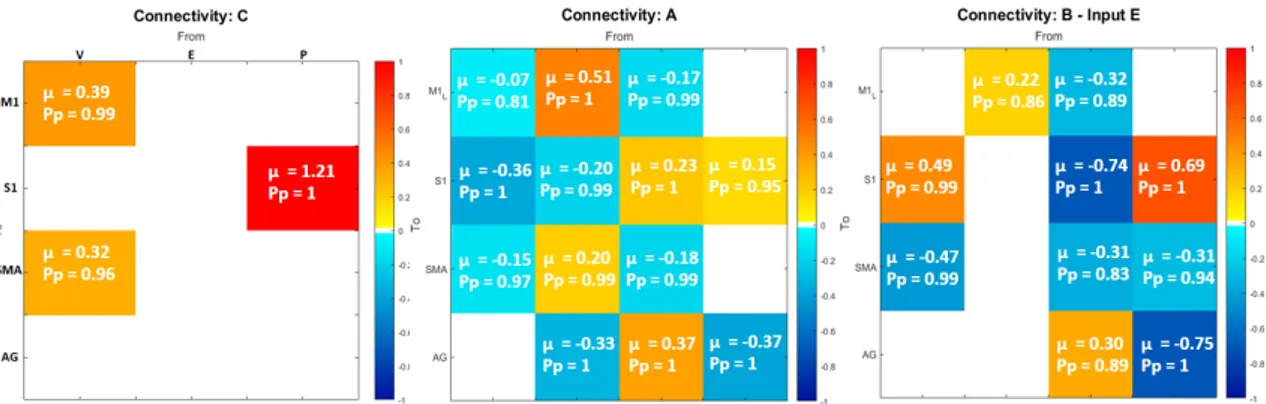
5 Matrix representation. Estimated posterior means µ and their significance level Pp, expressed for each first level matrix
(from left to right: C - driving inputs; A - intrinsic connectiv-ity; B - modulatory effects of input E). . . 27
6 2 × 2 factorial representation of patients model structure, along with estimated parameter posterior means. Values are obtined as θi = βmean± βcarryover± βtime. Blue values are
relative to intrinsic connections in matrix A, red values are relative to modulatory effects of input E (FES) in matrix B, green values indicate driving inputs (V, E, P) contribution in matrix C. Values are reported for each subgroup, localised as follows: in the upper left panel is the CE-PRE subgroup; in the upper right panel is the nCE-PRE subgroup; in the lower left panel is the CE-POST subgroup; in the lower right panel is the nCE-POST subgroup. . . 28 7 Second level estimates (µ) and their significance level (Pp),
subdivided for each of the first level matrices (A, B, C), relat-ive to 3 regressors. From left to right panels represent: group mean (βmean); carryover effect (βcarryover); time (βtime).
Col-our levels express the magnitude of the value, i.e., red tones are for positive values, blue tones are for negative values . . . 30 2.1 A schematic representation summarising the meaning of
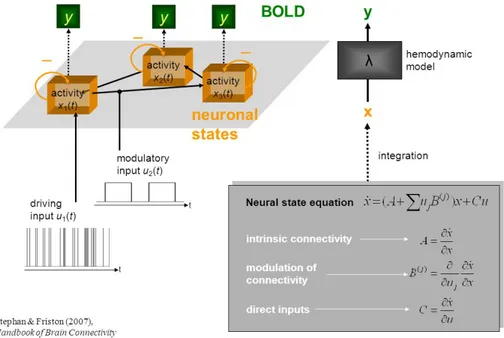
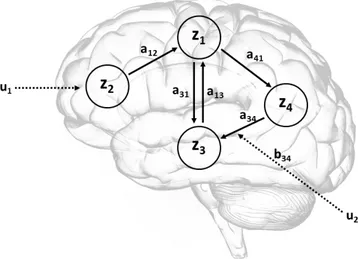
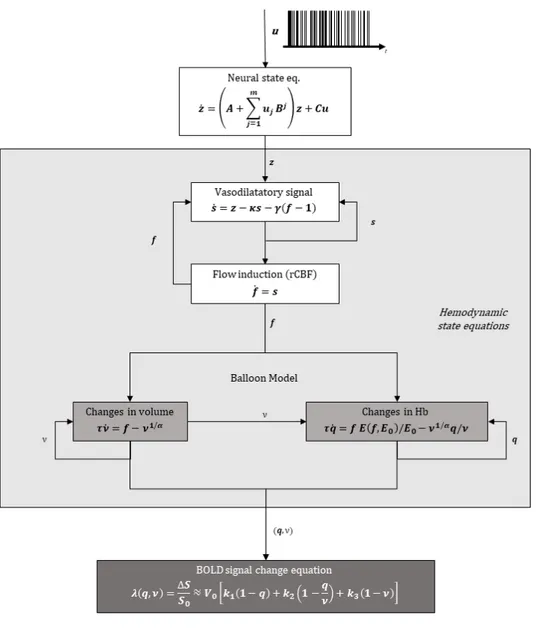
para-meters in the bilinear equation and the forward mapping of neural states into BOLD response . . . 41 2.2 A schematic showing a system of connected brain regions,
having one input that influence the system directly (u1) and
one that modulates connections between regions (u2). . . 44
2.3 Schematic of the complete forward model. . . 47 2.4 Schematic occam’s window . . . 58 3.1 The site of cerebral infarction as determined from the
T1-weighted structural MRI. ** indicates patients with FES carry-over; * indicates patients with no FES carryover. . . 67 3.2 Experimental set-up. (A) MRI scanner CV/I 1.5 T; (B)
mo-tion capture system Smart µg with (C) three cameras and (D) reflective markers; (E) FES current-controlled stimulator RehaStim pro and (F) stimulation electrodes. . . 70 3.3 Representation of approximate ROI locations. . . 73 3.4 Schematic representation of steps involved in the procedure
for model structure identification. . . 75 3.5 Model space relative to C matrix, containing 3 competing
3.6 Schematic illustration of the A matrix connections subjected to test; in blue are connections that have been fixed based on prior knowledge, in order to reduce the model space, in yellow are the connections which combination determine the model space. Note that C matrix has been fixed has from the winning model from the previous step . . . 79
4.1 (a) Posterior probabilities among 3 competing models; (b) Representation of posterior expectations (grey bars) and their 95% confidence intervals (pink bars), after BMA. . . 85 4.2 (a) Posterior probabilities among 16 competing models; (b)
schematic of resulting best model: yellow connections are those who were subjected to test and survived. . . 85 4.3 (a) Posterior probabilities over 64 alternatives for the A
mat-rix; (b) representation of posterior expectations (grey bars) and their 95% confidence intervals (pink bars), after BMA. . 86 4.4 (a) Representation of surviving B matrix connections; (b)
representation of posterior expectations (grey bars) and their 95% confidence intervals (pink bars), after BMA. . . 87 4.5 . . . 88 4.6 (a) Second level estimated parameters (thresholded for Pp ≥
0.8) relative to C matrix, explicited for each regressor (µ is the parameter posterior mean, Pp is the probability of the
para-meter to be different from zero); (b) estimated means (grey bars) along with their 95% confidence intervals (pink bars). From left to right panels represent: group mean (βmean);
carryover effect (βcarryover); time (βtime); capacity-score (βCS).
Colour levels express the magnitude of the value, i.e., red tones are for positive values, blue tones are for negative values. 90 4.7 (a) Second level estimated parameters (thresholded for Pp ≥
0.8) relative to A matrix, explicited for each regressor (µ is the parameter posterior mean, Pp is the probability of the
para-meter to be different from zero); (b) estimated means (grey bars) along with their 95% confidence intervals (pink bars). From left to right panels represent: group mean (βmean);
carryover effect (βcarryover); time (βtime); capacity-score (βCS).
Colour levels express the magnitude of the value, i.e., red tones are for positive values, blue tones are for negative values. 91
4.8 (a) Second level estimated parameters (thresholded for Pp ≥
0.8) relative to B matrix, explicited for each regressor (µ is the parameter posterior mean, Pp is the probability of the
para-meter to be different from zero); (b) estimated means (grey bars) along with their 95% confidence intervals (pink bars). From left to right panels represent: group mean (βmean);
carryover effect (βcarryover); time (βtime); capacity-score (βCS).
Colour levels express the magnitude of the value, i.e., red tones are for positive values, blue tones are for negative values 92 4.9 2 × 2 factorial representation of patients model structure,
along with estimated parameter posterior means. Values are obtined as θi = βmean± βcarryover± βtime. Blue values are
relative to intrinsic connections in matrix A, red values are relative to modulatory effects of input E (FES) in matrix B, green values indicate driving inputs (V, E, P) contribution in matrix C. Values are reported for each subgroup, localised as follows: in the upper left panel is the CE-PRE subgroup; in the upper right panel is the nCE-PRE subgroup; in the lower left panel is the CE-POST subgroup; in the lower right panel is the nCE-POST subgroup. . . 93 B.1 Data processing pipeline. . . 132 B.2 The slice-timing problem: the same signal sampled at
dif-ferent offsets yields signals that do not look the same. (A) Five adjacent slices acquired with interleaved acquisition all sample the same underlying bold signal. (B) Without correc-tion, reconstruction yields five different signals despite having the same underlying shape. . . 134 B.3 Example of bi-linear interpolation. The values of the ”new”
voxel is computed as weights average of neighbouring voxels as: f5= f1x2+ f2x1, f6= f3x2+ f4x1, f7= f5y2+ f6y1 . . . 136
B.4 Geometric perspective for the minimization of the sum of squared errors: the predicted values ˆy = X ˆβ are the pro-jection (P is a propro-jection matrix) of the data vector y onto the design plane X (in blue). The smallest errors are obtained when vector e is ortogonal to the X plane . . . 150
List of Tables
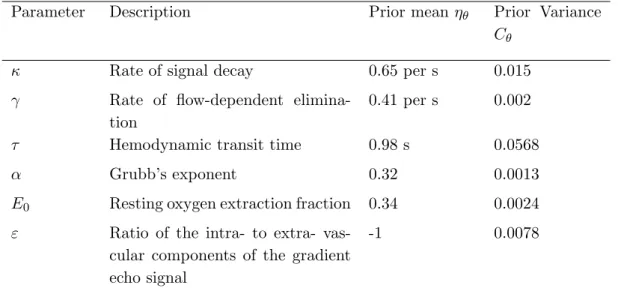
2.1 Priors of biophysical parameters . . . 48 3.1 Patients individual characteristics with pre-post clinical scores
and carry-over evaluation . . . 66 3.2 Healthy subjects individual characteristics . . . 68 4.1 Healthy ROI coordinates (mean ± standard deviation). . . . 84 4.2 Patients ROI coordinates (mean ± standard deviation). . . . 84
Sommario
Introduzione
Questa tesi `e incentrata sullo studio longitudinale dei pazienti post-ictus, per indagare il meccanismo di plasticit`a cerebrale alla base della riorga-nizzazione del controllo motorio in soggetti sottoposti ad un trattamento di riabilitazione motoria, supportato da stimolazione elettrica funzionale. Inoltre, uno degli obiettivi principali di questo lavoro `e quello di ottenere maggiori informazioni sui fattori determinanti che portano al raggiungimen-to di un recupero moraggiungimen-torio duraturo (chiamaraggiungimen-to effetraggiungimen-to ”carry-over”) dopo la riabilitazione motoria basata su FES.
La FES (Functional Electrical Stimulation - stimolazione elettrica funziona-le) dei muscoli degli arti superiori e inferiori ha ricevuto crescente attenzione poich´e `e stato dimostrato che la terapia riabilitativa basata su FES, com-binata con il trattamento di terapia convenzionale, migliora in modo pi`u efficace la capacit`a di deambulazione e migliora il recupero motorio rispetto alla sola terapia convenzionale, in pazienti sopravvisuti ad ictus [1].
FES ed effetto Carryover - Per quanto riguarda gli arti inferiori, la FES viene utilizzata principalmente per la correzione ortotica della sindrome da piede cadente, un problema piuttosto comune in seguito ad un ictus. Una percentuale di pazienti riapprende a dorsiflettere volontariamente la caviglia senza l’uso del dispositivo [2]. Il meccanismo di funzionamento di questo fenomeno, denominato ”effetto carryover”, non `e stato ancora pienamente compreso e , infatti, l’effetto carryover `e stato osservato solo in sottogruppi di pazienti neurologici e le caratteristiche di questi pazienti, con o senza effetto carryover, non sono chiare. Si ritiene che l’interazione tra sforzo volontario e stimolazione elettrica si traduca in un effetto neuroplastico, inducendo la formazione di nuove connessioni funzionali permanenti e, quindi, promuo-vendo il riapprendimento motorio [3][4][5][6]. Questo meccanismo segue i principi della teoria di Hebb, che afferma che una stimolazione ripetuta e persistente di una cellula postsinaptica da parte di una cellula presinaptica,
favorisca l’aumento dell’efficacia sinaptica [7]. In effetti, la combinazione di sforzo volontario (segnale efferente) e percezione sensoriale di un movimento correttamente completato (segnale afferente) sembra facilitare la plasticit`a di Hebb.
Gli studi suggeriscono che la capacit`a di un paziente di pianificare il movi-mento e di percepire la stimolazione come parte del proprio ciclo di controllo motorio `e molto importante perch´e l’effetto carryover abbia luogo [8].
Teoria dell’Active Inference - In questo studio, come ipotesi di lavoro, abbiamo impiegato la recente teoria che suggerisce che l’aggiornamento dei modelli interni del cervello segue i principi bayesiani, combinando distribu-zioni di probabilit`a a priori e livelli noti di incertezza del feedback sensoriale con le conseguenze sensoriali del movimente [9]. Inoltre, la direzione inter-pretativa della tesi punta verso teoria dell’Active Inference come meccanismo di funzionamento del controllo motorio, che prevede che la corteccia motoria trasmetta previsioni discendenti delle conseguenze sensoriali del movimento piuttosto che i comandi cinematici di guida specificati dal controllo motorio ottimale. La possibilit`a di studiare i correlati neurali funzionalia i cambia-menti di connettivit`a associati all’utilizzo della FES rappresenta un’utile condizione sperimentale per discriminare le due teorie alterantive ”Optimal motor control” e ”Active Inference”, sulla base delle quali ci aspetterem-mo che l’output del controllo aspetterem-motorio venga diversamente influenzato dalla presenza della FES (propriocezione alterata), cio`e che i comandi cinematici rimangano inalterati nel caso del controllo ottimale, oppure che la predizione propiocettiva venga aggiornata nel caso dell’active inference.
Metodi
Partecipanti - I partecipanti coinvolti in questo studio consistono in 16 soggetti sani e 8 pazienti post-ictus. I pazienti sono stati sottoposti a una classificazione binaria, basata sull’esito del trattamento, a seconda che il soggetto abbia raggiunto o meno miglioramenti stabili (cio`e l’effetto carry-over) nel recupero motorio, dopo la riabilitazione [10].
In questo lavoro l’attenzione `e stata focalizzata su soggetti che presentano la sindrome da piede cadente, detta anche paralisi flaccida, causata da debolez-za alle caviglie e paralisi ai muscoli flessori dorsali del piede, e che impedisce ai soggetti che ne sono affetti di sollevare completamente la gamba o il piede mentre muovono un passo. Uno degli obiettivi di queste terapie `e quindi l’u-so della FES appropriatemente sincronizzato con la fase di oscillazione del passo per produrre una dorsiflessione pienamente funzionalecome, e anche
come stimolo di propriocezione alterata. Questa procedura mira a stimolare i processi neuroplastici per la riorganizzazione del circuito di controllo mo-torio a livello corticale. L’esecuzione di un movimento volontario, infatti, richiede al cervello di integrare sia l’intenzione volontaria di eseguire il mo-vimento, sia la conoscenza dello stato del corpo (cio`e integrare il feedback sensoriale).
Il dataset e il portocollo sperimentale - Nella configurazione speri-mentale, la FES viene utilizzata per fornire informazioni propriocettive pi-lotate dall’esterno durante l’esecuzione del movimento - in altre parole, per alterare sperimentalmente la re-afferenza (cio`e l’input sensoriale che risulta dal movimento del soggetto). Il protocollo sperimentale `e stato definito in modo tale da alterare solo la propriocezione in diverse condizioni, mante-nendo costante la cinematica del movimento per rilevare quali aree e quali connessioni sono pi`u sensibili all’alterazione della propriocezione. Il proto-collo sperimentale originale [6][8], realizzato coninvolgendo la dorsiflessione della caviglia destra assistita da FES e a ritmo scandito da segnali acustici, consisteva in un design fattoriale 2 × 2, i cui fattori sperimentali erano rap-presentati dall’intenione volontaria di eseguire il movimento (V) e la FES (F), ognuno dei quali aveva 2 livelli, cio`e ”volontario” / ”passivo” e ”presen-te” / ”assen”presen-te”, rispettivamente. Questi comportano 4 condizioni: volont`a del movimento con concomitante FES (FV), movimento passivo con con-comitante FES (FP), volont`a del movimento senza FES (V) e movimento passivo senza FES (P).
I dati di risonanza magnetica funzionale (fMRI) utilizzati in questo stu-dio sono stati ottenuti durante sessioni di esercizio duranti le queli sia il movimento volontario che la propriocezione sono stati manipolati sperimen-talmente e, cos`ı facendo, sono stati analizzati gli effetti sulle interazioni tra le aree corticali motorie e sensoriali, sia in soggetti sani che gruppi di pa-zienti post-ictus.
I dati utilizzati in questo lavoro sono relativi a 16 volumi cerebrali sani e 16 provenienti da pazienti post-ictus. In fatti, per ciascun paziente erano di-sponibili 2 sessioni di fMRI, acquisite una prima (PRE) e una dopo (POST) la riabilitazione.
DCM - Il lavoro in questa tesi si basa sulla struttura di lavoro del Dy-namic Causal Modeling (DCM), implementato all’interno del software SPM di Matlab, come strumento per valutare la connettivit`a effettiva tra regioni corticali del cervello. Oltre a fare inferenze sull’accoppiamento tra regio-ni cerebrali distinte, lo scopo del DCM `e quello di esaminare come questo
accoppiamento dipenda dal contesto sperimentale. Il DCM `e usato per rica-vare gli stati neuronali, dalla misura indiretta dell’attivit`a cerebrale (cio`e il segnale BOLD) all’interno di un imianto bayesiano [11]. Sono stati svilup-pati diversi tipi di DCM, ma in questo studio `e stato utilizzato un modello deterministico bilineare a stato singolo. DCM `e un approccio per l’iden-tificazione di sistemi di ingresso-stato-uscita non lineari; la richiesta di un input e la necessit`a di specificare le regioni del cervello di cui `e composto il sistema, implicano che il DCM `e tradizionalmente utilizzato per testare ipotesi specifiche che hanno motivato un particolare progetto sperimentale. Utilizzando un’approssimazione bilineare per le interazioni dynamiche tra gli stati, ˙ z = A +X j ujB(j) z + Cu,
I paramteri del modello causale implicito si riducono a tre set: i parametri che mediano l’influenza degli input estrinsechi sugli stati del sistema (matrice C), i parametri che mediano le connessioni intrinseche tra gli stati (matrice A), e i paramtetri che permettono agli input di modulare queste connessioni (matrice B) L’identificazione procede seguendo una struttura bayesiana, da-ti degli input noda-ti e determinisda-tici, e la risposta del sistema misurata. Nello schema bayesiano di identificazione, le distribuzioni a posteriori dei parame-tri sono stimate attraverso un algoritmo di ottimizzazione, utilizzando i dati osservati e le distribuzioni a priori, sotto ipotesi di Gaussianit`a.
Gli Input - Per estrarre le serie temporali della risposta BOLD, relative a ingressi sperimentali opportunamente adattati per il nostro modello, ab-biamo riformulato il modello lineare generale per specificare gli input diretti e modulatori; questi corrispondono a un’attivit`a di stimolo che rappresen-ta l’effetto dei segnali volonrappresen-tari discendenti, V (che combina gli onset delle condizioni V e FV); un secondo input che codifica il contributo della sti-molazione funzionale elettrica ascendente all input propriocettivo, E (che combina gli onset delle condizioni FV e FP) e un terzo input che rappresen-ta l’input propriocettivo dovuto ai movimenti, P (che combina gli onset di tutte le 4 condizioni). Per riassumere l’attivit`a regionale di ciascun soggetto, per ciascun soggetto `e stato eseguito un contrasto F tra tutte le covariate della nuova design matrix, ottenendo cos`ı un’immagine di contrasto relativa all’attivazione cerebrale per tutti e tre gli input sperimentali.
Scelta delle regioni di interesse (ROI) - Per quanto riguarda i nodi del modello, le regioni di interesse (ROI) sono state scelte in base agli
obiet-tivi dello studio e alle conoscenze pregresse sul loro ruolo nel meccanismo di controllo motorio [6][8][12][13][14][15] [16][17] [18]. Le regioni di interesse ri-sultanti, da cui sono state estratte le serie temporali del segnale BOLD, sono le aree motorie controlaterali primaria e supplementare (M1 e SMA), l’area somato-sensoriale controlaterale primaria (S1) e il giro angolare controla-terale (AG). I volumi di interesse specifici per ogni soggetto, associati alle regioni sopra menzionate, sono stati selezionati utilizzando sfere del raggio di 4 mm, centrate nelle coordinate di massima attivazione rilevate all’interno delle mappe di attivazione mascherate. Mascherare l’immagine di contrasto significa prendere in considerazione un numero limitato di voxel contenuti in uno specifico spazio volumetrico, definito dalla corrispondente maschera della regione anatomica/funzionale del cervello. Le maschere per ogni ROI sono state ricavate dall’atlante SPM.
Modello gerarchico e Regressori - Nel contesto del nostro studio su gruppi, per verificare se la connettivit`a effettiva fosse diversa tra sottogruppi di pazienti, abbiamo deciso di sfruttare lo schema del Parametric Empirical Bayes (PEB), costruendo un modello gerarchico rispetto ai parametri, come descritto in studi recenti [19][20]. Oltre al modello bilineare al primo livello, che descrive l’evoluzione temporale degli stati neurali, questo approccio in-troduce un secondo livello che modella ogni parametro al primo livello (cio`e i parametri di accoppiamento tra regioni corticali) come una variabile ca-suale che oscilla attorno a un valor medio di gruppo. Il modello di secondo livello `e rappresentato da un modello lineare generale (GLM), che include una combinazione lineare di uno o pi`u regressori (o covariate) e un rumore additivo gaussiano. I regressori sono compattati nella cosiddetta matrice di progettazione (X):
θi = Xβ + ε
dove β = {β1, . . . , βn} `e il set di paramteri al seconod livello che esprime il
contributo di ogni regressore inserito nella design matrix, e ε ∼ N (0, σ). Nell’analisi sui soggetti sani abbiamo utilizzato un singolo regressore che rappresenta la media di gruppo, poich´e non sono stati ipotizzati altri effetti di gruppo all’interno del gruppo dei soggetti sani. Nella successiva analisi sui pazienti, eravamo interessati a osservare le differenze nella connettivit`a effettiva tra 4 sottogruppi (CE-PRE, CE-POST, nCE-PRE, nCE-POST); questi sottogruppi derivano dal disegno fattoriale 2 × 2 ottenuto dalla com-binazione del fattore di classificazione carry-over, con livelli ”CE” (presente) e ”nCE” (assente) e il fattore tempo, con livelli ”PRE” (prima sessione fM-RI) e ”POST” (seconda sessione fMfM-RI).
Al fine di evidenziare meglio le possibili differenze di connettivit`a tra queste condizioni, abbiamo definito nella design matrix un regressore carry-over, che codifica l’appartenenza alla classe, e un regressore tempo, che codifica il punto temporale della sessione fMRI. Un ulteriore regressore che modella la media di gruppo `e stato inserito nella matrice.
Procedure per l’identificazione della struttura del modello - Prima di identificare la struttura del modello, alcune semplificazioni sono state adottate, basate sulla connettivit`a intrinseca e sugli input, in modo da ri-durre lo spazio dei modelli. Questi vincoli sono basati su ipotesi derivate da conoscenze pregresse e informazioni trovate in letteratura, sulla connettivit`a strutturale e funzionale. Abbiamo quindi scelto di adottare un approccio ge-rarchico, definendo prima uno spazio dei modelli realizzato facendo variare gli input (matrice C), poi utilizzando il modello vincente cos`ı selezionato per definire un nuovo spazio dei modelli ottenuto facendo variare le connessioni intrinseche (matrice A), ed infine utilizzando il modello cos`ı ottenuto per definire un ulteriore spazio dei modelli facendo variare gli effetti modulatori (amtrice B).
Questa procedura `e stata applicata inizialmente al gruppo di soggetti sani. Nella successiva analisi sul gruppo di pazienti, si `e ipotizzato che la matrice C avesse la stessa struttura di quella ottenuta per i soggetti sani; la ma-trice A `e stata studiata a partire da dalla versione ridotta avente la stessa struttura di quella risultante dal gruppo dei soggetti sani. Nessun vincolo `
e stato imposto sulla matrice B e tutte le possibili combinazioni sono state testate. Questo approccio ci ha permesso di fare inferenza sulla struttura del modello, esplorando l’ampio spazio dei modelli in modo efficiente.
Risultati
I risultati riguardanti i oggetti sani sono riportati in Figura 4.5.
(a) Struttura di connettivit`a del modello. Rappresentazione generale del modello ri-sultante per soggetti sani; i valori blu sono relativi alle connessioni intrinseche nella ma-trice A, i valori rossi sono relativi agli effetti modulatori dell’input E (FES) nella matrice B, i valori verdi indicano gli input (V, E, P) nella matrice C.
(b) Rappresentazione matriciale. Medie a posteriori stimate µ e il loro livello di signifi-cativit`a Pp, riportate per ogni matrice di primo livello (da sinistra a destra: C - input;
A - connettivit`a intrinseca; B - effetti modulatori dell’input E). Figura 1
L’inferenza sui parametri ha evidenziato una profonda interazione tra feed-back sensoriale alterato artificialmente e movimento volontario, nei soggetti sani (connessioni M 1 −→ S1 e SM A −→ S1 in Figura 4). Questa intera-zione `e rispecchiata dagli effetti modulatori che l’input E ha sulle connessioni da M1 e SMA verso S1 (matrice B(2,1) e B(2,3) in Figura 5) e supporta la teoria dell’Active Inference per il controllo motorio, poich´e questo effetto modulatorio indica un aggiornamento della previsione propriocettiva dovu-ta alla stimolazione elettrica applicadovu-ta. In effetti, nel contesto del controllo ottimo, dato lo stesso output cinematico atteso in tutte le condizioni, i co-mandi cinematici di controllo non avrebbero bisogno di essere modulati dalla presenza di propriocezione alterata. Come si pu`o vedere in Figura 2, nei pazienti i valori di connettivit`a sono in contrasto con quanto osservato per i sani, e quindi questi valori evidenziano un malfunzionamento di questa interazione (M 1 −→ S1, SM A −→ S1), che potrebbe indicare una propa-gazione difettosa della previsione propriocettiva inviata dalle aree motorie. In Figura 2 sono riportati la struttura del modello e le medie delle distri-buzioni a posteriori stimate per i pazienti.
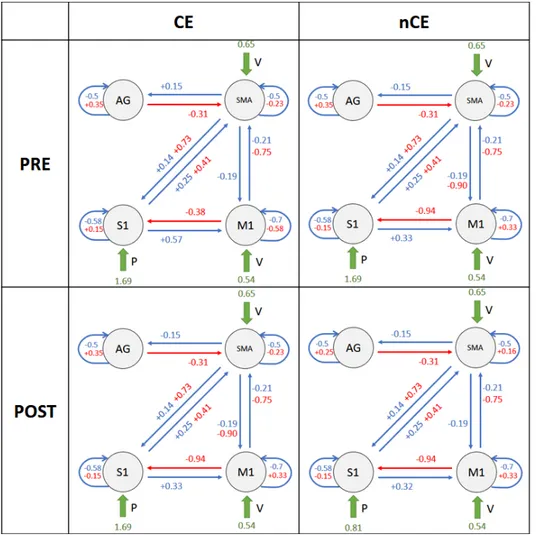
Si noti che ogni parametro di primo livello (cio`e le connessioni) `e espres-so al secondo livello come la combinazione lineare di 4 componenti, asespres-so- asso-ciate ai quattro regressori inclusi nella matrice di progetto, ciascuno dei quali esprime un effetto di gruppo: medai di grupo, raggiungimento del-l’effetto carryover (CE/nCE), tempo (PRE/POST). Ci`o significa che i va-lori riportati in Figure 2, per ogni connessione, sono stati ottenuti come θi= βmean± βcarryover± βtime.
Figura 2: 2×2 factorial representation of patients model structure, along with estimated parameter posterior means. Values are obtined as θi = βmean± βcarryover± βtime.
Blue values are relative to intrinsic connections in matrix A, red values are relative to modulatory effects of input E (FES) in matrix B, green values indicate driving inputs (V, E, P) contribution in matrix C. Values are reported for each subgroup, localised as follows: in the upper left panel is the CE-PRE subgroup; in the upper right panel is the nCE-PRE subgroup; in the lower left panel is the CE-poST subgroup; in the lower right panel is the nCE-POST subgroup
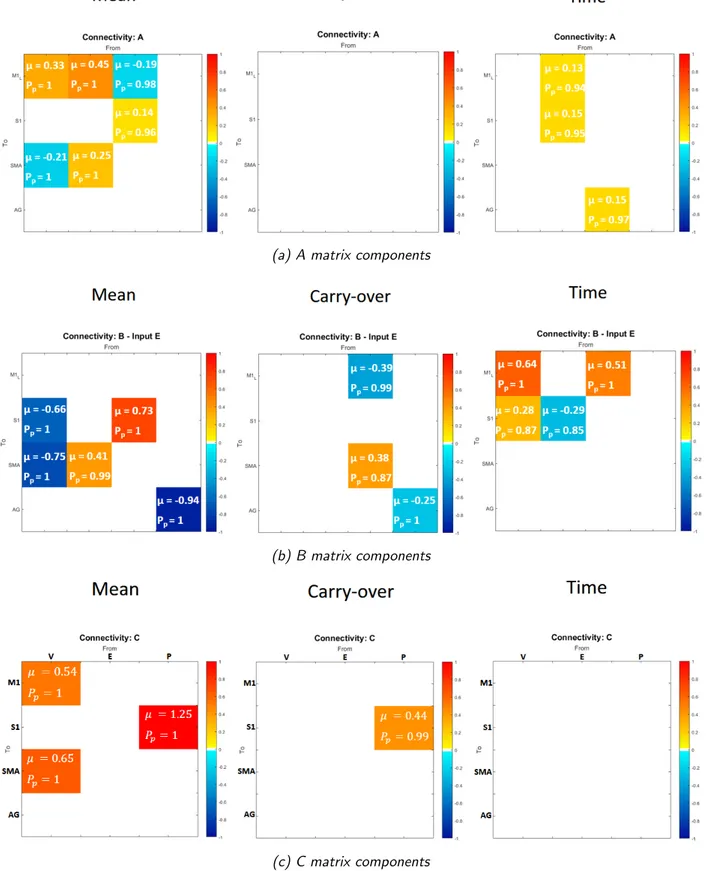
In Figure 7, i valori medi stimati (µ) dei parametri a secondo livello sono riportate per ogni parametro, insieme al loro livello di significativit`a (Pp), in rappresentazione matriciale; i livelli di colore indicano l’intensit`a del
valore riortato.
Anche la natura gerarchica della elaborazione motoria `e stata evidenziata dai risultati, principalmente sottolineata dal ruolo di SMA, che agisce sia co-me supervisore dell’area motoria primaria, sopprico-mendo i programmi motori
standard di M1 ogni qualvolta le condizioni esterne cambiano, sia come unit`a di elaborazione motoria di ordine superiore, che interviene qualora l’attivit`a desiderata comporti movimenti pi`u complessi. In questo contesto, sugge-riamo che la dorsiflessione della caviglia, che sembra essere un movimento piuttosto semplice per un soggetto sano, potrebbe essere un compito impe-gnativo per i soggetti con disabilit`a, che quindi richiederebbe un maggiore contributo della SMA. A proposito di questa connessione (SM A −→ M 1), abbiamo osservato differenze sia nel carry-over che nel tempo (matrice B(1,3) in Figura 7b - pannelli carryover e time), indicando che potrebbe es-sere soggetta a cambiamenti dovuti a processi neuroplastici e, inoltre, che questa interazione potrebbe rappresentare un aspetto fondamentale e ca-ratterizzante per l’insorgenza dell’effetto carry-over. Quest’ultimo risultato mostra come l’attivit`a soppressiva di SMA nei confonti di M1, meccanismo che `e proprio di un circuito di controllo motorio sano, sia preservata nei pazienti che esibiscono l’effetto carry-over ma venga a mancare nei pazienti senza l’effeto carry-over.
Un altro risultato interessante, che potrebbe rappresentare un potenziale marker dell’effetto carryover, `e relativo all’input propriocettivo (P). Come mostrato in Figura 7c - pannello carry-over , la componente relative al-l’effetto carry-over dell’input P entrante in S1 ha un valore stimato di 0.44. Questo vuol drie che i pazienti appartenenti al gruppo nCE hanno dimo-strato di essere meno capaci di interiorizzare il segnale afferente sensoriale e di sfruttare queste informazioni propriocettive per integrarle nel circui-to di controllo mocircui-torio. Ci`o potrebbe rappresentare un potenziale punto di partenza per studi futuri su fattori chiave determinanti per il verificarsi dell’effetto carryover.
(a) Componenti matrice A
(b) Componenti matrice B
(c) Componenti matrice C
Figura 3: Valori stimati a secondo livllo, suddivisi per ognuna delle matrici a primo livello (A, B, C), relativi ai 3 regressori. Da sinistra a destra i pannelli riportano: media di gruppo (βmean); effetto carryover (βcarryover); tempo (βtime).
Conclusioni
Per concludere, abbiamo presentato un approccio gerarchico personalizzato per l’identificazione della struttura di rete del modello. Abbiamo quindi ana-lizzato e riportato i risultati dell’inferenza sui parametri del modello, per il nostro studio longitudinale di gruppo. Questi risultati supportano la teoria alternativa dell’Active Inference per il controllo motorio, forniscono alcune informazioni sui meccanismi di attenuazione sensoriale, hanno evidenziato la natura gerarchica del controllo motorio e infine potrebbero indicare po-tenziali meccanismi di azione della FES nel promuovere l’apprendimento motorio nella neuroriabilitazione.
Struttura della tesi
La tesi `e strutturata come segue.
Il Capitolo 1 introduce il problema della menomazione post-ictus, fa’ una rapida revisione della letteratura sullo stato dell’arte nel campo della ria-bilitazione motoria, introduce brevemente le procedure utilizzate durante il lavoro e d`a un’idea degli obiettivi dello studio.
Il capitolo 2 offre una panoramica completa della teoria alla base della struttura del Dynamic Causal Modeling (DCM).
Il capitolo 3 presenta materiali e metodi utilizzati in questo lavoro. Nel capitolo 4 sono presentati e discussi i risultati.
Il capitolo 5 riporta conclusioni sui risultati ottenuti, limiti dello studio e direzioni di ricerca future.
Summary
Introduction
Objective of the work and State of the art - This thesis is focused on the longitudinal study of post-stroke patients, to investigate the mechan-ism of brain plasticity underlying motor control reorganisation in subjects attending a motor rehabilitation treatment, supported by functional elec-trical stimulation (FES). Moreover, one of the major objectives of this work is to obtain more information about the determinant factors leading to the achievement of stable improvements (i.e. the ”carry-over” effect) after FES-based motor rehabilitation.
FES of upper and lower limb muscles has been receiving increasing attention as it has been demonstrated that FES-based therapy combined with con-ventional therapy treatment more effectively improves the walking ability and enhances the motor recovery when compared with conventional therapy alone, in stroke survivors [1].
FES and Carryover - As for lower limbs, FES is primarily used for the orthotic correction of foot drop, a common issue following a stroke. A proportion of patients relearn the ability to voluntarily dorsiflex the ankle without the device [2]. The underlying functioning mechanism of this phe-nomenon, referred to as the ”carryover effect”, has not yet been fully under-stood and, in fact, the carryover effect has been observed only in subgroups of neurological patients and the characteristics of those with and without FES carryover are not clear. It is thought that this interaction between vo-litional effort and the electrical stimulation results in a neuroplastic effect, inducing long-lasting formation of new functional connections and, there-fore, promoting motor re-learning [3] [4] [5] [6]. This mechanism follows the principles of Hebbian theory, which claims that an increase in synaptic efficacy arises from a presynaptic cell’s repeated and persistent stimulation of a postsynaptic cell [7]. Indeed, the combination of volitional effort (effer-ent signal) and the sensory perception of a properly completed movem(effer-ent
(afferent signal) seems to facilitate Hebbian-like plasticity.
Studies suggest that the ability of a patient to plan the movement and to perceive the stimulation as a part of his/her own control loop is important for the FES carryover effect to take place [8].
Active Inference account - In this study we embraced as work hypo-thesis the recent theory suggesting that the updating of the internal models of the brain follows Bayesian principles, combining a priori probability dis-tributions and known levels of uncertainty of sensory feedback with sensorial consequences [9]. Moreover, the interpretative direction of the thesis pointed toward the Active Inference account of motor control, which envisages that the motor cortex sends descending predictions of the sensory consequences of movement rather than the driving kinematics commands specified by op-timal motor control. The possibility to study functional brain correlates and connectivity changes associated with the use of FES represent a useful experimental condition to discriminate between the two alternative theories of optimal motor control and Active Inference, based on which we would expect the motor control output to be differently influenced by the presence of FES (altered proprioception), i.e. unaltered kinematics commands in the case of optimal motor control, or updated propriocptive prediciton in case of Active Inference account.
Methods
Participants - Participants recruited for this study consisted of 16 healthy subjects and 8 post-stroke patients. Patients were subjected to a binary clas-sification, based on the outcome of the treatment, depending whether or not the subject has achieved long lasting improvements (i.e. carry-over effect) in motor recovery after the rehabilitation [10].
In this work the attention has been focused on subjects exhibiting foot drop, or what is occasionally referred to as drop foot, caused by deficiency of con-trol of the anterior muscles of the lower leg and preventing affected subjects from being able to fully lift their leg or foot while taking a step. One of the aim of these therapies is therefore the use of FES properly synchronised with the swing phase of gait in order to produce a full and functional dorsiflexion, as well as an altered proprioception stimulus. This procedure aims at stim-ulating the neuroplastic processes of motor control loop reorganization at cortical level. The execution of a voluntary movement, in fact, requires the brain to integrate both the volitional intention to execute the movement and the knowledge about the state of the body (i.e. integrate sensory feedback).
Dataset and experimental protocol - In the experimental setup, FES is used to provide externally driven proprioceptive information during move-ment execution - in other words, to experimove-mentally alter reafference (i.e. the sensory input that results from the agent’s movement). The experi-mental protocol was defined so that only proprioception in different con-ditions was altered, while maintaining constant movement kinematics to reveal which areas and which connections are sensible to proprioception al-teration. The original experimental protocol [6][8], performed using FES assisted ankle dorsiflexion (right leg for healthy subjects, paretic leg for pa-tients) paced with auditory cues, consisted in a 2 × 2 factorial design, which experimental factors included volitional intention to perform the movement (V) and FES (F), each of which had 2 levels, i.e. ”voluntary”/”passive” and ”present”/”absent”, respectively. These translated into 4 conditions: will of movement with concurrent FES (FV), passive movement with concur-rent FES (FP), will of movement without FES (V) and passive movement without FES (P).
Functional Magnetic Resonance Imaging (fMRI) data were acquired during these training sessions in which both volitional movement and propriocep-tion were experimentally manipulated and, by doing so, the effects on the interactions between cortical motor and sensory areas were examined, in both healthy subjects and post-stroke patients groups. Data used in this work consisted in 16 healthy brain volumes and 16 brain volumes coming from 8 post-stroke patients. In fact, for each patient 2 sessions of fMRI were available, acquired one before (PRE) and one after (POST) the rehabilita-tion.
DCM - The work in this thesis is based on the Dynamic Causal Modelling (DCM) framework, implemented within the SPM software in Matlab, as a tool to assess effective connectivity among brain cortical regions. Besides making inferences about the coupling between distinct brain regions, the purpose of DCM is to examine how this coupling is dependent upon the experimental context. DCM is used to infer hidden neuronal states from the indirect measure of brain activity (i.e. the BOLD signal) within a Bayesian framework [11]. Different types of DCM have been developed, but in this study a deterministic single-state bilinear model has been employed. DCM is an approach to the identification of nonlinear input-state-output systems; the requirement of an input, and the need to specify the brain regions that the system is composed of, mean that DCM is traditionally used to test a specific hypothesis that motivated a particular experimental design.
states ˙ z = A +X j ujB(j) z + Cu
the parameters of the implicit causal model reduce to three sets: parameters that mediate the influence of extrinsic inputs on the states (matrix C), parameters that mediate intrinsic coupling among the states (matrix A), and parameters that allow the inputs to modulate that coupling (matrix B). Identification proceeds in a Bayesian framework given known inputs and the observed responses of the system.
In the Bayesian identification scheme, parameters posterior distributions are estimated through an optimisation algorithm, using observed data and prior distributions, under Gaussian assumptions.
Inputs - In order to extract BOLD response time-series related to ex-perimental inputs conveniently suited for our model, we reformulated the general linear model to specify the driving and modulatory inputs; these are a stimulus function representing the effect of descending voluntary signals, V (combining onsets from V and FV conditions); a second input encoding the contribution of ascending functional electrical stimulation to proprioceptive input, E (combining onsets from FV and FP conditions), and a third input representing underlying proprioceptive input from all movements, P (com-bining onsets from all conditions). To summarise, the regional activity of each subject, an F-contrast was performed across all covariates of the new design matrix for each subject, obtaining a contrast image of brain activation for all three experimental inputs.
ROIs selection - Concerning the nodes of the model, regions of interest (ROIs) were chosen based on the objectives of the study and prior knowledge about their role in motor control [6][8][12][13][14][15] [16][17] [18]. The res-ulting regions of interest, from which BOLD time-series were extracted, were the contralateral primary and supplementary motor areas (M1 and SMA), the contralateral primary somato-sensory area (S1) and the contralateral angular gyrus (AG). Subject-specific volumes of interest, associated to the regions mentioned above, were selected using 4mm radius spheres, centred in the coordinates of maximum activation detected within the masked activ-ation maps. Masking the contrast image means taking into consideractiv-ation a limited number of voxels contained in a specific volumetric space, defined by the corresponding labeled mask of the anatomical/functional brain region.
Labeled masks for each ROI were taken from the SPM atlas of maximum probability tissue labels.
Hierarchical Model and Regressors - In the context of our group study, as to test whether effective connectivity is different between sub-groups of patients, we decided to exploit the Parametric Empirical Bayes (PEB) scheme, constructing a hierarchical model over the parameters, as described in recent studies [19][20]. In addition to the bilinear model at the first level, which describes the neural states temporal evolution, this approach introduces a second level that models each parameter at the first level (i.e. coupling parameters between cortical regions) as a random vari-able oscillating around a group mean. Second level model is represented by a general linear model (GLM), including a linear combination of one or more regressors (or covariates) and an additive Gaussian noise. Regressors are compacted in the so called design matrix (X):
θi = Xβ + ε
where β = {β1, . . . , βn} is the set of second level parameters that express
the contribution of each regressor (or group effect) included in the design matrix, and ε ∼ N (0, σ).
In healthy subjects analysis, we used a single regressor representing the group mean, as no group effects were assumed within the healthy group. In the subsequent analysis on patients, we were interested in observing dif-ferences in effective connectivity among subgroups, derived from the 2 × 2 factorial design given by the combination of carry-over classification factor, with levels ”CE” (present) and ”nCE” (absent), and time factor, with levels ”PRE” (first session) and ”POST” (second session). This way, 4 subgroups were identified: CE-PRE, CE-POST, nCE-PRE, nCE-POST.
In order to better highlight possible connectivity differences among these subgroups, we defined in the design matrix a carry-over regressor, encoding the class membership, and a time regressor, encoding the session time point. A regressor modelling the overall group mean was also included in the design matrix.
Model structure identification procedure - Before identifying the model structure some simplifications have been imposed based on intrinsic connectivity and inputs, to reduce the model space. These constraints are based on assumptions derived from prior knowledge and literature informa-tion about structural and funcinforma-tional connectivity.
model space of varying inputs (matrix C), then using the winning model to define a new model space of varying intrinsic connectivity (matrix A) and finally using the model thus obtained to define a further model space of varying modulatory effects (matrix B).
This was applied to healthy subjects group at first. In the subsequent ana-lysis on patients group, C matrix was assumed to have the same structure as that obtained for healthy subjects; A matrix was investigated starting from a reduced matrix having the same structure as that resulting from healthy group. No constraints were imposed on the B matrix, and all pos-sible combinations were tested. This approach allowed us to make inference on network structure, by exploring the wide model space in an efficient way.
Results
Results concerning healthy subjects are reported in Figure 4 and Figure 5.
Figure 4: Model connectivity structure. Overall representation of final resulting model for healthy subjects; blue values are relative to intrinsic connections in matrix A, red values are relative to modulatory effects of input E (FES) in matrix B, green values indicate driving inputs (V, E, P) contribution in matrix C.
Figure 5: Matrix representation. Estimated posterior means µ and their significance level Pp, expressed for each first level matrix (from left to right: C - driving inputs; A
- intrinsic connectivity; B - modulatory effects of input E).
Inference about parameters highlighted a profound interaction between arti-ficially altered sensory feedback and volitional movement in healthy subjects (M 1 −→ S1 and SM A −→ S1 in Figure 4). This interaction is reflected by modulatory effects of input E over connections from M1 and SMA to-ward S1 (matrix B(2,1) and B(2,3) in Figure 5) and supports the Active Inference account for motor control, as this modulation suggests an update of the proprioceptive prediction due to the applied electrical stimulation. Indeed, in the optimal control account, given the same expected kinematic output in all conditions, driving kinematics commands would not need to be modulated by the presence of altered proprioception.
As can be seen in Figure 6, patients connectivity values are in contrast with healthy ones, and thus they underlined a malfunctioning of this interaction (M 1 −→ S1, SM A −→ S1), which could indicate a defective propagation of proprioceptive prediction sent by motor areas.
In Figure 6 model structure and estimated posterior means for patients are reported. Note that, each first level parameter (i.e. connections) is ex-pressed, at the second level, as the linear combination of 4 components, each associated with one of four regressors included in the design matrix, each of which expresses a group effect: group mean, carryover effect achievement (CE/nCE), time (PRE/POST). That means, values reported in Figure 6, for each connection, have been obtained as θi= βmean± βcarryover± βtime.
In Figure 7, second level estimated mean values (µ) are reported for each parameter, along with the their significance level (Pp), in matrix
28
Figure 6: 2×2 factorial representation of patients model structure, along with estimated parameter posterior means. Values are obtined as θi = βmean± βcarryover± βtime.
Blue values are relative to intrinsic connections in matrix A, red values are relative to modulatory effects of input E (FES) in matrix B, green values indicate driving inputs (V, E, P) contribution in matrix C. Values are reported for each subgroup, localised as follows: in the upper left panel is the CE-PRE subgroup; in the upper right panel is the nCE-PRE subgroup; in the lower left panel is the CE-POST subgroup; in the lower right panel is the nCE-POST subgroup.
The hierarchical nature of motor processing has also been highlighted, mostly by the role of SMA. This region, in fact, seems to act as higher order mo-tor processing unit, intervening whenever the desired momo-tor task involves more complex movements. In this context, we suggest that ankle dorsiflex-ion, that seems to be a fairly simple movement for a healthy subject, may be quite a challenging task for impaired subjects, requiring an increased contribution of SMA. Moreover, SMA showed a suppressive activity over primary motor area M1, in agreement with what is reported in literature [14][21][22], repressing standard motor programs in M1 whenever external condition change. About this connection (SM A −→ M 1), we observed dif-ferences in both carry-over and time conditions (matrix B(1,3) in Figure 7b - carryover and time panels), indicating that it is subjected to changes due to neuroplastic processes and, furthermore, that this interaction could represent a fundamental and characterising aspect for the onset of carry-over effect. This latter result shows that the suppressive activity of SMA over M1, mechanism that is proper to a healthy motor control circuit, is pre-served in patients exhibiting the carry-over effect but not in those without the carry-over effect.
Another interesting result, which could represent a potential carry-over marker, is related to the proprioceptive driving input (P). As shown in Figure 7c - element C(2,3) in carry-over panel, the carry-over re-lated component of input P entering in S1 has an estimated value of 0.44, meaning that patients belonging to the nCE group have shown to be less able to internalise the sensory afferent signal and exploit the proprioceptive information to integrate it into the motor control loop. This represents a potential starting point for future studies on key factors that determine the occurrence of the carry-over effect.
(a) A matrix components
(b) B matrix components
(c) C matrix components
Figure 7: Second level estimates (µ) and their significance level (Pp), subdivided for
each of the first level matrices (A, B, C), relative to 3 regressors. From left to right panels represent: group mean (βmean); carryover effect (βcarryover); time (βtime).
Conclusions
To conclude, we presented a customised hierarchical approach for the identi-fication of network structure. We then analysed and reported results about inference on model parameters, for our longitudinal group study. These res-ults support the alternative theory of Active Inference account for motor control, provide some insight into the mechanisms of sensory attenuation and may speak to potential mechanisms of action of FES in promoting mo-tor learning in neurorehabilitation.
Structure of the Thesis
The thesis is structured as follows.
Chapter 1 introduces the problem of post-stroke impairment, outlines a quick review of literature about the state of the art in the field of motor rehabilitation, briefly introduces the procedures used during the work and outlines the objectives of the study.
Chapter 2 gives a comprehensive overview of the theory behind Dynamic Causal Modelling (DCM) framework.
Chapter 3 presents materials and methods used in this work. In Chapter 4 results are presented and discussed.
Chapter 5 reports conclusions about obtained results, limitations of the study and future research directions.
Chapter 1
Introduction
Stroke is one of the leading causes of long-term disability in adults worldwide [23]. In fact, as most patients survive the initial injury, the biggest effect on patients and families is usually through long-term impairment, limitation of activities and reduced participation. The most common clinical deficit and widely recognised impairment caused by stroke is motor impairment, which can be caused by ischaemic or haemorrhagic injury to the motor cortex, pre-motor cortex, motor tracts, or associated pathways in the cerebrum or cerebellum, and can be regarded as a loss or limitation of function in muscle control or movement or a limitation in mobility [24]. After-stroke motor impairment may include hemiparesis, incoordination and spasticity and typically affects the control of movement of the face, arm, and leg of one side of the body [25], contralateral to the stroke lesion side. Therefore, much of the focus of stroke rehabilitation, and in particular the work of physiotherapists and occupational therapists, is aimed to the recovery of impaired movement and the associated functions, throughout the recovery of self-performed daily life activities.
Stroke patients show varying degrees and types of neurological deficits, that depend on size and location of the brain lesion [26], and whose recov-ery strongly depends upon the type of rehabilitation program chosen and perforomed and the degree of commitment of the patients and family mem-bers. Most of them recover at least some of their lost motor functions over time, though the degree of this recovery is highly variable, depending on the severity of the damage and the type and intensity of rehabilitation therapy. There is evidence that increasing the intensity and repetition of post-stroke therapy can enhance motor recovery [27]. Brain mapping studies in patients have revealed that the brain reorganizes after stroke in relation to recovery of motor function. In recent years, convincing evidence has been produced
in neuroscience that have led to the knowledge that the brain can change or reorganize itself in response to sensory input, experience and learning [28]. This ability of the brain and other parts of the central nervous system to reorganize itself is referred to as Neuroplasticity [29] and exclusively of cor-tex as Cortical plasticity [30]. Neuroplasticity occurs in both a healthy and injured brain [31]: it is the basic mechanism of learning processes, in which the nervous system change its structure and its function over a lifetime, in reaction to environmental diversity, experience and repetition, triggering the dynamic destruction and reformation of new synaptic connections between neurons. Basically, brain plasticity is the ability for the brain to recover and restructure itself. This adaptive potential of the nervous system also allows the brain to recover after disorders or injuries. Therefore, clinical improvements of motor function after stroke are accompanied by profound functional reorganization within motor areas of both hemispheres. It is be-lieved that appropriately boosting these neuroplastic processes may restore function via recruitment of spared areas and pathways.
Traditional neurorehabilitation approaches for post stroke patients are oriented towards motor and functional recovery [32]; motor recovery refers to the ability of the patient to execute movements under voluntary con-trol achieving eventually the same performances as before the stroke [33], while functional recovery refers to the improvement of the individual’s abil-ity to autonomously perform activities such as self-care and mobilabil-ity [34]. Post stroke recovery also occurs at brain level, referred to as neurological recovery, which is generally associated with the structural and functional re-organization of brain. Both motor and functional recoveries are conditioned by neurological recovery. Accordingly, neural reorganization after stroke is thought to be an important mechanism to facilitate motor recovery.
Various novel stroke rehabilitative methods for motor recovery have been developed based on basic science and clinical studies characterizing brain remodeling due to neural plasticity [35] [36]. In addition to the more clas-sic rehabilitation techniques, other methods include Selective Serotonin Re-uptake Inhibitor Medications (SSRI), Constraint-Induced Movement Ther-apy (CIMT), Noninvasive Brain Stimulation such as Trans-cranial Magnetic Stimulation (TMS), Mirror Therapy, Robot-assisted Therapy [37] [38].
One commonly adopted therapy in the rehabilitation of stroke is Func-tional Electrical Stimulation (FES) [39]. FES of upper and lower limb muscles has been receiving increasing attention as a therapeutic modality in post-stroke rehabilitation. A meta-analysis of controlled studies suppor-ted the conclusion that FES promotes the recovery of muscle strength after stroke, with a reasonable likelihood of clinically significant results [1].
In this work the attention has been focused on subjects exhibiting foot drop, or what is occasionally referred to as drop foot, a common issue follow-ing a stroke or other neurological injury. Foot drop is caused by interruptions in the common fibular and sciatic nerves and aggravated by the paralysis of the anterior (front) muscles of the lower leg. Those experiencing foot drop are often unable to fully lift their leg or foot while taking a step forward. Due to this weakness, the knee compensates, bending more deeply and lift-ing the leg higher off the ground to avoid dragglift-ing or ”dropplift-ing”. This compensation creates what is referred to as a steppage gait, that can then cause exaggerated flexion at the hip and knee. While this prevents the foot from dropping, it also creates an awkward ground reaction vector on the joints and subsequent slap of the foot as the pressure of impact is diffused by the body. There could be a problem of maladaptive plasticity as well, i.e. the motor re-learning mechanism produce a neural reorganization com-pensating for this emi-paresis, but leading to lasting defective movements. Men and women with foot drop complications are often unable to perform complete dorsiflexion (the flexing of the foot toward the body).
It has been demonstarted that FES therapy combined with conventional therapy treatment more effectively improves the walking ability and en-hances the motor recovery when compared with conventional therapy alone in stroke survivors [40]. Externally induced dorsiflexion using FES was first introduced by Liberson et al. in 1961 as an alternative treatment for foot-drop [2]. The application of the peroneal nerve stimulation (PNS) has both a positive therapeutic and a positive orthotic effect in improving speed and reduced effort while walking [41] [42].
In the experimental setup, functional electrical stimulation (FES) is used to provide externally driven proprioceptive information during movement execution – in other words, to experimentally alter reafference (i.e. the sensory input that results from the agent’s movement). FES delivered to a nerve tract containing both efferent motor and afferent sensory fibers, will synchronously depolarize motor and sensory axons that are bundled to-gether, eliciting muscle contraction through two pathways. The first (direct descending pathway) conveys signals along the efferent motor fibers that gen-erate muscle contraction by direct motoneuron depolarization. The second (indirect ascending pathway) communicates signals via the afferent sens-ory fibers [43] that code proprioceptive signals from muscle spindles, Golgi tendon organs and cutaneous receptors [44], but in particular Ia fibers re-sponsible for muscle spindle information [45]. This second pathway produces muscle contractions through a central mechanism, providing excitatory syn-aptic input to spinal neurons that recruit motor units in the natural
der [46]. Therefore, the proprioceptive signal elicited by the sensory fiber stimulation creates the impression that the muscle is extended (i.e. muscle spindles discharge), and leads to firing of the motor neurons in order to produce a contraction. During FES, it has been demonstrated that this information can be useful at the level of the spinal cord, inducing a re-inforcement of the muscle contraction through the myotatic reflex circuit, however few notions about altered proprioceptive information sent up to the cortex are available in the literature.
FES is primarily used for the orthotic correction of foot drop, but a proportion of patients relearn the ability to voluntarily dorsiflex the ankle without the device [2]. This phenomenon, referred to as the ”carryover ef-fect”, has been observed in a number of subsequent studies [47] [48]. The functioning mechanism of this effect has not yet been fully understood, al-though it has been hypothesised that an interaction between volitional effort and the electrical stimulation of FES results in a neuroplastic effect on the central nervous system [3] [4] [5] [6].
Indeed a recent study [8] suggests that the mechanism through which FES carryover take place is based on movement prediction together with sense of body ownership. In other words, the ability of a patient to plan the movement and to perceive the stimulation as a part of his/her own con-trol loop is important for the FES carryover effect to take place. However, the carryover effect has been observed only in subgroups of neurological patients and the characteristics of those with and without FES carryover are not clear. In patients showing FES carryover, the execution of the movement with concurrent volitional intention and FES allow them to cor-rectly plan the movement and to perceive it as self-generated. By doing so, the motor control loop correctly updates itself [49], showing a long-lasting formation/strengthening of new functional connections, following Hebbian principles.
Hebbian theory claims that an increase in synaptic efficacy arises from a presynaptic cell’s repeated and persistent stimulation of a postsynaptic cell. It is an attempt to explain synaptic plasticity, the adaptation of brain neurons during the learning process [7]. Indeed, the combination of voli-tional effort and the sensorial perception of a properly completed movement provides somatosensory feedback that facilitates Hebbian-like plasticity [50]. The aim of these therapies is therefore the use FES as stimulus of alterated proprioception, during task-oriented rehabilitation procedures, in order to stimulate neuroplastic processes for motor control loop reorganization at cortical level.
integrate both the volitional intention to execute the movement and the knowledge about the state of the body (i.e. integrate sensory feedback). In humans, changing proprioceptive input influences motor cortex excitab-ility [51] [52]. Conversely, the response of somatosensory cortex neurons to proprioception is modified by the nature of the motor task [53]. Currently, motor control theory proposes that internal models generate motor com-mands that are sent to the periphery to produce the desired movement. In this account, internal models combine sensory inputs, prior knowledge and volitional intention to produce motor commands [54]. Forward models are thought to be responsible for predicting the sensory consequences of action, given the motor commands [55] [56]. It has been recently suggested that the updating of the internal model follows Bayesian principles [54], combining a priori probability distributions and known levels of uncertainty of sensory feedback with sensorial consequences [57].
However, an alternative account of motor control has been proposed, drawing on the hierarchical generative models used in perceptual and active inference [58]. In this account, motor cortex sends descending predictions of the sensory consequences of movement rather than the driving commands specified by optimal motor control. Here, proprioceptive prediction errors are generated at the level of the spinal cord and result in activation of motor neurons through classical reflex arcs. Although there are commonalities between the two accounts, the key difference is that under optimal control, given a same task and a same state of the system, motor signals are context independent commands, whereas under active inference they are context-dependent predictions [59].
In order to disambiguate between these two theoretical accounts of mo-tor control, a recent work, performed at Nearlab with the collaboration of Villa Beretta Rehabilitation Center and the Institute of Neurology (UCL, London) [6], investigated the effect of altered signals from the primary mo-tor cortex, by experimentally manipulating both volitional movement and proprioception (i.e. context) and examining the effects on the interactions between cortical motor and sensory areas. It has been defined an experi-mental protocol that only alters proprioception in different conditions while maintaining constant movement kinematics to reveal which areas and which connections are sensible to proprioception alteration. This study has high-lighted that M1 and S1 exhibit a profound interaction between artificially altered sensory feedback and volitional movement. Changes in coupling between these regions support an active inference account of motor control, in which sensorimotor integration rests upon the context-sensitive assimila-tion of descending motor predicassimila-tions.
In the context of the same aforementioned study, using the same exper-imental protocol and considering further cortical regions in addition to M1 and S1, the purpose of this thesis was therefore to investigate the overall functioning mechanisms of the motor control loop within the brain of healthy subjects and, conversely, of neurological patients, in order to corroborate the alternative theory of the active inference account of motor control with par-ticular attention to the investigation of the carryover effect. Specifically, through the analysis of time series extracted from functional magnetic res-onance images (fMRI) taken during FES therapy sessions, has been tried to assess how and where altered proprioception information interact with the intentional movement, how cortical brain regions interact and influence each other and how this coupling/effective connectivity is influenced by altered proprioception.
Brain connectivity is a concept that can be defined at different spatial scales, but procedures and models used in this study deals with the macro scale aspects that are studied in neuroimaging, as opposed to micro scale connections between individual neurons. Connectivity, when discussing the whole brain, can refer to three different concepts regarding brain organisa-tion and funcorganisa-tion, that are anatomical, funcorganisa-tional, and effective connectivity. Structural connectivity refers to networks in the brain, formed by physical connections between neurons, neural populations or anatomically segreg-ated brain regions. The physical connections can be formed by synapses between neurons, or white matter fibre pathways between neural popula-tions. Physical pathways are relatively stable over short time periods, but due to neural plasticity significant morphological changes can occur over longer time periods. In the field of neuroimaging, functional connectivity is defined as temporal correlations between neurological events and it is an ob-servable phenomenon, i.e. correlations in BOLD (Blood Oxygantion Level Dependent) signal between spatially separated brain regions, and so meas-uring it does not require a model.
Effective connectivity, instead, is related to causality and directionality, and it attempts to explain these correlations by way of some model explain-ing how they arise. The parameters of such a model are said to be the effective connections. Therefore, effective connectivity methods, that at-tempt to make inferences about causation and directed influences between regions, usually require a model that attempts to describe the causal influ-ence between regions exhibiting some degree of functional interaction.
Crucially this work was aimed to better understand the underlying mech-anism and key features of the carryover effect, by evaluating differences between groups of patients showing or not a FES carryover. The
pres-ence/absence of a long-term recovery of motor functions (i.e. carryover effect), in patients following the rehabilitation program, was determined us-ing a quantitative comprehensive method proposed in [10] that evaluates functional improvement on a single-subject yes/no base combining multiple measures (e.g., kinematic, muscular) in order to assess a stable functional improvement and it is validated against clinical evaluation.
In this context the Dynamic Causal Modelling (DCM) methods have been used to model interactions among neuronal populations at cortical level and to infer directed connectivity among brain regions and the modulatory effect of externally driven electrical input over these couplings. DCM is a technique for the characterization of effective connectivity within networks of distributed neuronal responses [60] [61], as measured with fMRI [11] or electromagnetic responses as detectd by EEG or MEG [62]. This technique is based on the Bayesian inference framework which integrate prior knowledge and observations to estimate parameters of the posterior distributions. DCM is an approach aimed at the identification of nonlinear input-state-output systems. By using a bilinear approximation to the dynamics of in-teractions among states, the parameters of the implicit causal model reduce to three sets. These comprise (i) parameters that mediate the influence of extrinsic inputs on the states, (ii) parameters that mediate intrinsic coupling among the states, and (iii) parameters that allow the inputs to modulate that coupling. Identification proceeds in a Bayesian framework given known deterministic inputs and the observed responses of the system. In the con-text of the analysis of effective connectivity using experimentally designed inputs and fMRI responses, the coupling parameters correspond to effective connectivity and the bilinear parameters reflect the changes in connectivity induced by inputs (in this case FES).
A number of previous studies used the framework of Dynamic Causal Mod-eling to model effective connectivity between brain areas involved in the motor control mechanism [6] [63] [64] [65] [14]. Similarly, in this work func-tional magnetic resonance images have been used, of subjects undergoing experimentally designed task-oriented activities. Following the Statistical Parametric Mapping (SPM) paradigm, after undergoing a pre-processing step and a statistical analysis, the Blood-Oxygen-Level-Dependent (BOLD) images resulted in activation maps relative to defined inputs, from which the time series of activation of neuronal clusters have been extracted to char-acterize the desired Regions Of Interest (ROI) and used in the subsequent modeling stage.
From the analysis of estimated parameters of DCM models we would be able to discriminate the behaviour of patients showing or not the carryover
effect and to highlight any changes in effective connectivity throughout the rehabilitation program. In other words the scientific question to which we tried to answer is: how does the motor control loop update itself in a success-ful motor recovery and what goes wrong when the rehabilitation treatment does not show significant motor improvements ?
The thesis is structured as follows.
In Chapter 2 a brief background about stroke symptoms and causes is given, along with a discussion about the principles behind neural motor control and the rehabilitation after stroke.
Chapter 3 provides the theoretical background to functional magnetic onance imaging based on the underlying principles of nuclear magnetic res-onance, the localised change in blood flow that accompanies neural activity, and the corresponding signal that is measured; then data processing and the statistical analysis procedures for the creation of activation maps are described.
Chapter 4 gives a comprehensive overview of the theory behind Dynamic Causal Modelling (DCM) framework.
Chapter 5 presents materials and methods used in this work. In Chapter 6 results are presented and discussed.
Chapter 7 outlines conclusions about obtained results, limitations of the study and future research directions.
Chapter 2
Dynamic Causal Modeling
2.1
Introduction – DCM for fMRI
Dynamic Causal Modelling (DCM) was first introduced for fMRI data by Friston and colleagues in 2003 [11], and integrated into the open-source Statistical Parametric Mapping (SPM) software running in Matlab. DCM was introduced as a way of inferring effective connectivity and it is fun-damentally different from previously employed methods in that it was
in-Figure 2.1: A schematic representation summarising the meaning of parameters in the bilinear equation and the forward mapping of neural states into BOLD response