UNIVERSITA' DI BOLOGNA
SCUOLA DI SCIENZE
Corso di laurea magistrale in Biologia Marina
Species identification of archived fish
bones collected from the Mediterranean
Sea 100 years ago using molecular
techniques.
Tesi di laurea in
Struttura e Connettività delle Popolazioni Marine
Relatore
Presentata da
Prof. Fausto Tinti
Francesco Massari
Correlatori
Dott. Gregory N. Puncher
Dott.ssa Elisabetta Cilli
III sessione
Table of Contents
Table of Contents ... 1
Abstract ... 5
1. Introduction ... 5
1.1 The Massimo Sella Archive ... 5
1.2 Problems of historical samples ... 6
1.2.1 DNA damage ... 6
1.2.2 Contamination ... 9
1.3 Developing a new protocol ... 10
1.4 Species identification ... 11
1.4.1 Molecular markers ... 12
1.4.2 Mitochondrial DNA ... 12
1.4.3 The Introgression Problem ... 13
1.4.4 DNA Barcoding ... 14
1.4.5 Phylogenetic trees ... 15
1.4.6 Character Attributes ... 16
2. Aim of the research ... 19
3. Materials and methods ... 21
3.1 Historical Samples ... 21
3.2 Bone powder extraction ... 21
3.2.1 Cleaning of the bones. ... 21
3.2.2 Removal of bone powder ... 22
3.3 aDNA extraction ... 23
3.4 Genetic analysis ... 26
3.4.1 Primer design ... 26
3.4.2 Polymerase Chain Reaction ... 27
4. Results ... 29 4.1 aDNA extraction ... 29 4.2 Amplifications ... 32 4.3 Species identification ... 33 4.3.1 Characteristic attributes ... 34 5. Discussion ... 35 6. Conclusions ... 43 7. Bibliography ... 45 7.1 Software references ... 50 8. Appendix ... 52 Ringraziamenti ... 60
Abstract
Abstract
With the discovery that DNA can be successfully recovered from museum collections, a new source of genetic information has been provided to extend our comprehension of the evolutionary history of species. However, historical specimens are often mislabeled or report incorrect information of origin, thus accurate identification of specimens is essential. Due to the highly damaged nature of ancient DNA many pitfalls exist and particular precautions need to be considered in order to perform genetic analysis. In this study we analyze 208 historical remains of pelagic fishes collected in the beginning of the 20th century. Through the adaptation of existing protocols, usually applied to human remains, we manage to successfully retrieve valuable genetic material from almost all of the examined samples using a guanidine and silica column-based approach. The combined use of two mitochondrial markers cytochrome-oxidase-1(mtDNA COI) and Control Region (mtDNA CR), and the nuclear marker first internal transcriber space (ITS1) allowed us to identify the majority of the examined specimens using traditional PCR and Sanger sequencing techniques. The creation of primers capable of amplifying heavily degraded DNA have great potential for future uses, both in ancient and in modern investigation. The methodologies developed in this study can in fact be applied for other ancient fish specimens as well as cooked or canned samples.
Introduction
1. Introduction
Prior to the last two decades the study of evolutionary genetics has largely depended on extrapolation of information from living organisms in an effort to reconstruct details of the past. However, modern DNA provides only indirect evidence of the historical processes that have occurred over evolutionary time. With the discovery that DNA can be successfully recovered from museum collections, such as archeological bones or dried tissues, a new source of genetic information is now available for extending our comprehension of the evolutionary history of many species. For example, the draft genome reconstruction of the pathogen bacterium Yersinia pestis (Kirsten et al. 2011) suggests how the analysis of ancient infectious diseases will provide contributions towards our understanding of host-pathogen coevolution. DNA extracted from ancient specimens can help identify the population dynamics for both humans (Yao et al 2003) and animals (Leonard et al. 2000; Riccioni et al. 2010). The research field of paleogenomics offers a wide array of solutions to present day problems and therefore the research of ancient remains and natural history collections is becoming increasingly important.
1.1 The Massimo Sella Archive
At the beginning of the twentieth century, Massimo Sella (an Italian scientist and professor) collected many bones of Atlantic bluefin tuna, Thunnus thynnus, while investigating their biology, population dynamics and habitat use. He collected many hooks attached to the giant tuna captured in traps throughout the waters of Italy and Libya, gleaning information concerning their migration routes (Sella M. 1928; 1929). Throughout fifteen years (from 1911 to 1926) and across the Mediterranean Sea, he collected thousands of individual skeletal specimens in the form of vertebrae, fins, teeth and whole skeletal remains of juvenile and adult fishes of Mediterranean large pelagic species, moving far beyond the study of only the Atlantic bluefin tuna.
The Massimo Sella Archive, now stored at the laboratories Marine Biology and Fisheries, Fano, and Genetics & Genomics of Marine Resources and Environment (GenoDREAM), Ravenna, of the University of Bologna is one of the biggest historical collections of fishes found in Italian waters. It is an invaluable resource for research into
Introduction
6
historical genetic structuring and evolution of species in the past century (Riccioni et al. 2010).
Unfortunately, like many natural history collections arisen before the discovery of DNA, when professor Sella started to build up his archive, its ultimate role as a source of genetic material could not have been part of his plan and despite the remarkable preservation of some of the samples, most were not properly preserved. Moreover records of the specimens' origin and species identity are frequently incomplete, missing or incorrect. The use of molecular techniques can be used on this archive’s specimens to confirm species identity and evaluate the presence of valuable DNA for further genetic purposes.
1.2 Problems of historical samples
The study of DNA from long-deceased organisms can offer many answers to questions raised when studying the genetic history of a certain species. However many technical problems and pitfalls need to be avoided to allow the molecular evolutionists access to the information locked away in the preserved genetic material.
Three major and persistent obstacles make DNA analysis of ancient skeletal remains a very challenging enterprise. First the total amount of DNA preserved in very old bones and teeth is greatly reduced, due to degradation over time and the genetic material that does remain is highly damaged (Pääbo et al. 2005). Secondly, historical DNA that has withstood the ravages of time is often contaminated with exogenous DNA from bacteria, fungi or other microbial organisms (Noonan et al. 2005). Finally regardless of the environmental conditions from which the sample is excavated or collected, contaminating organic and inorganic compounds such as humic acid and salts leaking from the surrounding soil can accumulate in the cavities over the years. These compounds can be carried over during the extraction and inhibit enzymatic reaction such as the commonly used polymerase chain reaction (Rohland 2012).
1.2.1 DNA damage
Within living cells, the integrity of DNA molecules is continually maintained by enzymatic repair processes (Lindahl 1993). After the death of an organism the cellular compartments that normally sequester catalytic enzymes are lost and as a consequence
Introduction
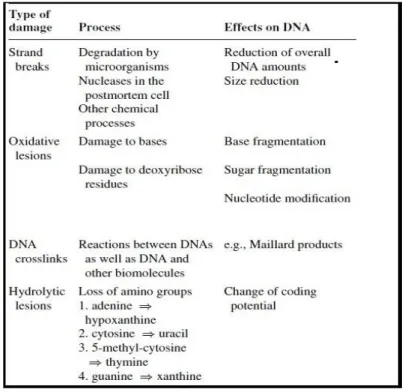
DNA is rapidly degraded by enzymes such as lysosomial nucleases. In addition, DNA molecules are degraded by a host of bacteria, fungi, and insects (Englinton et al. 1991). When tissues become rapidly desiccated after death or DNA becomes adsorbed into mineral matrix, the DNA can be protected from enzymatic and microbial degradation (Pääbo et al. 2004). Some examples of this damage are oxidation as well as the direct and indirect effect of background radiation that will modify nucleic bases and the sugar-phosphate backbone of the DNA. Furthermore deamination and depurination and other hydrolytic processes will lead to destabilization and corruption of DNA molecules (Pääbo et al. 2004). The most common type of damage to DNA extracted from ancient remains is its fragmentation into short chains, generally between 100 to 500 base pairs (Hofreiter et al. 2001). This reduction in size is due to both enzymatic processes that occur slowly but steadily after death and enzymatic hydrolytic cleavage of phosphodiester bonds in the phosphate sugar back bone (Lindahl 1993; Shapiro 1982). All these processes create problems for the retrieval of ancient DNA (henceforth aDNA) sequences (Table 1)
Introduction
1.2.2 Contamination
Higuchi et al. (1984) were the first to report the retrieval of informative DNA from an extinct animal, after they succeeded in cloning mitochondrial DNA sequences from a museum specimen of the Quagga (Equus quagga quagga), a member of the genus
Equus that became extinct more than 100 years ago. This was followed by the cloning
of repetitive nuclear DNA sequences from the skin of an ancient Egyptian 2400-year old mummy (Pääbo S. 1985). However for both of these studies only a very low proportion of the DNA was original, most of it was actually derived from extensive microbial contamination (Hagelberg & Clegg 1991). When conducting ancient DNA studies three kinds of contamination needs to be considered:
1. Contamination of sample surfaces through exposure to microorganisms, storage and collection contact and cross sample contamination during sample
processing.
2. Reagents, labware and disposable laboratory supplies that could have been contaminated during manufacture, packaging or distribution.
3. PCR carryover that can inadvertently transfer between tubes during the course of the study.
A variety of methods are used by ancient DNA researchers and forensic scientists to remove or exclude sources of contamination before the DNA extraction actually begins: washing the surface of the sample with either ethanol, distilled water and bleach, mechanical removal of the surface layer, extracting material only from the interior of the sample, irradiating the surface with ultraviolet light (Kemp & Smith 2005).
Unfortunately, all of these methods offer only a partial solution to the contamination problem. For example, while the use of ethanol and its effectiveness to kill microbial organism is well established, it alone cannot physically remove the remains of nucleic acid from such dead organism. The use of bleach (sodium hypochlorite, NaClO) as a cleaning agent on ancient samples has been proven effective (Kemp & Smith 2005). However, since it produces chlorinated bases (Hayastu et al. 1971), prolonged exposure to bleach can lead to a progressive reduction of DNA in smaller and smaller pieces, reaching eventually individual bases (Whiteman et al. 2002).
Introduction
10
The physical removal of a bone’s surface layer, in order to reach the inner side of a sample cannot guarantee the elimination or the exclusion of contamination. Also the powder produced during the friction of the surface can produce cross sample contamination.
Finally, while the use of short wavelength (254nm) ultraviolet light has been recognized as capable of effectively destroying molecular bonds in DNA, the irregular surface shape of the samples can block the UV light from reaching and sterilizing the external surface of bones.
1.3 Developing a new protocol
Considering all the existing problems is crucial in the setting up of a aDNA extraction protocol that optimizes the DNA yield to be used for downstream tasks. Since aDNA is available only in a highly degraded state, the extraction methods that use overly aggressive chemical treatments, such as high temperatures or the use of strong detergents, need to be avoided to prevent further damage to the aDNA. To properly carry out this task two existing protocols (Riccioni et al. 2010; Dabney et al. 2013) were selected as starting points and through a collaboration with the department of Cultural Heritage at the University of Bologna, Ravenna, various modifications and tests were performed in order to optimize efforts.
Guidelines precautions
Paleogenomics has dealt with these problem through the publication of guidelines that are designed to ensure the quality of ancient DNA data, analysis and interpretation of results. Starting from a few relatively simple suggestions, these guidelines have evolved over time and have become a more exhaustive and extensive list of requirements resulting in the well-known nine key-criteria for authenticity defined by Cooper & Poinar (2000).
Introduction
The nine criteria for authenticity:
1. Isolation of work areas: to separate samples and extracted DNA from PCR amplified products.
2. Negative control extractions and amplifications: to screen for contaminants entering the process at any stage.
3. Appropriate molecular behavior: owing to DNA degradation, the successful amplification of large DNA fragments in ancient DNA studies should be treated with caution.
4. Reproducibility: multiple PCR and extractions should yield consistent results. 5. Cloning of products: to assess for damage, contamination and jumping PCR. 6. Independent replication: the generation of consistent results by independent
research groups.
7. Biochemical preservation: preservation of other biomolecules that correlate with DNA survival (e.g. collagen or amino-acid racemization) should indicate good sample preservation.
8. Quantification: by competitive PCR or Real-Time PCR to give an indication of the number of starting templates in the reaction.
9. Associated remains: are associated remains equally well preserved, and do they show evidence of contamination?
It needs to be underlined that these precautions should be followed especially when studying ancient human remains. For the analysis of non-primate historical specimens the use of these precaution is not strict.
1.4 Species identification
While the identity of most living adult fishes is essentially unambiguous, basing the identification on morphological attributes can be problematic in situations where physical characteristics are difficult to interpret, or are completely missing. The most abundant faunal remains are partial skeletons. Bones and teeth are the hardest tissues of vertebrates and while their preserved shape can often reveal the species to which they belong, distinguishing the actual species can prove to be quite problematic, if not impossible, when more members of the same family or genus share similar
Introduction
12
morphological features. It has long been recognized that DNA sequence diversity, whether assessed directly or indirectly through protein analysis, can be used to discriminate species (Ward et al. 2005). Several protocols have been described for species identification of marine animals in recent years, based on different technologies, such as isoelectric focusing, high performance liquid chromatography, sodium dodecyl-sulfate polyacrylamide gel electrophoresis, enzyme-linked immune-absorbent assay, and starch gel electrophoresis (reviewed by Viñas & Tudela 2009). Among these, DNA-based methodologies are one of the most promising approaches since they provide very precise information, and due to their robustness, they can be applied to all of the different life stages of marine species and almost every kind of sample, including ancient ones.
1.4.1 Molecular markers
Diagnostic molecular markers can provide a means for positive identification when morphological identification is uncertain (Padial et al. 2010). Various molecular markers have been used to identify fish eggs and larvae including allozymes, polymerase chain reaction (PCR)/restriction fragment length polymorphism (RFLP) analysis, multiplex PCR and sequencing (reviewed by Paine et al. 2007). The genetic markers chosen for this study were mitochondrial DNA cytochrome-c-oxidase subunit I (COI), the mitochondrial DNA Control Region (mtDNA CR), and the ribosomal DNA first Internal Transcribed Spacer (ITS1) located in the nuclear genome.
1.4.2 Mitochondrial DNA
Mitochondrial DNA is more likely to survive in ancient specimens than nuclear DNA because they occur in much higher numbers per cell. Out of necessity there is an almost complete reliance on mitochondrial DNA sequences for phylogenetic studies of ancient faunal remains.
Primers
As already established the DNA that can be retrieved from ancient samples is short in length. This length of the DNA molecules compelled us to create new pairs of primers
Introduction
capable of amplifying short fragments of diagnostic DNA. Primers were designed to attach to conserved regions with diagnostic bases located between both annealing sites
Cytochrome oxidase subunit 1
One of the most conserved protein coding genes in the mitochondrial genome is cytochrome oxidase subunit I (COI; Brown W.M. 1985). This gene is critical for cellular energy production and this functional importance restricts the frequency of mutations (Rawson & Burton 2002). The high level of conservation of COI allows for the design of a primer pair that successfully amplifies the same fragment across the diverse members of the Scombridae family. It is not surprising that the COI has broadly been used for species identification being the most commonly used gene region to be applied in DNA barcoding, thanks also to the creation of sequences databases such as the Barcode of Life Database System (Ratnasingham & Hebert 2007) and FISH-BOL (Ward et al. 2009).
1.4.3 The Introgression Problem
In the case of the genus Thunnus the validation of the genetic marker for species identification is critical due to the observed introgression between species (Bremer et al. 1997; Chow & Kishino 1995). This phenomenon, also known as introgressive hybridization, is defined as the movement of a gene from a species into the gene pool of another and has been described among several tuna species. This introgression can confound the results of genetic analysis and species misidentification can occur if the genetic marker is not appropriate. For instance, species identification based on nuclear genetic markers cannot distinguish between T. thynnus and T. orientalis (Chow et al. 2006). Also, the low genetic distance between T. albacares, T. atlanticus, T. tonggol can easily generate misleading results if a marker with low genetic variability is used (Alvarado Bremer et al. 2005). Another consideration is that some members of the T.
alalunga species and T. orientalis are so close genetically (Alvarado Bremer et al. 1997,
2005; Chow et al. 2006) that depending on the methodology used the distinction between the two species may not be possible (Chow & Kishino 1995). About 2–3% of
T. thynnus individuals show mtDNA sequence identical to T. orientalis. The same
Introduction
14
mitochondrial DNA sequences equal to T. thynnus. Introgression can also occurs between T. alalunga and T. thynnus, with about 2–3% of the latter species’ individuals having an identical sequence to T. alalunga (Viñas & Tudela 2009).
Mitochondrial Control Region and Internal Transcriber Spacer 1
The mtDNA Control Region (CR) was considered valid for species identification because previous studies based on this genetic marker had already analyzed Thunnus individuals and had detected introgression between some of them (Alvaradro Bremer et al. 2005). The nuclear Internal Transcriber Spacer 1 (ITS1) is a recombining, biparental marker, which can reveal recent gene flow and hybridization events (Mayer & Soltis 1999).Thus the combined use of both mtDNA CR and rDNA ITS1 can be considered ideal to look for introgression in the Thunnus genus and pairs of primers that amplified in these regions were also developed.
1.4.4 DNA Barcoding
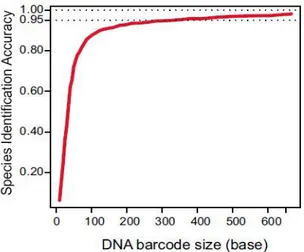
DNA barcoding is a taxonomic method that uses a short genetic DNA marker of an organism to identify it as belonging to a particular species. The Barcode of the 650-bp COI sequence (Herbert et al 2003) is easily sequenced and usually provides greater than 97% likelihood of species identity for samples of birds (Herbert et al. 2004), mammals (Hajibabaei et al. 2007), fishes (Ward et al. 2005) and arthropods (Hajibabaei et al. 2006). Despite the fact that the mini-barcode system has dramatically broadened the application of DNA barcoding the accuracy provided when working with short DNA fragments, such as ancient DNA sequences, is greatly reduced (Figure 1; Meusnier et al. 2008).
Introduction
Figure 1: The identification accuracy is plotted vs. the length (in base pairs) of the submitted sequence
(Meusnier et al. 2008).
The Barcode of Life Data Systems (also known as BOLD) is a sequence database specifically devoted to DNA barcoding of sequences in the COI region and is one of the most utilized system for the identification of species. At present, the algorithm that BOLD uses relies on distance-based identification despite the fact that such metrics have been rejected by the systematics community for almost two decades (Goldenstein et al. 2000). Previous barcoding of some scombrids has revealed the limitations of this distance-based approach (Lowenstein et al. 2009). For instance, recently separated taxa with large effective population sizes that are reasonably stable may constitute particular challenges for barcoding (Elias et al. 2007).
1.4.5 Phylogenetic trees
Almost every DNA barcoding study presents a phylogenetic tree as part of the standard analytical procedure (Ward et al. 2005; Chow et al. 2006; Viñas & Tudela 2009; Casiraghi et al. 2010). They are fast and easy to compute for large data sets but in the end they seem to fit only a graphic summarization capability (Collins& Cruickshank 2013). The main problem of phylogenetic trees is that the algorithms usually used will cluster the samples with the most likely similar taxa. This means that all the possible taxa need to be included in the tree, making the identification of an unknown species impossible (Collins et al. 2012). In situations of incomplete lineage sorting and species level paraphyly, tree based identification methods can only provide ambiguous or incorrect identifications (Lowenstein et al. 2009). Another drawback of phylogenetic trees is that they are incapable of properly allocating individuals when introgression is
Introduction
16
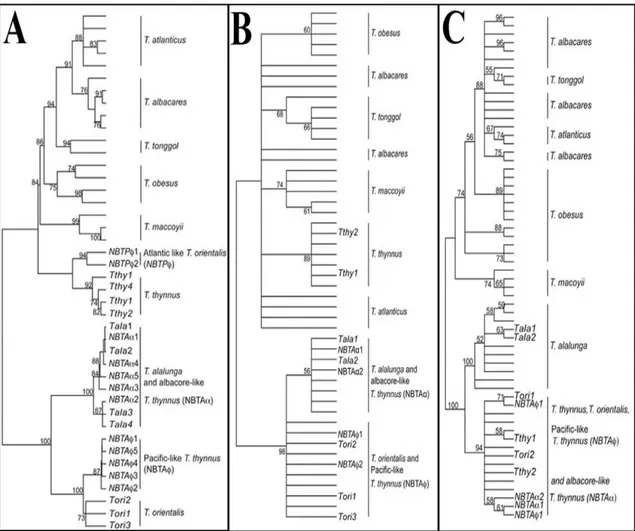
involved. For example, Viñas & Tudela (2009) were able to generate trees for species of the Thunnus genus with different genetic markers (Figure 2). However, depending on the used marker these trees show different clustering of species (for example T. thynnus) and different bootstrap values. Also the variation among many different species can influence the bootstrap values, decreasing the validity of the tree. It is important to point out that this kind of problems are not resolved by using different tree inference methods such as neighbor-joining or maximum likelihoods (Collins & Cruickshank 2013)
Figure 2: Phylogenetic trees of Thunnus sequences of mtDNA control region (A), mtDNA cytochrome oxidase 1 (B) and rDNA first internal transcriber spacer (C). The number on the nodes is the bootstrap
value, not shown if below 60%.
1.4.6 Character Attributes
Even if DNA barcoding and phylogenetic trees have become standard methods for identifying organisms across all life stages, current phenetic (classification based
Introduction
similarity) methods encounter trouble when working with short sequences. To overcome these issues species identification can be ‘character based’, whereby species are identified through the presence or absence of discrete nucleotide substitutions. Characteristic attributes are defined as diagnostic character states (genes, amino acids, base pairs or even morphological, ecological or behavioral attributes) that are found only in one clade but not in an alternate group that descends from the same node (Sarkar et al. 2002). Characteristic attributes are then divided into two major groups:
Pure: when they are shared by all members of the clade and are absent from the other clades,
Private: when they are shared only by some members of a clade but are absent from the other clades.
Both pure and private characteristic attributes can either be simple which are confined to a single nucleotide position, or compound which are combined states at multiple nucleotide positions.
After a particular characteristic attribute has been identified for a given taxonomic group, it can be used as diagnostic tool for species identification for this particular group (Rach et al. 2008)
Aim of the research
2. Aim of the research
The study of ancient specimens, usually belonging to natural historical collections, has proved to be an invaluable source of genetic material. The information gathered analyzing old specimens can be used to investigate the evolutionary history of many species, including fishes. Thus it is essential to be able to find methods capable of successfully extracting and analyzing DNA from ancient samples. In this study we test DNA extraction protocols, usually suited for human analysis and inquire if this method can be applied, and eventually optimized, for historical fish samples. The final aim of this research was to evaluate the presence of valuable genetic material from dried specimens in the Massimo Sella archive, and to see if the genetic identification of the 100-years old samples is possible. Since standard identification methods fail when using heavily degraded genetic material, such as ancient DNA (aDNA), in this study we explore the possibility of using a characteristic attribute key to achieve species identification of historical fish specimens.
Materials and methods
3. Materials and methods
3.1 Historical Samples
DNA was extracted from 207vertebrae and one tooth, collected from the Massimo Sella archive in aDNA dedicated lab unit at the GenoDREAM. All of the specimens in the archive have been inspected and provisionally identified by researchers in the past. Whenever possible, data regarding the age, year of catch, weight and length, along with location of capture were collected (Appendix, Table S1).
3.2 Bone powder extraction
All the aDNA extractions were performed using an electrical drill, drillbits of different sizes and a hand-saw with a removable blade. To avoid cross-sample contamination all the bones were treated individually during both the cleaning and the powder extraction procedures.
3.2.1 Cleaning of the bones.
All bones were sprayed with bleach (3% sodium hypochlorite, eluted 1:1 with distilled water) and left to soak for up to ten minutes. After this time the sample was wiped clean with paper towel, rinsed with distilled water and air-dried. Once dried a thin surface layer was removed using sand paper, then the surface was rinsed with bleach and distilled water. All bones were left to dry for a minimum of 15 minutes under UV light (254nm wave length; Figure 3).
Materials and methods
22
3.2.2 Removal of bone powder
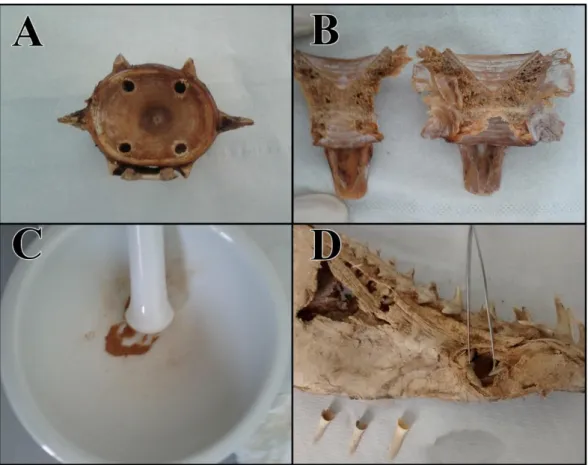
Depending on the size of the bone, the extraction procedure was adjusted to optimize the quantity of inner powder that could be extracted. In case of large vertebrae one or more holes were made with an electrical drill, paying particular attention not to pierce through the exterior surface of the bone (Figure 4A). If the bone wasn’t large enough for drilling, then the powder was collected by cutting the whole vertebra in half with a saw and then removing a portion of the inner bone with a sterile scalpel (Figure 4B). In some cases vertebrae were so small that the entire bone was reduced to powder with a mortar and a pestle, after being carefully cleaned (Figure 4C). Since DNA from teeth is generally well preserved within the protective encasing of enamel, the dentine was simply removed from the tooth, in order to avoid unnecessary damage to the tooth (Figure 4D).
Figure 4: Aftermath of the extraction performed with a drill (A), with a hand-saw (B) or by the reduction
of the whole bone to powder (C). The dentine of the only dental sample was removed from teeth, the empty shell of enamel of the remaining teeth (D).
Materials and methods
3.3 aDNA extraction
All aDNA extractions were performed in a laboratory dedicated to ancient DNA analysis in which PCR products are forbidden. The work table was thoroughly decontaminated with ethanol and bleach after each extraction. All of the laboratory’s supplies, with the exception of Qiagen’s MiniEluteTM Spin Column (guaranteed sterile by the manufacturer), were sterilized with UV light before every extraction. All of these precautions were followed in order to reduce contamination of the sample with exogenous modern DNA. A blank control (microtube containing distilled water) accompanied all the extraction sessions.
The two different protocols tested in this study were developed making changes to already existing protocols (Riccioni et al. 2010; Dabney et al. 2013). To understand which one of these protocols was the best suited to extract DNA from 100-year-old bones, 20 extractions were performed using each protocol (Box 1). To further understand if these protocols could be improved, 30 more extractions were performed with changes to the volume of the reagents (Box 2). The most important changes to the modified protocol of Dabney et al. (2013; heretofore referred as the “silica protocol”) was the decision to double the volume of the extraction buffer and the binding buffer by splitting the bone powder of each sample into two different microtubes and then using a single silica column for the binding step. This modification allowed for complete digestion of the bone powder. The products of both protocols were then compared using quantification using Invitrogen’s Qubit® 2.0 Fluorometer.
The final versions of the two protocols are featured below.
Dextran Blue Protocol (modified protocol of Riccioni et al. 2010)
All of the volumes (μL) for the Binding and Washing steps were doubled from the original version.
Extraction:
1. Incubate 200mg of bone powder overnight in a shaker at room temperature in 1.6 mL of EDTA buffer (0.5 M, pH 8.0).
Materials and methods
24
3. Discard supernatant.
4. Add 1.6 mL of extraction buffer (0.1 M EDTA, 0.5% N-laurylsarcosine-Na salt) and 100 μL of 20 mg/mL Proteinase K to the decalcified bone precipitates. 5. Incubate overnight at 44°C in a shaker.
6. Centrifuge at 12,000 rpm for 10 minutes at room temperature. 7. Transfer 250 μL of extraction solution to another microtube.
Binding:
1. Add 3.5 μL of 1 μg/μL Dextran Blue, 500 μL of 4M NH4-acetate, and 1000 μL of 96% volume ethanol.
2. Precipitate DNA on ice for 10 min and then centrifuge at 14,000 rpm for 15 min at 4°C.
3. Discard supernatant.
Washing:
1. Add 500 μL of 70% volume ethanol and centrifuge at 14,000 rpm for 5 min at 4°C.
2. Discard supernatant.
3. Dry the sediment at 55°C on a block, or overnight on the bench.
Elution:
1. Add 50 μL of distilled sterile water.
Silica protocol (modified protocol of Dabney et al. 2013)
Before starting, split 100mg of bone powder from the same sample into two different eppendorfs, considering them as two different samples during the Extraction step. Then, during the Binding step, filter both aliquots using a single silica column.
Materials and methods
Extraction:
1. Add 432 μL of EDTA (0.5M, pH 8.0) to each microtube. 2. Incubate for 16-24h, in a shaker at 37°C.
3. Add 70 μL of Proteinase K to each microtube. 4. Incubate for 16-24h, in a shaker at 37°C.
5. Centrifuge the eppendorfs for 3 minutes at 10,000 rpm. 6. Transfer supernatant into new microtubes.
Binding:
1. Add 1004 μL of Binding Buffer to each microtube. 2. Transfer 753 μL into a MiniEluteTM Spin Column. 3. Centrifuge for 4 minutes at 14,000 rpm.
4. Add the remaining 753 μL to the respective column. 5. Centrifuge for 4 minutes at 14,000 rpm.
6. Repeat the steps 1-to-5 for the respective duplicate
Binding Buffer composition: Guanidine Thiocyanate (5M), Tween 20 (0.05%), Isopropyl alchol (40% vol/vol), Sodium acetate (90mM pH 5.2) and distilled water.
Washing:
1. For each MiniEluteTM Spin Column add 750 μL of PE buffer. 2. Centrifuge for 2 minutes at 6,000 rpm.
3. Discard the flow-through. 4. Repeat once.
5. Dry-spin for 1 minute at 14,000 rpm.
6. Place the MiniEluteTM Spin Column in a fresh 1.5-mL collection tube.
Washing Buffer composition: Qiagen’s Buffer PE eluted with 96 % ethanol, by Qiagen’s default instruction.
Materials and methods
26
Elution:
1. Add 60 μL of pre-heated (60-70°C) distilled water. 2. Incubate room temperature for 10 minutes.
3. Centrifuge for 1 minute at 8,000 rpm. 4. Centrifuge for 2 minutes at 10,000 rpm.
3.4 Genetic analysis
3.4.1 Primer design
Primers capable of amplifying short sequences of the cytochrome oxidase subunit 1 (COI) gene, across the members of the Scombridae family were developed using Primer3 (Rozen & Skaletsky 1999). An alignment containing 74 reference sequences of different Scombridae species was used to identify sections of the gene that contained variable sites, diagnostic of species, with highly conserved flanking sequences appropriate for primer attachment. Primers where designed to amplify between 90-200 base pairs, because of the highly fragmented nature of historical DNA. The same strategy was used to design primers suited for Xiphias gladius (swordfish, the unique member of the Xiphiidae family in the Mediterranean) and two cartilaginous species of the Lamnidae family (shortfin mako, Isurus oxyrinchus and Great White Shark,
Carcharodon carcharias). A similar approach was used for the design of Thunnus
species-specific primers. Reference sequences are reported in the Appendix, Table S2. All of the primers were designed with careful considerations given to the physical and structural properties of the oligos such as annealing temperature, guanine and cytosine content and tendency towards self-complementary binding. Finally all the primers were then tested using the PCR simulation software Amplifix ( http://crn2m.univ-mrs.fr/pub/amplifx-dist).
Materials and methods
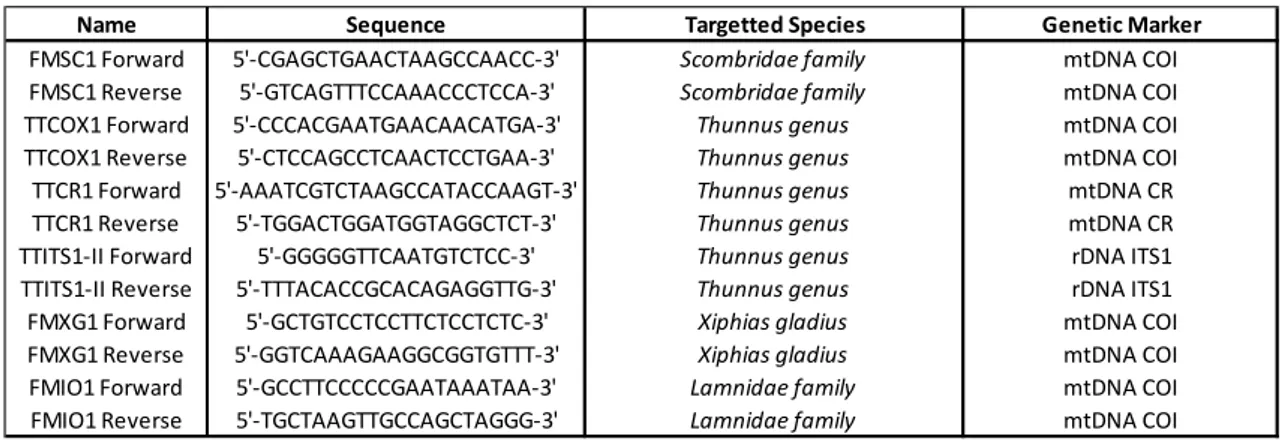
Table 2: List of the designed primers.
3.4.2 Polymerase Chain Reaction
DNA amplifications were carried out using Promega’s GoTaq® G2 Flexi DNA
Polymerase kit and Biometra Tgradient96 thermocycler in 50μL reactions. A blank sample without aDNA was used in each run to test for contamination. The reaction buffer was created following the recipe listed in Table 3.
Table 3: Reaction buffer recipe used for a 50μL PCR.
Thermal cycles included an initial denaturation step for 3 minutes at 94°C, followed by 35 cycles of denaturation at 94°C for 30s, annealing between 58°C and 60°C (depending on the primers used) for 30s, extension at 72°C for 30s and a final elongation step for 3 minutes at 72°C.
Gel electrophoresis tests confirmed whether the amplifications were successful. We used a 1.5% resolution agarose gel, ideal for short length DNA.
Name Sequence Targetted Species Genetic Marker
FMSC1 Forward 5'-CGAGCTGAACTAAGCCAACC-3' Scombridae family mtDNA COI FMSC1 Reverse 5'-GTCAGTTTCCAAACCCTCCA-3' Scombridae family mtDNA COI TTCOX1 Forward 5'-CCCACGAATGAACAACATGA-3' Thunnus genus mtDNA COI TTCOX1 Reverse 5'-CTCCAGCCTCAACTCCTGAA-3' Thunnus genus mtDNA COI TTCR1 Forward 5'-AAATCGTCTAAGCCATACCAAGT-3' Thunnus genus mtDNA CR TTCR1 Reverse 5'-TGGACTGGATGGTAGGCTCT-3' Thunnus genus mtDNA CR TTITS1-II Forward 5'-GGGGGTTCAATGTCTCC-3' Thunnus genus rDNA ITS1 TTITS1-II Reverse 5'-TTTACACCGCACAGAGGTTG-3' Thunnus genus rDNA ITS1 FMXG1 Forward 5'-GCTGTCCTCCTTCTCCTCTC-3' Xiphias gladius mtDNA COI FMXG1 Reverse 5'-GGTCAAAGAAGGCGGTGTTT-3' Xiphias gladius mtDNA COI FMIO1 Forward 5'-GCCTTCCCCCGAATAAATAA-3' Lamnidae family mtDNA COI FMIO1 Reverse 5'-TGCTAAGTTGCCAGCTAGGG-3' Lamnidae family mtDNA COI
Reagent Stock concentration Volume for each sample
H2O - 26,75μl
GoTaq® Flexi Buffer 5X 5 μl
MgCl2 Solution 25mM 6 μl
PCR Nucleotide Mix 10mM 2 μl
Forward Primer 10μmol/l 2,5 μl
Reverse Primer 10μmol/l 2,5 μl
GoTaq® G2 Flexi DNA
polymerase template 5u/μl 0.26 μl
Materials and methods
28
3.4.3 Species identification
To construct a characteristic attributes key we visually inspected 5 mitochondrial COI reference sequences of each of the most common Scombridae family, downloaded from NCBI (http://www.ncbi.nlm.nih.gov/), looking for particular variable sites that could serve as diagnostic sites for the species. All the sample’s sequences, obtained via Macrogen’s EZ-seq service, were analyzed and edited using FinchTV (http://www.geospiza.com/ftvdlinfo.html) software. Once verified these sequences were aligned, using ClustalW algorithm in MEGA 6.0 (Tamura et al. 2013), along with the reference sequences from NCBI. Finally, the diagnostic sites were checked to identify the species. To assess the identity of the five non-scombrid samples the use of species specific primers were considered sufficient.
A phenogram containing five reference sequences for each of the most common scombrids species was built using maximum likelihood inference methods and the Kimura-2-parameter (Kimura 1980) distance model. Statistical validation was tested performing bootstrap analysis (1000 repeats; Felseinstein 1985) on MEGA6.0. The tree
was then analyzed, modified and scaled using FigTree
(http://tree.bio.ed.ac.uk/software/figtree/).
Barcoding analysis was performed querying the amplified sequences on public sequences databases BOLD (http://www.boldsystems.org/), for the mitochondrial COI sequences, and to NCBI’s BLAST (http://blast.ncbi.nlm.nih.gov/Blast.cgi) for mtDNA COI, CR and nuclear ITS1 sequences.
Results
4. Results
4.1 aDNA extraction
Genomic aDNA from all 208 samples was successfully extracted and quantified (Appendix, Table S1) however not all of the extractions were successfully amplified (Table 4).
The comparison between non-modified versions of the two protocols revealed that the DNA yields of the two methods are not significantly different (p value >0.05; Box1).
Results
30
In contrast, the second comparison revealed that the genetic yields from the three extraction methods were significantly different (p value < 0.05; Box2).
Results
A comparison of the concentration of the DNA extracted from all the Thunnus vertebrae, collected in three regions, is reported in Box 3. Statistical analysis revealed that while the averages are very different, due to the high variances this difference is not significant (p value> 0.05, F>Fcrit; Box 3)
Results
32
4.2 Amplifications
Some of the aDNA extracts showed different degrees of amplification while others did not amplify at all (Figure 6). Also, for several samples, a significant portion of the obtained sequences was too noisy to consider the sequence valid (Figure 7).
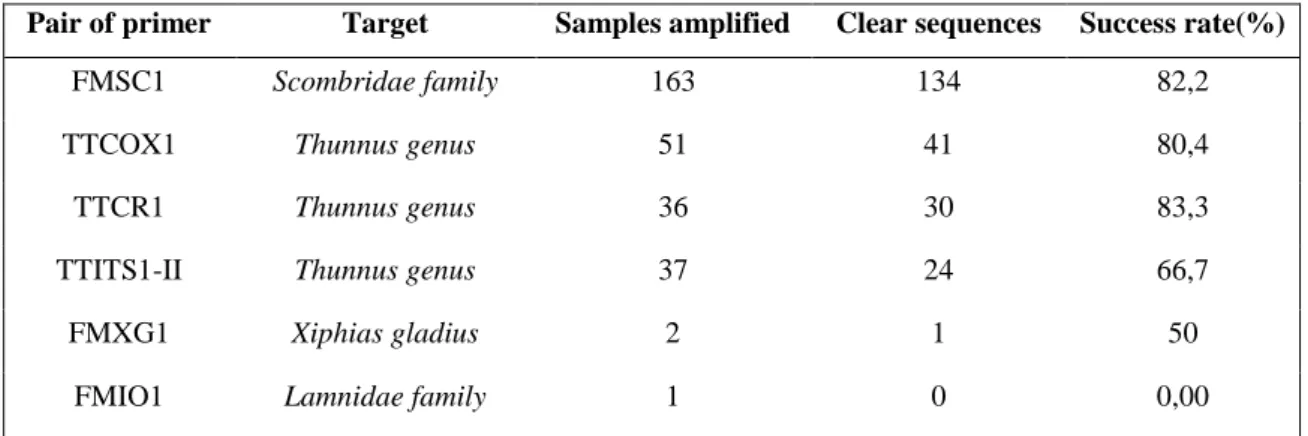
Table 4: List of primer pairs with their identified target taxa and amplification success rates.
Pair of primer Target Samples amplified Clear sequences Success rate(%)
FMSC1 Scombridae family 163 134 82,2
TTCOX1 Thunnus genus 51 41 80,4
TTCR1 Thunnus genus 36 30 83,3
TTITS1-II Thunnus genus 37 24 66,7
FMXG1 Xiphias gladius 2 1 50
FMIO1 Lamnidae family 1 0 0,00
Figure 6: Example of a PCR electrophoresis gel showing differences in amplification efficiency. Highly effective amplifications are shown as dark bands, less effective amplifications as lighter bands and failed amplifications are columns with bands absent. Standard ladders are shown on the extremes of the gel as a measure of fragment length. In the present figure, the length of DNA amplified is approximately 100bp
Sample codes are as follows: FAR = Auxis sp.; FP = Sarda sarda; FSS = Scomber scombrus; NEG = negative control.
Results
Figure 7: Example of two amplified sequences. Each letter represents the nucleotide base in that position. The gray rectangles above the letters represent the quality score of the base while the blue line represent a
threshold of acceptance. The electropherogram on top is an example of successful amplification and sequencing, while the electropherogram on the bottom is exemplary of failure.
4.3 Species identification
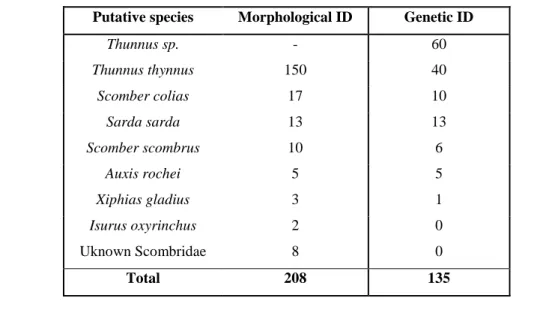
The morphological identification of the samples (carried out by researchers in the past) provided a good starting point for the further genetic analysis. As expected the vast majority of the analyzed samples were identified as T. thynnus; however, due to the bad quality of some sequences the genetic identification was not possible for all of the amplified extractions (Table 5; for further detailed information see Appendix, Table S1).
Table 5: Overview of the samples identified by the original collectors using morphological methods and the genetic tools used in this study. All the morphological identifications refer to labels assigned by
researcher in the past.
Putative species Morphological ID Genetic ID
Thunnus sp. - 60 Thunnus thynnus 150 40 Scomber colias 17 10 Sarda sarda 13 13 Scomber scombrus 10 6 Auxis rochei 5 5 Xiphias gladius 3 1 Isurus oxyrinchus 2 0 Uknown Scombridae 8 0 Total 208 135
Results
34
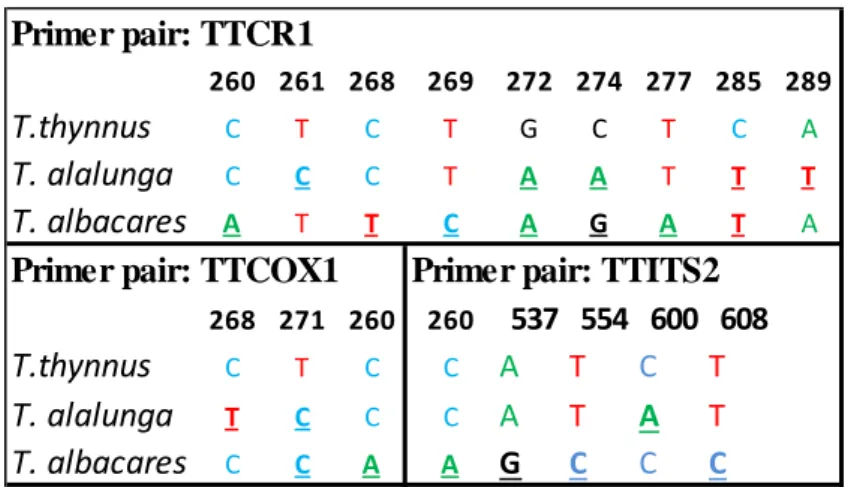
4.3.1 Characteristic attributes
Different characteristic attribute keys capable of differentiating species were found for each set of primers. However FMSC1 showed incapability to distinguish between the
Thunnus species (Figure 8) while for the other pairs (TTCR1, TTCOX1 and TTITS1-II,
specific for the Thunnus genus) these attributes were found (Figure 9).
Figure 8: Character-based key for species of Scombrid derived from 49 reference sequences. Numbers in the first row represents the nucleotides positions, and are numbered following Ward et al 2005 sequences.
The CA nucleotides are underlined.
Figure 9: Character-based key for the three species of Thunnus. The CA nucleotides are underlined and are numbered following Ward et al. 2005 (TTCOX1), Viñas et al. 2001 (TTCR1) and Viñas et al. 2009
(TTITS1-II). 86 94 97 106 107 109 112 121 130 133 140 142 145 148 155 163 167 169 T. thynnus G T G G A C C C C T G A G T A A A T T. alalunga G T G G A C C C C T G A G T A A A T T. albacares G T G G A C C C C T G A G T A A A T A. rochei G T G G A C C C C T G A G T A G A T A. thazard G C G A A C C C C T G A G T A G A T S. scombrus T T C A G C C T C T A T A C T A G C S.colias T T C A A C T T T C G T A C T G G C Sarda sarda G T G G A T T C C T G A G T A A A T E. alletteratus G T G G A C T C C T G A G T A C A T Primer pair : FMSC1 260 261 268 269 272 274 277 285 289 T.thynnus C T C T G C T C A T. alalunga C C C T A A T T T T. albacares A T T C A G A T A 268 271 260 260 537 554 600 608 T.thynnus C T C C A T C T T. alalunga T C C C A T A T T. albacares C C A A G C C C
Primer pair: TTITS2 Primer pair: TTCOX1
Discussion
5. Discussion
The species identification of historical samples from the Massimo Sella archive was overall a success. Through to the combined use of newly designed primers pairs we have developed a strategy that is able to identify historical fish remains Also, the combined use of both mitochondrial and nuclear markers proved to be a valid solution to account for introgression that can occur between some species the of Thunnus genus. The resulting data of the comparison of the two original protocols tested show that the extraction from old specimens of the Massimo Sella archive is possible. Even if these two protocols displayed no significant differences in DNA concentrations, the yield of extracts for every single sample was considered unsatisfactory for the expected downstream applications (Next Generation Sequencing and SNP panel genotyping). After numerous trials and adjustments we managed to determine a variation of the protocols that allowed us to greatly increase the extraction’s yield of both of the protocols. After evaluating the difference in yields between these various methods the optimized version of the Silica protocol was utilized to perform all of the 208 extractions, successfully completing the task.
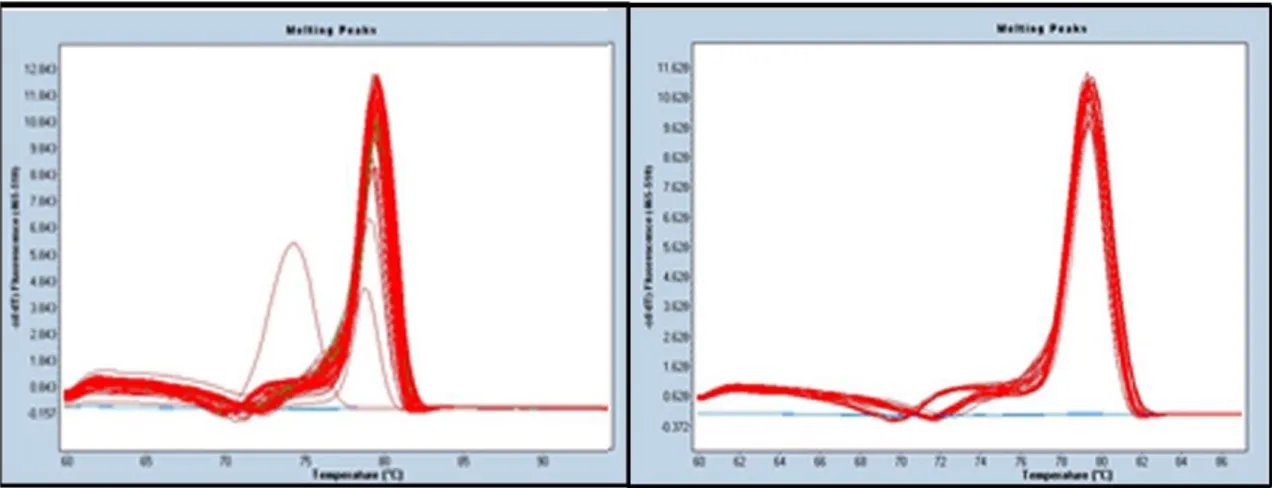
However, it has to be pointed that for a variety of reasons, outlined below, the identification of all the examined specimens was not possible. Even if all of the 208 extracts were successfully quantified, spectrophotometry quantification (Invitrogen’s Qubit) cannot reveal the origin of the analyzed DNA (exogenous vs. endogenous). Contamination remains the single most serious concern in the study of ancient DNA (Pääbo et al. 2004) as the presence of exogenous DNA usually exceed the amount of endogenous DNA by several fold (Noonan et al. 2005; Poinar et al. 2006; Green et al. 2006; Höss et al. 1996). While the use of species specific primer can help to eliminate the possibility of amplifying contaminant DNA, the use of more advanced (and expensive) quantification tools can characterize contaminations. For example, the use of a real-time PCR can help recognize the presence of a contamination through the use of melting curve analysis (Figure 10; Ririe et al. 1997).
Discussion
36
Figure 20: Example of a realtime-PCR performed on the same set of samples, amplified on different occasions, with TTCOX1 primer. On the left the small pink peak represents the presence of a
contaminated sample (Puncher et al. 2015, unpublished data).
Another problem that needs to be taken into account is the presence of PCR inhibitors that could compromise amplification reactions. Several adjustments can be made to resolve this problem, however, some of these methods may be problematic due to the damaged nature of ancient DNA. For example, the dilution of the DNA extracts, in the hope that the inhibitory elements will be sufficiently diluted for successful amplification, can help eliminate this issue. However, samples with very low concentrations DNA can end up being diluted to a degree that it is no longer amplifiable (Kaestle & Horsburgh 2002). Despite the fact that the use of isopropyl alcohol (Hänni et al. 1995) and the employment of silica based protocol (Rohland & Hofreiter 2007) can eliminate some inhibitory problems, to be completely sure of PCR inhibitors presence the use of a quantitative approach (qPCR) should be applied (King et al. 2009).
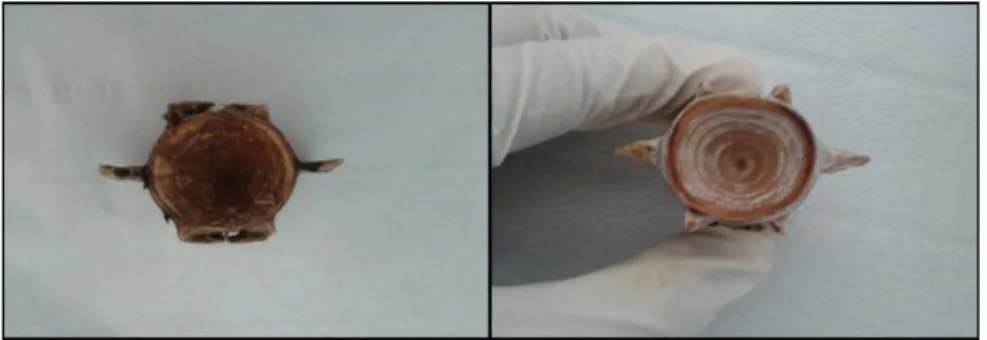
Regardless of the remarkable conditions of the examined samples, some of the specimens were not properly preserved. As mentioned above, it is expected that 100 years of aging can produce serious damage to the DNA of the specimen, however some of the analyzed bones were particularly clean with some of them also displaying marks typically used for age assessments (Figure 11). It has to be underlined that almost all of the tuna’s vertebrae collected from the Adriatic Sea had this appearance. It may be that many of these samples were cleaned using aggressive techniques. Thus the wide heterogeneity in the extracted DNA amounts from tuna bones could be attributed to these unknown cleaning methods. For example, some collectors routinely bleach or boil
Discussion
bones in order to ensure long-term preservation. If this is the case for some of the bones contained in the Massimo Sella archive, then the integrity of DNA contained in those samples may be severely compromised.
Figure 11: Vertebra of a tuna from the Adriatic Sea.
The design of primers capable of working with fragmented DNA strands allowed us to achieve, at least in part, the species identification. However, the standard methods of molecular identification didn’t work well with our sequences. For both the direct interrogation of the BOLD System (figure 12) and the NCBI Basic Local Alignment Search Tool (BLAST; figure 13), the identification was not achieved.
Figure 12: Submitted query of a FMSC1 amplicon, 90bp length to BoldSystem. Showed in the bottom red box are some of the many species that display a similarity score of 100% with the submitted sequence. The high number of compatible matches prevent the correct species identification of the
Discussion
38
Figure 13: Submitted query of a TTITS1-II amplicon, 50bp length, to NCBI’s BLAST. On the left column are displayed sequences of two different species of Thunnus that are compatible with the submitted sequence. In the red box the similarity score is highlighted. The 100% compatibility of both the
two species prevents the correct identification of the sequence.
As already mentioned, the use of a phylogenetic trees is rarely efficient when conducting species identification (Collins & Cruickshank 2013); sequences can fail to cluster correctly and the identification of sequences is often ambiguous or incorrect (Lowenstein et al. 2010). The maximum likelihood tree constructed in this study proved, as expected, to be a non-effective way to cluster species and unknown specimens, due to the high similarity between the short sequences (Figure 14).
Discussion
Figure 14: Maximum likelihood phylogenetic tree of 135 mtCOI amplified sequences and 70 mtCOI reference sequences. The bottom branch represents a collapsed tree of 159 sequences of various different
species, clustered together.
The identification was therefore obtained with the use of a Characteristic Attribute (CA) key (Sarkar et al. 2002). The first step of this identification was done with the use of the FMSC1 primer pair. This set of primers was able to amplify across all the Scombridae family members, and provided us DNA sequences long enough to look for CA diagnostic for Scombridae. The joined use of both “simple” (only one nucleotide) and “compound” (more than one nucleotide) CAs gave us an identification that was unambiguous for almost all of the specimens.
For example, the nucleotide #121 was a cytosine (C) for all of the examined member of the Scombridae family. However, when in this location a thymine (T) was found, the #121 nucleotide identify that sequence as either belonging only to Scomber colias or
Scomber scrombrus. The nucleotide site #130 displayed a cytosine for all the scombrids
with the exception of Scomber colias that showed a thymine in that location (see Figure 8). Therefore the use of the simple CA (#130) tell us that the species is Scomber colias, the use of the compound CA (both #121 and #130) identify the specimen as Scomber
Discussion
40
Figure 15: Example of an alignment file with some of our sample FMSC1 sequences (from 7.1 to FSS8), aligned with reference sequences. Pointed by the black arrows are two of the nucleotides sites diagnostic
for Scomber colias and Scomber scrombrus.
Unfortunately, the identification to species level was not possible for all individuals. While it is theoretically possible to distinguish between Auxis rochei and Auxis thazard using the CA at the nucleotide position #94, the length of the obtained sequences was too short for that nucleotide to be sequenced. A similar problem was encountered with
Sarda sarda individuals (nucleotide positions #109 and #112) which, due to the short
length of the amplified sequences, were not possible to be distinguished from Thunnus
spp. Another drawback of the FMSC1 primer pair is that a distinction between Thunnus
species was not possible, since no CAs were present in the amplified sequence (Figure 8).
However the combined use of the other pairs of genes and primers (specifically designed for the Thunnus genus) allowed us to confirm, at least in part, that the tested
Thunnus samples are indeed Thunnus thynnus. In fact, CAs were found in all of the
other primer sets utilized. The analysis of 37 Thunnus sp. nuclear ITS1 sequences amplified with the primer pair TTITS1-II successfully identified 22 of them as T.
thynnus. While CAs capable of discriminating between tuna species were present in the
amplified ITS1 sequences, most of those sequences are unreadable or lacking nucleotides due to sequencing errors, making the identification for all the 37 amplicons impossible (Figure 16).
Discussion
Figure 16: Example of an alignment file with some of our sample TTITS1-II sequences (from H10 to G6) aligned with reference sequences. Indicated by the black arrows are two of the nucleotide sites
diagnostic for Thunnus spp. The white spaces indicate missing nucleotides in the sequences.
The presence of diagnostic CAs was also found in the mitochondrial Control Region sequence marker amplified by the primer pair TTCR1, which proved to be capable of differentiating between tuna species, confirming that 30 of them are Thunnus thynnus. Similar to the TTITS1-II sequences, however, some of them were not considered for the identification because of poor quality reads. Despite the high amount of sequences obtained with the mitochondrial COI marker (TTCOX1) none of them were long enough to include the identified CAs, making these sequences unusable (Figure 17).
Figure 17: Example of an alignment file with some of TTCOX sequences (from D11 to F10) aligned with reference sequences.
Discussion
42
Finally the identification of only one of the five non scombrid specimens was possible due to the bad condition of the historical samples. The three putative swordfish’s vertebrae were not enclosed by a bone matrix and despite the successful amplification of two samples, only one of them was positively identified as Xiphias gladius. None of shark’s samples could be genetically identified.
The consecutive use of a primers capable of amplify for all scombrids, followed by the use of tuna specific primers proved to be an effective strategy for sample identification. The combined use of both mitochondrial and nuclear markers also proved to be a valid method for identification of introgression, as 11 of 51 specimens addressed as Atlantic bluefin tuna are confirmed to be T. thynnus by both TTCR1 and TTITS1-II (Appendix, Table S1). Even if the genetic recognition was not possible for all the specimens, the overall accordance of all the different molecular markers used, paired with the morphological identification confirms that the specimen identification was performed correctly.
The genetic techniques and markers developed in this study offer a wide array of uses for the near future. These methods can be suited for temporal analysis of population dynamics in fishes. Also further research with these tools can provide invaluable genetic information that can be applied for next-generation sequencing. The methods developed in this work can be also used for modern day problems, such as food forensics. For example, the identification of cooked and canned tunas is problematic due to damage caused by the cooking of the flesh (Makie et al. 1999). In this situation the use of our primers (able to amplify short DNA sequences) can be used for the identification of incorrectly labelled food items.
Conclusions
6. Conclusions
This study deal with the species identification of historical fish bone specimens of 100-year old feasible. Despite the high number of problems encountered, the procedures optimized in this work prove that the goal was actually reached, at least resolving some remaining problems. However, these results also show that more work needs to be done in order to be able move towards further goals. As methods to isolate and sequence endogenous ancient DNA continues to improve, ancient DNA studies will remain limited by problems typical of the field. However as the number and accuracy of such studies is increasing, paleogenomics is poised to play an increasingly important role in improving our understanding of evolutionary processes over short and medium term, hence the study of natural history collections will play a major role in the near future.
Bibliography
7. Bibliography
Alvarado Bremer, J. R., Naseri, I., & Ely, B. (1997). Orthodox and unorthodox phylogenetic relationships among tunas revealed by the nucleotide sequence analysis of the mitochondrial DNA control region.Journal of Fish
Biology,50(3), 540-554.
Alvarado Bremer, J. R., Viñas, J., Mejuto, J., Ely, B., & Pla, C. (2005). Comparative phylogeography of Atlantic bluefin tuna and swordfish: the
combined effects of vicariance, secondary contact, introgression, and population expansion on the regional phylogenies of two highly migratory pelagic
fishes.Molecular phylogenetics and evolution,36(1), 169-187.
Bos, K. I., Schuenemann, V. J., Golding, G. B., Burbano, H. A., Waglechner, N., Coombes, B. K., ... & Krause, J. (2011). A draft genome of Yersinia pestis from victims of the Black Death.Nature,478(7370), 506-510.
Brown, W. M. (1985). The mitochondrial genome of animals.Molecular
evolutionary genetics,95.
Casiraghi, M., Labra, M., Ferri, E., Galimberti, A., & De Mattia, F. (2010). DNA barcoding: a six-question tour to improve users' awareness about the
method.Briefings in bioinformatics, bbq003.
Chow, S., & Kishino, H. (1995). Phylogenetic relationships between tuna species of the genus Thunnus (Scombridae: Teleostei): inconsistent implications from morphology, nuclear and mitochondrial genomes.Journal of Molecular
Evolution,41(6), 741-748.
Chow, S., Nakagawa, T., Suzuki, N., Takeyama, H., & Matsunaga, T. (2006). Phylogenetic relationships among Thunnus species inferred from rDNA ITS1 sequence.Journal of Fish Biology,68(A), 24-35.
Collins, R. A., & Cruickshank, R. H. (2013). The seven deadly sins of DNA barcoding.Molecular ecology resources,13(6), 969-975.
Collins, R. A., Armstrong, K. F., Meier, R., Yi, Y., Brown, S. D., Cruickshank, R. H., ... & Johnston, C. (2012). Barcoding and border biosecurity: identifying cyprinid fishes in the aquarium trade.PLoS One,7(1), e28381.
Bibliography
46
Collins, R. A., & Cruickshank, R. H. (2013). The seven deadly sins of DNA barcoding.Molecular ecology resources,13(6), 969-975.
Cooper, A., & Poinar, H. N. (2000). Ancient DNA: do it right or not at all.Science,289(5482), 1139-1139.
Dabney, J., Knapp, M., Glocke, I., Gansauge, M. T., Weihmann, A., Nickel, B., ... & Meyer, M. (2013). Complete mitochondrial genome sequence of a Middle Pleistocene cave bear reconstructed from ultrashort DNA fragments.Proceedings
of the National Academy of Sciences,110(39), 15758-15763.
De Bruyn, M., Hall, B. L., Chauke, L. F., Baroni, C., Koch, P. L., & Hoelzel, A. R. (2009). Rapid response of a marine mammal species to Holocene climate and habitat change.PLoS genetics,5(7), e1000554.
Eglinton, G., Logan, G. A., Ambler, R. P., Boon, J. J., & Perizonius, W. R. K. (1991). Molecular preservation [and discussion].Philosophical Transactions of
the Royal Society of London. Series B: Biological Sciences,333(1268), 315-328.
Elias, M., Hill, R. I., Willmott, K. R., Dasmahapatra, K. K., Brower, A. V., Mallet, J., & Jiggins, C. D. (2007). Limited performance of DNA barcoding in a diverse community of tropical butterflies.Proceedings of the Royal Society B:
Biological Sciences,274(1627), 2881-2889.
Felsenstein, J. (1985). Confidence limits on phylogenies: an approach using the bootstrap.Evolution, 783-791.
Green, R. E., Krause, J., Ptak, S. E., Briggs, A. W., Ronan, M. T., Simons, J. F., ... & Pääbo, S. (2006). Analysis of one million base pairs of Neanderthal
DNA.Nature,444(7117), 330-336.
Goldstein, P. Z., Desalle, R., Amato, G., & Vogler, A. P. (2000). Conservation genetics at the species boundary.Conservation Biology,14(1), 120-131.
Goldstein, P. Z., & DeSalle, R. (2011). Integrating DNA barcode data and taxonomic practice: determination, discovery, and description.Bioessays,33(2),
135-147.
Hagelberg, E., & Clegg, J. B. (1991). Isolation and characterization of DNA from archaeological bone.Proceedings of the Royal Society of London. Series B:
Bibliography
Hajibabaei, M., Singer, G. A., Clare, E. L., & Hebert, P. D. (2007). Design and applicability of DNA arrays and DNA barcodes in biodiversity monitoring.BMC
biology,5(1), 24.
Hänni, C., Brousseau, T., Laudet, V., & Stehelin, D. (1995). Isopropanol
precipitation removes PCR inhibitors from ancient bone extracts.Nucleic acids
research,23(5), 881.
Hajibabaei, M., Janzen, D. H., Burns, J. M., Hallwachs, W., & Hebert, P. D. (2006). DNA barcodes distinguish species of tropical Lepidoptera.Proceedings
of the National Academy of Sciences of the United States of America,103(4),
968-971.
Higuchi, R., Bowman, B., Freiberger, M., Ryder, O. A., & Wilson, A. C. (1984). DNA sequences from the quagga, an extinct member of the horse family.
Hayatsu, H., Pan, S., & Ukita, T. (1971). Reaction of sodium hypochlorite with nucleic acids and their constituents.Chemical & pharmaceutical bulletin,19(10),
2189.
Hebert, P. D., Cywinska, A., & Ball, S. L. (2003). Biological identifications through DNA barcodes.Proceedings of the Royal Society of London. Series B:
Biological Sciences,270(1512), 313-321.
Hebert, P. D., Stoeckle, M. Y., Zemlak, T. S., & Francis, C. M. (2004). Identification of birds through DNA barcodes.PLoS biology,2(10), e312.
Hofreiter, M., Serre, D., Poinar, H. N., Kuch, M., & Pääbo, S. (2001). Ancient
DNA.Nature Reviews Genetics,2(5), 353-359.
Höss, M., Dilling, A., Currant, A., & Pääbo, S. (1996). Molecular phylogeny of the extinct ground sloth Mylodon darwinii.Proceedings of the National
Academy of Sciences,93(1), 181-185.
Kaestle, F. A., & Horsburgh, K. (2002). Ancient DNA in anthropology: methods, applications, and ethics.American journal of physical anthropology,119(S35),
92-130.
Kemp, B. M., & Smith, D. G. (2005). Use of bleach to eliminate contaminating DNA from the surface of bones and teeth.Forensic science international,154(1),
Bibliography
48
Kimura, M. (1980). A simple method for estimating evolutionary rates of base substitutions through comparative studies of nucleotide sequences.Journal of
molecular evolution,16(2), 111-120.
King, C. E., Debruyne, R., Kuch, M., Schwarz, C., & Poinar, H. (2009). A quantitative approach to detect and overcome PCR inhibition in ancient DNA extracts.Biotechniques,47(5), 941-949.
Kreader, C. A. (1996). Relief of amplification inhibition in PCR with bovine serum albumin or T4 gene 32 protein.Applied and Environmental
Microbiology,62(3), 1102-1106.
Leonard, J. A., Wayne, R. K., & Cooper, A. (2000). Population genetics of Ice Age brown bears.Proceedings of the National Academy of Sciences,97(4),
1651-1654.
Lindahl, T. (1993). Instability and decay of the primary structure of DNA.Nature,362(6422), 709-715.
Lowenstein, J. H., Amato, G., & Kolokotronis, S. O. (2009). The real maccoyii: identifying tuna sushi with DNA barcodes–contrasting characteristic attributes and genetic distances.PLoS One,4(11), e7866.
Mackie, I. M., Pryde, S. E., Gonzales-Sotelo, C., Medina, I., Pérez-Martın, R., Quinteiro, J., ... & Rehbein, H. (1999). Challenges in the identification of species of canned fish.Trends in food science & technology,10(1), 9-14.
Mayer, M. S., & Soltis, P. S. (1999). Intraspecific phylogeny analysis using ITS sequences: insights from studies of the Streptanthus glandulosus complex (Cruciferae). Systematic Botany, 47-61.
Neil Sarkar, I., Thornton, J. W., Planet, P. J., Figurski, D. H., Schierwater, B., & DeSalle, R. (2002). An automated phylogenetic key for classifying
homeoboxes.Molecular phylogenetics and evolution,24(3), 388-399.
Noonan, J. P., Hofreiter, M., Smith, D., Priest, J. R., Rohland, N., Rabeder, G., ... & Rubin, E. M. (2005). Genomic sequencing of Pleistocene cave
bears.Science,309(5734), 597-599.