UNIVERSITÀ DI PISA
Facoltà di Ingegneria
Laurea Specialistica in Ingegneria dell’Automazione
Tesi di laurea
Candidato:
Luca Profumo __________
Relatori:
Prof. Lorenzo Pollini - Università di Pisa __________
Prof. David Abbink - Delft University of Technology __________
HAPTIC SUPPORT SYSTEMS FOR
CURVE NEGOTIATION IN A DRIVING
SIMULATOR
Sessione di Laurea del 14/12/2012
Archivio tesi Laurea Specialistica in Ingegneria dell’Automazione Anno accademico 2011/2012
Abstract
A human operator performing a manual control task can be assisted by haptic shared control, a novel approach in literature which makes use of a continuous-time force feedback to guide the operator in a specific control direction.
In a previous research, a haptic controller has been designed and tested in a for curve negotiation support in a driving simulator. This support system provides a force feedback the operator has to give way to in order to correct the vehicle lateral deviations from a reference trajectory. It was proved in an experiment to yield benefits in terms of increased performance and reduced effort from the operator with respect to manual driving.
As a variation from the haptic shared control philosophy, a novel approach has been introduced in literature for supporting a human operator piloting RPVs in a simulated environment. This haptic controller is called Indirect since the force feedback it provides has the only effect of changing the neutral point of the control interface. The operator can exploit this aiding by contrasting the force feedback and keeping the control device close to the central position. The Indirect hap-tic controller was proved in an experiment to increase performance and was found helpful by the pilots, as well as the Direct controller, which is the classic approach, and compared to manual piloting.
This novel approach in haptic shared control has only been investigated as a sup-port for piloting RPVs. In this project the Indirect controller is being designed in a modeling study and tested for a curve negotiation task in a driving simulator. The Indirect controller for curve negotiation is designed in a model-based study, where a scheme is employed simulating the behaviour of a human operator and the haptic controller. The outcome of this study are some previsions on different driving conditions, where an operator can drive manually or be assisted by the classic Direct haptic controller or by the novel Indirect controller.
An experimental campaign with a driving simulator is performed, based on the previsions figured in the modeling study. The results of the experiment tells us that both the Direct and Indirect controllers can be helpful for performance and effort of the operator in low visibility conditions, while in normal visibility a con-trast in goal can arise between operator and shared controller, due to a different way of the operator to cut curves. In a situation of evasive maneuver with a faulty controller, where the operator has to reject the force feedback, the Indirect controller is proved to be more damaging than the Direct support. Finally, some negative after-effects on performance and effort are encountered after the Indirect controller is switched-off, due to an intense adaptation of the operator to the dif-ferent dynamics to control.
The Indirect haptic support can be a valid alternative to the typical Direct con-trol scheme for curve negotiation support, although there is room for improving its functioning. Future developments should be focused on making the Indirect controller easier to understand, to cope with more effectively in case of failures and possibly to switch to manual driving without confusion.
Abbreviations
HSC Haptic Shared Control
DHA Direct Haptic Aiding
IHA Indirect Haptic Aiding
NMS Neuro-Muscular System FT Force Task PT Position Task SW Steering Wheel FFW Feed Forward FB Feedback
Parts of the experiment:
NVB Normal Visibility
LVB Low Visibility
OAE Obstacle Avoidance with controller Error
ADP Adaptation
AEF After Ef fects
Contents
Abstract ii Abbreviations iii List of Figures vi List of Tables ix 1 Introduction 11.1 Haptic Shared Control . . . 1
1.2 Investigation of HSC strategies for curve negotiation . . . 2
1.3 Goal and approach . . . 3
2 Modeling HSC for curve negotiation 5 2.1 Human control and Haptic shared control . . . 5
2.1.1 Generic model of haptic shared control . . . 5
2.1.2 Human operator model . . . 8
2.2 Schemes of HSC strategies . . . 12
2.2.1 Direct Haptic Aiding . . . 13
2.2.2 Indirect Haptic Aiding . . . 15
3 Testing HSC for curve negotiation in computer simulation 18 3.1 Model parametrization and settings . . . 18
3.1.1 Vehicle model . . . 18
3.1.2 Vehicle and Steering Wheel parametrization . . . 19
3.1.3 Road profiles designed for the computer simulation . . . 20
3.1.4 Operator Neuro-Muscular System parametrization . . . 24
3.1.5 Inverse interaction dynamics transfer function . . . 24
3.1.6 Internal models for feedback . . . 27
3.1.7 Visual subsystem operator and controllers settings . . . 30
3.1.8 Haptic subsystem controllers settings . . . 30
3.2 Results of the computer simulation . . . 30
3.2.1 Manual control . . . 31
3.2.2 Manual control-DHA-IHA . . . 34
3.2.3 Manual control-DHA-IHA with operator low visibility . . . . 38 iv
Contents v
3.2.4 DHA-IHA with controller error . . . 42
3.3 Recommendations and Conclusions . . . 46
4 Design of an experiment on HSC for curve negotiation 47 4.1 Experimental hypotheses . . . 47
4.1.1 Normal visibility . . . 48
4.1.2 Low visibility . . . 48
4.1.3 Controller error . . . 49
4.1.4 Adaptation and After-effects . . . 49
4.2 Experiment design . . . 50
4.2.1 Driving Simulator Apparatus . . . 50
4.2.2 Driving Simulator: C++ Programming . . . 52
4.2.3 Visual subsystem tuning . . . 54
4.2.4 DHA haptic subsystem tuning . . . 54
4.2.5 IHA haptic subsystem tuning . . . 55
4.2.6 SW tuning . . . 59
4.2.7 Experiment structure . . . 60
4.2.8 Other settings . . . 63
5 Testing HSC for curve negotiation in a driving simulator 65 5.1 Data analysis . . . 65
5.1.1 Measured data and preliminary corrections . . . 65
5.1.2 Statistical metrics . . . 66
5.1.3 ANOVA and comparison tests . . . 70
5.2 Experiment results . . . 70
5.2.1 Normal visibility . . . 71
5.2.2 Low visibility . . . 76
5.2.3 Obstacle avoidance with Controller error . . . 79
5.2.4 Adaptation . . . 83 5.2.5 After-effects . . . 86 5.3 Discussion . . . 88 5.3.1 Normal visibility . . . 88 5.3.2 Low visibility . . . 89 5.3.3 Controller error . . . 89
5.3.4 Adaptation and After-effects . . . 90
6 Conclusions 92 6.1 Conclusions on this work . . . 92
6.2 Future works . . . 94
List of Figures
2.1 Manual control model . . . 5
2.2 Haptic shared control model . . . 6
2.3 Internal structure of operator model and controller . . . 7
2.4 Human operator model . . . 8
2.5 Operator Visual block . . . 9
2.6 Operator Haptic block . . . 10
2.7 DHA controller . . . 13
2.8 DHA Visual block . . . 14
2.9 DHA Haptic block . . . 15
2.10 IHA controller . . . 16
2.11 IHA Correction block . . . 17
3.1 Vehicle model . . . 19
3.2 Large turn road . . . 21
3.3 Lane change road . . . 21
3.4 Obstacle avoidance road . . . 21
3.5 Lane change road with operator low visibility . . . 22
3.6 Lane change road with controller error . . . 22
3.7 Reference signals for a lane change road . . . 23
3.8 Model for the interaction Transfer Function . . . 24
3.9 Steering Frequency Spectrum . . . 26
3.10 Bode diagram of the inverse TFs . . . 26
3.11 Internal models for feedback . . . 28
3.12 Internal interaction model . . . 28
3.13 Internal model of controller . . . 29
3.14 Contact torque and controller torque . . . 31
3.15 Manual control (FT) in lane change . . . 32
3.16 Manual control (PT) in lane change . . . 32
3.17 Manual control (FT-PT) in lane change . . . 33
3.18 Manual control (FT) in lane change with disturbance . . . 33
3.19 Manual control (PT) in lane change with disturbance . . . 34
3.20 Manual control (FT-PT) in lane change with disturbance . . . 34
3.21 DHA (FT) in obstacle avoidance . . . 35
3.22 DHA (PT) in obstacle avoidance . . . 35
3.23 DHA (FT-PT) in obstacle avoidance . . . 35
List of Figures vii
3.24 DHA (FT) in obstacle avoidance . . . 36
3.25 IHA (FT) in obstacle avoidance . . . 36
3.26 IHA (PT) in obstacle avoidance . . . 37
3.27 IHA (FT-PT) in obstacle avoidance . . . 37
3.28 IHA (PT) in obstacle avoidance . . . 38
3.29 Manual-DHA-IHA in obstacle avoidance . . . 38
3.30 DHA (FT) in lane change with low visibility . . . 39
3.31 DHA (PT) in lane change with low visibility . . . 39
3.32 DHA (FT-PT) in lane change with low visibility . . . 40
3.33 IHA (FT) in lane change with low visibility . . . 40
3.34 IHA (PT) in lane change with low visibility . . . 41
3.35 IHA (FT-PT) in lane change with low visibility . . . 41
3.36 Manual-DHA-IHA in lane change with low visibility . . . 42
3.37 DHA (FT) in lane change with controller error . . . 42
3.38 DHA (PT) in lane change with controller error . . . 42
3.39 DHA (FT-PT) in lane change with controller error . . . 43
3.40 Manual-DHA in lane change with controller error . . . 43
3.41 IHA (FT) in lane change with controller error . . . 44
3.42 IHA (PT) in lane change with controller error . . . 44
3.43 IHA (FT-PT) in lane change with controller error . . . 44
3.44 Manual-IHA in lane change with controller error . . . 45
3.45 Manual-DHA-IHA in lane change with controller error . . . 45
4.1 Driving scene . . . 51
4.2 Seat and Steering Wheel . . . 52
4.3 IHA in lane change with controller error (sketches) . . . 57
4.4 IHA force gain-deviation from the controller reference (sketches) . . 58
4.5 Structure of the experiment . . . 62
4.6 Normal visibility scene . . . 62
4.7 Low visibility scene . . . 62
4.8 Obstacle on the right lane . . . 63
5.1 NVB - Minimum 10% of absolute TLC . . . 71
5.2 NVB - Std of lateral reference error - straight roads . . . 72
5.3 NVB - Measured torque signals . . . 72
5.4 NVB - Torque Reversal Rate . . . 73
5.5 NVB - Std of measured torque - straight roads . . . 73
5.6 NVB - Rms of measured torque . . . 74
5.7 NVB - Mean of lateral reference error - straight roads . . . 74
5.8 NVB - Steering angle signals . . . 75
5.9 NVB - Steering Reversal Rate . . . 75
5.10 NVB - Std of steering angle - straight roads . . . 76
5.11 LVB - Minimum 10% of absolute TLC . . . 76
5.12 LVB - Std of lateral reference error - straight roads . . . 77
List of Figures viii
5.14 LVB - Torque Reversal Rate . . . 78
5.15 LVB - Std of measured torque - straight roads . . . 78
5.16 LVB - Rms of measured torque . . . 79
5.17 OAE - Torque signals . . . 79
5.18 OAE - Steering angle signals . . . 80
5.19 OAE - Obstacle avoidance trajectories . . . 81
5.20 OAE - Minimum distance from obstacle . . . 81
5.21 OAE - Torque Reversal Rate . . . 82
5.22 OAE - Std of measured torque . . . 82
5.23 OAE - Rms of measured torque . . . 82
5.24 ADP - Lateral reference error signals . . . 83
5.25 ADP - Std of lateral reference error . . . 84
5.26 ADP - Measured torque signals . . . 84
5.27 ADP - Torque Reversal Rate . . . 85
5.28 ADP - Std of measured torque . . . 85
5.29 ADP - Rms of measured torque . . . 85
5.30 AEF - Minimum 10% of absolute TLC . . . 86
5.31 AEF - Std of lateral reference error . . . 86
5.32 AEF - Torque Reversal Rate . . . 87
5.33 AEF - Std of measured torque . . . 87
List of Tables
2.1 Intrinsic feedback and Grip parameters . . . 12
3.1 Uncertainty gains on the Internal model of controller . . . 30
5.1 Statistical metrics for the experiment . . . 69
5.2 Other metrics for the experiment . . . 69
Chapter 1
Introduction
1.1
Haptic Shared Control
The original principle of Haptic technology is to reproduce the sense of touch in a virtual environment in order to assist a remote operator to perform some task. The artificial tactile sensation reproduces the real sense of touch, which is not available in a remote environment. This information is complementary to visual feedback and it is used to enhance the manual control task of a certain device. Apart from merely being a sensory information, the artificial feeling can be actu-ally used to guide the operator in a certain control direction, if it is designed as a time-continuous feedback signal. Following this line of thought, a general scheme can be drawn where two entities are cooperating in the control task: human opera-tor and a so-called haptic shared controller. Both the acopera-tors have their own control goals and strategies, which can be different from each other, and their control in-puts are shared on the control interface which actually becomes a man-machine interface. This idea of Haptic Shared Control (HSC) was presented in [1].
Supporting an operator to perform a task with a haptic shared controller can lead to many advantages, awareness and safeness amongst all. However, several issues arise from the design process of a haptic controller. First of all, the haptic con-troller is named shared for a specific reason: the concon-troller should only help the operator to perform the task and not replace him. The concept of shared stands actually in between manual control and full automation and the desired power of the controller must be chosen from a a scale of different levels of authority [2]. A sufficient power from the shared controller guarantees that the information is help-ful to the operator. If a perfect and faults-free shared controller was designed, it could be easily employed as an automatic controller entirely replacing the human control. This perfect automatic controller would lead to the highest performance in the task accomplishment. The idea of limiting the controller power comes there-fore from a safety issue: in case of errors the operator should be able to override the faulty controller and make his own decision. A shared control strategy can be hence a valid stage in between full automation, where the operator has the role of supervisor, and manual control, in all the applications where safety is important
Chapter 1. Introduction 2 and the automation is prone to failures, due for example to flaws in the sensory system.
1.2
Investigation of HSC strategies for curve
ne-gotiation
A haptic shared controller has been designed and tested in a previous study [3] for assisted curve negotiation in simulated car driving. The haptic controller, given a desired vehicle reference trajectory and the information on the current vehicle state from a virtual sensory system, provides a force input on the steering wheel in order to correct the car deviations from the reference. The pilot is therefore assisted by this system and simply has to give way to the force feedback and am-plify it, provided that he agrees with the haptic controller on the control goal. The system was tuned with a limited force feedback gain, in order to be safe and to let the driver override it if necessary.
A different shared control strategy was introduced in [4] in an application for pi-loting simulated RPVs (remotely piloted vehicles). This new approach was called Indirect Haptic Aiding (IHA), in order to distinguish it from the usual haptic control strategies called Direct Haptic Aiding (DHA) such as the one for curve negotiation support described above. The IHA controller is based on a mechanical decoupling of the control interface from the vehicle. The force feedback provided by the system is only an aiding signal to suggest the operator the right maneuver and it does this by changing the neutral point of the control interface. The opera-tor can control the vehicle by using the control column as a force interface, that is simply by contrasting the force feedback from the controller. Moreover, the IHA controller does not modify the amount of control input required from the opera-tor, which is the same as in manual control. However, it changes the dynamics of the system to control since the usage of the control column is different from the conventional one.
Notice the different implementations of the haptic controllers. In [3] the force feedback was calculated in order to correct the vehicle lateral deviation from a reference trajectory. In [4] the aiding signal from the controller was calculated in order to correct a vertical wind gust disturbance, while in the obstacle avoidance task of [5] it came from a force field around the obstacles.
In the experiment performed in [3] for curve negotiation, the potentiality of the DHA support was assessed with respect to manual driving. Performance, men-tal and physical effort were measured in this experiment with specific statistical metrics. With respect to manual driving, the DHA shared control produced a slight increase in performance and lower mental effort of the operator. However, a controversial result was found in physical effort, since it increased with the DHA controller on. Notice that in this experiment drivers were instructed and trained on how to use the support system.
In [4] the IHA support is argued to exploit the natural rejection response of the operator to a force feedback, which in the first place is perceived as a disturbance
Chapter 1. Introduction 3 and not a direct help. For this reason the IHA controller is claimed to be a more natural and intuitive approach than DHA, while DHA requires some learning. However, a shared controller can be more or less natural depending on the appli-cation where it has been designed.
The DHA and IHA controllers were compared to manual control in [5] in an obsta-cle avoidance experiment with simulated RPVs. In this experiment, performance was measured with a statistical metrics, while a questionnaire was employed to assess the pilots effort and their feeling of the haptic support. Notice that no spe-cific instructions were given to the pilots. IHA was proved to be a valid alternative to DHA: it produced the best performance in the first repetitions, while pilots the the DHA support performed better in the last repetitions. DHA and IHA were both considered helpful by the pilots. However, a higher effort was felt by the pilots with both the systems.
Let us now make conclusions on this investigation on haptic control strategies. In the application of interest for this project, which is curve negotiation support, the DHA controller has already been implemented and found helpful in the previous experiment [3]. On the other side, the IHA controller was only tested for piloting simulated RPVs in [5] and proved a valid alternative to DHA. In this case, the control interface was a control column and the task was to follow an artificial hori-zon. However, curve negotiation is a different task since it involves a more complex decision process of the driver from the visual feedback to the control action. In the task with RPVs the error from the reference is directly presented to the pilot and this makes the pilot easily agree with the controller on the control goal. Whereas, in curve negotiation the driver has to identify the reference trajectory to follow and a contrast is more likely to arise between the control goals of operator and driver, for example in case an operator decides to cut curves differently. Therefore, the results found with IHA for piloting RPVs can only be indicative for what can be expected for a curve negotiation implementation.
1.3
Goal and approach
The goal of this project is to design and test the IHA controller as a novel support for curve negotiation in a driving simulator.
In the light of what found in literature, it seems important to begin with a mod-eling study, in order to understand how the IHA mechanism can be redesigned for this application, as well as for making previsions on the behaviour and results with this system compared to the DHA support and manual control.
Schemes of haptic shared control for curve negotiation are presented in chapter 2, where particular attention is given to the modeling of the human operator be-haviour in this task and the two adopted shared control strategies, DHA and IHA. In chapter 3, a computer model to simulate the two shared control strategies is employed, in order to acquire a broad understanding of their functioning in rela-tion with the human operator control goal. As an outcome of this modeling study, some experimental hypothesis on different driving situations are formulated.
Chapter 1. Introduction 4 Once the shared control systems have been studied in computer simulation, an experiment is set-up and carried out based on the previsions made. The imple-mentation and tuning of the DHA controller and the IHA controller in a driving simulator is presented in chapter 4, along with the experiment structure. In chap-ter 5, the experimental campaign on shared control strategies is performed and its results are used to verify the hypotheses figured from the modeling study.
In the final chapter 6 the conclusions on the project are drawn along with some guidelines for future developments.
Chapter 2
Modeling HSC for curve
negotiation
2.1
Human control and Haptic shared control
In the modeling study, schemes of shared control for a curve negotiation task are used to investigate these systems in relation to the human operator behaviour in different driving situations.
Here the different models designed and employed in this project are introduced. The schemes illustrated in this section are inspired from those in [6]. The de-scription begins from a top view of the general system and is followed by detailed explanations of the various subsystems.
2.1.1
Generic model of haptic shared control
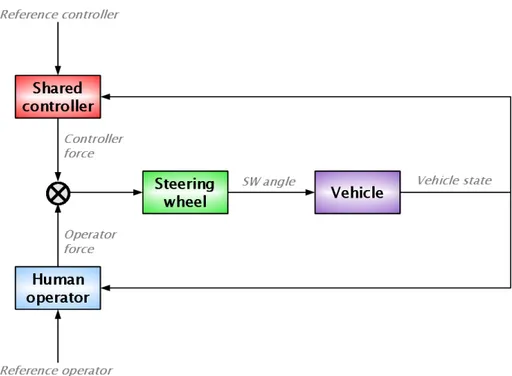
Figure 2.1: Model of manual control
A generic scheme of manual control for a curve negotiation task is presented in figure 2.1. In this scenario, the human operator has a reference trajectory to follow and the current vehicle state as inputs. From the vehicle error to the reference
Chapter 2. Modeling HSC for curve negotiation 6 trajectory, a force to apply on the steering wheel is computed.
The manual control scheme can be enhanced with an external control device which helps the human operator to perform the curve negotiation task. The main prin-ciple at the basis of shared control is the sharing of a human operator force input and a controller input on an interaction interface, a steering wheel in the case of curve negotiation support, from which the output is given to the vehicle to be guided. Forces are generated in order to make the vehicle follow a certain reference trajectory.
Operator and controller contribute together to the vehicle dynamics, each one with a certain control energy: the fundamental idea is that the controller energy should be limited within certain boundaries in order to give the operator full authority in every possible situation.
The most generic model of haptic shared control (figure 2.2) consists of four main
Figure 2.2: Generic model of haptic shared control
subsystems:
• Human operator
• Haptic shared controller • Steering wheel
Chapter 2. Modeling HSC for curve negotiation 7 In this scheme the operator and the controller have two different reference trajec-tories. If those trajectories are equal we can simulate a situation where operator and controller cooperate for the same control aim. In case there is a mismatch between those trajectories, operator and controller will fight for different control goals.
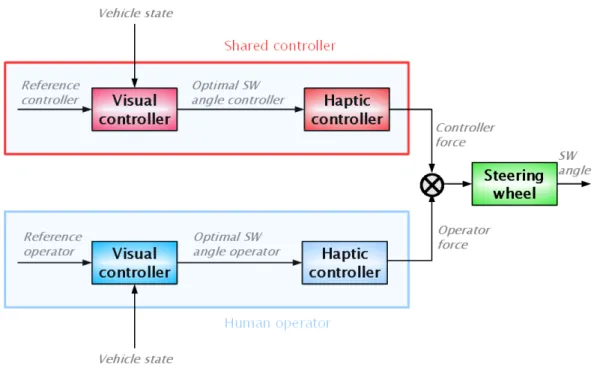
Both operator and controller can be modelled in a similar fashion by distinguishing the Visual control from Haptic control. Inside the human control process for curve negotiation, Visual control can be defined as the mental process that, given the current state of the vehicle and the operator goal, e.g. keeping the vehicle in the right lane, produces the optimal trajectory that must be realized on the control interface, that is the steering action to follow the desired goal. Notice that in this scheme both the sensor system of the haptic controller and the sensory organs of the operator that detect the vehicle state are supposed to be exact and with no delay, that is a unitary gain. Haptic control is instead the force control, that is the mental-physical process from this optimal trajectory to the force that must be exerted on the control interface. Notice that this distinction is just a trick that allows us to simplify the human control process by dividing it into two blocks. Moreover, a shared controller can be built with the same internal structure and the main advantage is that Visual block and Haptic block can be designed and tuned separately. The haptic shared guidance scheme with this internal structure both for human operator and shared controller is shown in figure 2.3.
The Visual block takes in input the reference trajectory (control goal) and the
Figure 2.3: Internal structure of operator model and controller
Chapter 2. Modeling HSC for curve negotiation 8 be imposed on the control interface, in this case an optimal steering wheel angle. The optimal trajectory is fed to the Haptic block which has to compute a force to apply on the control interface to realize the optimal steering wheel angle.
Visual block and Haptic block of human operator and controller can be internally designed in different ways. On one side, the human operator model should be as realistic as possible, in order to obtain valid results from the model. Whereas there are many different choices for the controller model with variable complexity. In this project two different haptic support strategies are compared and in order to make the comparison as clear as possible, the employed controller structure has been designed in a simple way as described in section 2.2.
2.1.2
Human operator model
The Human operator model that will be introduced has been developed in pre-vious studies [8]. Some changes were made on the original model in order to fit it into this study on two strategies of haptic shared control and in the different driving situations that will be investigated.
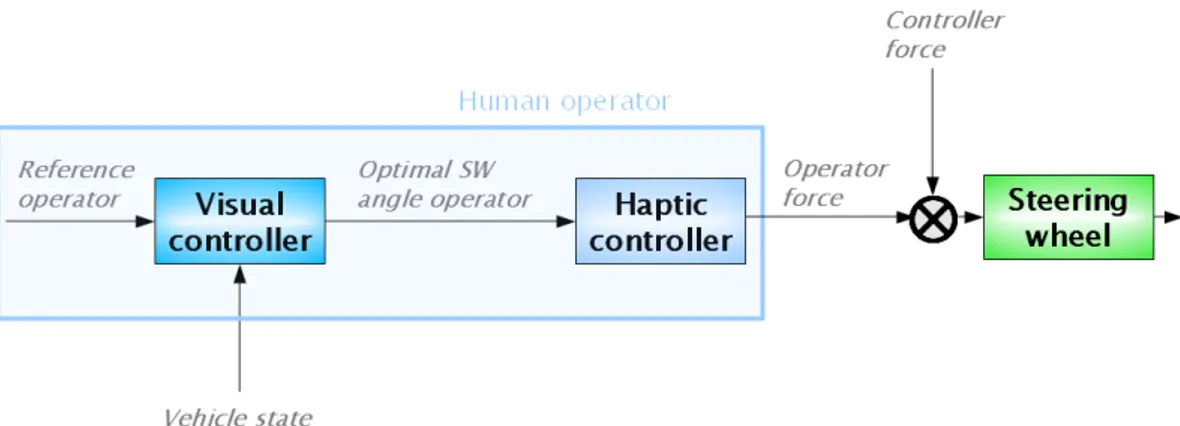
As already mentioned, the Human operator subsystem (figure 2.4) takes in input the reference trajectory to follow and gives in output a torque to be applied on the Steering wheel. It is modelled with a Visual block and a Haptic block in series.
The current reference trajectory is used along with the current vehicle state to
Figure 2.4: Human operator model
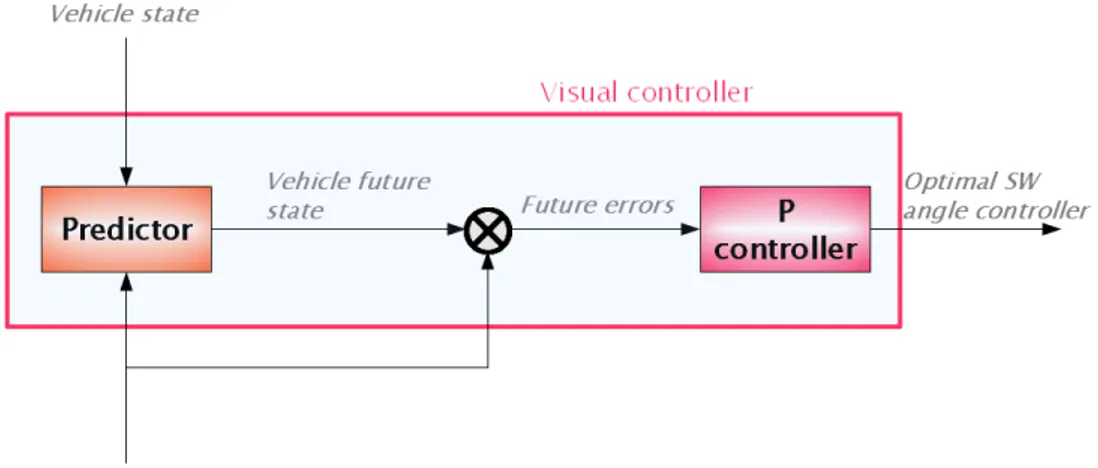
compute an optimal steering wheel angle to be realized on the steering wheel. This is done in the subsystem called Visual controller.
In figure 2.5a it is shown in detail the structure of this Visual block. First an algorithm is employed to predict the vehicle global state after an interval of time called look-ahead time T LH (Predictor block). In practice, the current tyre angle is frozen at each time step and used to compute the future global position and orientation.
Chapter 2. Modeling HSC for curve negotiation 9
(a) Operator Visual block
(b) Future error to optimal SW angle
Figure 2.5: Operator Visual block
Secondly, from the vehicle current and future global states two variables are de-termined:
• Future lateral error • Future heading error
Finally, two different proportional gains are applied to the future errors and then they are added up to provide the optimal steering wheel angle. This is done in the block P controller of figure 2.5b.
Chapter 2. Modeling HSC for curve negotiation 10
angle computation θSW,opt(hum) from the future lateral (elat|T LH)hum and heading
(ehead|T LH)hum errors where the subscript T LH indicates the look-ahead time at
which the future errors are computed.
θSW,opt(hum) = P1(elat|T LH)hum+ P2(ehead|T LH)hum (2.1)
The optimal trajectory generated by the Visual controller must be then converted
Figure 2.6: Operator Haptic block
into a force signal to be applied on the control interface. This is done into the Haptic block, that for the human operator is modelled with three subsystems as shown in figure 2.6:
• Internal models
• Neuro-Muscular System • Contact dynamics
The human arm force signal can be represented by three different components as shown in the NMS subsystem of figure 2.6:
• Feedforward force • Intrinsic feedback force • Reflex force
Chapter 2. Modeling HSC for curve negotiation 11 These three contributes can be employed for a realistic description of the human arm response. The feedforward signal is the one used in nominal and ideal condi-tion for the curve negotiacondi-tion task. Practically, if the operator had full knowledge of the closed loop guidance model without any kind of uncertainties and if there were no additional external disturbances in the system, the human operator would be able to realize the optimal steering wheel angle on the actual steering wheel and make the vehicle perfectly follow the chosen reference trajectory. In the scheme of figure 2.6 the feedforward signal is computed by the Inverse interaction dynamics block. This function represents the human knowledge of the total interaction be-tween arm and steering wheel: it is the mapping from the optimal steering wheel angle computed by Visual control to a torque input to be exerted in order to real-ize the optimal angle on the actual steering wheel. The feedforward signal is also called Supra-Spinal input and is fed to the Muscle activation dynamics to deter-mine the actual feedforward arm force. The Muscle activation dynamics block is modelled as a butterworth filter with a 2 Hz cross-over frequency to represent nor-mal low-pass muscular response to an activation signal from the cerebral cortex. Still the operator may have a limited knowledge of the system to control and also many kinds of disturbance signals can have access to the system state, such as noise or also the input from a shared controller, therefore a feedback activity is required to compensate for these unpredicted signals. The feedback signal can be divided into intrinsic feedback and reflexes. The intrinsic feedback force represents the muscle co-contraction action and it is a purely haptic loop, much faster than the visual control loop. What happens is that the operator is predicting his own arm state from his knowledge of the controlled system but in presence of model uncertainties or disturbances the arm can be found in a different state. There-fore, muscle co-contraction can be modelled as a spring-damper system around the predicted arm state bringing the arm to the desired position. In the scheme of figure 2.6 the Intrinsic feedback subsystem computes the intrinsic force from the difference between current and predicted state of the arm. The predicted state comes from the Internal interaction model that will be parametrized in chapter 3. This Internal interaction model is the new block that has been added to the original model for the sake of this analysis on two haptic shared control strategies. The second part of human arm feedback is the reflex activity. This is the fastest human response to disturbance since reflexes are not generated by the central ner-vous system (conscious response) but by the peripheral system that provides a faster loop. Reflex activity can be divided into spindles reflex, that is a reflex to a change in muscular length and velocity, and the Golgi tendon that is a reflex to a force generated by the muscle itself.
Inside the NMS block of figure 2.6 the total human arm force is generated by composing feedforward and feedback signals. The total arm force is in input to the Arm dynamics which produces the human arm current position and velocity. The grip between human arm and steering wheel is modelled in the Contact dy-namics subsystem of figure 2.6 as a spring-damper system with two grip parameters that can be set according to the current muscular co-contraction. Basically with this modeling choice the grip is a spring-damper system between the human arm state and the steering wheel state.
Chapter 2. Modeling HSC for curve negotiation 12 and this is the actual operator input torque on the steering wheel itself. An addi-tional external torque can also be present on the steering wheel, for instance the input from a shared controller or some kind of external noise. The torque inputs on the Steering wheel determine the steering wheel current position and velocity. The Steering wheel has been modelled as a mass-spring-damper system in order to simulate the steering wheel inertia and self alignment to the neutral central position. A linear characteristic has been chosen resembling the power steering systems in modern cars.
As already mentioned, the original Human operator model has been developed in previous studies [8], with particular attention to the muscle co-contraction ac-tivity parameters identification. In the identification experiments performed, a steering wheel with an external identification torque signal was provided to a hu-man operator in absence of visual feedback and the subject was asked to follow two different approaches, called Force task (FT) and Position task (PT). In the FT the subject was instructed to give way to the torque signal provided by the control system, while in the PT the operator had to contrast the torque input by using co-contraction in order to keep the steering wheel to the central neutral position. As identification signals for the experiment, both a noise torque signal and the torque feedback coming from a shared controller were used. The spring-damper intrinsic feedback parameters were therefore identified in the two different settings and are the ones employed in this model. They are shown in table 2.1
Table 2.1: Intrinsic feedback and Grip parameters
FT PT
Bint(N m/rad) 1.047 0.85
Kint(N ms/rad) 1.87 151
Bc(N m/rad) 7.00 19.5
Kc(N ms/rad) 10.8 1039
and it can be noticed that they are higher in a PT where muscle co-contraction is stronger. It should be noticed that in the current model the intrinsic feedback parameters are adapted to a different situation from the experimental conditions where they were identified: now the co-contraction is not around a steering wheel angle equal to zero, since a visual feedback is present, but between current arm state and predicted arm state. This is the novelty introduced with this model. Grip parameters have also been identified together with intrinsic feedback param-eters in the same experiment for FT and PT settings table 2.1. It can be noticed that grip parameters are higher for a PT where the grip is reasonably tighter than in a FT.
2.2
Schemes of HSC strategies
In this section two different strategies for haptic shared control in a curve negotia-tion task are introduced. The first approach, named Direct controller, has already
Chapter 2. Modeling HSC for curve negotiation 13 been implemented and tested in previous studies. Whereas, for the first time a scheme of Indirect controller is presented as a curve negotiation support in this section.
2.2.1
Direct Haptic Aiding
In the classic direct haptic controller scheme [3], the shared controller provides a force feedback on the steering wheel that directly commands the vehicle to follow a certain reference trajectory. Both the operator force and the force feedback affect the vehicle dynamics. The operator is required to give way to the force feedback and amplify it in order to follow the aiding from the shared controller.
θSW = SW (s)(Thum+ TDHA) (2.2)
In equation (2.2) the steering wheel angle θSW is the output of the steering wheel
dynamic model transfer function SW (s) to which both the human operator torque
Thum and the controller torque TDHA are in input. θSW is therefore the SW angle
to directly guide the vehicle.
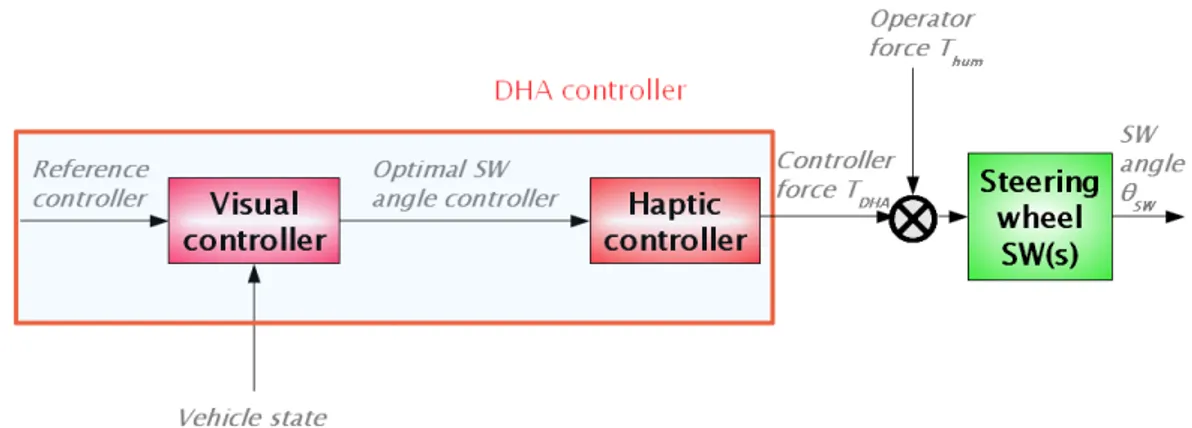
The Direct controller, also DHA (Direct Haptic Aiding) controller, illustrated in
Figure 2.7: DHA controller
2.7 has been implemented in a similar fashion to the human operator model. It is composed of Visual and Haptic subsystems.
The current reference trajectory along with the vehicle global state are used to compute the controller optimal steering wheel angle in the Visual controller block. In the model employed, the controller Visual block has the same internal structure of that of the human operator 2.5. The Visual subsystem for the DHA controller is shown in figure 2.8.
Chapter 2. Modeling HSC for curve negotiation 14
Figure 2.8: DHA Visual block
angle for the DHA controller. This equation is equivalent to 2.1.
θSW,opt(DHA) = P1(elat|T LH)DHA+ P2(ehead|T LH)DHA (2.3)
Therefore, if the reference trajectories of controller and operator are chosen identi-cal, the optimal steering wheel angles of controller and operator will also be equal. What changes between shared controller model and human model is the haptic subsystem. On one side, the operator is linked to the steering wheel through the whole neuromuscular system and the grip on the steering wheel. Whereas the controller can directly provide a torque input on the steering wheel and this is the main difference with the human control. The shared controller Haptic block can be realized in different ways to make it more or less close to the human control logic. However, in order to make the comparison between the two different haptic systems simple, it has been chosen a simple proportional control. Therefore, the controller torque is proportional to the optimal steering wheel angle through a gain that must be tuned in order to choose the controller energy appropriately. In fact, in the shared control philosophy the controller must have a precise level of authority, which means a limited amount of energy in order to give the operator the power to potentially override the control input on the shared interface [3].
TDHA = GDHAθSW,opt(DHA) (2.4)
The Haptic subsystem of the DHA controller is shown in figure 2.9 and represented
by (2.4), where TDHA is the DHA controller torque and GDHA the proportional
Chapter 2. Modeling HSC for curve negotiation 15
Figure 2.9: DHA Haptic block
2.2.2
Indirect Haptic Aiding
In this paragraph the Indirect shared controller is introduced for the first time as a support system for curve negotiation. It has been designed so to resemble its original version developed for a flight simulator [4]. The Indirect controller will also be called IHA (Indirect Haptic Aiding) controller.
The main principle is that the shared controller must not directly affect the vehicle dynamics, but only the control interface, on which a force feedback signal is fed that must be interpreted by the human operator as a disturbance. The action of the IHA controller is only a shift in the steering wheel neutral point. The operator can follow the haptic aiding by simply contrasting the disturbance force and with lower steering actions like small deviations from the center.
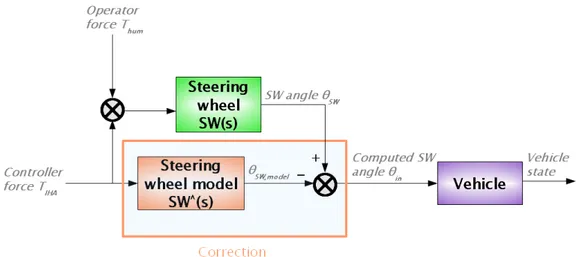
The IHA controller in its internal structure can be designed in the same way as the DHA, except for the force gain of the Haptic block which must be inverted. This way the force feedback commanding the steering wheel is perceived as a dis-turbance by the operator. In order to make the IHA affect only the neutral point of the steering wheel, a model of the steering wheel is also to be implemented inside the IHA controller. The force feedback from the IHA controller must be fed also to this SW model, and the output SW model angle subtracted from the current steering wheel angle, to produce the input angle that goes to the vehicle. This correction block, implemented inside the IHA controller, basically changes the steering wheel dynamics by decoupling it from the vehicle.
In figure 2.10 it is shown the IHA model. It is composed of the following subsys-tems:
• Visual controller • Haptic controller • Correction block
Chapter 2. Modeling HSC for curve negotiation 16
Figure 2.10: IHA controller
The IHA Visual block is chosen with the same structure of that of human operator 2.5 and DHA 2.8. Therefore the optimal steering wheel angle is computed with the usual formula 2.5.
θSW,opt(IHA) = P1(elat|T LH)IHA+ P2(ehead|T LH)IHA (2.5)
The Haptic block is also realized in the same fashion, but the proportional gain to obtain the controller force is chosen with the opposite sign of the DHA as in 2.6.
TIHA = −GIHAθSW,opt(IHA) (2.6)
This means that the controller force will make the steering wheel turn in the opposite direction of the optimal one but with the same absolute angle. This is the actual disturbance signal provided by the controller on the steering wheel.
The Correction block is shown in detail in figure 2.11. In order to make the control input affect only the actual steering wheel dynamics and not the vehicle, a model of the steering wheel must be provided. This model has in input the controller torque and its output is subtracted from the actual steering wheel angle. This way the steering wheel torsion is determined both by operator input and control input but the net input to the vehicle, that is the computed steering wheel angle in figure 2.10, is determined by the operator torque solely.
Chapter 2. Modeling HSC for curve negotiation 17
Figure 2.11: IHA Correction block
In equation (2.7) the steering wheel angle θSW is the output of the steering wheel
dynamic model transfer function SW (s) to which both the human operator torque
Thum and the IHA controller torque TIHA are in input.
θin = θSW − θSW,model = (Thum+ TIHA)SW (s) − TIHASW (s)ˆ (2.8)
However, θSW is not the SW angle to directly guide the vehicle. The angle that
goes in input to the vehicle is θin which is computed by the correction block as
difference between the SW angle θSW and the angle θSW,model computed from the
SW model inside the IHA controller, which has SW (s) as transfer function. Thisˆ
is expressed in equation (2.8).
The steering wheel model inside the IHA controller matches the actual steering wheel, therefore when the human operator does not provide a torque on the steer-ing wheel it can be observed the steersteer-ing wheel turnsteer-ing in the opposite direction of that computed by the operator Visual block, but still the vehicle will go straight on since the net input to the vehicle is zero (2.9)-(2.10).
θin = θSW−θSW,model = SW (s)Thum+(SW (s)− ˆSW (s))TIHA ≈ SW (s)Thum (2.9)
Thum = 0 ⇒ θSW ≈ SW (s)TIHA, θin ≈ 0 (2.10)
Steering wheel and tyres have actually been mechanical decoupled as observed in figure 2.10 where the connection between Steering wheel and Vehicle is inter-rupted.
Chapter 3
Testing HSC for curve negotiation
in computer simulation
3.1
Model parametrization and settings
In chapter 3 a generic model of haptic shared control has been introduced, with a detailed description of the designed human operator model and two different strategies for HSC.
Three shared control schemes for curve negotiation have been implemented in MATLAB Simulink:
• A. Manual control
• B. Operator-DHA shared control • C. Operator-IHA shared control
They have been developed from the original model used in [9].
In this section the adopted model parametrization and specific settings for these schemes are presented.
3.1.1
Vehicle model
In the modeling phase, the car dynamics has been modelled with a simple linear bicycle model.
The vehicle state can be divided into body state xbody and global state xglobal. The
body state is composed of the vehicle current lateral velocity vlat and yaw rate ˙ψ
as in 3.1.
xbody = (vlat, ˙ψ) (3.1)
Chapter 3. Testing HSC for curve negotiation in computer simulation 19 The body state describes the state of the car in its body reference frame, while the global state is used to spot the car in a global fixed reference frame. The vehicle
position Pvehicle and yaw angle ψ constitute the global state as in 3.2.
xglobal= (Pvehicle, ψ) (3.2)
In figure 3.1 it is shown the Vehicle subsystem. The steering wheel angle coming
Figure 3.1: Vehicle model
from the control interface is converted into a tyre angle by the transmission gear (gear ratio).
˙xbody = A xbody + B u (3.3)
y = xbody (3.4)
The Vehicle model is a state-space representation of the bicycle model 3.3-3.4 employed to compute the current velocity and yaw rate from the tyre angle as input u = δ. The Vehicle model takes also into account the cornering stiffness of front and rear tyre, which are used as a linear approximation of the Pacejka formula [7] for the tyre realignment force.
In the last block of the Vehicle model body variables are converted into global variables.
3.1.2
Vehicle and Steering Wheel parametrization
Here are introduced the parameters for the Vehicle model and the Steering Wheel which are adopted for the whole modeling study.
The bicycle model of the vehicle is set with the following parameters: • mass: m = 1600 Kg
Chapter 3. Testing HSC for curve negotiation in computer simulation 20
• distance c.o.g.-rear tyre: dr = 1.4 m
• moment of inertia = Izz = m df dr
• cornering stiffness front tyre: Cf = 30 KN/rad
• cornering stiffness rear tyre: Cr= Cf lf/lr
In this study the vehicle longitudinal velocity has been set to a constant value of
vlong = 25m/s in order to get rid of undesired additional degrees of freedom and
focus on the steering action as control for curve negotiation.
The gear ratio from the steering wheel to the vehicle wheels is set to gearSW = 1/15
which is a typical value for commercial cars.
The steering wheel is modelled as a simple mass-spring-damper system. This resembles current power steering systems that are designed so to have a linear characteristic angle-torque. The parameters were set to:
• moment of inertia ISW = 0.3 N ms2/rad
• viscous damping BSW = 2 N ms/rad
• stiffness KSW = 4.2 N ms/rad
3.1.3
Road profiles designed for the computer simulation
In the modeling study, several road profiles have been designed in order to test different conditions in car driving. They can be divided into two categories: agree-ment profiles and disagreeagree-ment profiles.
In the first group, the same reference trajectory is generated for both human oper-ator and controller and a situation of agreement can be tested where operoper-ator and shared controller cooperate for the same task, that is to follow the same reference road. This group is composed by three profiles:
• Large turn • Lane change
• Obstacle avoidance
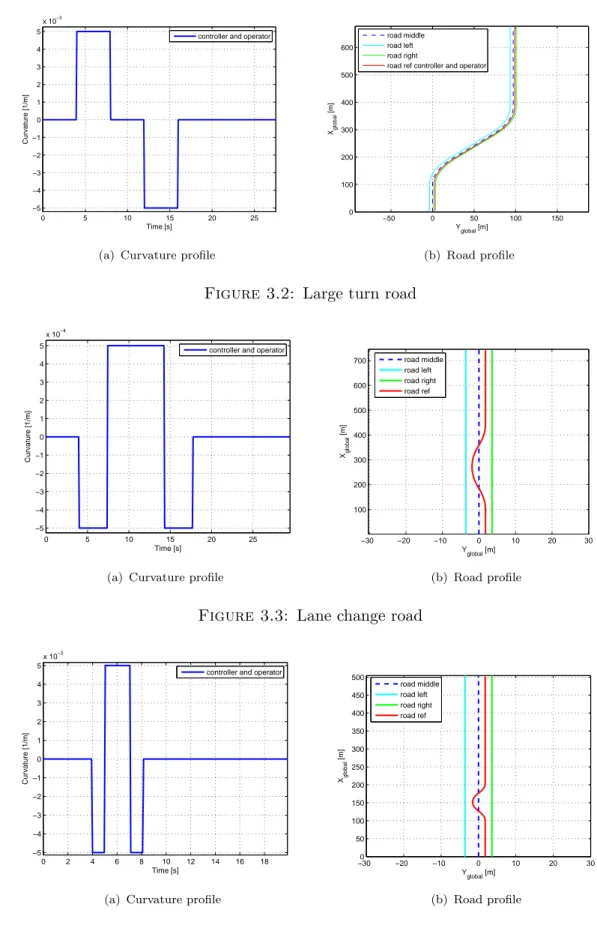
In figures 3.2-3.4 are shown the road curvature and the actual profile for those roads. The trajectory in red is chosen as reference road for both operator and controller. Notice that this trajectory lies in the middle of the right lane of the road.
The large turn profile has been generated with a curvature close to the maximum one allowed with respect to the car dimensions, weight and longitudinal velocity. The lane change represents a situation where the vehicle has to deviate from a straight trajectory in order to surpass a vehicle on the right lane.
Chapter 3. Testing HSC for curve negotiation in computer simulation 21 0 5 10 15 20 25 −5 −4 −3 −2 −1 0 1 2 3 4 5 x 10⁻³ Time [s] Curvature [1/m]
controller and operator
(a) Curvature profile
−50 0 50 100 150 0 100 200 300 400 500 600 Yglobal [m] Xglobal [m] road middle road left road right
road ref controller and operator
(b) Road profile
Figure 3.2: Large turn road
0 5 10 15 20 25 −5 −4 −3 −2 −1 0 1 2 3 4 5 x 10⁻⁴ Time [s] Curvature [1/m]
controller and operator
(a) Curvature profile
−30 −20 −10 0 10 20 30 100 200 300 400 500 600 700 Y global [m] Xglobal [m] road middle road left road right road ref (b) Road profile
Figure 3.3: Lane change road
0 2 4 6 8 10 12 14 16 18 −5 −4 −3 −2 −1 0 1 2 3 4 5 x 10⁻³ Time [s] Curvature [1/m]
controller and operator
(a) Curvature profile
−300 −20 −10 0 10 20 30 50 100 150 200 250 300 350 400 450 500 Y global [m] Xglobal [m] road middle road left road right road ref (b) Road profile
Figure 3.4: Obstacle avoidance road
In the obstacle avoidance profile a virtual obstacle is present on the right lane and must be avoided by moving the car to the left lane. Notice that this profile is
Chapter 3. Testing HSC for curve negotiation in computer simulation 22 different from the lane change one because here the curvature is higher as it can be observed by comparing 3.3-3.4. Obstacle avoidance is a more critical maneuver than a lane change and this is simulated with a higher curvature of the trajectory that the vehicle has to follow.
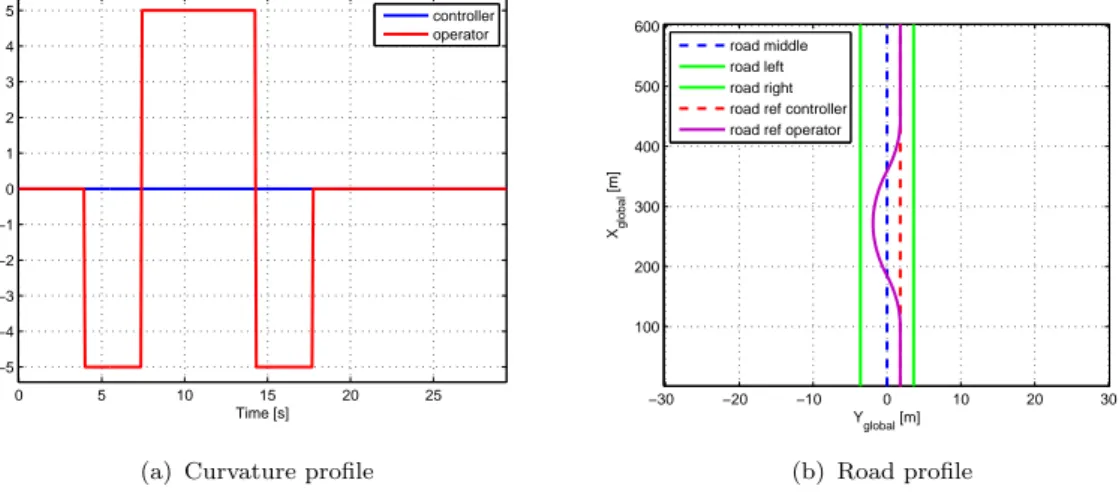
Road profiles from the second group represent a situation of mismatch between operator and controller and can be used to simulate critical conditions such as some flaws in the human control or even a controller error. Two road profiles belong to this group:
• Lane change with operator low visibility • Lane change with controller error
0 5 10 15 20 25 30 35 −1 −0.8 −0.6 −0.4 −0.2 0 0.2 0.4 0.6 0.8 1 x 10⁻³ Time [s] Curvature [1/m] controller operator
(a) Curvature profile
−20 −10 0 10 20 50 100 150 200 250 300 350 400 450 Y global [m] Xglobal [m] road middle road left road right road ref controller road ref operator
(b) Road profile
Figure 3.5: Lane change road with operator low visibility
0 5 10 15 20 25 −5 −4 −3 −2 −1 0 1 2 3 4 5 x 10⁻⁴ Time [s] Curvature [1/m] controller operator
(a) Curvature profile
−30 −20 −10 0 10 20 30 100 200 300 400 500 600 Y global [m] Xglobal [m] road middle road left road right road ref controller road ref operator
(b) Road profile
Figure 3.6: Lane change road with controller error
They are shown in figures 3.5-3.6. The first profile represents a situation where there is a car to surpass on the right lane. The controller has detected the car sufficiently in advance and has a smooth lane change trajectory. On the other side,
Chapter 3. Testing HSC for curve negotiation in computer simulation 23 the operator has low visibility due to fog on the street for instance and the vehicle is detected with a certain delay. Therefore, the operator trajectory is delayed with respect to the controller one and the rising profile of the curve is sharper. After the operator reference trajectory reaches the left lane center, it has been set as smooth as the controller one in the descending profile.
The other profile represent a situation where there is an error in the controller reference trajectory. The human operator has detected a car on the right lane to surpass and has a lane change profile as reference trajectory. Whereas the controller has not detected the obstacle due again to an error in the sensory system and its reference is a straight road.
The generated road profiles in input to the control scheme consist of three signals: X-reference, Y-reference and Psi-reference (heading). Those signals are displayed in figure 3.7 for a lane change profile as example.
The X-reference is ramp-shaped due to the constant longitudinal velocity that
5 10 15 20 25 100 200 300 400 500 600 sec m (a) X-reference 0 5 10 15 20 25 −1.5 −1 −0.5 0 0.5 1 1.5 sec m (b) Y-reference 5 10 15 20 25 −0.04 −0.03 −0.02 −0.01 0 0.01 0.02 0.03 0.04 sec rad (c) Psi-reference
Figure 3.7: Reference signals for a lane change road
has been chosen and this is valid for all the road profiles generated. What changes between different road profiles are the Y-reference and Psi-reference and these are the signals that can be taken into account to measure performance as well as the Y-reference error and Psi-reference error between vehicle center of gravity and current reference.
Chapter 3. Testing HSC for curve negotiation in computer simulation 24
3.1.4
Operator Neuro-Muscular System parametrization
The intrinsic feedback parameters Bint, Kint from a previous identification study
have already been introduced in table 2.1. In this table are also shown the grip
parameters Bc, Kc which model the contact dynamics between human arm and
steering wheel as a spring-damper system. The following parameters complete a realistic description of the Neuro-Muscular System:
• human arm inertia Iarm = 0.247 N ms2/rad
• muscle activation dynamics cross-over frequency fact = 2 Hz
The reflex activity parameters have been set to zero in all the tests performed in the modeling study since they have not been identified yet in any former experi-ment. Therefore the only feedback contribute of the NMS is the intrinsic feedback that is muscular co-contraction.
3.1.5
Inverse interaction dynamics transfer function
In the human operator model it has been showed that the human operator torque is composed of feedforward torque and feedback torque (figure 2.6). The feedforward torque is generated by the Haptic controller subsystem taking as input the optimal steering wheel angle generated by the operator Visual controller block. It has also been said that the human haptic control should consist of a transfer function of the total inverse interaction dynamics.
In the original model, this transfer function had been approximated as a
Chapter 3. Testing HSC for curve negotiation in computer simulation 25 order low-pass filter which contained parameters from the operator feedforward NMS, which is the muscle activation dynamics, and from contact dynamics and steering wheel dynamics.
In this modeling study the inverse transfer function was analytically computed from the scheme in figure 3.8 that includes the following blocks:
• Operator feedforward NMS • Contact dynamics
• Steering wheel dynamics
First the direct transfer function between operator torque and steering wheel angle has been mathematically computed from this scheme. Notice that the feedback and reflex part is not included in the scheme: the operator computes in feedfor-ward the torque input to realize the optimal steering wheel angle and then the feedback activity is used to compensate for errors in the actual steering wheel angle. Equation (3.5) is the calculated inverse transfer function that links the optimal steering wheel angle as input to the correspondent feedforward signal as output. Notice that since the transfer function contains the grip parameters, two different transfer functions can be computed, one for a FT and the other for a PT.
F = 1
π2(K
c+ Bcs)fact2
((Kc(Ksw+ s(Bsw+ (Iarm+ Isw)s))+
s(Iarms(Ksw+ s(Bsw+ Isws))+
Bc(Ksw+ s(Bsw+ (Iarm+ Isw)s))))(0.25s2+ 0.7πsfact+ π2fact2 ))
(3.5)
Still this transfer function is not proper and it cannot be directly employed in the model. A filter must be added to its denominator to yield a strictly proper transfer function. The filter has been tuned in order to achieve a good compromise between minimization of the error between optimal and actual steering wheel angle and smoothness of the feedforward signal produced. In fact, the higher is the frequency of the filter poles, the closer the actual steering wheel angle will be to the optimal one. Still if that frequency is too high the feedforward signal will present high oscillations. Therefore a compromise must be found.
First a frequency power analysis has been performed on the optimal steering wheel angle. It has been employed the scheme A. Manual control in which the intrinsic feedback has been deactivated. The optimal steering wheel angles produced with the three road profiles of the first group has been analysed in their power content at different frequencies. In practice a Fast-Fourier transform has been applied in order to compute the frequency spectrum of the optimal steering wheel angle.
In figure 3.9 the spectrum for each one of the three road profiles is shown. It can be noticed that for the large turn and the lane change profiles the steering power is concentrated for frequency lower than 5 rad/sec, while for the obstacle avoidance profile there is still power up to 20 rad/sec.
In order to compare the steering wheel optimal and actual angles, an algorithm has been implemented to compute an average time-lag between those two variables. It has been observed that by employing the inverse transfer function the error
Chapter 3. Testing HSC for curve negotiation in computer simulation 26 0 5 10 15 20 25 30 35 0.1 0.2 0.3 0.4 0.5 0.6 0.7 0.8 0.9 1 Frequency (rad/sec)
Normalized Magnitude FFT Optimal SW angle
lane change large turn obstacle avoidance
Figure 3.9: Steering Frequency Spectrum
between them consists mainly in a lag. There is also a small damping in the actual steering wheel angle but this is a negligible contribute to the error.
The filter on the inverse transfer function has been then tuned in order to obtain a good compromise between minimization of this average lag and smoothness of the feedforward signal. The filter has finally been chosen as in (3.6).
H = 1
(1 + s/5)(1 + s/30)5 (3.6)
It is composed of a low-frequency pole at 5 rad/sec and a high-frequency term at 30 rad/sec. This range of frequencies is in accordance with the optimal steering wheel angle spectrum power distribution of figure 3.9. This has been found to be an optimal choice for the three road profiles implemented. In figure 3.10 it is finally displayed the Bode diagram for the original inverse transfer function (not proper) and the filtered one, both for FT and PT.
An interesting observation can be made on the inverse transfer function. The
0 20 40 60 80 100 120 Magnitude (dB) 10−2 10−1 100 101 102 −180 0 180 360 540 Phase (deg) Bode Diagram Frequency (rad/sec) original TF filtered TF
(a) Bode diagram of the inverse TF (FT)
0 20 40 60 80 100 120 Magnitude (dB) 10−2 10−1 100 101 102 −90 0 90 180 270 360 450 Phase (deg) Bode Diagram Frequency (rad/sec) original TF filtered TF
(b) Bode diagram of the inverse TF (PT)
Chapter 3. Testing HSC for curve negotiation in computer simulation 27 continuous gain is exactly equal to the steering wheel stiffness. This means that in order to obtain a constant steering wheel angle it is sufficient to contrast the steering wheel stiffness only, neglecting the whole dynamics of the human NMS and that of the steering wheel itself.
The inverse interaction dynamics transfer function computed with this procedure is considered to be more reliable than the approximated one from the original scheme. In fact the procedure started with an analytical computation of the exact inverse transfer function, followed by a procedure of filtering to make it proper. Whereas in the original model the transfer function had been approximated in the first place without taking into account the control scheme from which it should be derived.
3.1.6
Internal models for feedback
As described in section 2.1.2, the human control signal is also composed of a feed-back term. Regarding the intrinsic feedfeed-back, in the presented generic model it has been explained that the human operator reacts to uncertainties and disturbances to match the actual arm state with the predicted arm state computed by the Visual controller subsystem and this mechanism has been modelled as a spring-damper system.
In this section the Internal models of figure 3.11 that produce the input of the Intrinsic feedback are explained in detail. Basically this is the new part that has been added to the original Human operator model in order to study the behaviour of the shared control schemes in different situations.
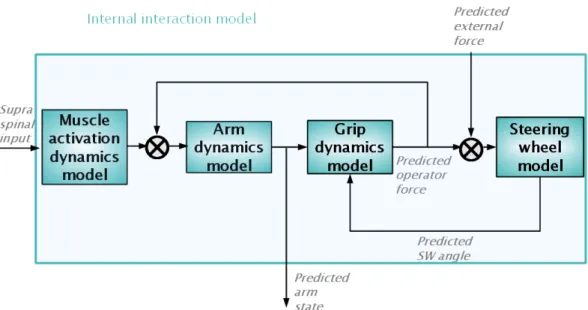
The Internal interaction model, in detail in figure 3.12, represents the operator knowledge of the interaction between the human arm and the steering wheel. From this internal representation a predicted arm state can be computed. Notice that the steering wheel in this internal model has in input the human arm feedforward signal but may have in addition a predicted external force signal.
This additional input represents the human knowledge of an external device that is present in the actual system, for example a shared controller. When the oper-ator is aware that an external signal is provided to the control interface, the arm position and velocity are predicted by using also the expected signal.
The torque external input comes from an internal model of the controller inside the human operator that is show in figure 3.13. This internal controller can be for instance chosen as the DHA controller but notice from figure 3.11 that its ref-erence input is chosen equal to the operator refref-erence. By including an internal model of the controller we can simulate a situation where the operator is aware that a shared controller is present and therefore no intrinsic feedback will arise if the actual controller has the same reference of the human operator that is if human and controller agree on the control goal. An uncertainty proportional gain can be set to the internal controller torque output in order to simulate different conditions. If this gain is set to 1, the internal controller output is equal to the actual controller output and no intrinsic feedback will be produced. This is the ideal situation when the operator exactly predicts the controller behaviour and no compensation is required. On the other side, a uncertainty gain of 0 can be
Chapter 3. Testing HSC for curve negotiation in computer simulation 28
Figure 3.11: Internal models for feedback
Chapter 3. Testing HSC for curve negotiation in computer simulation 29
Figure 3.13: Internal model of controller
chosen to simulate a different condition where the driver voluntarily decides to react to the controller output and this way we can simulate a different task for the operator.
In section 2.2 two different haptic controllers have been introduced. The main difference between them lies in the kind of aiding they provide and the operator setting that must be chosen in order to follow the aiding.
Regarding the DHA controller, it has been explained that it provides an aiding signal that the human operator should give way to in order to get a benefit from it. The optimal setting for the human intrinsic feedback should therefore be a force task, namely giving way to forces during active guidance. In this FT it can be therefore assumed that the operator is aware of the controller aiding and does not want to fight with it. The uncertainty gain of the internal controller is then set to 1 for a FT. This way, if the controller reference matches the operator one there will no intrinsic feedback.
On the other side, in a position task the operator decides to contrast the controller aiding and maintain the steering wheel in an optimal position by considering only his own input, therefore the uncertainty gain of the internal controller is set to 0. This way in a PT there will be some intrinsic feedback present, also in case the reference trajectories of operator and shared controller are equal.
It has been explained that IHA controller provides a signal in a form of distur-bance. Therefore, the uncertainty gain has been set to 0 both for a FT and PT. This way, the operator decides to react to the force feedback in both cases and what changes between them is the intensity of the resistance.
Chapter 3. Testing HSC for curve negotiation in computer simulation 30
Table 3.1: Uncertainty gains on the Internal model of controller
FT PT
DHA 1 0
IHA 0 0
3.1.7
Visual subsystem operator and controllers settings
The Visual blocks of operator (2.1), DHA shared controller (2.3) and IHA con-troller (2.5) have been chosen with the same parameters. This way, in case operator and shared controller agree on the reference trajectory of the vehicle to follow, the optimal steering wheel angles produced will also be equal. With this assumption, which removes one unnecessary degree of freedom, the systems behave in such a way that a clear analysis can be performed. The Visual block parameters were set so to ensure the stability of the systems with the employed road profiles:
• look-ahead time of the Predictor (figure 2.5): T LH = 1 sec
• gain on the future lateral error: P1,hum = P1,DHA= P1,IHA = 1 rad/m
• gain on the future heading error: P2,hum = P2,DHA= P2,IHA = 0.01
3.1.8
Haptic subsystem controllers settings
The Haptic block of the controller must still be tuned in a shared control fashion. This means that the controller should be given a limited control energy so to allow the operator to potentially override the controller torque on the steering wheel. Therefore, the haptic control gain has been tuned in a scheme where operator and DHA controller were present, that is scheme B.Operator-DHA shared control.
The gain of (2.4) was chosen GDHA= 1N/rad and the torque signals are shown in
figure 3.14 in a sample test. Notice that this gain is about equal to one forth of the continuous gain of the inverse transfer function in the operator haptic subsystem. The same gain has been chosen for the IHA (2.6) in order to make the comparison
with DHA as clearest as possible, GIHA = 1 N/rad.
3.2
Results of the computer simulation
In this section the shared control schemes implemented in Simulink are tested with the introduced road profiles and settings. The tests performed in simulation allow to reach a higher understanding of the behaviour of the human-machine system under different driving conditions and what changes when the operator decides to give way to the force feedback or to contrast it. Some experimental hypotheses will come out from these results to be tested with an experimental campaign.
Chapter 3. Testing HSC for curve negotiation in computer simulation 31 0 5 10 15 −1.5 −1 −0.5 0 0.5 1 1.5 sec Nm
torque force feedback contact torque
Figure 3.14: Comparison between operator contact torque and controller torque
3.2.1
Manual control
First of all the scheme A. Manual control is tested to show how the operator is able to guide a vehicle in ideal conditions where no uncertainties and disturbances are present. In a second test a torque disturbance is added on the steering wheel to investigate on how the NMS setting can influence performance in this case. As mentioned before, when the operator has full knowledge of the system to control and there are no additional disturbances it is possible to guide the vehicle in a feedforward fashion. The operator calculates in a closed loop the torque input to provide on the steering wheel through visual feedback and prediction of the future error of the vehicle with respect to the road reference.
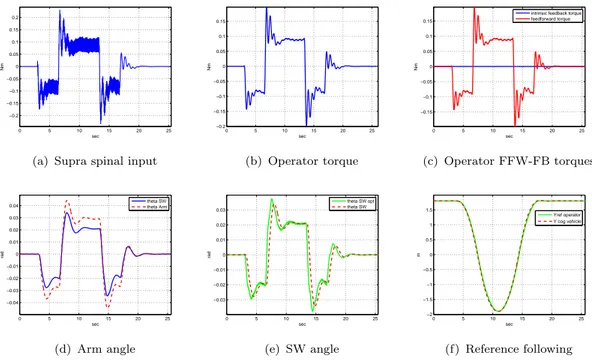
In a first test, the lane change profile is employed. The NMS can be set to a FT or PT. What changes between FT and PT in this case is just the inverse transfer function and the grip parameters. In figure 3.15 are shown the results for a FT setting and in figure 3.16 for a PT setting. First notice that the supra-spinal input signals of figures 3.15a-3.16a are more noisy than the correspondent torque signals from figures 3.15b-3.16b and this is because the supra spinal input passes through the muscle activation dynamics function that works as a low-pass filter. Secondly, from figures 3.15c-3.16c it can be observed that the feedback torque is zero in both cases. In figures 3.15d-3.16d are displayed the steering wheel and arm angles. The main difference between FT and PT is the arm angle with respect to the steering wheel angle, with a 0.01 rad slip between them relative to a 0.045 rad maximum steering wheel angle in a FT setting and virtually no slip in PT. However, this difference does not affect performance: the actual steering wheel angle is close to the optimal one in both FT and PT (figures 3.15e-3.16e) and also the reference following is guaranteed in both cases (figures 3.15f-3.16f). In figure 3.17 the errors between the vehicle center of gravity Y-position and the Y-reference are compared in FT and PT. Notice that there is no actual difference in performance.
If there is an external torque signal on the steering wheel the operator will react with a feedback force to bring back his arm to the desired position. This is because an external noise is an unpredictable signal not included in the operator internal model and therefore a normal reaction will be to reject it.
Chapter 3. Testing HSC for curve negotiation in computer simulation 32 0 5 10 15 20 25 −0.2 −0.15 −0.1 −0.05 0 0.05 0.1 0.15 0.2 sec Nm
(a) Supra spinal input
0 5 10 15 20 25 −0.2 −0.15 −0.1 −0.05 0 0.05 0.1 0.15 sec Nm (b) Operator torque 0 5 10 15 20 25 −0.15 −0.1 −0.05 0 0.05 0.1 0.15 sec Nm
intrinsic feedback torque feedforward torque (c) Operator FFW-FB torques 0 5 10 15 20 25 −0.04 −0.03 −0.02 −0.01 0 0.01 0.02 0.03 0.04 sec rad theta SW theta Arm (d) Arm angle 0 5 10 15 20 25 −0.03 −0.02 −0.01 0 0.01 0.02 0.03 sec rad theta SW opt theta SW (e) SW angle 0 5 10 15 20 25 −2 −1.5 −1 −0.5 0 0.5 1 1.5 sec m Yref operator Y cog vehicle (f) Reference following
Figure 3.15: Manual control (FT) in lane change
0 5 10 15 20 25 −0.2 −0.15 −0.1 −0.05 0 0.05 0.1 0.15 0.2 sec Nm
(a) Supra spinal input
0 5 10 15 20 25 −0.15 −0.1 −0.05 0 0.05 0.1 0.15 sec Nm (b) Operator torque 0 5 10 15 20 25 −0.15 −0.1 −0.05 0 0.05 0.1 0.15 sec Nm
intrinsic feedback torque feedforward torque (c) Operator FFW-FB torques 0 5 10 15 20 25 −0.04 −0.03 −0.02 −0.01 0 0.01 0.02 0.03 sec rad theta SW theta Arm (d) Arm angle 0 5 10 15 20 25 −0.03 −0.02 −0.01 0 0.01 0.02 0.03 sec rad theta SW opt theta SW (e) SW angle 0 5 10 15 20 25 −1.5 −1 −0.5 0 0.5 1 1.5 sec m Yref operator Y cog vehicle (f) Reference following
Chapter 3. Testing HSC for curve negotiation in computer simulation 33 0 5 10 15 20 25 −0.08 −0.06 −0.04 −0.02 0 0.02 0.04 0.06 0.08 sec m Yref error FT Yref error PT
Figure 3.17: Manual control comparison FT-PT in lane change
In this second test, a noise signal on the steering wheel has been generated to simulate a lateral wind disturbance on the car. The employed road profiles is a large turn. In figures 3.18 and 3.19 are shown plots for FT and PT respectively. The total torques are displayed in figures 3.18a-3.19a. Notice the presence of
0 5 10 15 20 −5 −4 −3 −2 −1 0 1 2 sec Nm
(a) Operator torque
0 5 10 15 20 25 −4 −3 −2 −1 0 1 2 3 sec Nm
intrinsic feedback torque feedforward torque (b) Operator FFW-FB torques 0 5 10 15 20 25 −0.4 −0.3 −0.2 −0.1 0 0.1 0.2 0.3 0.4 0.5 sec rad theta SW theta Arm (c) Arm angle 0 5 10 15 20 25 −0.8 −0.6 −0.4 −0.2 0 0.2 0.4 0.6 sec rad theta SW opt theta SW (d) SW angle 0 5 10 15 20 0 0.1 0.2 0.3 0.4 0.5 0.6 0.7 sec rad
(e) Error arm angle
0 5 10 15 20 0 0.2 0.4 0.6 0.8 1 sec rad (f) Error SW angle
Figure 3.18: Manual control (FT) in lane change with disturbance
a feedback torque in this case due to the disturbance and the higher feedback in PT (figures 3.18b-3.19b). In figures 3.18c-3.19c-3.18d-3.19d are displayed optimal steering wheel angles, actual angles and arm angles. The slip between arm angle and steering wheel angle, as well as the error between optimal and current wheel angle are lower in PT (figures 3.18c-3.19c-3.18d-3.19d). It can be observed from figure 3.20a that the reference following error for PT is lower. The comparisons for FT and PT of steering wheel errors and torques are displayed respectively in figures 3.20b-3.20c. It can be concluded that when a torque disturbance on the steering wheel is present it is convenient to adopt a position task in order to reject the noise and optimize road following performance.