1
Characterization of old and modern durum wheat
genotypes
in relation to gluten protein and dietary fibre composition
Contents
Abstract 5
1. Introduction 6
1.1. Durum wheat: economical, botanical and agronomical aspects 7
1.2. Storage proteins: gliadins and glutenins 11
1.3. Environmental changes in storage protein composition 14
1.4. Carbohydrates 16
1.5. Cereal dietary fibre and their role in human diet 16
1.5.1. Arabinoxylans 17
1.5.2. Mixed-Linkage Glucans 18
1.6. Phenolic compounds 19
1.7. Influence of breeding activity on durum wheat yield and quality 20
1.8. Aim 23
2. Materials and methods 24
2.1. Genotypes 25
2.2. Field trial 26
2.2.1. Weather condition 27
2.2.2. Yield and quality parameters 28
2.3. Storage proteins 28
2.3.1. Gluten index 28
2.3.2. Extraction of gliadins and glutenins 29
2.3.3. SDS-PAGE 29
2.3.4. 2DE SDS-PAGE 30
2.3.5. Western blot 31
2.4. Dietary fibre 32
2.4.1. Determination of total and water extractable pentosan 32
2
2.4.3. HPAEC system (high-performance anion-exchange chromatography) 32
2.4.4. PACE 33
2.4.5. Determination of relative viscosity of aqueous extract 33
2.4.6. High-performance size-exclusion chromatography (HPSEC) 33
2.4.7. Phenolic acids content 34
2.5. Statistical analysis 34
3. Results 35
3.1.Yield and quality parameters 36
3.2.Storage proteins 37
3.2.1. Gluten index 38
3.2.2. Gliadin : glutenin ratio 39
3.2.3. SDS-PAGE 39
3.2.4. Principal component analysis 46
3.2.5. Characterization of ω-5 gliadin by western blot 50
3.2.6. Effect of the crop season analysed by 2DE SDS-PAGE 52
3.2.6.1. 2DE of Gliadins 52
3.2.6.2. 2DE of Glutenins 56
3.3. Dietary fibre 60
3.3.1. Determination of pentosan content 60
3.3.2. Relative viscosity 65 3.3.3. Enzymatic fingerprinting 66 3.3.3.1. Arabinoxylan 66 3.3.3.2. Mixed-linkage β- glucan 71 3.3.4. PACE 74 3.3.5. Analysis of monosaccharides 75
3.3.6. Evaluation of specific viscosity of semolina water extract by Size Exclusion Chromatography 79
3.3.7. Phenolic compounds 82
3.3.8. Analysis of the correlation of DF parameters 83
3.3.9. PCA of DFcomposition 85
4. Discussions 88
3
4.2. Storage proteins 91
4.2.1. Effect of the breeding activity on gluten protein composition 91
4.2.2. Effect of the crop season on gluten protein composition 93
4.2.3. Differences in gluten protein composition in relation to WA and CD 93
4.3. Dietary fibre 94
4.3.1. Effect of the breeding on DF composition 96
4.3.2. Effect of the crop season on DF composition 97
5. Conclusions 98
References 101 Acknowledgements
5 Abstract
Old wheat varieties have been suggested to have greater health benefits compared with modern cultivars in relation to both bioactive components and gluten composition. However limited data are available supporting this hypothesis, in particular for durum wheat. So the purpose of this thesis was to improve our understanding of the influence of Italian 20th century breeding on the main grain quality characters. To this aim phenotyping of an old and a modern durum wheat group of genotypes was performed in relation to gluten and dietary fibre composition. The better gluten index observed in the modern group of genotypes was related to higher contents of glutenin and B- type LMW-GS which were, on average, two times higher in the modern group of durum wheat genotypes. Instead, a drastic reduction of the content of ω- 5 gliadins, also known as Tri a 19 a major allergen in food wheat allergy (WDEIA), was observed in the modern genotypes. The immunological and proteomic approaches adopted allowed these differences to be related not only to global down-expression, but also differences in specific isoforms.
In relation to environmental influence on gluten protein composition, a higher glia/glu ratio, and contents of omega gliadins and type B LMW-GS content were observed when water deficit occurred during grain filling in 2013 crop season.
Cell wall dietary fibre were determined with arabinoxylan (AX) and β-glucan (MLG) composition being determined by enzymatic fingerprinting in wholemeal and semolina flour. Although no significant variations were observed in the total amount of AX, a higher proportion of water soluble AX was observed in the modern varieties in wholemeal flour. The water soluble AX extracted from semolina flour showed a lower arabinose : xylose ratio in the old genotypes while a higher MLG content in semolina was observed in modern varieties. No differences were observed between the viscosities of aqueous extracts of soluble DF in old and recent varieties but considerable variability was observed between the different durum wheat genotypes. Similarly, no significant differences were observed between the contents of bound phenolic acids in the old and the modern genotypes.
In relation to environmental influence on dietary fibre composition, increases in %WE-AX, relative viscosity and G3/G4 β-glucan ratio were observed when higher rainfall occurred during grain filling in 2014.
In conclusion the 20th century breeding seems to have improved both technological and healthy quality of Italian durum wheat genotypes.
6
7
1.1.Durum wheat: economical, botanical and agronomical aspects
Cereals are the most cultivated plants in the world. According to the Food and Agriculture Organization of the United States (FAO), wheat is the first cultivated crop interesting about 18% of the world cultivated area (Figure 1) and is included in the “big three” cereal crops with over 700 millions of tons produced together with corn and rice (http://faostat.fao.org/).
Figure 1 List of the top 7 crops produced in the world (FAO, 2015)
Among cultivated wheat species, durum wheat (Triticum turgidum L., subsp. durum Desf.), often called pasta wheat (Shewry, 2009), represents about 5% of the total wheat production (Shewry, 2009) and it is mainly cultivated in the temperate world areas, in particular in north America and Mediterranean basin (International Grain Council, 2015). Italy, together with Canada, represents one of the top world producer (Table 1), with the national production concentrated in the Southern and in the central regions (De Vita et al., 2006). Semolina flour obtained by the milling process is used for pasta production, but also for semolina bread, cous cous and other bakery products (Flagella, 2006; Sissons, 2008).
8
Table 1 Worldwide durum wheat production (expressed as millions of tons) – International Grain Council 2015
Durum wheat is a tetraploid (AABB) species belonging to the Poaceae family and Triticum genus. The first cultivation of wheats, in particular diploid einkorn (AA) and tetraploid emmer (AABB), occurred in the Neolithic revolution (about 10000 years ago) as part of the transition from hunting and gathering of food to settled agriculture in the south-eastern part of Turkey (Heun et al., 1997; Nesbitt, 1998; Dubcovsky and Dvorak, 2007; Shewry, 2009). The spread of domesticated landraces from its site of origin into Europe was via Anatolia to Greece (8000 before present - BP) and then both northwards through the Balkans to the Danube (7000 BP) and across to Italy, France and Spain (7000 BP), finally reaching the UK and Scandinavia by about (5000 BP). Similarly, wheat spread via Iran into central Asia reaching China by about
(3000 BP) and to Africa, initially via Egypt. It was introduced by the Spaniards to Mexico in
1529 and to Australia in 1788 (Feldman, 2001; Shewry, 2009).
The A genomes of tetraploid and hexaploid wheats are clearly related to the A genomes of wild and cultivated einkorn (Table 2). By contrast, the B genome of tetraploid and hexaploid wheats is probably derived from the S genome present in the Sitopsis section of Aegilops, with Ae. speltoides being the closest extant species. The S genome of Ae. speltoides is also closest to the G genome of T. timopheevi, a tetraploid species with the A and G genomes (Shewry, 2009). Country 2011/12 2012/13 2013/14 2014/15 Variation EU-28 8.2 7.9 7.9 7.7 -2.5% France 2.1 2.4 1.8 1.6 -11.1% Greece 0.9 0.7 0.8 0.9 12.5% Italy 3.9 4.2 4.0 4.0 0% Spain 0.9 0.4 0.9 0.9 0% Kazakhstan 3.0 1.4 2.0 2.1 5.0% Canada 4.2 4.6 6.5 4.8 -26.2% Mexico 2.2 2.1 2.3 2.3 0.1% USA 1.4 2.2 1.7 2.5 47.1% Argentina 0.2 0.2 0.3 0.3 0.0% Syria 1.7 1.5 1.5 1.5 0.0% Turkey 3.0 3.0 3.0 2.8 -6.7% India 1.1 1.2 1.2 1.3 8.3% Algeria 2.5 3.0 2.5 2.5 0.0% Morocco 1.7 1.3 1.9 1.6 -15.8% Tunisia 1.2 1.3 1.2 1.2 0.0% Australia 0.6 0.5 0.5 0.5 0.0% others 5.8 8.2 5.7 5.7 0.0% World total 36.7 35.2 38.0 36.6 -3.7%
9
Table 2 Summary of the major cultivated and wild species of wheat (from Shewry and Tatham, 2016) Ploidy genome Wild species Cultivated species
diploid
D T. tauschii
A T. urartu
A T. monococcum var.
boeticum T. monococcum var. monococcum einkorn
tetraploid
AB T. turgidum var.
dicoccoides
T. turgidum var. dicoccum emmer T. turgidum var. durum durum hexaploid
ABD T. aestivum var. aestivum bread wheat
T. aestivum var. spelta spelt
In Mediterranean basin durum wheat is a winter crop, usually sown in autumn-winter and harvested from June (exceptionally late May) to July. Phenological growth stages are shown in Figure 2, described by Zadoks et al. (1974). Briefly, from germinated seed first leaf emerge from the soil (emergence) and first root appear; during plant development a number of leaves are produced (5-8) and main stem keeps a reduced size; in this stage a number of secondary stems are produced, in relation to the seed density and environmental conditions (tillering); subsequently stem elongation and spike formation occurs (booting) until plant reaches its maximum size and spike emerge (heading). Self-fertilization occurs within the spikelets present into each spike, with the formation and the development of grains (grain filling) and a subsequent final dehydration stage (ripening) until grain maturation is reached. Yield and its component (number of kernels per unit area and kernel weight) are mainly affected by thermo-pluviometrical conditions that can occur, in particular from advanced booting (stage 49 of Zadoks growth scale) to maturity.
Figure 2 Wheat phenological growth stages. Different numbers refer to different growth stages, according to Zadoks et al, (1974)
10
In Mediterranean area drought and heat stress are critical events that can influence spike and kernel formation and development (Rharrabti et al., 2003; Guzman et al., 2016). In cereals, variations in grain yield are more associated with changes in grain number than to mean grain weight (Fischer, 2011). Nutrient availability, in particular nitrogen, can affect yield and grain protein content (Shewry et al., 2009) and the rate and duration of wheat grain development (Dupont and Altenbach, 2003, Altenbach, 2012). Soil management can affect the water, nitrogen and CO2 availability during plant life cycle (Tellez-Rio et al., 2015); the influence of
deep, conventional or no tillage may vary in order to temperature and rainfall conditions (De Vita et al., 2006).
At maturation, kernels are harvested from the spike, stored and milled for production of flour. Grain composition mainly consists on about 65-80% of starch and 8-20% of proteins, with a lower content of lipids (1.9%) localized in the germ fraction, minerals (1.5%), non starch-polysaccharides (1.6%) and other chemical compounds (vitamins, phenols). Botanically the grain is the fruit of wheat, formed after self-fertilization into the spikelet. Grain morphological aspects are shown in Figure 3. Briefly, grain consists on external layers (pericarp and aleurone) rich in cellulose, hemicelluloses, lignin and minerals; these layers form the bran fraction after milling process that represents about 13-17% of grain dry weight. The main part of the grain is represented by endosperm, with abundance of starch and storage proteins (Pomeranz, 1982). Germ or embryo is the botanical seed of the grain and it is rich of lipids and minerals, and it represents about 2-3% of grain dry weight.
11 1.2.Storage proteins: gliadins and glutenins
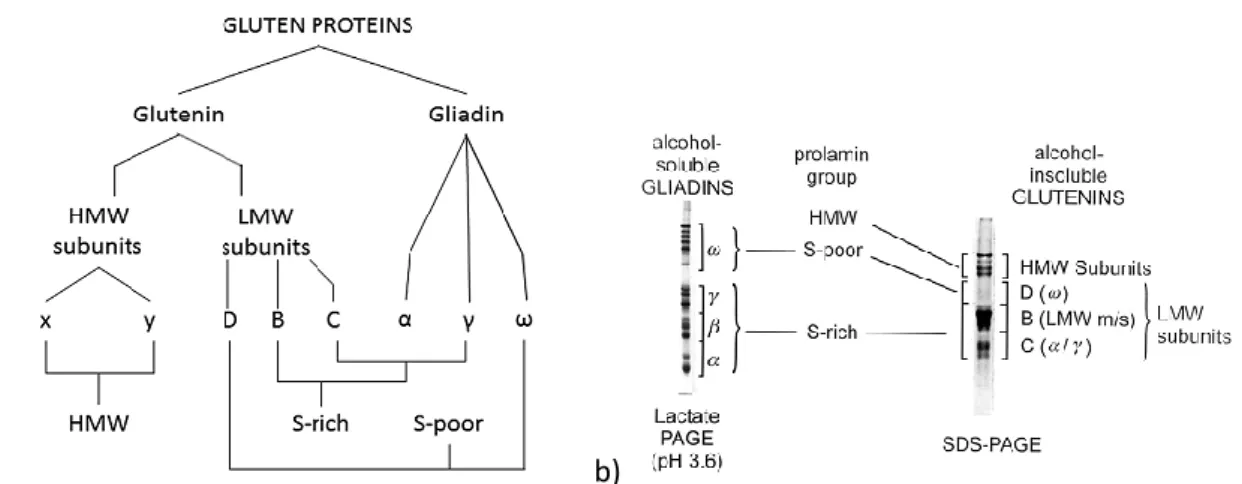
Grain storage proteins are soluble in alcohol and they are subdivided in monomeric and polymeric fractions as represented in Figure 4a, respectively classified on the basis of the molecular weight (Figure 4b) in gliadins (α-, γ- and ω-subunits) and glutenins (high and low molecular weight glutenin subunits, HMW-GS and LMW-GS),.
a) b)
Figure 4 The group of gliadin and glutenin proteins separeted by SDS-PAGE (a) and schematic summary of the classification of gluten proteins (b), from Shewry and Tatham (2016)
Glutenins and gliadins constitute a continuous visco-elastic network in dough called gluten (Shewry, 2009), as represented in Figure 5.
a) b)
Figure 5 Representation of monomeric gliadin and polimeric glutenin (a) and enlarged image of gluten network (from Shewry, 2009)
In tetraploid wheat, HMW-GSs are subdivided into x- and y-types, both encoded on the long arm of chromosomes 1A and 1B, at the Glu-A1 and Glu-B1 loci.
Some of the most important HMW-GS allelic forms are shown in Figure 6. LMW-GSs are classified in B-, C-, and D-subunits, according to their structural and functional properties; they are encoded on the short arms of chromosomes 1 (1A and 1B) at the Glu-A3 and Glu-B3
12
loci, and also by loci tightly linked to the Gli-1 and Gli-2 loci on chromosomes 6, depending on the LMW-GS subgroup.
Figure 6 Different allelic forms of HMW-GS by SDS-PAGE on bread wheat
Figure 7 SDS-PAGE of glutenins (A) and acid polyacrylamide gel electrophoresis (A-PAGE) of gliadins (B) in gamma 42 and gamma 45 durum wheat biotypes (from D’Ovidio and Masci, 2004)
The B-subunits are typical LMW-GS with a peculiar structure encoded by genes on chromosomes 1; instead, the C- and D- subunits are gliadin-like LMW-GS encoded by genes on chromosomes 6, structurally similar to gliadins but functionally acting as glutenins, due to their ability to form intermolecular disulfide bonds by means of unpaired cysteine residues. γ- and ω- gliadin subunits are coded on the short arms of group 1 chromosomes by genes at Gli-1 loci, meanwhile α- and β- subunits, are coded by genes at the Gli-2 loci on the short arms of group 6 chromosomes. The LMW-GS are encoded by genes at the Glu-3 loci on the short arms of chromosomes 1A and 1B and are also important in the determination of the final use of wheat. It has been reported that LMW-GS, especially subunits encoded by loci on chromosome 1B (Glu B3), are involved in the end-use quality of durum wheat; in particular the specific group LMW-2 (Figure 7) was related with the best pasta-making properties while
13
LMW-1 was associated with poor pasta-making characteristics (D’Ovidio et al., 1999). The typical LMW-GS are divided into three groups according to the first amino acid residue of the mature protein. They are LMW-m, LMW-s and LMW-i types, starting with Met, Ser and Ile, respectively.
The role of gliadins in viscosity and extensibility is well documented (Wieser et al., 2007; Sissons et al., 2008), even if not particularly relevant in pasta-making quality. However, an increasing interest on the characterization of gluten proteins is due to the immune stimulating effects of certain sub-fractions (mostly gliadins) on susceptible human population.
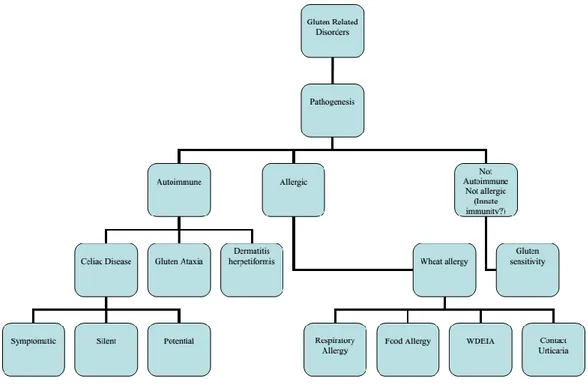
The introduction of wheat storage (gluten) proteins in diet is responsible of disorders to susceptible human patients. A nomenclature of gluten related disorders has been suggested, as reported in Figure 8. Wheat allergy (WA) and celiac disease (CD) are currently considered the most important immune mediated disorders associated to the ingestion of gluten in diet (Sapone et al., 2012).
Figure 8 Proposed nomenclature of gluten related disorders, from Sapone et al. (2012)
The list of the known wheat allergens (Table 3a) includes either soluble or storage proteins (Matsuo et al., 2015), while T- cell epitopes related to CD are present only in storage proteins (Table 3b).
Table 3 List of the main known wheat allergen (a) - from Matsuo et al. (2015), and list of coeliac disease relevant T-cell epitopes from wheat, barley and rye. Glutamine residues deamidated by tissue transglutaminase
14
are shown in bold, additional glutamine residues targeted by transglutaminase are underlined (from Shewry and Tatham, 2016)
a) b)
1.3.Environmental changes in storage protein composition
An increasing number of investigations by proteomic approach on wheat protein composition has occurred in the latest years. Most of the studies were focused on individuating genetic and environmental differences, in particular on bread wheat (Dupont et al., 2006; Zorb et al., 2009; Hurkman et al., 2013). Few studies are available on durum wheat. An initial group of studies on durum identified and characterized gliadin and glutenin proteins, as basis for further experiments (Mamone et al., 2005; Mamone et al., 2009; Muccilli et al., 2010; Muccilli et al., 2011, Pompa et al., 2013). Recently the implications of environmental stress conditions on storage protein expression and composition during grain development were investigated on bread (Skylas et al., 2000; Shewry et al., 2009; Liu et al., 2012; Koga et al., 2015) and durum wheat (Giuliani et al., 2014, Giuliani et al., 2015). Drought and high temperatures during grain filling are the major abiotic stressors, causing significant alterations
15
to both yield and quality in many crops worldwide (Flagella et al., 2010). To date, a number of studies used two-dimensional electrophoresis (2-DE) to investigate gluten protein responses to high temperature, fertilizers, and drought (Dupont et al., 2006; Zorb et al., 2009). Concerning the effect of high temperatures on gluten proteins, Dupont et al. (2006) reported increases in HMW-GS and α-gliadins and a decrease in LMW-GS in response to thermal stress. Moreover, Majoul et al. (2003) identified three α-gliadins that increased in response to high temperature, and Yang et al. (2011) reported changes in the relative amounts of some α-gliadins, an increase in γ-gliadins and in some LMW-GS, and a decrease in some ω-gliadins when high temperatures occurred in post anthesis. The same authors observed a decrease in α- and γ-gliadins and changes in the relative amounts of some LMW-GS as a consequence of drought.
The different developmental profiles reported in the literature demonstrate that gluten protein accumulation is a complex process that is subject to spatial and temporal regulation as well as to environmental signaling. During grain filling, environmental factors change protein composition influencing also the final quality (Naeem et al., 2012; Sherwry et al., 2009; Hurkman et al., 2013; Giuliani et al., 2015). High temperature (and also water deficit) shortens the duration of grain filling and reduces the time taken to reach apoptosis and harvest maturity (Altenbach et al., 2012). Consistent with these events, transcripts for α-, γ-, and ω-gliadins, HMW-GS, and LMW-GS accumulate and disappear earlier. Yang et al. (2011) applied both heat and water stress to a T. aestivum cultivar and found the highest gliadin contents at 19 DAA under heat treatment and at maturity under water stress conditions. Moreover, the authors found that high-temperature treatment resulted in higher glutenin and gliadin contents at maturity; this contrasts with the findings of other authors, who found that high temperature can induce synthesis of gliadins in wheat at the expense of glutenins (Daniel and Triboi, 2000). In contrast to the gliadin fractions, multiple high temperature or water-deficit events applied at both terminal spikelet and anthesis resulted in significantly higher glutenin content at maturity than did the single-stress treatments (Yang et al.,2011). Moreover, the same authors reported that some storage proteins, including α- and γ-gliadins, LMW-GS, and globulins, decreased and that one globulin and one specific LMW-GS increased in response to water deficit. It is fundamentally important to understand how environmental treatments affect the timing of grain developmental processes in order to pursue wheat quality, because protein synthesis of storage proteins occurs during this stage.
16 1.4.Carbohydrates
Carbohydrates account for the vast majority of the wheat mature grain dry weight, exact amounts vary between different studies but; they are monosaccharide (glucose, fructose) and disaccharides (sucrose and maltose), oligosaccharides (raffinose, fructans) starch and up to about 10% cell wall polysaccharides (mainly cellulose, arabinoxylan and mixed linkage-glucan), the latter forming the major DF components (Stone and Morell, 2009; Andersson et
al., 2013). However, there are large differences between the compositions of the different
grain tissues. In particular, the aleurone and outer layer (pericarp and testa), which form the bran fraction on milling of wheat, contain little starch but up to half of the dry weight is cell wall polysaccharides, while the starchy endosperm (the major storage tissue of the grain) comprises about 85% starch and only 2-3% cell wall polysaccharides (Lafiandra et al., 2015). Wheat starch consists on α-D-glucose units which make up the polymers amylose and
amylopectin in a ratio of 1:3. The former is a linear α- glucan polymer ((α- 14) linked glucose units, while the latter has a more branched structure with some ((α- 16) linkages. Starch properties are affected by the complexity of the branching architecture, in particular chain length distribution and clustering, which can influence the ability to form double helical conformations and the crystalline features (Jeon et al., 2010). The influence of starch in pasta cooking is well documented (Soh et al., 2006). In some cases starch or starch fragments may escape digestion in the small intestine and are termed resistant starch (RS). Resistant starch is classified into five types. High amylose starch has a higher RS content than normal starch (Birt et al., 2013, Lafiandra et al., 2015). Recently TILLING (Targeting Induced Local Lesions IN Genomes) has been used to obtain high amylose starch in durum wheat (Sestili et
al., 2015). Plant species with lower amylose starch also exist, such as the pseudo cereals
amaranth and quinoa (Qian and Kuhn, 1999).
1.5.Cereal dietary fibre in human diet
Non-starch polysaccharides (NSP) comprise polymers of hexose sugars (glucose, mannose, deoxy-hexoses rhamnose and fucose, glucuronic and galacturonic acids) and pentose sugars (arabinose and xylose). They form the major cell wall polysaccharides with the major components in wheat being cellulose, mixed-linkage β- glucan and arabino-xylan. (Lafiandra
et al., 2014; Lovegrove et al. 2015). Dietary fibre is one of the major food constituents that
influence the rate and extent to which blood glucose increases after ingestion of a carbohydrate food. DF is not digested and absorbed in the small intestine but passes to the colon where it undergoes bacterial degradation (fermentation). The principal types of DF are
17
NSP, resistant starch (RS), oligosaccharides (short chain carbohydrates) and some polyols and modified starches. The daily intake of NSP in the diet in European countries varies between 11 and 33 g, all of which will reach the colon (Saris et al., 1998).
An important health benefit of DF is the capacity to lower the glycaemic response of the foods in which it is present: foods rich in DF release glucose more slowly which is absorbed into the blood which is relevant to the prevention of disorders such as obesity and type II diabetes (Nugent, 2005). Food viscosity is a potential mechanism by which DF slows down the rate of digestion of starch and the absorption of sugars. The effect is considered to be related to viscosity, which inhibits mixing and diffusion in the intestinal tract and delays gastric emptying. Moreover, high viscosity may also decrease enzyme diffusion and result in the formation of an unstirred water layer which decreases glucose transport to enterocytes. It has been demonstrated that reducing the viscosity of DF, after pre- acid hydrolysis, results in concurrent loss of its clinical efficacy (Riccardi et al., 2004).
A significant proportion of DF that enters the large bowel will be fermented by the commensal bacteria that live in the colon. Fermentation is an anaerobic process which produces the short chain fatty acids (SCFA) acetate, propionate and butyrate as the principal end-products, together with methane, hydrogen, carbon dioxide and lactate. The SCFA’s are believed to maintain healthy colonocyte function and are to be effective in the prevention of serious diseases such as colorectal cancer (Lafiandra et al., 2014).
1.5.1. Arabinoxylans
Arabinoxylan (AX) polymers represent about 70% of total grain wheat cell wall NSPs (Mares et Stone, 1973). AX consists on a backbone of xylose (β-D-xylopyranosyl) linked by (1 4)
glycosidic linkages, which may be substituted with arabinose (α-L-arabinopyranosyl) at either
the 3 or the 2 and 3 positions, as shown in Figure 9. AX is present as water-extractable (WE-AX) and water unextractable (WU-(WE-AX) fractions. In white flours which correspond broadly to the starchy endosperm tissue, the average contents of WE-AX and WU-AX are 0,5 and 1,7 g/100g flour, respectively (Dervilly-Pinel et al., 2001a; Ordaz-Ortiz and Saulnier, 2005; Saulnier et al., 1995, 2007). Thus, the total AX content in wheat flour/endosperm is about 2.2% and approximately 1/4 of total AX are WEAX (Table 1). The structure of WU-AX, which represents the major part of AX in cell walls of the endosperm, is very similar to that of WE-AX but the average molecular weight and the ratio of arabinose to xylose (A/X ratio) are slightly higher for WU-AX (Izydorczyk and Biliaderis, 1995). The higher A/X ratio corresponds to a higher proportion of mXyl and a lower proportion of uXyl in WU-AX
18
compared to WE-AX whereas the proportions of dXyl are similar in WE-AX and WU-AX. The amount of ferulic acid linked to AX is low and represents 0.2-0.4% of WE-AX (w/w) and 0.6-0.9% of WU-AX in wheat (Bonnin et al., 1999). This corresponds to about 2-4 ferulic acid residues for 1000 xylose residues in WE-AX (6-10 for WU-AX). Dehydrodiferulic acids were also detected in very low amounts (10-15 times less than ferulic acid) in WE-AX from wheat (Dervilly-Pinel et al., 2001a). In the endosperm, the water solubility of AX is mainly determined by chain length and arabinose substitution, and also by the proportion of chain-chain cross-linking through covalent “diferulic bridges” which is higher in WU-AX than in WE-AX (from Saulnier et al. 2012).
Figure 9 Schematic (top) structures of wheat starchy endosperm arabinoxylan, from Lafiandra et al. (2014)
1.5.2. Mixed-Linkage Glucans
Mixed-linked β-glucans are glucose units linked (1→4)-β (as in cellulose) but interspersed with (1→3)-β-linkages (Figure 10). The (1→3)-β-linkages generally occur after three or four β-(1→4) linkages, but more extensive cellulose-like stretches of up to 20 (1→4)-β-linked residues have been reported in wheat bran (Li et al., 2006). The irregular linkage structure prevents the formation of an ordered crystalline structure, leading to the β -glucans being partially water-soluble. The (1→3)(1→4)-β-D-glucans are characteristic of the cell walls of cereals while β-glucans with (1→3)(1→6) linkages occur in fungi. Water-soluble mixed-linked β-glucans of barley (where they constitute ~70% of endosperm cell wall polysaccharides (Fincher and Stone, 1986) and oats are able to form viscous solutions and dispersions.
19
Figure 10 Representation of chemical structures of mixed linkage glucan
1.6.Phenolic compounds
Phenolic acids represent the most common form of phenolic compounds found in whole grains. The most abundant phenolics acids in whole grain are ferulic (FA), vanillic (VA), p-coumaric (CA), and syringic acids which derive from hydroxycinnamic acid (Figure 11). These acids are present in three forms: as soluble free acids, soluble conjugates that are esterified to sugars and other low molecular mass components, and insoluble bound forms (Li
et al., 2008). The bound form is the most abundant, linking cell wall structural components
such as cellulose, lignin, and proteins and through ester bonds crosslinking polymers, particularly arabinoxylans in cereal cell walls (Saulnier et al., 2007). They are concentrated in the bran fraction and are present at lower levels in white flour. A role of FA and other phenolic compounds in antioxidant activity with anti-inflammatory, anti-ageing, anti-bacterial related effect is suggested. As well as the scavenging activity of these antioxidants, their affinity with lipid substrates, might be important factors in protecting lipids from oxidising events (Kikuzaki et al., 2002).
20
1.7.Influence of breeding activity on durum wheat yield and quality
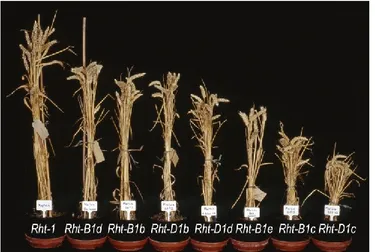
During the 20th century breeding programs were aimed to obtain genotypes according to the Donald’s ideotype with higher grain yield, shorter size and early maturation to better fit Mediterranean conditions where drought and high temperature can occur during ripening (De Vita et al., 2007). The Italian breeding program started with the activity of the breeder Nazareno Strampelli (1866–1942) who selected North African landraces to obtain durum wheat with earlier maturity, ability to avoid drought and heat stress conditions typical of the Mediterranean crop area. The result was the introduction of the cultivar Senatore Cappelli (Bozzini, 1970). Further, breeding activity was concentrated on the selection of well adapted genotypes, with the introduction of Syropalestinian durum wheats (i.e. Eiti), representing the backbone of crop cultivation until the 1960s. During this period the aim to reduce the plant size was promoted by Strampelli who crossed the Japanese wheat variety Akakomugi, the source variety for Rht8 (reduced height) and PpD1 genes with the cross of Wilhelmina Tare x Rite to shorten the straw and achieve resistance to lodging, as well as early ripening, obtaining several bread wheat varieties (1918): Villa Gloria, Ardito, Mentana and Damiano in 1918 (Borojevic and Borojevic, 2005). However, the introgression of the dwarfing genes Rht1 and Rht2 by Norman Borlaug (1970 Nobel Peace Prize winner) from Norin 10 (Triticum aestivum, L.) was carried out in 1968 in CYMMIT short recombinant lines and transferred to durum wheat varieties. A generation of semi- dwarf varieties (Figure 12) with higher harvest index (harvestable mass on total plant mass ratio) from the 1970s were cultivated and crossed for high yield, better stability and environmental adaptability, according to the ideotype postulated by Donald (1968).
A secondary aim of the breeding was to obtain durum wheat with storage proteins suitable for better pasta making quality (Raciti et al., 2003). Storage proteins are defined as proteins that accumulate during the grain-filling period and are used as nitrogen (N) sources during seed germination (Shewry and Halford, 2002). Despite higher yield, generally lower grain protein content occurs in modern genotypes, which is explained by dilution due to higher numbers of grains per unit area, and increased starch content (Triboi et al., 2003). Triboi (2000) found in particular that N availability is a key factor influencing protein content and composition. However, the technological properties of gluten proteins are mainly related to specific allelic variants of high molecular weight and low molecular weight glutenin subunits (Rao et al., 2001; Shewry and Halford, 2002; Sissons, 2008,). Several studies on durum wheat heritage varieties demonstrated that an indirect selection according to the gluten strength and flour mixograph properties occurred (Raciti et al., 2003; De Vita et al., 2007; Nazco et al., 2014,
21
Subira et al., 2014); this activity occurred in an early stage of the breeding with the substitution of the allelic LMW-1 glutenin subunit with the LMW-2 and in the latter part the substitution of the allelic Glu B1 (Bx + By) associated with poor quality for pasta making (20, 6+15, 13+16) with the better quality allelic Glu B1 forms (6+8, 7+8). The higher grain protein content did not significantly affect pasta making quality in low temperature pasta drying (< 40°C); however, in high temperature pasta drying (> 70°C) grain protein content is more important (Sissons, 2008). In the latest decades breeding activity has also focused on the efficient use of natural resources (water, minerals, N) and to enhance health properties of the grains (Shewry et al., 2015).
Figure 12 Effect of allelic dwarfing Rht gene on wheat size
Investigations using genetic, proteomic and immunological approach (especially on bread wheat) have been carried out on storage proteins involved in celiac disease (De Vita et al., 2013, Suligoj et al., 2013, van den Broeck 2010, Shewry, 2015) and wheat allergy (Denery-Papini et al., 2007; Denery-(Denery-Papini et al., 2011; Lupi et al., 2013; Altenbach et al., 2015). A study focused on relevant immune-stimulant α- gliadins on old and modern wheat genotypes showed a variability in α- 9 and α- 20 gliadin, individuating a lower amount in a group of old landraces (van den Broeck et al., 2010); however this study on only 2 epitopes on 28 is not conclusive. Gregorini et al. (2009) carried out an investigation on two α- gliadins involved in CD on a small group of durum wheat varieties, including some old genotype without finding significant differences. Those results were further confirmed by Suligoj et al. (2013) on small intestinal T cell lines generated from celiac patients, including ancient wild species (T.
monococcum and speltoides).
The health properties of wheat grain are related to the contents of several class of components, including high-amylose starch, non-starch polysaccharides (arabinoxylan, mixed-linkage β- glucan, fructans) and phenolic compounds. In the HEALTH-GRAIN integrated project, differences in dietary fibre and phenolic compounds on 150 bread wheats,
22
10 durum wheat genotypes, and lines of emmer, einkorn, barley, oat and rye were observed. The heritability of the AX was found to be about 70% in white flour, with about 30% effect of environment (Shewry et al., 2010) and a relatively low effect of the genotype x environment interaction (Gebruers et al., 2010).. The AX content was measured in white flour and bran, showing a lower relative content of water extractable AX (%WE-AX) in ancient species (emmer), and a higher range of values in bread wheat species; however a larger number of bread wheats were analysed. Recently on a population of 104 tetraploid accessions (including durum wheat of different years of registration), Marcotuli et al. (2015) found a range 1.5 – 5.5% of AX (dry weight) , individual significant Marker-trait associations (MTA), identifying 19 QTL associated with AX content, in particular on chromosome 5A. In the same investigation, a variability in mean and range of AX content between tetraployd species was observed, with lower content in some wild species (wild emmer, Triticum turgidum subsp
dicoccoides). Studies on DF includes resistant starch (RS) in wheat with high amylose starch
(Raksegi et al., 2014), also in durum (Sestili et al., 2015).
Concerning phenolic compounds, Dinelli et al. (2011) identified several phenolic acids in old and durum wheat genotypes, reporting also the relative proportions of bound, free and conjugated form, without finding significant differences between old and modern types (Dinelli et al., 2009). Furthermore, an indirect evaluation of phenolic acid contents based on the antioxidant activity was adopted to explore differences in a collection of old and modern durum wheat genotypes; however, no statistically significant differences between the two groups were found (Laus et al., 2015).
Phenotyping for morphological and molecular quality traits, in association with selection based on molecular markers, should allow genetic diversity to be studied under different environmental and agronomical conditions (Lopes et al., 2014), including collections of old types (Royo et al., 2014) both for improving technological quality and health benefits and for adaptation to climate change (Lopes et al., 2015).
23 1.8.Aim
Old wheat varieties have been suggested to have healthier benefits compared with modern cultivars in relation to both bioactive components and gluten composition. However limited data are available supporting this hypothesis, in particular for durum wheat. So the purpose of this thesis was to give a contribution to the comprehension of the influence of Italian 20th century breeding on the main grain quality characters. To this aim a characterization of an old and a modern durum wheat group of genotypes was performed in relation to storage protein and dietary fibre composition.
24
25 2.1.Genotypes
Durum wheat genotypes were selected based on the year of release from 1900 to 2005, as showed in Table 4. Genetic relationship with genotypes is shown in Figure 13.
Table 4 List of the investigated genotypes with relative pedigree and year of release
Genotype Pedigree Year of release
Dauno III old apulian landraces 1900
old Saragolla old apulian landraces 1900
Cappelli Jean Retifah north african cultivar 1915
Russello old sicilian landraces 1910
Garigliano Tripolino x Cappelli 1927
Timilia RB local sicilian landraces 1910
Grifoni 235 Cappelli x Aziziah 1949
Adamello Valforte x turkish line 7116 1985
Simeto Capeiti 8 x Valnova 1988
Preco Edmore/WPB881//Selected line 3 1995
Svevo Cimmyt line x Zenit 1996
Iride Altar 84 x Ionio 1996
Claudio (Sel. Cimmyt x Durango) x (IS1938 x Grazia) 1998
Saragolla Iride x PSB 014 line 2004
PR22D89 (Ofanto x Duilio) x Ixos 2005
Figure 13 Genetic tree of the investigated durum wheat genotypes
Four genotypes are Italian old local landraces from Apulia (Dauno III, old Saragolla) and Sicily (Russello, Timilia R.B. “reste bianche”). Cappelli is the first Italian durum wheat cultivar, obtained from introduction of north African landraces by Nazareno Strampelli
(1866-26
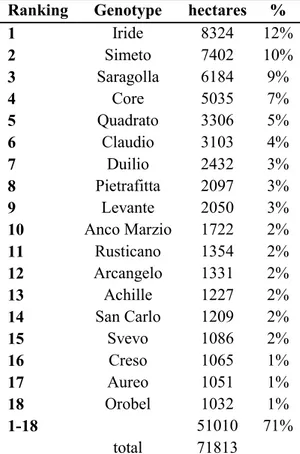
1942). Garigliano and Grifoni 235 were obtained by selection further selection from Cappelli. Modern genotypes were selected after the introduction of the Rht gene. Iride, Simeto and Saragolla represent the top cultivated cultivars in Italy, as shown in Table 5.
Table 5 List of the top cultivated durum wheat cultivars in Italy (ENSE 2012).
Ranking Genotype hectares %
1 Iride 8324 12% 2 Simeto 7402 10% 3 Saragolla 6184 9% 4 Core 5035 7% 5 Quadrato 3306 5% 6 Claudio 3103 4% 7 Duilio 2432 3% 8 Pietrafitta 2097 3% 9 Levante 2050 3% 10 Anco Marzio 1722 2% 11 Rusticano 1354 2% 12 Arcangelo 1331 2% 13 Achille 1227 2% 14 San Carlo 1209 2% 15 Svevo 1086 2% 16 Creso 1065 1% 17 Aureo 1051 1% 18 Orobel 1032 1% 1-18 51010 71% total 71813 2.2.Field trials
Plants have been grown in field on clay–loam soil at Foggia (Italy, 41° 28' N, 15° 32' E and 75 m a.s.l.), in two growing season (2013 and 2014). Field trials were conducted by at Centro di Ricerca per la Cerealicoltura (Crea-Cer) that provided grain samples.
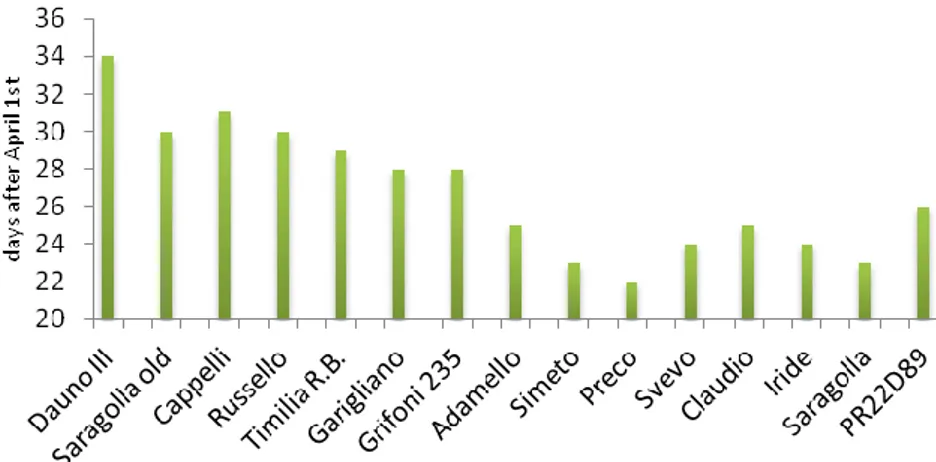
In both years fertilization plan consisted on an application of 80 kg ha-1 of nitrogen and 70 kg ha-1 of phosphorous. A reduced N input was adopted in according to the ordinary agronomic practises adopted in Mediterranean area, in particular to reduce lodging in high-size old genotypes. N fertilizer was applied in two rates: 2/3 at sowing date (150 kg ha-1 of diammonium phosphate N 18%) and 1/3 at tillering stage (200 kg ha-1 of ammonium nitrate N 26-27%). Sowing time was at the first decade of December in both crop seasons. Heading date was recorded when about half of the culms showed emerging spikes (growth stage 55; Zadoks et al., 1974). Varietal earliness was expressed as heading date after April 1st, as shown in Figure 14. Plots were harvested mechanically in June each year.
27 Figure 14 Heading date expressed as days after April 1st
2.2.1 Weather condition
In Figure 15 the rainfall distribution and maximum and minimum decadal mean temperatures of the 2013 (a) and 2014 (b) crop seasons are reported. With the exception of December and January, higher and better distributed rainfall occurred in the second crop season with respect to the first one. This trend was more evident after flowering when the rainfall occurred from the 2nd decade of April (flowering) to the 2nd decade of June (harvest) was three times higher in the second crop season (Table 6). On the contrary, the max and min temperature trend was similar between the two years.
Figure 15 Rainfall distribution and maximum and minimum decadal mean temperatures of the 2013 (a) and 2014 (b) crop seasons
Table 6 Focus on grain filling weather condition (from 2nd decade of April to 2nd decade of June)
T max (°C) mean T min (°C) mean T (°C) evaporated (mm) rainfall (mm) 2013 24.9 11.1 18.0 284 53.8 2014 23.1 11.1 17.0 241 152.8 b) a)
28 2.2.2 Yield and quality parameters
At harvest, grain yield (kg m−2) and its main components, 1000 kernel weight (TKW) and number of kernels m-2, were determined. Test weight, moisture, grain protein content and ash have been determined by NIR System Infratec 1241 Analyzer (Foss, Hillerod, Denmark) at Department of SAFE (Unifg) (Figure 16a).
Seed dimensions were analysed by Marvin Seed Analyser (Gta Sensors Gmbh-Germany).
a) b)
Figure 16 Foss Infratec 1241 (a) and Cyclotec Tecator 1093
Wholemeal and semolina flours have been obtained from kernels respectively milled by Cyclotec Tecator 1093 (Figure 16b) sample mill (sieve 1mm) and Bona mill 4 cylinders (sieve 180µm). Samples for DF analysis have been re-milled by Ball mill (sieve 150µm). Total N content of wholemeal and semolina flour was measured by the Dumas method (1831) and expressed as percent dry matter. Protein content of flour was then calculated by multiplying the N content by 5.7. Grain protein content (GPG) and semolina protein content (SPC) was calculated on a dry weight basis and expressed as percentage.
2.3.Storage proteins 2.3.1. Gluten index
The gluten index (G.I.), an indicator of the gluten strength, was determined using the Glutomatic system according to ICC standard 155 (ICC, 1986). In particular, gluten was separated from semolina by centrifugation to force wet gluten through a specially constructed sieve under standardized conditions. The percentage of wet gluten remaining on the sieve after centrifugation is defined as the gluten index. If the gluten is very weak all of the gluten may pass through the sieve, the gluten index is 0. When nothing passes through the sieve, the index is 100.
29 2.3.2. Extraction of gliadins and glutenins.
Endosperm storage proteins were extracted according to a modified protocol according to Hurkman and Tanaka (2004) and Giuliani et al. (2015). Briefly 100 mg of flour (semolina and wholemeal) have been suspended with 0.4mL of KCl buffer (pH 7.8) and centrifuged to remove soluble proteins. The KCl insoluble fraction has been suspended with a 1-propanol solution (50% v/v) and centrifuged for 10 minutes at 4,500g (repeated twice) to separate gliadins from glutenins and following suspended in SDS buffer. Extracted protein content (gliadin and glutenin) were measured by Biuret method. (Giuliani et al., 2015).
2.3.3. SDS-PAGE
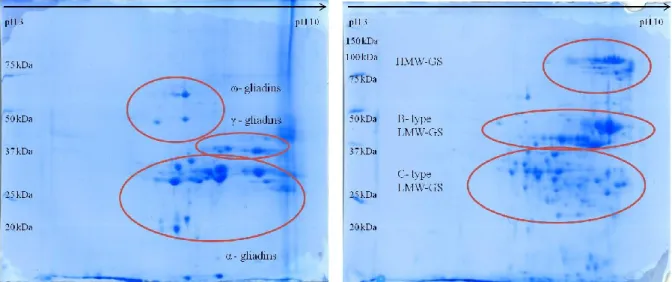
Extracted gliadins and glutenins were run in 12% acrylamide gels at 20mA per gel for 4 hours, by SE 600 apparatus (Hoefer, Inc., Holliston, MA, USA - Figure 17a). Gels were stained with Comassie Brilliant Blue G250 (20% MetOH), distained with tap water and following digitally acquired by scanner (Epson Perfection V750pro – Figure 17b) and analysed by ImageQuant Tl (GE-Healthcare). Two biological and three technical replicates were performed. Band expression have been quantified as total and relative volumes, after removing background by rolling ball method (Figure 18). On the basis of the molecular weight gliadins have been subdivided into three classes: ω-, γ-, α/β-; also glutenins have been subdivided into HMW-GS (type Bx and By) and LMW-GS (D-, B- and C-).
a) b)
Figure 17 SE 600 apparatus for electrophoresis (a) and scanner adopted to digitally acquire electrophoretic gels (b)
30
Figure 18 Example of band expression of gliadins elaborated by software ImageQuant TL
2.3.4. 2DE SDS-PAGE
One old (Cappelli) and one modern (Simeto) genotype from two crop seasons have been characterized by 2DE SDS-PAGE according to Giuliani et al. (2015). Gliadins and glutenins were separated into each class in relation to their isoelectric point and molecular weight (Figure 19). Overall spot gel volume were individuated, quantified and analysed by using Image Master 2D Platinum on three laboratory replicates (Figure 20).
31
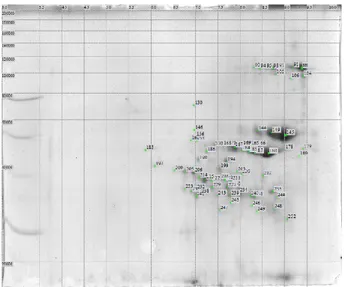
Figure 20 Example of 2DE image analysis on durum wheat glutenin sample (Simeto). Each spot is individuated by a code number
2.3.5. Western blot
Extracted storage proteins (gliadins) were analysed by western blotting by monoclonal antibody specific to ω-5 gliadin (kindly provided by Prof. Peter Shewry), as described in Wan
32 2.4.Dietary fibre
2.4.1. Determination of total and water extractable pentosan (AX)
The whole population was analysed for AX content. Total (Tot-AX) and water extractable (WE-AX) pentosans were determined using a colorimetric method as described by Douglas (1981) and Finnie et al. (2006). Both wholemeal and semolina flour were analysed; two biological and three technical replicates were adopted. The % WE-AX was obtained by the ratio of the WE-AX content divided by the total AX multiplied by 100. Water unextractable (WU-AX) was obtained by difference, Tot-AX minus WE-AX.
2.4.2. Enzymatic fingerprinting of AX and MLG
Samples from wholemeal and semolina were prepared according to the protocol for enzymatic fingerprinting of AX and mixed beta-glucan in wheat grains, adapted from Ordaz-Ortiz, J.J. et
al., (2005). Semolina and wholemeal flour were digested by enzymatic treatment with (endo
1,4 β-xylanase (E.C.3.2.1.8), a xylanase of the GH11 group) for AX, endo 1,3(4) glucanase (‘lichenase’) (E.C.3.2.1.73) for MLG) and the products of digestion separated and resolved by HP-AEC-PAD.
Briefly, 1 ml of 80% (v/v) ethanol was added to 100 mg of flour and heated in a 95°C water bath for 10 min to inactivate endogenous enzymes present in the samples. After centrifugation (10,000 g x 5 mins RT), the residue was washed with 80% (v/v) ethanol and then with 95% (v/v) ethanol to remove and free sugars, and dried using a Speedvac centrifugal evaporator. The dried powder was resuspended in 1 ml of water containing 16 U of endoxylanase and 2 U of lichenase and incubated at 40°C for 16 h with continuous rotation. After centrifugation, 0.6 ml of the supernatant was heated for 10 min in a 95°C hot water bath to inactivate the enzymes.
2.4.3. HPAEC system (high-performance anion-exchange chromatography)
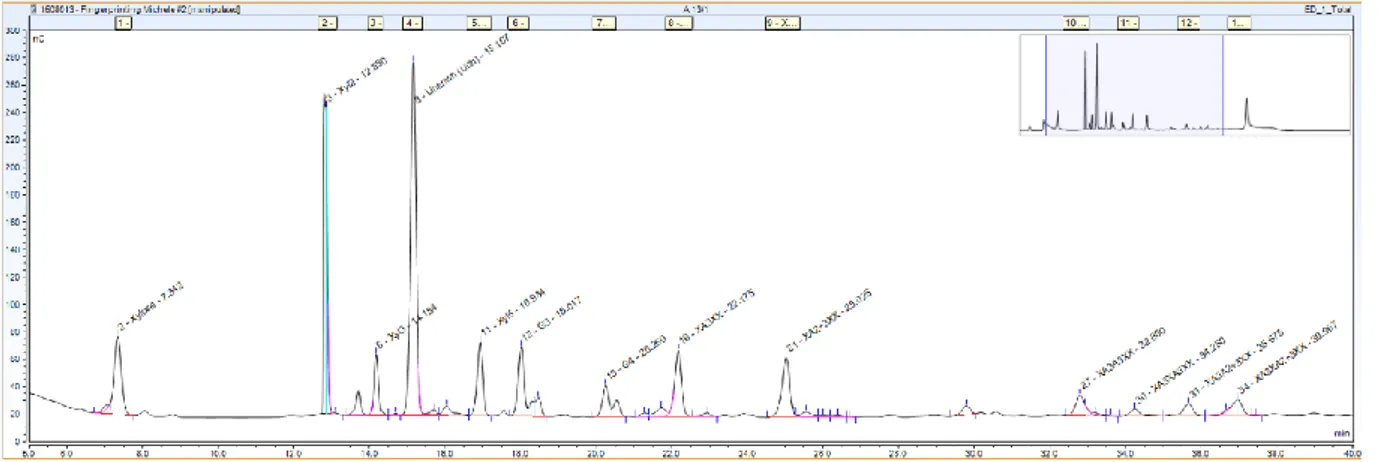
Supernatant obtained after enzyme treatment (above) was filtered through 0.45µm filters (PVDF) (Millipore), diluted 1 in 5 in water and a 20 µL aliquot was injected onto the Carbopac PA1 analytical column (4 × 250 mm) according to Ordaz-Ortiz et al. (2005). Duplicate analyses were carried out on each sample. Oligosaccharides (AXOS) released by enzyme digestion were grouped accordingly: 4 unsubstituted (US: x, xx, xxx, xxxxx), 3 mono-substituted (MS: xa3xx, xa3a3xx, xa3xa3xx) and 3 di-substituted (DS: xa2+3xx, xa3a2+3xx, xa3xa2+3xx). Two main peaks obtained from enzymatic digestion of MLG by lichenase were obtained: G3 and G4 which is a measure of oligosaccharides of 3 glucose
33
residues linked together (β-1,4) or 4 glucose residues linked together (β-1,4). These peaks had previously been identified in the lab of Luc Saulnier (Ortiz-Ortaz et al., 2005) and the method for enzymatic fingerprinting replicated at Rothamsted (Figure 21).
Figure 21 Example of peak area of digested AX and MLG obtained by HPAEC
2.4.4. PACE
Polysaccharide analysis by carbohydrate gel electrophoresis (PACE) was performed on wholemeal and semolina flour from old and modern genotypes of both crop seasons, according to Kosik et al. (2012) of the enzymatic digests generated as described above.
2.4.5. Determination of relative viscosity of aqueous extract
The viscosity of the aqueous extract, according to Saulnier et al. (1995) was measured at 30°C using an automated viscometer (AVS 310, Schott Gerate, Germany) fitted with an Ostwald capillary tube (2 ml, diameter 0.4mm). Relative viscosities ηrel=t/t0 were determined (t: flow time of distilled water, 72-74s). Measured values are means of two extractions. The flow time of each extract was measured 5 times.
2.4.6. High-performance size-exclusion chromatography (HPSEC)
Aqueous extracts obtained from relative viscosity measurements were injected (50 µL) on the high-performance size exclusion chromatography (HPSEC) system according to Lovegrove et
al. (2013). Intrinsic viscosity, size of the polymers, molecular size and concentrations of AX
34 2.4.7. Ferulic and coumaric acid content
Based on the WU-AX content in the two crop seasons, four genotypes were selected and ferulic acid (FA) and coumaric acid (CA) content determined. in both wholemeal or semolina flour. Bound and free + conjugated FA and CA were extracted and analysed by HPLC, according to Li et al. (2008).
2.5.Statistical analysis
Mean and standard deviation was perfomed by MS Excel (Microsoft software). Test T student was performed by JMP (SAS Institute) software. After testing variance homogeneity in the studied characters by Bartlett’s test, data of the two years were analysed together, using the analysis of variance (ANOVA). The significant differences among the mean values were calculated following Tukey’s test, by JMP (SAS Institute) software.
Due to high correlations observed among the different variables, principal component analysis (PCA) was performed on the protein and dietary fibre correlation matrix separately.
Both for gluten protein and dietary fibre analysis, the data set consisted of 90 samples tested with regard to nine variables. Before performing PCA, the values of each variable were properly standardised. Then, a factorial analysis was performed on the PCA values; the varimax method was chosen to obtain the best orthogonal factor rotation. The PCA results were graphically represented in two-dimensional plots, using JMP (SAS Institute) software. All the experiments on gluten proteins were performed at the Herbaceous Crop Quality lab - Department of Agriculture, Food and Environmental Sciences (SAFE), University of Foggia – with the supervision of Prof. Zina Flagella and Prof. Marcella Michela Giuliani.
All the experiments relating to dietary fibre, phenolic compounds and the western blot were carried out at the Department of Plant Biology and Crop Science (PBCS), Rothamsted Research (Harpenden, UK), during a 6 months internship as visiting worker with the supervision of Prof. Peter Shewry and Dr. Alison Lovegrove.
35
36 3.1.Yield and quality parameters
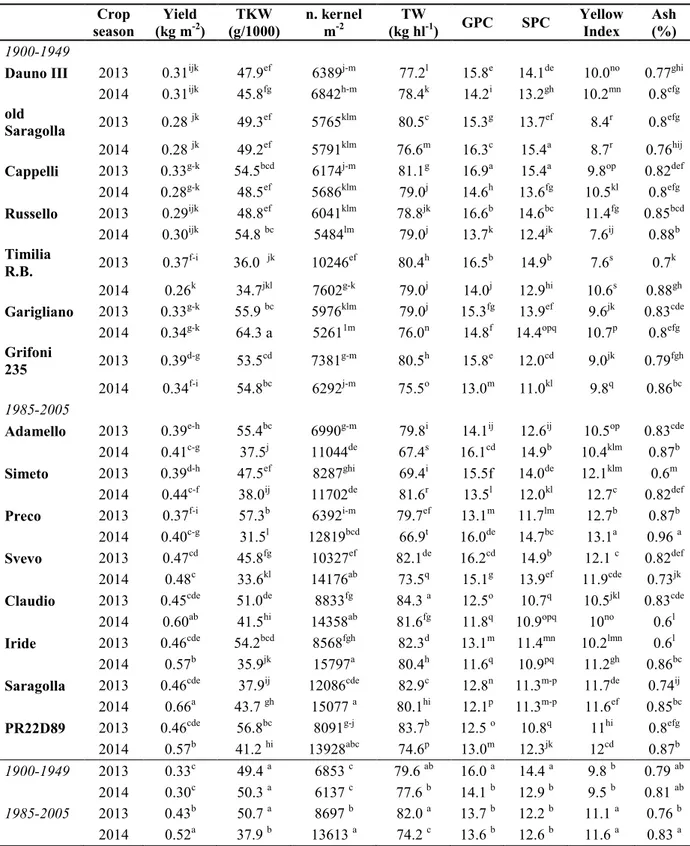
Results relative to yield and its components, grain protein content (GPC), semolina protein content (SPC), yellow index and ash content are reported in Table 7, for old and modern genotypes, grown in 2013 and 2014.
Grain yield ranged from 0.26 (Timilia RB, in 2014) to 0.66 kg m-2 (Saragolla, in 2014), showing significant statistically differences between old and modern durum wheat genotypes grown in the two crop seasons. Modern group of genotypes (1985-2005) showed significant higher yield than old group (1900-1949). As for the effect of the crop season a general higher yield in 2014 was observed, especially for the modern genotypes Claudio, Iride, Saragolla and PR22D89. In Timilia RB a significant higher yield was found in 2013. The effect of the G x Y interaction relative to thousand-kernel weight (TKW) was highly significant (P < 0.001). Values ranged from 31.5 (Preco, in 2014) to 64.3 g (Garigliano, in 2014). A high significant (P < 0.001) reduction of the TKW was observed in the modern group of genotypes, except for Saragolla.
Number of kernel per unit area was significantly higher in the modern group of genotypes with respect to the old one, in particular in 2014, when a general higher number was found (P < 0.01). It ranged from 5261 (Garigliano, in 2014) to 15797 (Iride, in 2014). Old genotypes showed a higher stability between the two crop seasons, with a significant reduction in 2014 only for Timilia RB. As for the test weight, no significant differences between old and modern group were evident, and values ranged from 66.9 (Preco, in 2014) to 84.3 kg hl-1 (Claudio, in 2013). Evident was the effect of the crop season, with a general high significant (P < 0.001) reduction in 2014, except for Dauno III, Russello, and Simeto that showed higher values in 2014. GPC and SPC showed a similar behaviour, with a correlation of 0.976 (P < 0.001) and for this reason protein content is discussed in terms of GPC. Values ranged from 11.6 in Iride in 2014 to 16.9% in Cappelli in 2013. Significant higher protein content was observed in the old genotypes in both crop seasons. A significant reduction occurred in 2014, except for old Saragolla, Adamello, Preco and PR22D89 that showed a higher protein content in 2014 (P < 0.001). Yellow index measured in semolina was significantly higher in the modern group of genotypes (P < 0.001) and ranged from 7.6 (Russello in 2014 and Timilia R.B. in 2013) to 13.2 (Preco, in 2013). Significant higher values were observed in 2013 only in Russello. No significant differences in ash content in semolina between old and modern group were observed. The effect of the crop season showed a significant higher content in 2014 in modern group. The observed values ranged from 0.6 (Simeto, in 2013) to 1.0 % (Preco, in 2014).
37
Table 7 Yield and quality parameters in old and modern genotypes. Crop season Yield (kg m-2) TKW (g/1000) n. kernel m-2 TW (kg hl-1) GPC SPC Yellow Index Ash (%) 1900-1949
Dauno III 2013 0.31ijk 47.9ef 6389j-m 77.2l 15.8e 14.1de 10.0no 0.77ghi 2014 0.31ijk 45.8fg 6842h-m 78.4k 14.2i 13.2gh 10.2mn 0.8efg old Saragolla 2013 0.28 jk 49.3ef 5765klm 80.5c 15.3g 13.7ef 8.4r 0.8efg 2014 0.28 jk 49.2ef 5791klm 76.6m 16.3c 15.4a 8.7r 0.76hij Cappelli 2013 0.33g-k 54.5bcd 6174j-m 81.1g 16.9a 15.4a 9.8op 0.82def 2014 0.28g-k 48.5ef 5686klm 79.0j 14.6h 13.6fg 10.5kl 0.8efg Russello 2013 0.29ijk 48.8ef 6041klm 78.8jk 16.6b 14.6bc 11.4fg 0.85bcd 2014 0.30ijk 54.8 bc 5484lm 79.0j 13.7k 12.4jk 7.6ij 0.88b Timilia R.B. 2013 0.37f-i 36.0 jk 10246ef 80.4h 16.5b 14.9b 7.6s 0.7k 2014 0.26k 34.7jkl 7602g-k 79.0j 14.0j 12.9hi 10.6s 0.88gh Garigliano 2013 0.33g-k 55.9 bc 5976klm 79.0j 15.3fg 13.9ef 9.6jk 0.83cde 2014 0.34g-k 64.3 a 52611m 76.0n 14.8f 14.4opq 10.7p 0.8efg Grifoni 235 2013 0.39d-g 53.5cd 7381g-m 80.5h 15.8e 12.0cd 9.0jk 0.79fgh 2014 0.34f-i 54.8bc 6292j-m 75.5o 13.0m 11.0kl 9.8q 0.86bc 1985-2005
Adamello 2013 0.39e-h 55.4bc 6990g-m 79.8i 14.1ij 12.6ij 10.5op 0.83cde 2014 0.41c-g 37.5j 11044de 67.4s 16.1cd 14.9b 10.4klm 0.87b Simeto 2013 0.39d-h 47.5ef 8287ghi 69.4i 15.5f 14.0de 12.1klm 0.6m 2014 0.44c-f 38.0ij 11702de 81.6r 13.5l 12.0kl 12.7c 0.82def Preco 2013 0.37f-i 57.3b 6392i-m 79.7ef 13.1m 11.7lm 12.7b 0.87b
2014 0.40c-g 31.5l 12819bcd 66.9t 16.0de 14.7bc 13.1a 0.96 a Svevo 2013 0.47cd 45.8fg 10327ef 82.1de 16.2cd 14.9b 12.1 c 0.82def 2014 0.48c 33.6kl 14176ab 73.5q 15.1g 13.9ef 11.9cde 0.73jk Claudio 2013 0.45cde 51.0de 8833fg 84.3 a 12.5o 10.7q 10.5jkl 0.83cde
2014 0.60ab 41.5hi 14358ab 81.6fg 11.8q 10.9opq 10no 0.6l Iride 2013 0.46cde 54.2bcd 8568fgh 82.3d 13.1m 11.4mn 10.2lmn 0.6l 2014 0.57b 35.9jk 15797a 80.4h 11.6q 10.9pq 11.2gh 0.86bc Saragolla 2013 0.46cde 37.9ij 12086cde 82.9c 12.8n 11.3m-p 11.7de 0.74ij 2014 0.66a 43.7 gh 15077 a 80.1hi 12.1p 11.3m-p 11.6ef 0.85bc PR22D89 2013 0.46cde 56.8bc 8091g-j 83.7b 12.5 o 10.8q 11hi 0.8efg 2014 0.57b 41.2 hi 13928abc 74.6p 13.0m 12.3jk 12cd 0.87b 1900-1949 2013 0.33c 49.4 a 6853 c 79.6 ab 16.0 a 14.4 a 9.8 b 0.79 ab 2014 0.30c 50.3 a 6137 c 77.6 b 14.1 b 12.9 b 9.5 b 0.81 ab 1985-2005 2013 0.43b 50.7 a 8697 b 82.0 a 13.7 b 12.2 b 11.1 a 0.76 b 2014 0.52a 37.9 b 13613 a 74.2 c 13.6 b 12.6 b 11.6 a 0.83 a TKW = thousand kernel weight; TW = Test weight; GPC = grain protein content; SPC = semolina protein content. Different letters are significantly different at P < 0.05 according to Tukey's test
Dimension parameters (length, width and thickness) were measured in all samples (data not shown). A high significant correlation between the kernel size measures and the TKW (0.34 * with length, 0.54 ** with width and thickness, * P < 0.05; ** P < 0.01) was observed.
38
A not significant different trend, in terms of the response of the thickness in the two growing seasons, was observed between the two groups of durum wheat genotypes. In particular, old genotypes showed a not significant increase of the thickness in 2014, while a not significant reduction was observed in the same crop season in the modern genotypes (except for cultivar Saragolla).
3.2.Storage protein 3.2.1. Gluten index
Analysis of variance showed a significant effect of the G x Y (genotype x year) interaction on the gluten index, as shown in Figure 22.
Gluten index was significantly higher in the modern group of genotypes (P < 0.001). The old genotypes (from 1900 to 1949) showed a very low gluten index (min 5, max 13) without significant differences, while in the modern group of durum wheat genotypes G.I ranged from 30 to 80. Among these genotypes Claudio and Saragolla showed the highest values and Preco the lowest. The effect of the crop season was significant only in three modern cultivars (Adamello, Preco, PR22D89), resulting in higher values in 2013 crop year, characterized by water deficit during grain maturation. The highest G.I. values were measured in modern cv Saragolla in both crop seasons, while the lowest in Timilia RB and Garigliano G.I. (5).
Figure 22Gluten index in old and modern durum wheat genotypes. Different letters are significantly different at P < 0.05 according to Tukey's test
39 3.2.2. Gliadin : glutenin ratio
Differences in gliadin: glutenin ratio (glia : glut) were observed between the old and the modern group of genotypes (2.8 a vs 1.7 b, T Student p < 0,001) with the latter group statistically lower than the former (Figure 23). The highest values were observed in old genotype Garigliano (5.2) followed by Timilia RB (3.7) while the lowest in modern genotypes Saragolla (1.0) and Svevo (1.2). Differences between crop seasons were found in only three old (Dauno III, Timilia and Garigliano) and three modern (Preco, Iride and PR22D89) genotypes that showed higher values in 2014.
Figure 23 Gliadin : glutenin ratio in old and modern durum wheat genotypes. Different letters are significantly different at P < 0.05 according to Tukey's test
3.2.3. SDS-PAGE
Analysis of gluten proteins and of their relative expression by SDS-PAGE was performed separately on gliadin and glutenin sub fractions. Preliminary electrophoretic gels of gliadins (Figure 24) and glutenins (Figure 25) were analysed for each year.
40
Figure 24 SDS-PAGE of gliadins. Samples were ordered according to the year of release (from left to right)
41
Allelic differences in glutenins (HMW and LMW) are reported in Figure 25 and Table 8. The investigated genotypes consisted mostly in 7+8 Glu B1 and null Glu A1 allelic combination (8/15).
Table 8 Allelic composition of HMW and LMW glutenin subunits in investigated durum wheat genotypes. *Attribution on the basis of the MW position is proposed when no information was available
Genotype Pedigree Year of release Glu A1 allele Glu B1 allele Gli-B1 LMW
Dauno III landraces from south Italy 1900 2* 6 + 8 * LMW-1*
old Saragolla landraces from south Italy 1900 null 7 LMW-2
Russello landraces from Sicily, Italy 1910 null 13 + 16 LMW-1
Timilia RB landraces from Sicily, Italy 1910 null 20 LMW-2
Cappelli selection from Tunisian
population Jean Retifah 1915 null 20
LMW-2
Garigliano Tripolino x Cappelli 1927 null 7 + 8 LMW-2
Grifoni 235 Cappelli x Triticum
aestivum 1949 null 7 + 8
LMW-2
Adamello Valforte x turkish line 7116 1985 null 7 + 8 LMW-2
Simeto Capeiti 8 x Valnova 1988 null 7 + 8 LMW-2
Preco (Edmore x WPB881) x
Selected line 3 1995 null
LMW-2
Svevo Cimmyt line x Zenit 1996 null 7 + 8 LMW-2
Iride (Cimmyt selection x Durango) x (IS1938 x Grazia)
1996 null 7 + 8
LMW-2
Claudio Altar 84 x Ionio 1998 null 7 + 8 LMW-2
Saragolla Iride x PSB 014 line 2004 null 6 + 8 LMW-2
PR22D89 (Ofanto x Duilio) x Ixos 2005 null 7 + 8 LMW-2
Two biological and three technical replicates were adopted. In order to evaluate the storage protein composition, the relative ω– gliadin, γ– gliadin, α–gliadin, HMW-GS and B- and C- type LMW-GS content on the total storage proteins extracted was determined. In Table 9, the effect of the interaction G x Y on storage protein composition in the 15 genotypes under study is reported. Also, a comparison between the old and the modern durum wheat groups was performed on relative storage protein expression normalised per semolina protein unit (Figure 27).