Negative Regulation of Leptin-induced Reactive Oxygen
Species (ROS) Formation by Cannabinoid CB
1
Receptor
Activation in Hypothalamic Neurons
Received for publication, February 22, 2015, and in revised form, March 30, 2015Published, JBC Papers in Press, April 13, 2015, DOI 10.1074/jbc.M115.646885 Letizia Palomba‡§, Cristoforo Silvestri§¶1, Roberta Imperatore§¶, Giovanna Morello§¶, Fabiana Piscitelli§¶, Andrea Martella§¶, Luigia Cristino§¶, and Vincenzo Di Marzo§¶2
From the‡Department of Biomolecular Sciences, University of Urbino “Carlo Bo”, Urbino 61029, Italy and§Endocannabinoid Research Group,¶Institute of Biomolecular Chemistry, Consiglio Nazionale delle Ricerche, Pozzuoli 80078, Italy
Background:In hypothalamic neurons, leptin induces ROS production via PPAR-␥inhibition.
Results:CB1 agonism prevents leptin-induced ROS accumulation by reversing PPAR-␥and catalase inhibition. Inhibition of endocannabinoid inactivation also counteracts leptin effects.
Conclusion:CB1inhibits effects of leptin that underlie part of its anorexic actions.
Significance:During conditions of increased endocannabinoid tone CB1might reduce leptin activity in the hypothalamus.
The adipocyte-derived, anorectic hormone leptin was recently shown to owe part of its regulatory effects on appetite-regulating hypothalamic neuropeptides to the elevation of reac-tive oxygen species (ROS) levels in arcuate nucleus (ARC) neu-rons. Leptin is also known to exert a negative regulation on hypothalamic endocannabinoid levels and hence on cannabi-noid CB1receptor activity. Here we investigated the possibility
of a negative regulation by CB1receptors of leptin-mediated ROS formation in the ARC. Through pharmacological and molecular biology experiments we report data showing that lep-tin-induced ROS accumulation is 1) blunted by arachidonyl-2 ⴕ-chloroethylamide (ACEA) in a CB1-dependent manner in both
the mouse hypothalamic cell line mHypoE-N41 and ARC neu-ron primary cultures, 2) likewise blocked by a peroxisome pro-liferator-activated receptor-␥ (PPAR-␥) agonist, troglitazone, in a manner inhibited by T0070907, a PPAR-␥antagonist that also inhibited the ACEA effect on leptin, 3) blunted under con-ditions of increased endocannabinoid tone due to either phar-macological or genetic inhibition of endocannabinoid degrada-tion in mHypoE-N41 and primary ARC neuronal cultures from MAGLⴚ/ⴚmice, respectively, and 4) associated with reduction of both PPAR-␥and catalase activity, which are reversed by both ACEA and troglitazone. We conclude that CB1 activation
reverses leptin-induced ROS formation and hence possibly some of the ROS-mediated effects of the hormone by preventing PPAR-␥inhibition by leptin, with subsequent increase of cata-lase activity. This mechanism might underlie in part CB1 orexi-genic actions under physiopathological conditions accompa-nied by elevated hypothalamic endocannabinoid levels.
In the central nervous system the hypothalamus, originally recognized as the brain “feeding center,” is the main regulator
of body weight. Hormonal and nutrient signals are processed in this brain area and inform the rest of the brain and the body about the free and stored levels of fuel available for the organ-ism (1). In turn, hypothalamic neuronal circuits use this infor-mation to regulate caloric intake, energy consumption, and peripheral lipid and glucose metabolism. Among the chemical mediators involved in this regulation, the endocannabinoids (ECs)3are master controllers of the fast (i.e. non-genomic) and stress-related fine-tuning of energy intake and processing. The endocannabinoid system (ECS) is composed of two, mostly Gi/o protein-coupled “cannabinoid” receptors, CB1and CB2; their lipid ligands, i.e. the ECs anandamide (AEA) and 2-arachi-donoylglycerol (2-AG), and the enzymatic machinery for EC biosynthesis and degradation. Lately, we and others have dem-onstrated that the ECS plays a pivotal role in the regulation of energy balance through interactions with the anorexigenic adi-pokine hormone, leptin. In particular, this hormone reduces hypothalamic EC levels (2). Leptin is produced and secreted predominantly from the adipose tissue into the circulation. Cir-culating leptin levels positively reflect adipose tissue size and communicate energy storage status to the brain (3, 4). The cen-tral action of leptin is linked to the interaction with its receptor, which is strongly expressed in the hypothalamic arcuate nucleus (ARC), and coupled with the stimulation and inhibition of anorexic and orexigenic signals, respectively.
Recently it was shown that in hypothalamic neurons leptin produces its anorexic effects partly through an increase in reac-tive oxygen species (ROS) levels and subsequent activation of anorexic pro-opiomelanocortin (POMC) neurons, whereas diminishing ROS levels decrease POMC neuron activity but increase the activity of orexigenic neurons co-producing neu-ropeptide Y and agouti-related peptide (5). In these neurons the
1Present address: Dept. of Bioengineering, Imperial College London, Exhibi-tion Road, London SW7 2AZ, UK.
2To whom correspondence should be addressed: Istituto di Chimica Biomo-lecolare, Consiglio Nazionale delle Ricerche, Via Campi Flegrei 34, Comp-rensorio Olivetti, 80078, Pozzuoli (NA), Italy. Tel.: 39-081-8675018; Fax: 39-081-8041770; E-mail: [email protected].
3The abbreviations used are: EC, endocannabinoid; ECS, endocannabinoid system; ACEA, arachidonyl-2⬘-chloroethylamide; AEA, anandamide; 2-AG, 2-arachidonoylglycerol; ARC, arcuate nucleus; DHR, dihydrorhodamine 123; FAAH, fatty acid amide hydrolase; MAGL, monoacylglycerol lipase; PPAR-␥, peroxisome proliferator-activated receptor-␥; ROS, reactive oxy-gen species; ANOVA, analysis of variance.
proliferation of peroxisomes mediated by a peroxisome prolif-erator-activated receptor-␥ (PPAR-␥) agonist resulted in the decrease of ROS levels. ROS are a group of highly reactive mol-ecules, such as singlet oxygen, hydroxyl radicals, superoxide, and hydrogen peroxides. Most ROS have extremely short half-lives (nanoseconds), whereas some others, such as hydrogen peroxide, have millisecond half-lives. Due to their high reactiv-ity, ROS can oxidize cell constituents such as lipids, proteins, and DNA, thus damaging cell structures and compromising their function (6). Because of these potentially noxious effects, cells maintain ROS at a tolerable level by means of antioxidants such as the redox system, superoxide dismutase, and catalase (7). Catalase, predominantly located in peroxisomes, catalyzes the conversion of hydrogen peroxide into water and molecular oxygen (8). The transcription of this enzyme is regulated by PPAR-␥. A putative functional PPAR response element was identified at the promoter region of the rat catalase gene (9). Activation of PPAR-␥ by a specific agonist further enhances catalase activity and protects neurons from oxidative stress (10). Growing evidence indicates that endocannabinoids exhibit profound anti-inflammatory and neuroprotective prop-erties in response to harmful insults, including oxidative stress (11–15). Some of these effects appear to be mediated by PPAR-␥ activation (16–18).
The present study was designed to investigate whether lep-tin-induced ROS formation could be controlled by activation of CB1receptors in hypothalamic neurons. We report that in a mouse hypothalamic neuronal cell line (mHypoE-N41) as well as in primary cultures of hypothalamic neurons, ACEA, a selec-tive CB1receptor agonist, is able to prevent ROS formation induced by leptin in a manner sensitive to AM251, a CB1 recep-tor antagonist/inverse agonist, and through PPAR-␥ activation and subsequent enhancement of catalase activity. Furthermore, by using pharmacological tools and knock-out mice, we show that CB1inhibition of leptin-induced ROS formation is exerted tonically by ECs in hypothalamic neurons.
Experimental Procedures
Cell Cultures—mHypoE-N41cells were cultured in Dulbec-co’s modified Eagle’ s medium (Life Technologies) supple-mented with 10% horse fetal bovine serum (Life Technologies), penicillin (50 units/ml), and streptomycin (50g/ml), at 37 °C in 100-mm culture dishes (Life Technologies) gassed with an atmosphere of 95% air, 5% CO2.
Primary cultures of hypothalamic ARC neurons, derived from neonatal 0- or 1-day-old C57BL/6 (Charles River) or monoacylglycerol lipase (MAGL) null mice, were obtained as described (19). Briefly, the ARC was quickly dissected and mechanically dispersed in Ca2⫹- and Mg2⫹-free buffered Hanks’ balanced salt solution. Then tissues were dissociated enzymatically (0.125% trypsin solution, 37 °C for 20 min) and mechanically. Cells were plated at a density of 2 ⫻ 104 cells/cm2on polylysine-coated coverslips and grown in Neuro-basal medium supplemented with 2% B27, 0.5 mM L-glutamine, penicillin (50 unit/ml) and streptomycin (50g/ml). Cells were used between 6 and 8 days in vitro. More than 80% of primary cultured cells were positive for neuronal marker NeuN
anti-bodies, determined by immunocytochemistry (data not shown).
Quantitative PCR Analysis—RNA was isolated from mHypoE-N41cells using TRIzol (Invitrogen), DNase-treated (Ambion) and reverse-transcribed with SuperScript III RT reaction kit (Invitrogen) according to the manufacturers’ instructions. 10 ng of starting RNA was then used for quantita-tive PCR analysis in 10-l reactions using IQ SYBR Green Supermix on a CFX 384 optical thermal cycler (Bio-Rad). Data are expressed as raw Ct values, as determined by CFX Manager software (Bio-Rad).
Measurement of ROS—ROS formation was assayed using dihydrorhodamine 123 (DHR) or 2⬘,7⬘-dichlorofluorescein diacetate, two cell-permeable oxidation-sensitive dyes. Briefly, the cells were preloaded with 10MDHR (20 min), treated as detailed in the legend to the figures, and finally analyzed with a Leica DMI6000 fluorescence microscope equipped with a Leica DFC320 cooled digital CCD camera (Leica Microsystems). The excitation and emission wavelengths were 488 and 515 nm, respectively. Images were collected with exposure times of 100 – 400 ms, digitally acquired, and processed for fluorescence determination at the single cell level with Metamorph Imaging Software (Leica MetaMorph© AF). Mean fluorescence values were determined by averaging the fluorescence values of at least 50 cells/treatment condition/experiment.
Cnr1 Gene Silencing—Cnr1silencing was obtained by trans-fecting mHypoE-N41 cells with endoribonuclease-prepared siRNA sequences (EMU088771; Sigma) using Lipofectamine 2000 (Life Technologies) and following the manufacturer’s instructions. The siRNA silencing efficiency was determined 24 h after the initial transfection by measuring mRNA levels (data not shown) or the relative amount of the protein using Western blot analysis.
Detection of CB1Receptors—Immunocytochemical and
West-ern blot techniques were used to detect the expression of CB1 receptor protein. For immunocytochemical analysis, primary cultures of hypothalamic ARC neurons were seeded on poly-lysine-coated coverslips, washed 3 times with PBS, and finally fixed for 20 min with paraformaldehyde (4%; v/v). These prep-arations were finally rinsed with PBS and blocked in PBS-con-taining BSA (2%, w/v). The rabbit polyclonal anti-CB1 (Calbio-chem) or mouse monoclonal anti-NuN (Abcam) antibody was used as a primary antibody. After 18 h at 4 °C, the cells were washed and exposed to a fluorescein isothiocyanate-conju-gated secondary antibody for 2 h in the dark. Stained cells were analyzed with a Leica DMI6000 fluorescence micro-scope equipped with a Leica DFC320 cooled digital CCD camera (Leica Microsystems).
For Western blot analysis mHypoE-N41 cell homogenate was subjected to electrophoresis in 10% polyacrylamide gel and transferred to PVDF membranes. Membranes were blocked with 3% BSA for 1 h and incubated overnight at 4 °C with a rabbit polyclonal anti-CB1antibody (Calbiochem; 1:1000 dilu-tions) or with a polyclonal anti-actin (1:1000, Sigma), whereas incubation with the secondary antibody (peroxidase-labeled) was for only 2 h. Actin was taken as the reference protein expression. Detection was performed using ECL Western blot-ting detection reagents (GE Healthcare Italia).
Measurement of 2-AG and AEA Levels—After treatment, the cells (each data point contained 1⫻ 105and 0.5⫻ 105cells/ml for N41 and primary neurons, respectively) and supernatant were homogenized in 50 mmol/liter Tris䡠HCl, pH 7.5, in chlo-roform/methanol (1:2:1, v/v) containing 10 pmol of [2H
8]AEA and 5 pmol of 2-[2H
5]AG as internal standards and analyzed using liquid chromatography-atmospheric pressure chemical ionization-mass spectrometry as previously described (20). 2-AG and AEA levels were calculated on the basis of their peak area ratio (in the SIM mode) with the internal deuterated stan-dard peak areas, and their amounts (pmol) were normalized per ml of cells plus medium.
Catalase Activity—Catalase activity was measured using an Amplex Red Catalase Assay kit (Life Technologies) following the manufacturer’s instructions. Briefly, cells treated as detailed in the figure legend were washed twice with PBS, scraped on ice, and finally sonicated 3 times with a Branson Sonifer operating at 20 watts for 15 s. The resulting homogenates were centri-fuged for 5 min at 18,000⫻ g at 4 °C. The supernatant was used to measure catalase activity. The decomposition of hydrogen peroxide (40M) by catalase was monitored by reaction with 50 MAmplex red reagent in the presence of 0.2 unit/ml horse-radish peroxidase. Fluorescence was measured in a fluores-cence microplate reader using excitation at 530 nm and emis-sion at 590 nm. Catalase activity was normalized to protein concentration, which was quantified by the Lowry protein assay.
PPAR-␥ DNA Binding Activity—The DNA binding activity of PPAR-␥ was assessed using a commercially available PPAR-␥ transcription factor assay kit (Abcam) according to the manufac-turer’s instructions. Briefly, the nuclear extracts prepared from treated cells were added to the provided wells coated with spe-cific oligonucleotide sequences. A primary polyclonal anti-PPAR-␥ antibody was then added followed by the addition of horseradish peroxidase-conjugated antibody and the substrate 3,3⬘,5,5⬘-tetramethylbenzidine. The absorbance of the devel-oped color was read at 450 nm using a microplate reader. Results
CB1Receptor Activation Mitigates Leptin-induced ROS For-mation in mHypoE-N41 Cells and in Primary Cultures of Hypo-thalamic ARC Neurons—Recently, it was reported that the mechanism whereby leptin produces its anorexic effects might involve ROS formation in ARC neurons (5). We used DHR, a cell-permeable fluorogenic probe that is useful for the detection of ROS formation, to determine if the treatment of murine hypothalamic mHypoE-N41 cells with increasing concentra-tions of leptin results in ROS accumulation. As shown in Table 1, mHypoE-N41 cells express high levels of CB1 receptor mRNA together with the mRNAs encoding for the major bio-synthetic enzymes of the ECS, including the anandamide hydrolyzing enzyme, fatty acid amide hydrolase-1 (FAAH-1), the anandamide biosynthesizing enzyme, N-acylphosphatidyl-ethanolamine-specific phospholipase D, and the 2-AG biosyn-thesizing enzyme, diacylglycerol lipase-␣. Very low levels of CB2receptor mRNA and MAGL were instead found. As illus-trated in Fig. 1A, a 4.5-h treatment with leptin induced a dose-dependent formation of ROS with the maximum effect at 100
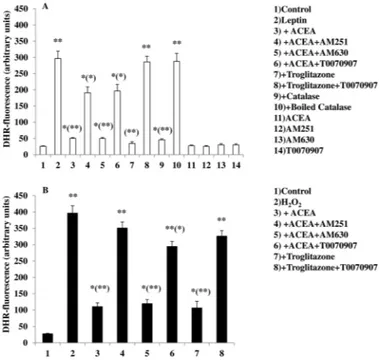
ng/ml. The leptin (100 ng/ml) response was reduced by pre-exposure for 15 min to ACEA, a specific CB1receptor agonist, in a dose-dependent manner (Fig. 1B). The inhibitory effect of ACEA (0.5M) was abolished by treating the cells with AM251 (0.5M), a CB1receptor antagonist/inverse agonist (Fig. 2A). In the same experimental conditions, treatment with AM630, a CB2 receptor antagonist, was ineffective. Similar results were obtained using 2⬘,7⬘-dichlorofluorescein diacetate, another fluorogenic probe to detect ROS formation (data not shown). In vivostudies have demonstrated that the accumulation of ROS induced by leptin were mitigated by the proliferation of peroxi-somes, induced by PPAR-␥ activation (5). This might be the case also for mHypoE-N41 cells treated with leptin, because, as shown in Fig. 2, a short pre-exposure (15 min) to troglitazone (1 M), a PPAR-␥ agonist, prevented the formation in a manner sensitive to T0070907, a specific PPAR-␥ antagonist. It is important to note that in the same experimental conditions, T00700907 also abolished the inhibitory effect of ACEA on lep-tin. Accordingly, mHypoE-N41 cells express high levels of the mRNA encoding for PPAR-␥ but not PPAR-␣ (Table 1). Inter-estingly, leptin-induced ROS formation, although insensitive to heat-inactivated catalase, was prevented by enzymatically active catalase (10 unit/ml; Fig. 2A). These findings are, there-fore, consistent with the possibility that H2O2is the major reac-tive molecule produced by the cells after treatment with leptin. Additionally, both ACEA and troglitazone were also able to prevent the H2O2-induced DHR oxidation. Again the inhibi-tory effect of ACEA was prevented by both AM251 and T00700907 but not by AM630 (Fig. 2B).
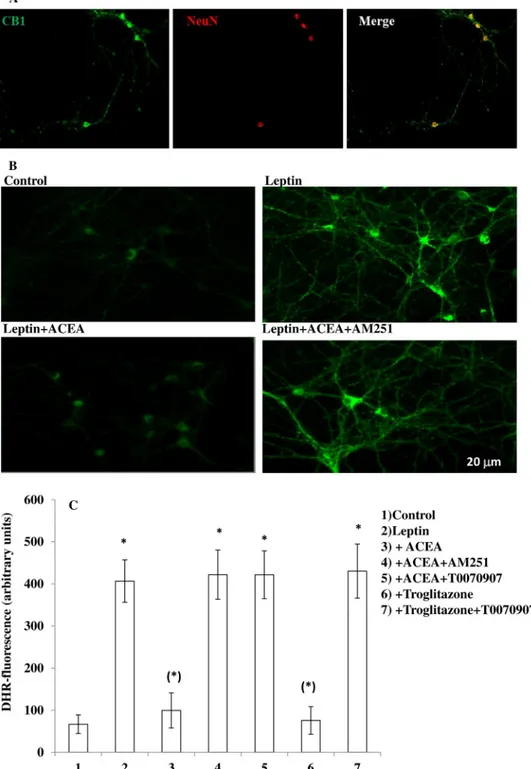
The results obtained with leptin were confirmed in primary cultures of ARC neurons. Using immunocytochemical tech-niques, we detected the expression of CB1receptors in these cells (Fig. 3A). Leptin was able to induce ROS formation in primary neurons (Fig. 3, B and C), and again, this effect was prevented by both ACEA (Fig. 3, B and C) and troglitazone (Fig. 3C) in a manner sensitive, in the case of ACEA, to AM251 (Fig. 3, B and C), and in the case of both compounds by T0070907 (Fig. 3C).
To provide further evidence that the effect of ACEA was due to CB1activation, experiments were performed in mHypoE-N41 cells transfected with CB1 receptor-specific siRNA sequences. These cells showed an⬃50% decrease (measured by Western blot assays) in CB1expression with respect to cells transfected with a scrambled siRNA control (Fig. 4A), which in TABLE 1
mHypoE-N41 cells express PPAR-␥, unlike PPAR-␣, as well as the major enzymes of the endocannabinoid system
Real time quantitative PCR results from mHypoE-N41 cells cultured in standard growth medium to 90% confluence in 24-well plates. Data are expressed as threshold cycle (Ct), and S.D. of reactions performed in triplicate. DAGL-␣, diacylglycerol lipase-␣; NAPE-PLD, N-acylphosphatidylethanolamine-specific phospholipase D.
Genes Ct Pparg 25.67⫾ 0.14 Ppara 35.19⫾ 0.21 Mgl 31.90⫾ 0.28 Dagla 25.66⫾ 0.13 Nape-pld 25.94⫾ 0.03 Cnr1 27.88⫾ 0.11 Cnr2 30.09⫾ 0.90 Faah-1 26.76⫾ 0.09
turn displayed levels of CB1 expression identical to those observed in non-transfected cells (not shown). As shown in Fig. 4B, in CB1siRNA-transfected cells, ACEA failed to prevent lep-tin-induced ROS formation, and this lack of effect was not modified by AM251.
A CB1-mediated Tone of ECs Controls Leptin-induced ROS Formation and Is under the Negative Control of EC Hydrolyzing Enzymes—2-AG is the most abundant EC in the brain (21–23) where it is hydrolyzed primarily by MAGL (24). Pharmacolog-ical or genetic inhibition of MAGL results in an increase of 2-AG levels in the brain (25, 26). To provide evidence for a tonic action of ECs on leptin-induced ROS formation and because mHypoE-N41 cells express only very low levels of MAGL
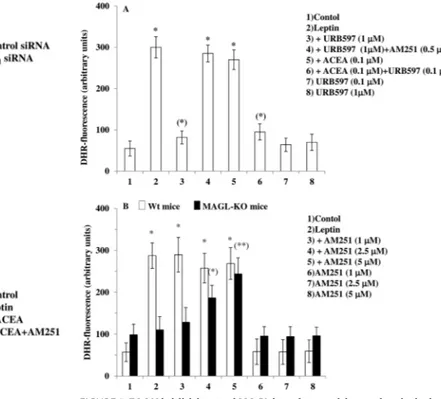
(Table 1), we adopted a dual experimental strategy: 1) to inves-tigate the role of AEA, we treated mHypoE-N41 cells with a selective FAAH-1 inhibitor, URB597, and 2) we performed experiments in primary cultures of hypothalamic neurons iso-lated from wild-type or MAGL null mice; neurons from the former mice were also investigated in the presence of a selective MAGL inhibitor, JZL184. As shown in Fig. 5A, in mHypoE-N41 cells, URB597 (1M) reproduced the effects described above with ACEA in terms of the AM251-sensitive inhibition of lep-tin-induced ROS formation and induced a significant increase of AEA levels (Table 2). Like AEA, ACEA was suggested to be metabolized by FAAH (previously known as anandamide ami-dohydrolase; see Ref. 27). Inhibition of FAAH activity with a low concentration (0.1M) of URB597 rendered a non-effective dose of ACEA (0.1M) effective against leptin-mediated ROS formation. As shown in Fig. 5B, in primary neurons isolated from MAGL null mice, treatment with leptin failed to induce ROS formation. This lack of effect was also observed in primary neuronal cultures from wild-type mice pretreated for 30 min with 1MJZL184 (untreated, 66.86⫾ 21.86; 100 ng/ml leptin, 406.45⫾ 50.36; 100 ng/ml leptin after JZL184, 110 ⫾ 45.63; JZL184 only, 55.38⫾ 18.22; DHR fluorescence is expressed as arbitrary units⫾ S.E.). The lack of effect of leptin in primary neurons from MAGL null mice was most likely due to the increase of basal activation of CB1by high levels of 2-AG in these neurons as compared with wild-type mouse neurons (Table 2). Accordingly, the treatment with increasing concen-FIGURE 1. The CB1receptor agonist ACEA prevents leptin-induced ROS
formation in mHypoE-N41 cells. A, DHR-loaded cells were incubated for
4.5 h with increasing concentrations of leptin. After treatments, the cells were observed with a Leica DMI6000 fluorescence microscope equipped with a Leica DFC320 cooled digital CCD camera (Leica Microsystems). The resulting images were analyzed to quantify the mean fluorescence of individual cells using Metamorph Imaging Software (Leica MetaMorph AF). Representative micrographs of ROS accumulation in cells treated with different concentra-tions of leptin are also shown. Scale bar: 20m. Results are expressed as arbitrary units and represent the means⫾ S.E. calculated from three to five separate experiments, each performed in duplicate. B, the cells, loaded with DHR, were incubated for 30 min with increasing concentrations of ACEA and then treated for an additional 4.5 h with 100 ng/ml leptin. After treatments, the cells were analyzed with a fluorescence microscope as described above. Representative micrographs of the dose-dependent inhibition of ROS forma-tion by ACEA in cells treated with leptin (100 ng/ml) are also shown. Results represent the mean⫾ S.E. of three separate experiments, each performed in duplicate. *, p⬍ 0.01 compared with untreated cells; (*), p ⬍ 0.01 com-pared with leptin-treated cells (one-way ANOVA followed by Bonferroni’s test).
FIGURE 2. A CB1as well as a PPAR-␥ agonist reduces leptin (A)- or H2O2
(B)-induced DHR oxidation in mHypoE-N41 cells. DHR-loaded cells were
incubated with AM251 (0.5M), AM630 (1M), or T0070907 (1M). After 30 min, cells were exposed to ACEA (0.5M) or troglitazone (1M) for an addi-tional 30 min and, finally, treated with leptin (100 ng/ml; 4.5 h) or H2O2(0.1 mM; 4.5 h). In other experiments the cells were incubated with catalase (10 unit/ml; 30 min) or boiled catalase and then treated with leptin (100 ng/ml; 4.5 h). After treatments, the cells were analyzed with a fluorescence micro-scope as described in Fig. 1A. Results represent the mean⫾ S.E. of three separate experiments, each performed in duplicate. *, p⬍ 0.05; **, p ⬍ 0.01 compared with untreated cells; (*), p⬍ 0.05; (**), p ⬍ 0.01 compared with leptin-treated cells (one-way ANOVA followed by Bonferroni’s test).
trations of AM251 restored the leptin-induced ROS formation. These data strongly suggest that ECs may tonically inhibit lep-tin-induced ROS formation, at least in vitro, and that this inhi-bition is under the negative control of EC degrading enzymes.
PPAR-␥ Activation by CB1and Its Impact on Leptin-induced ROS Formation in mHypoE-N41 Cells—To provide additional evidence of the involvement of PPAR-␥ activation in ROS
inhibition by ACEA, we measured PPAR-␥ DNA binding activity in the above experimental conditions. As shown in Fig. 6A, a 4.5-h treatment of mHypoE-N41 cells with leptin (100 ng/ml) resulted in the reduction of PPAR-␥ activity. This response was prevented by preincubation with both ACEA and troglitazone. T0070907 alone resulted in the decrease of PPAR-␥ activity.
FIGURE 3. A CB1as well as a PPAR-␥ agonist decrease leptin-induced ROS levels in primary cultures of hypothalamic ARC neurons. A, immunocyto-chemical staining of the CB1(green signal) receptor in primary culture of hypothalamic neurons. Neuronal-specific nuclear protein (NeuN) antibody (red signal) was used as marker of neuronal cells. B, representative micrographs of ROS accumulation in primary culture of hypothalamic ARC neurons exposed to 100 ng/ml leptin for 4.5 h after a 30-min preincubation with DMSO or 0.5MACEA with or without 0.5MAM251. A representative micrograph of control cells is also shown. C, DHR-loaded cells were incubated with AM251 (0.5M) or T0070907 (1M). After 30 min, cells were exposed to ACEA (0.5M) or troglitazone (1 M) for an additional 30 min and, finally, treated with leptin (100 ng/ml; 4.5 h). After the treatments, the cells were analyzed with a fluorescence microscope as described in Fig. 1A. Results represent the mean⫾ S.E. of three separate experiments, each performed in duplicate. *, p⬍ 0.01 compared with untreated cells; (*), p⬍ 0.01 compared with leptin-treated cells (one-way ANOVA followed by Bonferroni’s test).
The Effect of CB1Activation on Leptin-induced ROS Forma-tion Is Due to PPAR-␥-mediated Catalase Activation—It is well known that PPAR-␥ regulates a large number of enzymes, including catalase, the most important enzyme for antioxidant defense. We, therefore, investigated the effect of leptin on cat-alase activity. As illustrated in Fig. 6B, exposure of cells to 100 ng/ml leptin for 4.5 h resulted in a reduction of catalase activity. Under the same conditions, a pretreatment with ACEA (15 min) as well as troglitazone prevented this effect in a manner sensitive to both AM251 and T0070907, respectively (Fig. 5B). It is important to note that ACEA alone was able to increase catalase activity. Taken together, these results strongly suggest that the mechanism whereby ACEA counteracts leptin-medi-ated ROS formation involves PPAR-␥ activation and subse-quent activation of catalase.
Discussion
The results reported in the present study establish for the first time the existence of a negative control by CB1receptor
activation over an action by leptin, i.e. the capability of the hor-mone to elevate ROS levels in hypothalamic neurons, which is emerging as an important signal mediating leptin anorectic effects. We found that in both mHypoE-N41 cells and primary cultures of hypothalamic ARC neurons, leptin was able to induce ROS formation (Figs. 1–3) and that this effect was blunted by ACEA, a specific CB1receptor agonist, in a manner sensitive to AM251, a CB1receptor antagonist/inverse agonist. The CB1-mediated mechanism of action of ACEA was further confirmed using CB1 siRNA-mediated knockdown in mHy-poE-N41 cells. We also report the mechanism whereby CB1 receptors control leptin action. In fact, it was recently demon-strated that the ROS-mediated anorexic effect of leptin can be counteracted by the induction of peroxisome proliferation mediated by PPAR-␥ activation. The latter effect occurs also in our experimental conditions, as a PPAR-␥ agonist, troglitazone, was able to prevent leptin-mediated ROS formation in both mHypoE-N41 cells and in primary hypothalamic neurons. As expected, the effect of troglitazone was prevented by the pre-treatment with T0070907, a PPAR-␥ antagonist. The observa-FIGURE 4. ACEA fails to prevent leptin-induced ROS formation in
mHy-poE-N41 cells transfected with CB1receptor siRNA. A, Western blot quan-tification of CB1protein levels in cells transfected with scrambled or CB1 siRNAs for 24 h. The blots shown are representative of three separate exper-iments with similar outcomes. B, siRNA-transfected cells were loaded with DHR and then incubated with AM251 (0.5M). After 30 min, cells were exposed to ACEA (0.5M) for an additional 30 min and, finally, treated with leptin (100 ng/ml; 4.5 h). After the treatments, the cells were analyzed with a fluorescence microscope as described above. Results represent the mean⫾ S.E. of three separate experiments, each performed in duplicate. *, p⬍ 0.01 compared with untreated cells (one-way ANOVA followed by Bonferroni’s test).
FIGURE 5. FAAH inhibition and MAGL knock out mitigates leptin-induced
ROS formation. A, a FAAH-1 inhibitor, URB597, prevents the leptin-induced
ROS formation in mHypoE-N41 cells. DHR-loaded cells were incubated for 30 min with AM251 (0.5M), then with URB597 (0.1 or 1M) for an additional 30 min without or with ACEA (0.1M) and, finally, treated with leptin (100 ng/ml; 4.5 h). After treatment, the cells were analyzed with a fluorescence micro-scope as described above. Results represent the mean⫾ S.E. of three separate experiments, each performed in duplicate. *, p⬍ 0.01 compared with untreated cells; (*), p⬍ 0.01 compared with leptin-treated cells (one-way ANOVA followed by the Bonferroni’s test). B, leptin fails to induce ROS forma-tion in primary cultures of hypothalamic neurons isolated from MAGL null mice. Primary neurons isolated from wild-type or MAGL null mice were incu-bated for 30 min with increasing concentration of AM251 and then treated with leptin (100 ng/ml; 4.5 h). After the treatments, the cells were analyzed with a fluorescence microscope as described above. Results represent the mean⫾ S.E. of three separate experiments, each performed in duplicate. *, p⬍ 0.01 compared with WT untreated cells; (*), p ⬍ 0.05, (**), p ⬍ 0.01com-pared to MAGL-KO untreated cells (one-way ANOVA followed by Bonferroni’s test).
tion that T0070907 was able to also prevent the effect of ACEA suggests a possible involvement of PPAR-␥ activation in ACEA inhibition of leptin-mediated ROS stimulation. In further sup-port of this hypothesis, we found that treatment with leptin results in a reduction of PPAR-␥ DNA binding activity and that preincubation with ACEA leads to the prevention of this effect of the hormone. This observation is consistent with the hypoth-esis that the CB1receptor agonist controls leptin action at least
in part through PPAR-␥ activation. This nuclear receptor can directly regulate the expression of a large number of antioxi-dant enzymes, including catalase (9, 28, 29), which is ubiqui-tously expressed in the CNS and is mainly located in peroxi-somes (8). In agreement with the report that PPAR-␥ activation by a specific agonist enhances catalase activity, thereby result-ing in the protection of neurons from oxidative stress (10), we found here that ACEA also prevented the inhibition of catalase induced by leptin in a PPAR-␥-mediated manner.
In agreement with the present findings in neurons, the acti-vation of CB1 receptors was previously shown to lead to over-expression of PPAR-␥ in adipocytes (30, 31). The underlying mechanism of this effect has never been investigated, but it is possible that the well known CB1-induced activation of ERKs might cause phosphorylation of C/EBP (32), a transcription factor that activates PPAR-␥, thus explaining why ACEA enhances PPAR-␥ activity also in hypothalamic neurons, which express C/EBP. Indeed, we have found that the effects of ACEA were inhibited by the MAPK inhibitor PD098059 (data not shown). However, ACEA differs from AEA only in the pres-ence of a chlorine atom on the 2⬘-carbon atom of the ethanol-amine moiety, and it possible that, like AEA (as well as other cannabinoids; for review, see Ref. 33); it also directly activates PPAR-␥.
Importantly, we have also shown that in the cell model mostly used in our experiments, the mHypoE-N41 cells, not only are CB1receptor mRNA and protein-expressed, but also the mRNAs encoding the enzymes responsible for EC biosyn-thesis and hydrolytic inactivation (except for MAGL) are abun-dant. This finding is in keeping with our data indicating that endogenous AEA might exert, under the negative control of FAAH-1, a CB1-mediated inhibitory tone on leptin-induced ROS stimulation in mHypoE-N41 cells and in particular with our finding that a FAAH-1 inhibitor, at a concentration elevat-ing anandamide levels in these cells, also inhibits leptin-in-duced ROS formation. Because we could not perform experi-ments with MAGL inhibitors in these cells, which express hardly measurable amounts of MAGL mRNA, we instead ana-lyzed the capability of leptin to elevate ROS levels in hypotha-lamic neurons from MAGL null mice, which we show to con-tain significantly higher amounts of 2-AG than wild type mice. Again in agreement with the existence of an inhibitory CB1 -mediated tone over leptin action in the hypothalamus by ECs, we found that a concentration of leptin that showed high effi-cacy in cultures from wild-type mice did not produce any effect on ROS in cultures from MAGL⫺/⫺mice and that a CB1 antag-onist could dose-dependently restore this effect of leptin in these cultures. Thus, we propose that pharmacologically or genetically elevated levels of endogenous AEA in mHypoE-N41 cells or endogenous 2-AG in primary cultures of mouse hypo-thalamic neurons, respectively, exert tonic inhibition over lep-tin induction of ROS, indicalep-ting that the findings of the first part of this study might have physiological relevance. In fact, it is tempting to speculate that during physiological or patholog-ical conditions in which hypothalamic EC levels are likewise elevated, i.e. after short term food deprivation (34) or in either genetic or high fat diet-induced obesity (2, 35, 36), a similar negative control over leptin activity by CB1activation might FIGURE 6. Effect of CB1activation on leptin-induced decrease of PPAR-␥
and catalase activity in mHypoE-N41 cells. Cells were incubated with
AM251 (0.5M) or T0070907 (1M). After 30 min, the cell were exposed to ACEA (0.5M) or troglitazone (1M) for an additional 30 min and, finally, treated with leptin (100 ng/ml; 4.5 h). After treatments, the cells were ana-lyzed for both PPAR-␥ (A) and catalase (B) activity as described under “Exper-imental Procedures.” Results represent the mean⫾ S.E. of three separate experiments, each performed in duplicate. *, p⬍ 0.05; **, p ⬍ 0.01 compared with untreated cells; (*), p⬍ 0.01 compared with leptin-treated cells (one-way ANOVA followed by Bonferroni’s test).
TABLE 2
AEA and 2-AG levels in leptin-treated mHypoE-N41cells and in primary hypothalamic neurons
Endogenous levels of AEA and 2-AG were quantified by LC-atmospheric pressure chemical ionization-MS in mHypoE-N41 cells treated with leptin (100 ng/ml) with or without URB597 (1M) or in primary cultures of hypothalamic neurons isolated from C57BL/6 or MAGL null mice. AEA and 2-AG levels are normalized per ml of cell⫹ medium. Each sample contained 1 ⫻ 10⫺5and 0.5⫻ 10⫺5cells/ml for N41 and primary neurons, respectively. Results represent the means⫾ S.E. of three separate experiments and were compared by using ANOVA followed by the Bon-ferroni’s test. AEA 2-AG pmol/ml pmol/ml mHypoE-N41cells Untreated 0.15⫾ 0.05 2.91⫾ 0.55 Leptin 0.20⫾ 0.01 3.13⫾ 0.005 Leptin⫹ URB597 0.89⫾ 0.04a 2.43⫾ 0.31 Primary hypothalamic neurons
Wt Untreated 0.07⫾ 0.01 5.51⫾ 0.26 MAGL⫺/⫺ Untreated 0.04⫾ 0.01 11.23⫾ 0.54* Leptin 0.12⫾ 0.03 11.45⫾ 0.96* a , p⬎ 0.05.
occur. Interestingly, a recent report published during the reviewing process of the present study (37) showed that food deprivation-induced food intake is partly dependent on PPAR-␥-mediated enhancement of agouti-related protein/neuropep-tide Y signaling (which is the major system expressed in mHy-poE-N41 cells), and it is tempting to speculate that such a process might be due in part to CB1 activation by ECs.
In conclusion, the results reported in this study may facilitate a better understanding of the role of ECs and CB1receptors in leptin-mediated effects on food intake and energy storage/ex-penditure as well as other physiopathological functions of this hormone, such as its role in neuroinflammation (38).
Acknowledgment—We are grateful to Roberta Verde for valuable help with endocannabinoid level measurements.
References
1. Jordan, S. D., Könner, A. C., and Brüning, J. C. (2010) Sensing the fuels: glucose and lipid signaling in the CNS controlling energy homeostasis.
Cell. Mol. Life Sci. 67,3255–3273
2. Di Marzo, V., Goparaju, S. K., Wang, L., Liu, J., Bátkai, S., Járai, Z., Fezza, F., Miura, G. I., Palmiter, R. D., Sugiura, T., and Kunos, G. (2001) Leptin-regulated endocannabinoids are involved in maintaining food intake.
Na-ture 410,822– 825
3. Frederich, R. C., Hamann, A., Anderson, S., Löllmann, B., Lowell, B. B., and Flier, J. S. (1995) Leptin levels reflect body lipid content in mice: evidence for diet-induced resistance to leptin action. Nat. Med. 1, 1311–1314 4. Schwartz, M. W., Peskind, E., Raskind, M., Boyko, E. J., and Porte, D., Jr.
(1996) Cerebrospinal fluid leptin levels: relationship to plasma levels and to adiposity in humans. Nat. Med. 2, 589 –593
5. Diano, S., Liu, Z.W., Jeong, J. K., Dietrich, M. O., Ruan, H. B., Kim, E., Suyama, S., Kelly, K., Gyengesi, E., Arbiser, J. L., Belsham, D. D., Sarruf, D. A., Schwartz, M. W., Bennett, A. M., Shanabrough, M., Mobbs, C. V., Yang, X., Gao, X. B., and Horvath, T. L. (2011) Peroxisome proliferation-associated control of reactive oxygen species sets melanocortin tone and feeding in diet-induced obesity. Nat. Med. 17, 1121–1127
6. Holler, N., Zaru, R., Micheau, O., Thome, M., Attinger, A., Valitutti, S., Bodmer, J. L., Schneider, P., Seed, B., and Tschopp, J. (2000) Fas triggers an alternative, caspase-8-independent cell death pathway using the kinase RIP as effector molecule. Nat. Immunol. 1, 489 – 495
7. Matés, J. M., and Sánchez-Jiménez, F. (1999) Antioxidant enzymes and their implications in pathophysiologic processes. Front. Biosci. 4, D339 –D345
8. van Horssen, J., Witte, M. E., Schreibelt, G., and de Vries, H. E. (2011) Radical changes in multiple sclerosis pathogenesis. Biochim. Biophys. Acta
1812,141–150
9. Girnun, G. D., Domann, F. E., Moore, S. A., and Robbins, M. E. (2002) Identification of a functional peroxisome proliferator-activated receptor response element in the rat catalase promoter. Mol. Endocrinol. 16, 2793–2801
10. Gray, E., Ginty, M., Kemp, K., Scolding, N., and Wilkins, A. (2012) The PPAR-␥ agonist pioglitazone protects cortical neurons from inflamma-tory mediators via improvement in peroxisomal function. J.
Neuroinflam-mation 9,63–75
11. Chen, X., Zhang, J., and Chen, C. (2011) Endocannabinoid 2-arachi-donoylglycerol protects neurons against-amyloid insults. Neuroscience
178,159 –168
12. Panikashvili, D., Simeonidou, C., Ben-Shabat, S., Hanus, L., Breuer, A., Mechoulam, R., and Shohami, E. (2001) An endogenous cannabinoid (2-AG) is neuroprotective after brain injury. Nature 413, 527–531 13. Panikashvili, D., Mechoulam, R., Beni, S. M., Alexandrovich, A., and
Sho-hami, E. (2005) CB1cannabinoid receptors are involved in neuroprotec-tion via NF-B inhibineuroprotec-tion. J. Cereb. Blood Flow. Metab. 25, 477–484 14. Panikashvili, D., Shein, N. A., Mechoulam, R., Trembovler, V., Kohen, R.,
Alexandrovich, A., and Shohami, E. (2006) The endocannabinoid 2-AG protects the blood brain barrier after closed head injury and inhibits mRNA expression of proinflammatory cytokines. Neurobiol. Dis. 22, 257–264
15. Zhang, J., and Chen, C. (2008) Endocannabinoid 2-arachidonoylglycerol protects neurons by limiting COX-2 elevation. J. Biol. Chem. 283, 22601–22611
16. Du, H., Chen, X., Zhang, J., and Chen, C. (2011) Inhibition of COX-2 expression by endocannabinoid 2-arachidonoylglycerol is mediated via PPAR-␥. Br. J. Pharmacol. 163, 1533–1549
17. O’Sullivan, S. E. (2007) Cannabinoids go nuclear: evidence for activa-tion of peroxisome proliferator-activated receptors. Br. J. Pharmacol.
152,576 –582
18. Rockwell, C. E., Snider, N. T., Thompson, J. T., Vanden Heuvel, J. P., and Kaminski, N. E. (2006) Interleukin-2 suppression by 2-arachidonyl glyc-erol is mediated through peroxisome proliferator-activated receptor␥ independently of cannabinoid receptors 1 and 2. Mol. Pharmacol. 70, 101–111
19. Igaz, P., Salvi, R., Rey, J. P., Glauser, M., Pralong, F. P., and Gaillard, R. C. (2006) Effects of cytokines on gonadotropin-releasing hormone (GnRH) gene expression in primary hypothalamic neurons and in GnRH neurons immortalized conditionally. Endocrinology 147, 1037–1043
20. Petrosino, S., Schiano Moriello, A., Cerrato, S., Fusco, M., Puigdemont, A., De Petrocellis, L., and Di Marzo V. (2015) The anti-inflammatory media-tor palmitoylethanolamide enhances the levels of 2-arachidonoyl-glycerol and potentiates its actions at transient receptor potential vanilloid type-1 channels. Br. J. Pharmacol. 10.1111/bph.13084
21. Mechoulam, R., Ben-Shabat, S., Hanus, L., Ligumsky, M., Kaminski, N. E., Schatz, A. R., Gopher, A., Almog, S., Martin, B. R., and Compton, D. R. (1995) Identification of an endogenous 2-monoglyceride, present in ca-nine gut, that binds to cannabinoid receptors. Biochem. Pharmacol. 50, 83–90
22. Sugiura, T., Kondo, S., Sukagawa, A., Nakane, S., Shinoda, A., Itoh, K., Yamashita, A., and Waku, K. (1995) 2-Arachidonoylglycerol: a possible endogenous cannabinoid receptor ligand in brain. Biochem. Biophys. Res.
Commun. 215,89 –97
23. Stella, N., Schweitzer, P., and Piomelli, D. (1997) A second endogenous cannabinoid that modulates long-term potentiation. Nature 388, 773–778
24. Blankman, J. L., Simon, G. M., and Cravatt, B. F. (2007) A comprehensive profile of brain enzymes that hydrolyze the endocannabinoid 2-arachi-donoylglycerol. Chem. Biol. 14, 1347–1356
25. Chanda, P. K., Gao, Y., Mark, L., Btesh, J., Strassle, B. W., Lu, P., Piesla, M. J., Zhang, M.-Y., Bingham, B., Uveges, A., Kowal, D., Garbe, D., Koura-nova, E. V., Ring, R. H., Bates, B., Pangalos, M. N., Kennedy, J. D., White-side, G. T., and Samad, T. A. (2010) Monoacylglycerol lipase activity is a critical modulator of the tone and integrity of the endocannabinoid sys-tem. Mol. Pharmacol. 78, 996 –1003
26. Schlosburg, J. E., Blankman, J. L., Long, J. Z., Nomura, D. K., Pan, B., Kinsey, S. G., Nguyen, P. T., Ramesh, D., Booker, L., Burston, J. J., Thomas, E. A., Selley, D. E., Sim-Selley, L. J., Liu, Q. S., Lichtman, A. H., and Cravatt, B. F. (2010) Chronic mono-acylglycerol lipase blockade causes functional antagonism of the endocannabinoid system. Nat. Neurosci.
13,1113–1119
27. Hillard, C. J., Manna, S., Greenberg, M. J., DiCamelli, R., Ross, R. A., Stevenson, L. A., Murphy, V., Pertwee, R. G., and Campbell, W. B. (1999) Synthesis and characterization of potent and selective agonists of the neuronal cannabinoid receptor (CB1). J. Pharmacol. Exp. Ther.
289,1427–1433
28. Ding, G., Fu, M., Qin, Q., Lewis, W., Kim, H. W., Fukai, T., Bacanamwo, M., Chen, Y.E., Schneider, M. D., Mangelsdorf, D. J., Evans, R. M., and Yang, Q. (2007) Cardiac peroxisome proliferator-activated receptor␥ is essential in protecting cardiomyocytes from oxidative damage.
Cardio-vasc. Res. 76,269 –279
29. Chen, T., Jin, X., Crawford, B. H., Cheng, H., Saafir, T. B., Wagner, M. B., Yuan, Z., and Ding, G. (2012) Cardioprotection from oxidative stress in the newborn heart by activation of PPAR␥ is mediated by catalase. Free
30. Matias, I., Gonthier, M. P., Orlando, P., Martiadis, V., De Petrocellis, L., Cervino, C., Petrosino, S., Hoareau, L., Festy, F., Pasquali, R., Roche, R., Maj, M., Pagotto, U., Monteleone, P., and Di Marzo, V. (2006) Regulation, function, and dysregulation of endocannabinoids in models of adipose and -pancreatic cells and in obesity and hyperglycemia. J. Clin. Endocrinol.
Metab. 91,3171–3180
31. Pagano, C., Pilon, C., Calcagno, A., Urbanet, R., Rossato, M., Milan, G., Bianchi, K., Rizzuto, R., Bernante, P., Federspil, G., and Vettor, R. (2007) The endogenous cannabinoid system stimulates glucose uptake in human fat cells via phosphatidylinositol 3-kinase and calcium-dependent mech-anisms. J. Clin. Endocrinol. Metab. 92, 4810 – 4819
32. Park, B. H., Qiang, L., and Farmer, S. R. (2004) Phosphorylation of C/EBP at a consensus extracellular signal-regulated kinase/glycogen synthase ki-nase 3 site is required for the induction of adiponectin gene expression during the differentiation of mouse fibroblasts into adipocytes. Mol. Cell.
Biol. 24,8671– 8680
33. O’Sullivan, S. E., and Kendall, D. A. (2010) Cannabinoid activation of peroxisome proliferator-activated receptors: potential for modulation of inflammatory disease. Immunobiology 215, 611– 616
34. Kirkham, T. C., Williams, C. M., Fezza, F., and Di Marzo, V. (2002)
Endo-cannabinoid levels in rat limbic forebrain and hypothalamus in relation to fasting, feeding and satiation: stimulation of eating by 2-arachidonoyl glycerol. Br. J. Pharmacol. 136, 550 –557
35. Cristino, L., Busetto, G., Imperatore, R., Ferrandino, I., Palomba, L., Silves-tri, C., Petrosino, S., Orlando, P., Bentivoglio, M., Mackie, K., and Di Marzo, V. (2013) Obesity-driven synaptic remodeling affects endocan-nabinoid control of orexinergic neurons. Proc. Natl. Acad. Sci. U.S.A. 110, E2229 –E2238
36. Bisogno, T., Mahadevan, A., Coccurello, R., Chang, J. W., Allarà, M., Chen, Y., Giacovazzo, G., Lichtman, A., Cravatt, B., Moles, A., and Di Marzo, V. (2013) A novel fluorophosphonate inhibitor of the biosynthesis of the endocannabinoid 2-arachidonoylglycerol with potential anti-obesity ef-fects. Br. J. Pharmacol. 169, 784 –793
37. Garretson, J. T., Teubner, B. J., Grove, K. L., Vazdarjanova, A., Ryu, V., and Bartness, T. J. (2015) Peroxisome proliferator-activated receptor␥ con-trols ingestive behavior, agouti-related protein, and neuropeptide Y mRNA in the arcuate hypothalamus. J. Neurosci. 35, 4571– 4581 38. Matarese, G., Carrieri, P.B., Montella, S., De Rosa, V., and La Cava, A.
(2010) Leptin as a metabolic link to multiple sclerosis. Nat. Rev. Neurol. 6, 455– 461