Trade Impacts of Agricultural Support
in the EU
Alan Matthews, Luca Salvatici, and Margherita Scoppola
January 2017
IATRC Commissioned Paper 19
ii
International Agricultural Trade Research Consortium
Commissioned Paper No. 19
Trade Impacts of Agricultural Support in the EU
This Commissioned Paper was co-authored by a working group which responded to a call for
Commissioned Papers from the Executive Committee of the IATRC. The members of the group
were:
Alan Matthews
Trinity College Dublin, Ireland
[email protected]
Luca Salvatici
Roma Tre University, Italy
[email protected]
Margherita Scoppola
University of Macerata, Italy
[email protected]
The views expressed should not be taken to represent those of the institutions to which the
authors are attached, nor to the IATRC and its funding agencies. Correspondence regarding the
content of the paper should be directed to the authors.
The International Agricultural Trade Research Consortium (IATRC) is an organization of
approximately 220 economists from 28 different countries, interested in research, policy
analysis, and current developments in international agricultural trade. It is supported by the
United States Department of Agriculture (ERS, FAS, and OCE), Agriculture and Agri-Food
Canada, and the participating organizations. Funding for this commissioned paper comes from
the USDA Foreign Agricultural Service and Economic Research Service.
iii
Trade Impacts of Agricultural Support in the EU
St. Paul, Minnesota: University of Minnesota, Department of Applied Economics, International
Agricultural Trade Research Consortium
Copies of this paper and other IATRC Publications are available on the website
www.iatrcweb.org
This volume contains information which was presented at an
International Agricultural Trade Research Consortium Annual Meeting,
TRADE IMPACTS OF AGRICULTURAL SUPPORT IN THE EU
Alan Matthews (Trinity College Dublin, Ireland)
Luca Salvatici (Roma Tre University, Italy)
Margherita Scoppola (University of Macerata, Italy)
ABSTRACT
This paper aims at providing an overview of the most relevant trade issues raised by the current agricultural domestic and trade policies of the European Union (EU) and at drawing policy implications for the future of the Common Agriculture Policy (CAP) and for international trade negotiations. The focus of the paper is the period after the 2003 CAP reform which largely decoupled EU direct payments. The paper assesses the trade impacts of the EU policies by: a) analysing the evolution of the policy instruments and of the financial resources under Pillars 1 and 2 of the CAP; b) reviewing the theoretical literature and the empirical tools and evidence on the production and trade impacts of direct payments, market management measures and rural development policies; c) analysing the evolution of the bound, applied and preferential agricultural tariffs and of the tariff rate quotas applied by the EU; d) reviewing the theoretical literature and the empirical tools and evidence on the degree of agricultural protection provided to the EU agricultural sector by the EU multilateral and preferential tariffs, tariff rate quotas and non-tariff measures; and e) discussing the policy implications with a focus on the debate about the future of the CAP.
Paper prepared for the International Agricultural Trade Research Consortium October 2016
1
TABLE OF CONTENTS
List of Figures ... 3 List of Tables ... 4 1. INTRODUCTION ... 5 2. EU AGRICULTURAL POLICY ... 82.1 Historical development of the Common Agricultural Policy ... 8
2.2 Objectives... 11
2.3 Decision-making ... 11
2.4 Financing ... 13
2.5 Direct payments ... 16
2.5.1 Direct payments prior to the 2013 reform ... 16
2.5.2 Direct payments after the 2013 reform ... 17
2.5.3 External and internal convergence ... 18
2.5.4 Basic payment scheme (BPS) ... 20
2.5.5 Flexibility and simplification... 24
2.6 Market management measures ... 25
2.6.1 Intervention measures ... 25
2.6.2 Crisis management ... 28
2.6.3 Strengthening the role of producers in the food value chain ... 29
2.6.4 Promoting food demand ... 30
2.7 Rural development measures ... 31
2.8 Risk management ... 32
2.9 Summary ... 34
3. TRADE IMPLICATIONS OF AGRICULTURAL POLICIES ... 35
3.1 Introduction ... 35
3.2 The changing importance of domestic support ... 36
3.2.1 EU agricultural support in the OECD PSE database ... 36
3.2.2 EU agricultural support notified to the WTO ... 39
3.2.3 The importance of budget transfers in farm income ... 44
3.3 How decoupled are EU direct payments? ... 47
3.3.1 Impact of direct payments on labour use ... 48
3.3.2 Impact of direct payments on land use and abandonment ... 49
3.3.3 Impact of direct payments on investment behaviour ... 51
3.3.4 Impact of direct payments on farm competitiveness ... 52
2
3.4 The capitalisation of EU decoupled payments... 56
3.4.1 Theoretical considerations ... 56
3.4.2 Empirical evidence on capitalisation of EU decoupled payments ... 59
3.5 Measures to restrict production ... 62
3.6 Trade effects of direct payments ... 63
3.7 Trade effects of Pillar 2 payments ... 66
3.8 Trade effects of market intervention measures ... 67
3.9 Trade effects of risk management measures ... 69
3.10 Impact of the 2013 CAP reform on production and trade ... 70
3.11 Summary ... 72
4. TRADE IMPLICATIONS OF AGRICULTURAL TRADE POLICIES ... 73
4.1. Introduction ... 73
4.2 Structure of EU agricultural trade: an overview ... 74
4.3. MFN tariffs ... 77
4.4. EU preferential trade agreements ... 80
4.5 The protective effect of EU tariffs ... 82
4.6 Preferential margins ... 84
4.7 Tariff rate quotas ... 89
4.7.1 Overview of the agricultural MFN TRQs applied by the EU ... 90
4.7.2 TRQs applied within EU Regional Trade Agreements ... 93
4.7.3 Assessing the trade impacts of EU TRQs ... 95
4.8 Export subsidies ... 96
4.9. Non-tariff measures ... 97
4.10 Empirical studies of the impact of EU agricultural support on world markets ... 99
4.11 Agricultural trade implications of trade agreements: the Transatlantic Trade and Investment Partnership ... 103
4.12 Summary ... 105
Annex tables to Chapter 4 ... 106
5. CONCLUSIONS ... 108
3
LIST OF FIGURES
Figure 1. Historical development of the CAP from 1962 ... 9
Figure 2. General and specific objectives of the CAP ... 11
Figure 3. The ordinary legislative procedure ... 13
Figure 4. CAP expenditure (current prices) and the CAP reform path ... 14
Figure 5. New design of CAP direct payments, 2015-2020 ... 18
Figure 6. Changes in the distribution of direct payments across Member States ... 19
Figure 7. The new greening architecture of the CAP ... 21
Figure 8. Choices made by Member States in allocating direct payments, 2015 ... 24
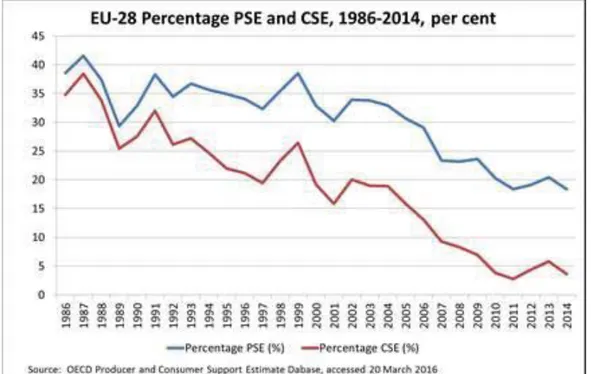
Figure 9. EU-28 Percentage PSE and CSE, 1986-2014, per cent ... 37
Figure 10. EU-28 Evolution of producer support, 1986-2014 ... 37
Figure 11. EU28 Producer NPC by commodity, 2012-2014 ... 38
Figure 12. EU28 Share of PSE transfers by category, 1986-2014 ... 39
Figure 13. EU WTO domestic support notifications ... 41
Figure 14. Importance of public transfers in agricultural factor income (2010-2014 average) ... 45
Figure 15. Composition of EU family farm income over time, 2004-2013 ... 46
Figure 16. Importance of direct payments by farm system in the EU, 2011-2013 ... 46
Figure 17. Distribution of direct payments between beneficiaries in the EU in 2014 ... 47
Figure 18. Utilised agricultural area in the EU (various configurations), 1975-2010 ... 50
Figure 19. The structure of EU agri-food trade ... 76
Figure 20. Top EU agri-food export products. ... 76
Figure 21. Top EU agri-food import products ... 77
Figure 22. Distribution of EU28 imports of agri-food products by import regime, duty-free vs dutiable 2014 ... 83
4
LIST OF TABLES
Table 1. Amounts of voluntary coupled support in 2015 ... 22
Table 2. Intervention products and prices in the EU, 1988/1989 and 2013/2014 ... 25
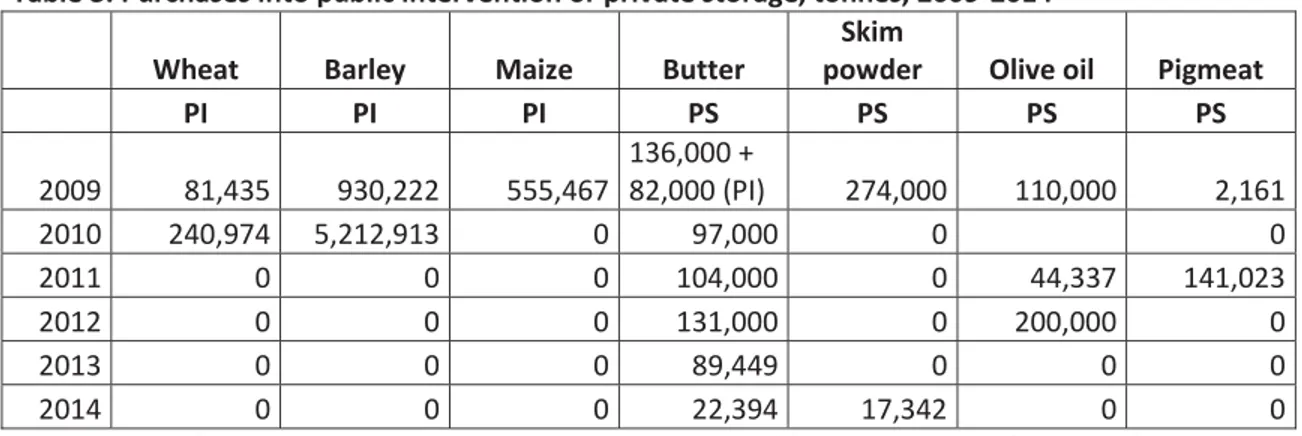
Table 3. Purchases into public intervention or private storage, tonnes, 2009-2014 ... 26
Table 4. CAP expenditure on market management, € million, commitment appropriations, 2005-2015 ... 27
Table 5. CAP Pillar 2 Rural Development Programme projected spending by priority, 2014-2020 ... 32
Table 6. EU-28 public expenditure on risk management and crisis measures (€ million) ... 34
Table 7. Notified EU Green Box expenditure, 2003 and 2012, compared to US notified Green Box expenditure in 2013 ... 43
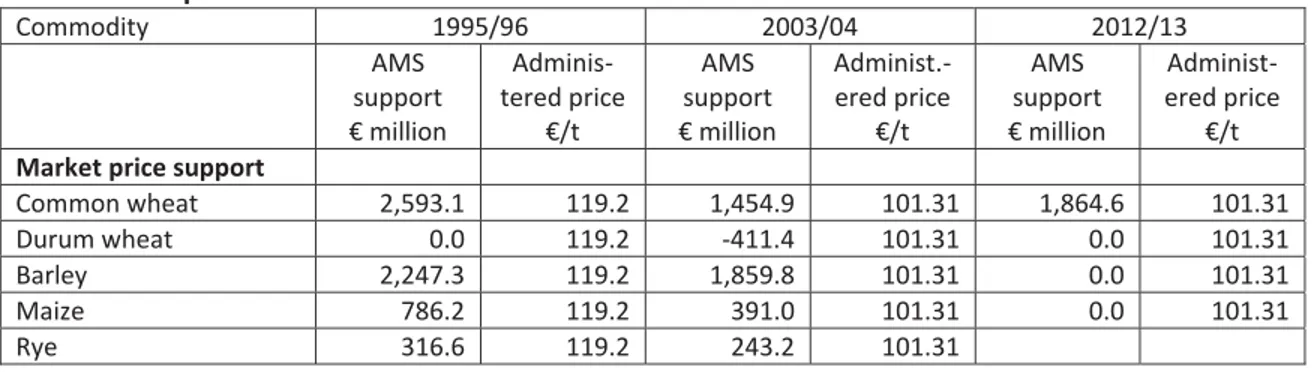
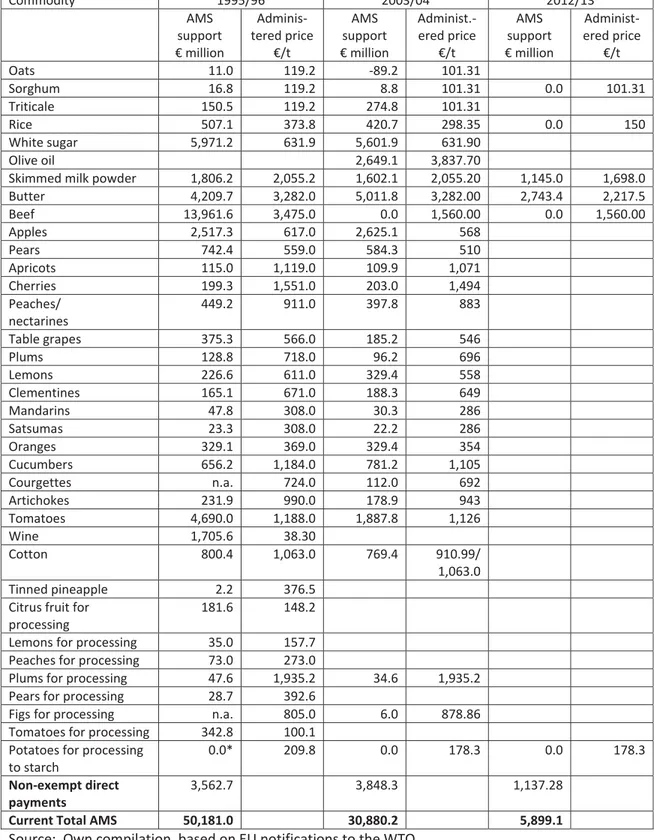
Table 8. Composition of EU Current Total AMS ... 43
Table 9. SPS/BPS implementation by Member State ... 58
Table 10. EU production and price effects of removing domestic support in 2020, per cent... 65
Table 11. Evolution of EAGF intervention expenditure, 2005-2014, € million, commitment appropriations... 68
Table 12. Quantities in public intervention stores. 30 September, ‘000 tonnes ... 68
Table 13. Structure of MFN tariffs (2011 and 2014) ... 78
Table 14. Summary statistics of EU MFN tariffs (2014) ... 79
Table 15.The state of EU preferential trade agreements ... 81
Table 16. The state of EPA negotiations ... 82
Table 17. EU agricultural MTRI with respect to imports from selected countries, by product group . 83 Table 18. MTPI and potential-MTPI ... 85
Table 19. Trade flows according to CES preference margins, preferential status, and shares with respect to total EU imports (2004) ... 87
Table 20. Preference margin impact by sector ... 88
Table 21.Trade effect: results for sectors with significant preference impacts (CES reference tariff) . 88 Table 22.The EU MFN tariff rate quotas (2013) ... 91
Table 23. The methods used by the EU for the allocation of MFN tariff rate quotas (2006) ... 92
Table 24. Tariff rate quotas and entry price system in the EU RTAs in force ... 93
Table 25. Bilateral EU TRQs by product ... 94
Table 26. Summary of estimated effects of NTMs... 99
Table 27. Effect of the CAP on world prices in 2004, per cent change ... 101
Table 28. Impacts of eliminating the CAP in 2015, per cent ... 102
Table 29. CGE-based quantitative analysis of TTIP ... 104
Table 30. TTIP Trade effect: results for sectors with significant preference impact (CES reference tariff) ... 105
Table 31. GTAP database aggregation ... 106
5
1. INTRODUCTION
1The European Union (EU) currently consists of 28 countries, having grown from the six original Member States which created the European Economic Community (EEC) in 1958 (these were Belgium, France, Germany, Italy, Luxembourg and the Netherlands). The first enlargement took place in 1973 with Denmark, Ireland and the UK acceding to the EEC. This was followed by the Mediterranean enlargements in the 1980s (Greece in 1981, Spain and Portugal in 1986). With the end of the Cold War in 1989, the unification of Germany brought East Germany into the Community but without changing the number of countries. This was followed by the accession of Austria, Finland and Sweden in 1995 to what had now become the European Union by virtue of the Treaty of Maastricht in 1993. These fifteen countries are often referred to as the “old” Member States. These were joined by eight Central and Eastern European countries (the Czech Republic, Estonia, Hungary, Latvia, Lithuania, Poland, Slovakia, and Slovenia), plus two Mediterranean countries (Malta and Cyprus) in 2004, by Bulgaria and Romania in 2007 and by Croatia in 2013. The countries which have joined since 2004 are sometimes referred to as the “new” Member States. In June 2016, the British people in a referendum voted in favour of leaving the EU but it will take some years before the arrangements for withdrawal are finalised.
The EU’s Common Agricultural Policy (CAP) has long been a matter of international interest. Producers in third countries – those outside the EU - have viewed agricultural policy in Europe as being a major impediment to the opening up of international trade in farm products. Both domestic policy arrangements and external barriers have contributed to the trade-distorting impacts of EU agricultural support in the past.
However, much has changed in EU agricultural policy over the past two decades. Reform of the CAP began in earnest with the 1992 MacSharry reform undertaken during the Uruguay Round negotiations on agricultural trade liberalisation. The essence of the approach initiated in this reform was to lower administered support prices while compensating farmers through partially-coupled direct payments.2 Another important milestone was the Fischler Mid-Term Review reform of the CAP in 2003 which initiated the gradual transformation of these partially-coupled payments into mostly decoupled direct payments.3 In the most recent reform of the CAP, which was concluded in 2013, a
proportion of these payments to farmers has been earmarked for practices beneficial to the environment and climate action in an attempt to “green” the CAP.
Agricultural support in the EU today has three elements: market management (which is now largely confined to safety net support when prices drop to crisis levels or there is a market disturbance due to a loss of consumer confidence); farm income support (provided through direct payments as well as border protection); and aid to rural development.4 These three functions are structured into two
1
We are very grateful to Lars Brink, Fabrizio de Filippis and three anonymous reviewers for helpful comments on an earlier draft, although responsibility for the final version of the paper remains with the authors.
2
These payments were partially rather than fully coupled because they were linked to the area planted or to animal numbers rather than total output (that is, they were decoupled from yields) and were also subject to production restrictions.
3
According to the European Commission, direct payments now are “mainly granted in the form of a basic income support, decoupled from production…”
(http://ec.europa.eu/agriculture/direct-support/index_en.htm). The extent to which the EU’s direct payments to farmers are fully decoupled from production or not is examined in detail in Chapter 3.
4
In EU agricultural policy terms, rural development has a more limited meaning than promoting the development of rural areas. The latter is an element of EU and Member States’ regional policy encompassing, for example, investment in rural infrastructure, education and health services, rural planning and so on. On the other hand, rural development policy in the EU also includes the wider meaning of support for farming
6
Pillars under the CAP while trade policy issues are covered by the EU’s Common Commercial Policy (CCP).
x CAP Pillar 1 covers the price support interventions and direct payments focused on support for farm income. Pillar 1 direct payments are annual payments which are 100% funded by the EU budget.
x CAP Pillar 2 covers rural development (e.g., improvement in farm structures, agri-environment-climate and land management programmes, off-farm diversification and village renewal). These schemes often involve multi-annual programmes and funding is shared between EU and national budgets.
x Some trade issues (e.g. import licencing rules, imposition of special safeguard duties, the entry price system for fruits and vegetables, management of tariff rate quotas, export subsidies) are covered by CAP regulations, but import protection (the EU’s Common External Tariff (CET), the opening of Tariff Rate Quotas (TRQs)) as well as the conclusion of trade agreements are the responsibility of EU trade policy under the CCP.
Pillar 1 support is now largely in the form of decoupled payments. Various market management instruments such as supply controls have been eliminated (milk quotas in 2015, sugar quotas in 2017, while controls on vineyard areas have been relaxed). Export subsidies are now relegated to a crisis management instrument and have been abolished for some products (e.g. fruits and vegetables).5 Border protection is still high, especially for beef and dairy products, but there are significant “holes” due to preferential agreements with low-income developing countries (mainly of importance for rice, sugar and bananas given the limited export ability of these countries in products protected by the CAP) and an increasing number of free trade agreements with agricultural concessions in the form of tariff rate quotas (i.e. a limited quantity of imports are allowed at zero or low import tariffs, after which the full rate of duty applies). Imports may also be restricted because of sanitary or phytosanitary barriers (e.g. the EU does not accept imports of beef from hormone-treated animals, or poultry washed with chlorine to eliminate pathogens).
The aim of this paper is to provide an up-to-date assessment of the trade impacts of recent and current EU agricultural support policies. To keep the paper manageable, our focus as economists is on describing and evaluating the policies that are in place. There is additional literature, including from other disciplines such as law and political science, which seeks to explain the rationale for these policies, the competing paradigms which influence their evolution and the ways in which the EU has tried to shape the external rules on agricultural support which we treat as given here (Daugbjerg and Swinbank, 2009: McMahon and Cardwell, 2016). As noted, agricultural support policies include both agricultural policy (covered by the EU’s CAP) and trade policy (regulated by the EU’s CCP). We will argue that, as a result of the significant changes in the CAP over the past two decades, its distorting impact on world markets is now much reduced. Overall spending on the CAP has been reduced. Domestic support now largely takes the form of income support payments decoupled from production. Price support guarantees are now limited to a relatively few products at relatively low safety-net levels. In the case of trade policy, we will argue that Most Favoured Nation (MFN) border tariffs on agricultural products remain high and have not changed significantly since the conclusion of the Uruguay Round. However, market access for third-country exporters has been somewhat increased through the increasing number of free trade agreements to which the EU is a
practices which contribute to the production of public goods, particularly with respect to the environment and climate change mitigation and adaptation.
5
Following the WTO Ministerial Decision on Export Competition at Nairobi in December 2015, developed country members including the EU, committed to eliminate their scheduled export subsidy entitlements with immediate effect, with transition arrangements for processed products, dairy products and pigmeat up to 2020.
7
party. Most low-income and all least-developed countries enjoy duty-free access for all their agricultural exports to the EU market under various preferential schemes. Export subsidies are currently not used and will anyway be completely phased out by 2020 under the WTO Ministerial Decision in Nairobi in 2015. However, the EU still spends significant sums on agricultural support, and the future of EU agricultural policy will continue to be a contested issue in the coming years. Chapter 2 of the paper provides an outline description of EU agricultural policies and how they have evolved over time. The intention is to provide sufficient information so that the reader can follow the more detailed assessment of the trade consequences of these policies which follows. Chapter 3 examines the production and trade impacts of EU domestic agricultural policies, including direct payments, market management measures and rural development policies. Chapter 4 gives a detailed description of EU trade policy and evaluates the extent of the trade distortions that result from this instrument. It looks specifically at the role of TRQs in providing both MFN market access as well as market access under the many EU preferential trade agreements (PTAs). Finally, Chapter 5 summarises recent discussions on the state-of-play regarding future reform of the CAP and examines the possible implications for international trade and trade negotiations in the future.
8
2. EU AGRICULTURAL POLICY
2.1
Historical development of the Common Agricultural Policy
The EU’s common agricultural policy (CAP) dates back to 1962 when it was created by the original six Member States of the European Economic Community.6 This policy was based on the objectives set out in the original Treaty of Rome (Article 39):
(a) to increase agricultural productivity by promoting technical progress and by ensuring the rational development of agricultural production and the optimum utilisation of all factors of production, in particular labour;
(b) thus, to ensure a fair standard of living for the agricultural community, in particular by increasing the individual earnings of persons engaged in agriculture;
(c) to stabilise markets;
(d) to provide certainty of supplies;
(e) to ensure that supplies reach consumers at reasonable prices.
The CAP was based on what were described as the three fundamental principles of market unity, financial solidarity and “community preference” defined in 1962. Market unity meant that agricultural products could move freely throughout the EU without tariffs or quantitative restrictions and implied a common level of prices. Financial solidarity meant that the cost of CAP price support policies was to be borne by the EU budget rather than individual Member States. Community preference implied that EU production should be favoured by using border measures to ensure that imported products were always more expensive than the domestic ones.
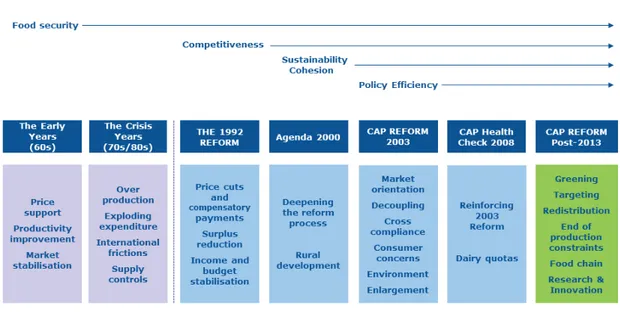
In the first decades of the CAP, public support to agricultural producers was mainly provided via guaranteed prices, border protection and market intervention. Guaranteed prices were set at prices well above world market levels (Matthews 2015a). During the late 1970s and 1980s, this policy led to excessive public stocks, an increase in expenditure and international friction with the EU’s main trading partners. A number of attempts to control expenditure, including the introduction of milk quotas in 1984 and various attempts at budget discipline, failed to provide a long-lasting solution to these issues.
A radical reform of the CAP was adopted under the then-Commissioner for Agriculture Ray MacSharry in 1992. This reduced EU support prices for cereals and beef and compensated farmers for the consequent revenue loss in the form of partially-coupled direct payments. These took the form of area payments for arable crops and headage payments on the number of beef animals and ewes.7 A requirement to set-aside land was made a condition for eligibility for payments for arable farmers above a certain size. Both headage payments and area payments were subject to limits (for example, area and set-aside payments could only be claimed on land that was in an arable rotation in December 1991. Suckler cow and ewe premiums were restricted to the numbers the producer had claimed in a reference period). Area payments were fixed on a regional basis within Member States, reflecting past yields. This reform took place during the GATT negotiations on the Uruguay Agreement on Agriculture and facilitated a successful conclusion to those negotiations.
This change in the support of the agricultural sector was deepened in 1999 in the Agenda 2000 reform, through the introduction of additional price cuts (including dairy products for the first time)
6
See the webpages on the DG AGRI website http://ec.europa.eu/agriculture/cap-history/index_en.htm for a history of the CAP, also Matthews (2015a).
7
9
and an increase in direct payments expenditure. The Agenda 2000 reform was introduced progressively during the period 2000-2002 (see Figure 1 for the timeline of CAP reform) although the dairy product intervention price cuts were delayed until 2005. Another legacy of the Agenda 2000 reform was the division of the architecture of the CAP into two Pillars. Pillar 1 addressed the classical objectives of farm policy such as market management and farm income support, while Pillar 2 gathered together measures to improve agricultural structures, regional assistance to farms in less-favoured areas, agri-environment measures as well as measures to improve the quality of life in rural areas into a new rural development pillar. This division of agricultural policy into two Pillars continues to this day, with the relative importance of Pillar 2 expenditure increasing over time.
Figure 1. Historical development of the CAP from 1962
Source: DG AGRI (2016)
A further far-reaching reform was decided in 2003 and 2004 under Commissioner Franz Fischler, with progressive implementation as from 2005. Several additional sectors were reformed (milk, rice, cereals, durum wheat, dried fodder and nuts), and some fundamental changes concerning direct payments were introduced. In particular, direct payments were largely decoupled from production, even if the possibility existed to keep part of the payments linked to production quantities of specific products. Cross-compliance was made compulsory for the receipt of payments, meaning that farmers had to respect animal and plant health, environmental, food safety and animal welfare standards as well as minimum requirements for ensuring the “good agricultural and environmental condition” of land. Direct payments were extended to farmers in the ten Member States which acceded to the Union in 2004 on a phased basis and using a simplified system. A mechanism of compulsory “modulation” was introduced with a view to strengthening the EU’s rural development policy. It consisted in a reduction of direct payments (by 5% after 2007) with the transfer of the corresponding funds to rural development. Most of these changes started taking effect from 2005 onwards. Reforms to a number of other commodity regimes (sugar, wine, tobacco, cotton, rice, olive oil) during this period also lowered support prices and provided compensation to farmers in the form of increased direct payments. The significance of this reform in introducing the concept of direct payments decoupled from production which still forms the basis of CAP support today should be underlined (Swinnen, 2008).
10
The “Health Check” of the CAP in 2008 under Commissioner Fischer-Boel confirmed the market orientation of the policy and introduced a greater focus on new challenges such as water management, biodiversity and climate change, renewable energy, and innovation concerning these targets. Remaining coupled payments (except for suckler cows, sheep, goats and cotton) were phased out by 2012. However, Member States were given the possibility to couple up to 3.5% of their direct payments to production in the dairy, beef and veal, sheep and goat meat, and rice sectors, in order to help farmers in disadvantaged regions or in environmentally sensitive areas (so-called “Article 68” measures). Twenty-one individual commodity market regulations were collapsed into a single common market organisation regulation. Intervention arrangements were further limited to safety-net levels to be used only in cases of “market disruptions and facilitating farmers' response to market conditions”. Measures to limit supply were deemed obsolete under the new conditions (also in the light of the price spike on world markets at that time) so arable set-aside was eliminated and agreement was reached to abolish milk quotas in 2015 with small increases in quota amounts in the intervening years to facilitate a “soft landing”. The rate of compulsory modulation (transfer) of funds from direct payments to rural development was increased to 10% on larger payment amounts to farmers (“progressive modulation”).
The most recent reform of the CAP took place in 2013 under Commission Dacian Cioloș. This 2013 reform had a long gestation period, beginning with an extensive public debate on the objectives and instruments of EU agricultural policy in 2010 (European Commission, 2010b). The reform took place in parallel with the negotiation of the EU’s multiannual financial framework (MFF) for the period 2014-2020. The MFF is negotiated at regular intervals (usually every seven years) and sets out maximum limits on the yearly amount of money that can be spent in the EU budget as a whole and on various headings within that budget, including the CAP (see Section 2.4 on financing arrangement for further detail).8 The parallel negotiation influenced both the agenda for reform (because of the
need to justify the continued allocation of significant resources to the agricultural budget) and its outcome (Matthews 2015b). The reform proposals in 2011 revolved around greater fairness in the distribution of direct payments, the allocation of a share (30%) of direct payments to a greening component (“greening payment”) to farmers in return for actions in favour of the environment and climate action, more targeted support for young farmers and small farmers, new tools for crisis management, measures to strengthen the position of producers in the food chain, additional investment in research and innovation, and a simpler and more efficient CAP (Swinnen 2015). A hallmark of the reform was the much greater flexibility given to Member States in the way the various CAP measures could be implemented. The 2013 CAP reform established the current regulations governing the EU’s CAP, and the details of these measures are more fully described in later sections of this chapter.9
8
The Mid-Term Review of the 2014-2020 MFF due to take place before the end of 2016 will consider the appropriate length of the MFF to be negotiated for the post-2020 period.
9
The CAP reform package comprised four main legal texts:
–Regulation (EU) No 1307/2013 establishing rules for direct payments to farmers;
– Regulation (EU) No 1308/2013 establishing a common organisation of the markets in agricultural products; – Regulation (EU) No 1305/2013 on support for rural development;
– Regulation (EU) No 1306/2013 on the financing, management and monitoring of the CAP (horizontal regulation).
The package also included a transitional Regulation (EU) No 1310/2013 for the year 2014 to bridge the gap between the existing legal framework and the elements of the reform for which it was decided that they will apply only from 2015 (particularly as regards direct payments and rural development), in order to give Member States sufficient time to roll out the new policy on the ground.
11
2.2
Objectives
The formal objectives of the CAP have not been updated in successive revisions of the EU Treaties, but in practice the CAP has adjusted to respond to different challenges over time. The general and specific objectives set for the period 2014-2020 (and which are used in the monitoring and evaluation of the CAP) are shown in Figure 2.10 The three general objectives are viable food production, sustainable management of natural resources and climate action, and balanced territorial development. These are in turn related to the over-arching strategic objectives for EU policy set out in the Europe 2020 Strategy for smart, sustainable and inclusive growth adopted by the European Council in 2010 (European Commission, 2010a). The specific objectives of the CAP are addressed by both Pillars with some division of labour although also with some overlapping responsibilities.
Figure 2. General and specific objectives of the CAP
Source: DG AGRI (2016)
2.3
Decision-making
Agricultural policy-making in the EU is complex. At the apex is the European Council which consists of the Heads of State and Government of the 28 Member States together with its President and the President of the European Commission. Under the Treaty, the purpose of the European Council is to “provide the Union with the necessary impetus for its development and [to] define the general political directions and priorities thereof”. The European Council does not exercise legislative functions. Importantly, however, it agrees the periodic MFFs which, inter alia, establish the annual
10
12
ceilings on agricultural expenditure within the overall EU budget. The European Council acts by consensus.
Legislative and budgetary authority is exercised jointly by the Council of the European Union (in the case of agricultural policy, this is the Agriculture and Fisheries Council also known as the AGRIFISH Council) and the European Parliament in a process known as “co-decision”.11 Since the Lisbon Treaty came into force in 2009 this procedure also applies to agricultural policy (with a few exceptions).12 The Council of the European Union (not to be confused with the European Council) is made up of one minister from each Member State.13 However, the right of initiative for legislation is given solely to the European Commission which consists of a college of 28 Commissioners drawn from each Member State but which represents the common European interest. This means that any EU decision must first be based on a Commission proposal.14 The Commission also has an executive role in that it manages and implements EU policies and the budget. It has a third role as guardian of the Treaties, meaning that it oversees the application of EU law (for example, if it believes that a Member State is not fully or properly implementing a piece of EU agricultural legislation, it has the power ultimately to take the Member State to the European Court of Justice which can impose sanctions in the form of fines).
The co-decision procedure is based on a three-reading system as shown in Figure 3. Legislation is only adopted when the same text has been agreed by both the Council and the Parliament. Once the Commission makes a proposal, it is considered first by the Parliament (which may adopt amendments) and then the Council (if it accepts the Parliament’s amendments, then the act is adopted). If the positions of the Parliament and Council are different, the legislation proceeds to a second reading. If the differences remain after the second reading, then the act goes to a conciliation committee which operates under a strict timetable. Over time, the importance of informal discussions between the Parliament’s negotiators (usually rapporteurs appointed by the relevant Parliamentary Committee), the Council’s negotiators (represented by the Member State holding the six-month rotating Presidency) and the Commission has grown. As a result of these informal negotiations, known as “trilogues”, the great majority of EU legislation is now adopted on the first reading. The 2013 CAP reform was the first adopted under this co-decision procedure. Decision-making in the EU is a complex system of multi-level governance with different levels of competences conferred on the Union by the Treaties (exclusive, shared and supporting). Agricultural policy is a matter of shared competence. Under shared competence, both the EU and Member States are able to legislate and adopt legally binding acts. However, Member States can only legislate where the EU does not exercise, or has decided not to exercise, its own competence. Whether the EU exercises its competence or not is subject to the principles of proportionality and subsidiarity. Proportionality means that the content and scope of EU action may not go beyond what is necessary to achieve the objectives of the Treaties. Under the principle of subsidiarity, the EU may act only if, and in so far as, the objective of a proposed action cannot be sufficiently achieved by the
11
Formally, this is called the “ordinary legislative procedure” in contrast to the “special legislative procedure” where the Parliament only has a right to be consulted.
12
The Treaty of Lisbon amended both the Treaty of Maastricht (also known as the Treaty on European Union) and the Treaty of Rome (also known as the Treaty establishing the European Community), and also renamed the Treaty of Rome to the Treaty on the Functioning of the European Union. These two treaties form the constitutional basis for the European Union.
13
The convention is that Council is taken to refer to the Council of the European Union whereas reference to the European Council is always spelled out in full, and this convention is followed in this paper. Both of these bodies should be distinguished from the Council of Europe which was founded in 1949 to promote human rights, democracy and the rule of law in Europe and which is completely independent from the EU.
14
The Commission’s annual Work Programme sets out annual priorities and outlines legislative initiatives to be submitted by the Commission in the coming year.
13
Member States but could be better achieved at the EU level. Member State parliaments, by a simple majority, can request that a draft proposal be reconsidered by the Commission if they consider that it does not comply with the subsidiarity principle.
Figure 3. The ordinary legislative procedure
Source: House of Commons (2013).
EU agricultural legislation takes the form of legislative (basic) acts agreed by co-decision. However, important operational aspects are set out in delegated (non-legislative) and implementing acts which are adopted by the Commission. Legislative acts take the form of Regulations (which are directly applicable in Member States and binding in their entirety), Directives (which are binding as to the results to be achieved by the Member States but which leave to them the choice of form and methods), and Decisions (which are binding in their entirety on those addressed, whether an individual Member State, a natural or legal person). Delegated acts adopted by the Commission supplement or amend certain non-essential elements of a legislative act with the objectives, scope, and duration of the delegated powers set out in the basic legislation. Implementing acts are adopted by the Commission when it has the power to do so where uniform conditions for implementing legally binding acts are needed.
2.4
Financing
Spending on EU agricultural policy takes the form of Union expenditure through the EU budget and Member State (national) expenditure (considered as State aids). EU spending on the CAP is governed by a maximum ceiling on annual commitment appropriations established as part of the MFF which is agreed at least every five years and in recent practice every seven years by the European Council by unanimity.15 One ceiling applies to the total budget for the MFF Heading “Preservation and
management of natural resources” which includes both CAP Pillar 1 and Pillar 2 spending. Within this heading, there is a separate sub-ceiling for the item “Market-related expenditure and direct
15
Formally, the MFF Regulation is approved by the Council acting unanimously under a special legislative procedure which requires the consent of the European Parliament through a majority of its members. Recall also footnote 8 which notes that the length of the next MFF period will be decided as part of the Mid-Term Review of the 2014-2020 MFF to be initiated by the Commission before the end of 2016.
14
payments” or spending on Pillar 1 of the CAP. As part of the MFF process, the major share of CAP spending (notably, direct payment envelopes under Pillar 1 and rural development programme envelopes under Pillar 2) is pre-allocated to Member States.
Actual commitment and payment appropriations in any year are decided through the annual budget process which is agreed through co-decision between the Council and Parliament. However, the annual budget must respect the ceilings laid down in the MFF. Because it can be difficult to shift resources from one MFF heading to another (as this requires unanimity among the Member States), unlike in the US the CAP effectively operates under a fixed budget constraint from one MFF period to the next. This has implications for the type of policies (e.g. insurance or counter-cyclical payments) which can be realistically funded from the EU budget.
The severity of the sub-ceiling on Pillar 1 expenditure in the MFF is underlined by the financial
discipline mechanism. The purpose of this mechanism is to ensure that the amount for the financing
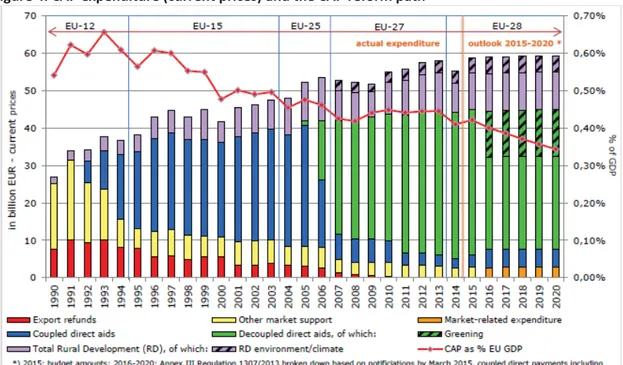
of CAP Pillar 1 expenditure under the MFF sub-ceiling for market-related expenditure and direct payments is not exceeded in any year. If Commission forecasts in any year indicate that expenditure on the measures financed under that sub-ceiling are likely to exceed the amount laid down in the MFF, then the Commission is obliged to limit expenditure on direct payments to prevent this. The CAP still looms large in the overall EU budget, although its share has fallen from 70% in the early 1980s to 40% today, and its share of EU GDP has also been steadily falling (Figure 4). CAP spending is disbursed through two agricultural funds. The European Agricultural Guarantee Fund (EAGF) finances market management measures, direct support to farms and some other minor items (Pillar 1). The European Agricultural Fund for Rural Development (EAFRD) co-finances Member State rural development programmes (Pillar 2). An important distinction between the two Pillars is that (with few minor exceptions) Pillar 1 expenditure is 100% financed from the EU budget, whereas Pillar 2 expenditure on rural development programmes is co-financed with the Member States. That is, unless the Member States put in their share, the money made available in the EU budget cannot be drawn down.
Figure 4. CAP expenditure (current prices) and the CAP reform path
15
The composition of CAP expenditure has changed dramatically reflecting the path of reforms. In the early decades of the CAP, most expenditure consisted of expenditure on market management and export subsidies. This was replaced by expenditure on partially-coupled direct payments following the 1992 reform, and then by decoupled direct payments following the 2003 reform. The share of expenditure on rural development (Pillar 2) has increased and accounts for around 23% of expected expenditure during the period 2014-2020. The decline in expenditure on market management (export refunds and other market support prior to 2015, market-related expenditure after 2015) is particularly noteworthy.
For the MFF 2014-2020 period the Commission initially put forward a proposal to maintain the CAP budget over these years at its 2013 level in nominal terms.16 In the final outcome, the overall size of the MFF (measured in constant prices) was reduced for the first time by the European Council by around 3.5%. The agreed MFF also reduced the budget for CAP Pillar 1 and Pillar 2 (in real terms) from the Commission’s proposal. Comparisons are most easily made by comparing the ceiling on CAP expenditure in 2020 (the end of the 2014-2020 MFF) and 2013 (the end of the previous MFF). For direct payments and market management, the reduction (in real terms) between the two years is 13% and for Pillar 2 rural development expenditure is 18% (European Parliament 2013). However, the final allocation between the two Pillars of the CAP depends on decisions made by Member States. In particular, funds made available by capping and degressivity of Pillar 1 direct payments (see Section 2.5) are transferred to Pillar 2, and Member States also had the flexibility to transfer funds between the two Pillars under specified conditions. The final outcome has been a small net transfer of resources from Pillar 1 to Pillar 2 compared to the MFF decision.
In addition to transfers from the EU budget farmers also receive significant transfers from national
budgets. These take two forms: first, Member State co-financing of CAP Pillar 2 expenditures, plus
some allowed top-ups of Pillar 1 payments in the newer Member States; and second, other state aids paid by Member States to their farmers. In 2014, agricultural state aids reported to the Commission amounted to €7.6 billion.17 Most, but not all, of this reported agricultural state aid represents Member State spending on measures equivalent to rural development measures which would be eligible for funding under Pillar 2 if the national allocations were bigger, but which are funded instead by national exchequers. However, not all national assistance to farmers is reported as state aid to the Commission, e.g. input subsidies and tax rebates.18 For every five euro contributed by the EU budget, national exchequers contribute a further two euro both in co-financing EU expenditure as well as through other state aid expenditure (Matthews 2013). Over the past decade, it appears that national and EU expenditure have moved closely in tandem, but there is some evidence that state aid expenditure is more ”discretionary” and thus more closely aligned to general economic circumstances.
16
Because some items were moved to other headings in the EU financial framework and taking into account a proposed increase in spending on agricultural R&D in the Research heading of the MFF, the then Commissioner for Agriculture and Rural Development argued that the Commission proposal would even maintain the CAP budget constant in real terms over the 2014-2020 period. It is important to note that direct payments to farmers are not index-linked and are fixed in nominal terms, implying a reduction over time in their real value depending on the rate of inflation.
17
Details on state aid expenditure are reported in the State Aid Scorecard which can be found at http://ec.europa.eu/eurostat/tgm_comp/table.do?tab=table&init=1&plugin=1&language=en&pcode=comp_a g_01.
18
The OECD also includes Member State national aid expenditure when estimating producer support for the EU. It estimates the value of fuel tax rebates to EU farmers at €2.7 billion in 2014.
16
This section has reviewed the mechanisms in the EU to provide budgetary support to farmers. Further support can be provided to farmers funded by consumers if prices received by farmers are maintained above world market levels through trade policies or other market management measures. Overall support to EU farmers is reviewed in Chapter 3.
2.5
Direct payments
2.5.1 Direct payments prior to the 2013 reform
Decoupled direct payments (also referred to as direct aids) introduced in the 2003 CAP reform were delivered in the EU15 Member States plus Malta and Slovenia through the Single Payment Scheme (SPS) in the 2005-2014 period.19 A single farm payment (SFP) replaced most of the animal premia and area aids (partially-coupled aid payments to farmers) previously made. The SFP could be implemented in various ways among the Member States. The main difference was whether the SFP was based on the direct payments that individual farmers received in the historical reference period (2002-2004), thus producing a different level of SFP for each farmer (the historical model), or whether all payments were averaged out over a state or region within a state (the regional model). A hybrid model was also implemented in some Members States combining historical references and regionalisation.
To receive direct payments, beneficiaries had to be in possession of payment entitlements. These entitlements were allocated to active farmers during the first year of application of the scheme and could be transferred (by sale or lease) to other farmers in the following years. Possession of an entitlement did not automatically guarantee a payment; a farmer had to “activate” his or her entitlements by declaring an equivalent number of eligible hectares each year in order to claim the single payment.20If payment entitlements were not activated during two years, they reverted to the "national reserve", from which the Member State could allocate them to other farmers in specific situations. Payment recipients also had to observe the cross-compliance obligations on their land. In most of the Member States that joined the EU in 2004, 2007 and 2013, apart from Malta and Slovenia, direct payments were phased in through a transitional system called the Single Area
Payment Scheme (SAPS), which corresponds to a flat rate area-based payment. The level of EU
direct payments in those Member States was progressively increased from 25% of the EU-15 level in the 2005 financial year to 100% in the 2014 financial year (2017 for Bulgaria and Romania and 2023 for Croatia). In order to increase the overall direct support level above the phasing-in level, those Member States had the possibility to apply a Complementary National Direct Payment.21
19
Although the SPS came into operation on 1 January 2005, Member States could delay implementation up to 2007. The terminology “old Member States” refers to the EU-15 while “new” Member States refers to the ten countries that acceded to the EU in 2004, Bulgaria and Romania which acceded in 2007, and Croatia which acceded in 2013.
20
Eligible land means the agricultural area of a holding used wholly or mainly for an agricultural activity. Agricultural activity is defined in the 2013 direct payments regulation as the production, rearing or growing of agricultural products, but it can also be maintaining an agricultural area in a state which makes it suitable for grazing or cultivation without preparatory action beyond usual agricultural methods, or in cases where an agricultural area is naturally kept in a state suitable for grazing or cultivation, carrying out a minimum activity which is defined by the Member State.
21
Thus, in principle, the EU had two parallel systems of direct payments during the period 2005-2015; the SPS (based on the decoupled SFP) in the EU15 Member States plus Malta and Slovenia, and the SAPS in the other new Member States. For clarity, we will often refer to the scheme in the old Member States as the SFP scheme.
17
Full decoupling was the general principle from 2005 onwards. However, Member States could decide to maintain a portion of direct aids to farmers in their previously partially-coupled form, at national or regional level. For example, Member States could retain up to 25% of the amounts paid to cereals and other arable crops and up to 40% of the funds available for supplementary durum wheat aid as partially-coupled payments. Up to 50% of the previous sheep and goat premia and up to 100% of the suckler cow premium could continue to be paid as partially-coupled payments, under well-defined conditions. As previously noted, these derogations except for beef, sheep and goat payments were later phased out under the 2008 Health Check.22
The 2003 reform allowed Member States to retain up to 10% of their previously coupled payment ceilings under Pillar 1 for specific supports to farming and quality production (Article 69 of Council Regulation (EC) No. 1782/2003). The additional payment had to be granted for specific types of farming which were important for the protection or enhancement of the environment or for improving the quality and marketing of agricultural products. In the 2008 Health Check, Article 69 (now renumbered as Article 68 of Regulation 73/2009) expanded the scope of national envelopes while keeping the overall 10% share of each Member State’s direct payments ceiling. Member States could continue to use these payments for environmental measures or improving the quality and marketing of products or animal welfare (although the money no longer had to be used in the same sector). In addition, the national envelope could be used to help farmers producing milk, beef, goat and sheep meat and rice in disadvantaged regions, to support economically vulnerable types of farming, or to top up entitlements in areas where land abandonment was a threat. The permitted uses were also extended to support for risk management measures such as contributions to crop and animal insurance premia and mutual funds for plant and animal diseases. In order to comply with WTO Green Box conditions, support for potential trade-distorting measures under Article 68 was limited to 3.5% of national ceilings. This included support for types of farming important for the protection of the environment, support to address specific disadvantages, and support for mutual funds.
2.5.2 Direct payments after the 2013 reform
In the 2013 reform implemented from 2015, the SPS has been replaced by the Basic Payment Scheme (BPS), a green payment top-up and various targeted measures for young farmers, small farmers, farmers in areas of natural constraints and coupled payments.23 Some of these measures are voluntary for Member States, while others are mandatory (Figure 5). The SAPS scheme was extended to 2020 for those Member States that wished to continue to use it.
22
Cotton coupled payments are treated differently as in some MS (Bulgaria, Greece, Spain, Portugal) a crop specific payment for cotton is compulsory; the obligation derives from 1979 Act of Accession of Greece.
23
The direct payments in the post-2013 CAP is based on the basic act Regulation (EU) No. 1307/2013, the delegated act is Regulation (EU) No. 639/2014 and the implementing act is Regulation (EU) No. 641/2014.
18
Figure 5. New design of CAP direct payments, 2015-2020
Source: DG AGRI (2013)
2.5.3 External and internal convergence
One of the reasons why the 2003 reform was successfully adopted was that it did not affect the distribution of Pillar 1 expenditure among Member States. The envelope of direct payments for each of the old Member States was based on their historic receipts in the reference period. For the new Member States, the envelope of direct payments was that negotiated in their Treaties of Accession. One consequence of these decisions was that the level of payments per eligible hectare differed significantly across the Member States.
Commissioner Fischler, in his original presentation of the 2003 reform, had also proposed that the decoupled payment would be paid on historical references in order to avoid any redistribution of payments among farmers (European Commission 2003). However, some Member States were keen on the idea of a flat-rate uniform per hectare payment and this became the default option for the older Member States in the reform. However, most Member States opted for either the historical (or hybrid) models which meant that the level of payments to individual farmers in these Member States was not affected by the reform; the payments were simply converted from partially coupled to decoupled payments which benefited farmers by giving them greater freedom in making their production decisions.
By the time of the 2013 reform, the anomalies in payments both among and within Member States could not be overlooked. In the old Member States, direct payments had been introduced to compensate for reductions in support prices. Thus they reflected arbitrary differences in the product orientation and productivity between Member States during the historic reference period. The new Member States were aggrieved that their average payment per hectare (arising from the direct payment envelopes negotiated on accession) were significantly lower than payments in the old
19
Member States. Similarly, it became increasingly hard to justify the very substantial differences in payments per hectare between farmers within those Member States that had opted for the historic or hybrid payment models. Thus, the first objective of the 2013 reform was to address these perceived fairness issues under the headings of external and internal convergence.
External convergence referred to adjustments in the national envelopes for direct payments to ensure a more equal distribution of direct support per hectare between Member States while taking account of the differences that still exist in wage levels and input costs. A move to equal payments per eligible hectare across the Union was initially considered, but this did not gain favour. Instead, a partial convergence model was adopted. Member States that had direct payments per hectare below 90% of the Union average should close one third of the gap between their current level and this 90% level, with all Member States arriving at a minimum level by financial year 2020, representing roughly 75% of the Union average (Figure 6). This was the first time that a CAP reform had explicitly shifted resources among the Member States.
Figure 6. Changes in the distribution of direct payments across Member States
Source: DG AGRI (2013).
Internal convergence referred to the removal of differences in payments per hectare between farmers within a Member State or region that could not be justified on objective grounds. The Commission had again proposed that payments should be based on the regional model and equalised within regions, where a region could be defined in accordance with objective and non-discriminatory criteria such as institutional or administrative structure and regional agricultural potential. The final legislation introduced some additional flexibility, allowing Member States to choose from three different options:
x To apply a regional/national flat rate from calendar year 2015 as proposed by the Commission;
20 x To achieve a regional/national flat rate by 2019;
x A partial convergence model based on the external convergence formula which would ensure that those farms getting less than 90% (or a percentage fixed by the Member State between 90% and 100%) of the regional/national average rate would see a gradual increase – with the additional guarantee that every farmer reaches a minimum payment of 60% of the regional/national average by 2019. The payment entitlements that have an initial unit value lower than 90% (100%) of the average should be increased, by 2019, by at least one third of the difference between the initial unit value and the 90% (or 100%) of the final convergence value. The amounts available to farmers receiving more than the regional/national average are adjusted, with an option for Member States to limit any “losses” to 30% of the initial unit value.24
2.5.4 Basic payment scheme (BPS)25
Allocation of entitlements. The basic payment in the old Member States (plus Malta and Slovenia)
remains an income support payment allocated according to the model of internal convergence adopted by the respective Member State. Payments continue to be allocated on the basis of entitlements although the distribution of entitlements was updated according to complicated rules.26 The effect of the updating has been to broaden the base of farmers who can receive entitlements by including those who were previously not eligible. Member States were required to establish a national reserve of up to 3% of their basic payment scheme ceiling to make provision for new entrants and other eligible farmers. Those Member States applying the SAPS – which does not involve entitlements - could extend the use of this system until 2020 and all have opted to do so.
The green payment. In addition to the BPS/SAPS payment, each holding receives a payment per
hectare for respecting certain agricultural practices beneficial for the climate and the environment (Member States are required to use 30% of their national envelope for this purpose). This is a compulsory requirement for farmers in receipt of direct payments. Failure to respect the greening requirements will result in penalties (i.e. a farmer could lose all his or her greening payment and also face a penalty of up to 25% of the amount he or she claimed for greening).27 The green payment sits
on top of cross-compliance which includes the basic compulsory layer of environmental requirements and obligations. Further, more ambitious, environmental management options can be supported through voluntary agri-environment schemes financed through Pillar 2 rural development schemes (Figure 7).
24
Two alternative mechanisms to calculate the initial unit value were provided in the direct payments regulation with the intention that it should be equivalent to a farmer’s total SFP in 2014 divided by his or her allocation of payment entitlements in 2015, adjusted by the national or regional share of the basic payment ceiling to the total amount of the SFP paid in the Member State or region in 2014. See Article 26 of Regulation (EU) No 1307/2013.
25
For a useful summary, see DG AGRI (2015) or Henke et al. (2015).
26
Member States should allocate new entitlements based on the eligible agricultural area in the first year of reform implementation (i.e. in 2015) to farms which were eligible for direct payments in 2013. The number of allocated entitlements could be limited to the minimum of either the eligible area in 2013 or the declared eligible area in 2015. By derogation, some Member States respecting certain conditions could keep the previous system of payment entitlements. In this case, a Member State could impose the additional restriction that the number of entitlements does not exceed the eligible area in 2015. Member States could also choose to allocate fewer entitlements for certain types of permanent grassland (using a reduction coefficient) or to exclude land cultivated with vineyards and greenhouses from receiving entitlements and being eligible for decoupled payments.
27
The penalty was phased in. A penalty of up to 20% of what a farmer claimed for greening could be applied in 2017 and up to 25% from 2018 onwards.
21
The three basic practices required are maintaining permanent grassland, crop diversification and
maintaining an “ecological focus area” of at least 5% of the arable area of the holding for farms
with an area larger than 15 hectares. These practices are meant to be simple, generalised, non-contractual and annual. They should also go beyond the statutory rules linked to environmental rules under cross-compliance (statutory management requirements and standards for good agricultural and environmental condition of land). The legislation foresees a "greening equivalency" system for the recognition of environmentally beneficial practices already in place, although few Member States have made use of this option.
Figure 7. The new greening architecture of the CAP
Source: DG AGRI (2013).
Young Farmers. In order to encourage generational renewal, the Basic Payment awarded to new
entrant Young Farmers (those 40 or below) should be topped up by an additional 25% for the first 5 years of installation. This is funded by up to 2% of the national envelope and is compulsory for all Member States. This top-up is in addition to other measures available for young farmers under Rural Development Programmes.
Areas with Natural Constraints (ANCs). Member States (or regions) may grant an additional
payment for areas with natural constraints (as defined under Rural Development rules) of up to 5% of their national envelope. This is optional and does not affect the ANC options available under Pillar 2 rural development programmes. However, only one Member State opted to make use of this measure.
Voluntary coupled support. The 2013 CAP reform altered the framework for coupled payments.
Because Article 68 specific supports (see above) were abolished, some replacement had to be found. The new framework has the following characteristics (Title IV of Regulation (EU) No 1307/2013): • The list of sectors eligible for coupled support payments is greatly expanded (cereals, oilseeds, protein crops, grain legumes, flax, hemp, rice, nuts, starch potato, milk and milk products, seeds, sheepmeat and goatmeat, beef and veal, olive oil, silkworms, dried fodder, hops, sugar beet, cane and chicory, fruit and vegetables and short rotation coppice).
22
• Total support should be limited to 8% of each Member State’s direct payments ceiling, or exceptionally 13% in those countries applying the SAPS scheme, or where Member States had used more than 5% of their direct payments ceiling in any year during 2010-2014 for coupled payments including Article 68 payments. These percentages could be increased by up to 2 percentage points if this support was used for protein crops. A further derogation allowed Member States which used more than 10% of their national ceilings for coupled payments including Article 68 payments in any year between 2010 and 2014 to be permitted to use more than 13% of their national ceiling for coupled payments “upon approval by the Commission”.
• Member States had to notify their decisions to the Commission by 1 August 2014. However, they can revise their decisions with effect from 2017, increasing, decreasing or ceasing the amount of coupled support they provide within the relevant limits.
All voluntary coupled payments within these ceilings should comply with a number of conditions, as follows:
• Coupled support may only be granted to those sectors or to those regions of a Member State where specific types of farming or specific agricultural sectors that are particularly important for economic, social or environmental reasons undergo certain difficulties.
• Coupled support may only be granted to the extent necessary to create an incentive to maintain current levels of production in the sectors or regions concerned.
• Coupled support shall take the form of an annual payment and shall be granted within defined quantitative limits and be based on fixed areas and yields or on a fixed number of animals. This is intended to ensure that future coupled payments would qualify as Blue Box payments under the WTO Agreement on Agriculture disciplines on domestic support.
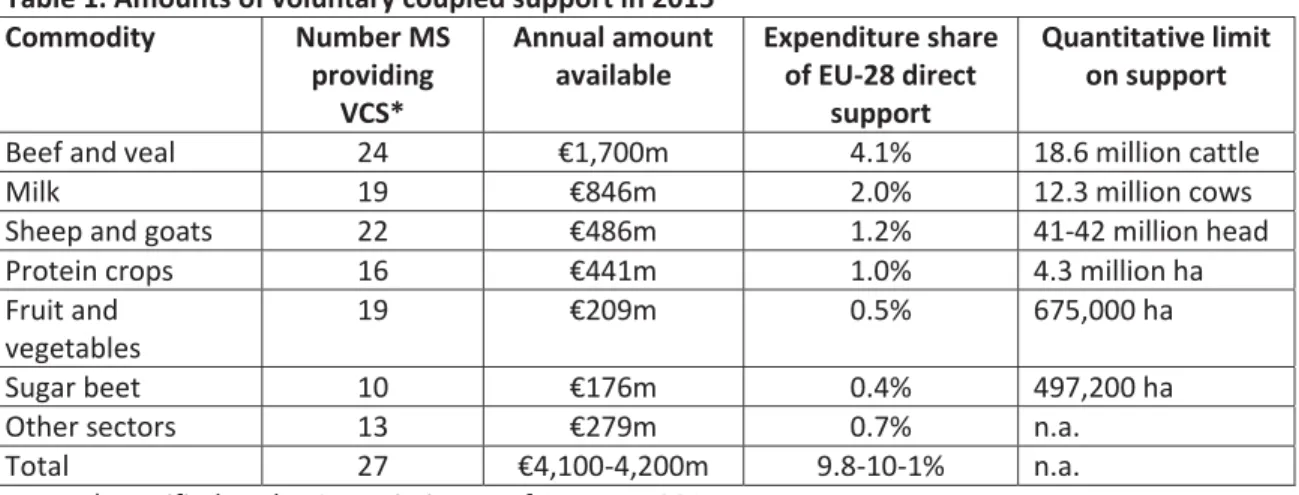
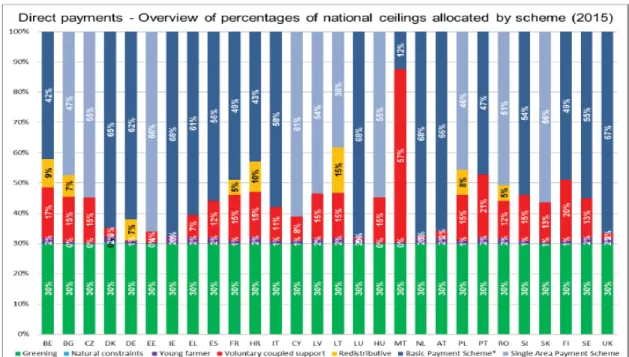
The use of this voluntary option by Member States shows a very varied pattern. Nine Member States opted to use less than the standard 8% ceiling while eleven Member States have the maximum percentage of 13% with 9 of these also using all or part of the additional 2% available in case of support to the protein crops sector. Three old Member States (Belgium, Portugal and Finland) were given permission to exceed the 13% limit. Germany has maintained its position that it does not give coupled support and is the only Member State not to provide coupled support in 2015. In total, around 10% of direct payments are now coupled (excluding cotton payments) which is a small increase compared to the end of the Health Check period. Beef and dairy are the most supported sectors, with smaller amounts going to other sectors such as sheep and goats, protein crops and fruit and vegetables (Table 1).
Table 1. Amounts of voluntary coupled support in 2015 Commodity Number MS providing VCS* Annual amount available Expenditure share of EU-28 direct support Quantitative limit on support
Beef and veal 24 €1,700m 4.1% 18.6 million cattle
Milk 19 €846m 2.0% 12.3 million cows
Sheep and goats 22 €486m 1.2% 41-42 million head
Protein crops 16 €441m 1.0% 4.3 million ha
Fruit and vegetables
19 €209m 0.5% 675,000 ha
Sugar beet 10 €176m 0.4% 497,200 ha
Other sectors 13 €279m 0.7% n.a.
Total 27 €4,100-4,200m 9.8-10-1% n.a.
Note: * Notified to the Commission as of 1 August 2014