10.1128/JB.184.5.1304-1313.2002.
2002, 184(5):1304. DOI:
J. Bacteriol.
M. Farfán, D. Miñana-Galbis, M. C. Fusté and J. G. Lorén
Nucleotide Sequence Analysis
O139 Bengal Based on
Vibrio cholerae
http://jb.asm.org/content/184/5/1304
Updated information and services can be found at:
These include:
REFERENCES
http://jb.asm.org/content/184/5/1304#ref-list-1
at:
This article cites 43 articles, 27 of which can be accessed free
CONTENT ALERTS
more»
articles cite this article),
Receive: RSS Feeds, eTOCs, free email alerts (when new
http://journals.asm.org/site/misc/reprints.xhtml
Information about commercial reprint orders:
http://journals.asm.org/site/subscriptions/
To subscribe to to another ASM Journal go to:
on March 13, 2013 by 76503666
http://jb.asm.org/
JOURNAL OFBACTERIOLOGY, Mar. 2002, p. 1304–1313 Vol. 184, No. 5 0021-9193/02/$04.00⫹0 DOI: 10.1128/JB.184.5.1304–1313.2002
Copyright © 2002, American Society for Microbiology. All Rights Reserved.
Allelic Diversity and Population Structure in Vibrio cholerae O139
Bengal Based on Nucleotide Sequence Analysis
M. Farfán, D. Miñana-Galbis, M. C. Fusté, and J. G. Lorén*
Departament de Microbiologia i Parasitologia Sanitàries, Divisió de Ciències de la Salut, Universitat de Barcelona, E-08028 Barcelona, Spain
Received 12 July 2001/Accepted 28 November 2001
Comparative analysis of gene fragments of six housekeeping loci, distributed around the two chromosomes of Vibrio cholerae, has been carried out for a collection of 29 V. cholerae O139 Bengal strains isolated from India during the first epidemic period (1992 to 1993). A toxigenic O1 ElTor strain from the seventh pandemic and an environmental non-O1/non-O139 strain were also included in this study. All loci studied were polymorphic, with a small number of polymorphic sites in the sequenced fragments. The genetic diversity determined for our O139 population is concordant with a previous multilocus enzyme electrophoresis study in which we analyzed the same V. cholerae O139 strains. In both studies we have found a higher genetic diversity than reported previously in other molecular studies. The results of the present work showed that O139 strains clustered in several lineages of the dendrogram generated from the matrix of allelic mismatches between the different genotypes, a finding which does not support the hypothesis previously reported that the O139 serogroup is a unique clone. The statistical analysis performed in the V. cholerae O139 isolates suggested a clonal population structure. Moreover, the application of the Sawyer’s test and split decomposition to detect intragenic recom-bination in the sequenced gene fragments did not indicate the existence of recomrecom-bination in our O139 population.
Vibrio cholerae is an indigenous inhabitant of the aquatic environment, where it is usually found as a commensal of zooplankton (3, 9). These bacteria are characterized by sero-typing on the basis of epitopic variation in the cell surface lipopolysaccharide. Of the nearly 200 recognized serogroups of V. cholerae only two, O1 and O139, have been associated with cholera epidemics by ingestion of contaminated water or food. The other serogroups, the non-O1/non-O139 strains, are fre-quently isolated from environmental sources and have been associated with sporadic gastrointestinal diseases and extraint-estinal infections (6).
In the human host the pathogenesis of V. cholerae involves the coordinated expression of a number of virulence factors, including cholera toxin (CT), which is directly responsible for the symptoms of the disease. The ctxAB operon, which encodes the A and B subunits of CT, is part of the genome of a lysogenic filamentous bacteriophage (CTX⌽). The receptor for CTX⌽, the toxin-coregulated pilus, is encoded by a larger genetic element, the toxin-coregulated pilus pathogenicity is-land, which is acquired by horizontal transfer (45).
Before 1992, only V. cholerae O1 was known to cause cholera epidemics. However, in September 1992 a severe cholera out-break caused by a non-O1 strain, identified as serogroup O139, occurred in the Bay of Bengal. Several studies have shown that V. cholerae O139 is closely related to O1 ElTor, which is re-sponsible for the seventh pandemic. According to several au-thors, O139 isolates have derived from a seventh-pandemic clone by horizontal gene transfer (5). This new serogroup
rapidly spread through India and neighboring countries of Southeast Asia (1, 35). At first this new serogroup displaced the existing O1 strains in India and Bangladesh; however, a new clone of V. cholerae O1 biotype ElTor replaced the O139 vibrios during 1994 and 1995 (12). In 1996 a reemergence of V. cholerae O139 was reported in Calcutta, and this was the dom-inant serogroup until 1997. At present, this strain is still con-fined to Southeast Asia, and only imported cases have been detected in other countries across the globe. The seventh pan-demic is still occurring throughout the world, and the number of countries affected continues to increase, especially in Africa (46). The transient disappearance and reemergence of the O139 vibrios have raised questions regarding the origin of the O139 strains and the clonal diversity among strains belonging to this serogroup (13).
Cholera outbreaks have recently been associated with cli-matic changes (29). The increment in cholera cases in recent years in Central and Southern Africa could be related to the phenomenon of El Niño. These changes marked the beginning of a series of concatenated events such as the increase of water temperature, nutrient concentration, and plankton growth that would multiply the number of cholera cases (24).
Population studies of V. cholerae based on the multilocus enzyme electrophoresis method (MLEE), considered that the O139 strains isolated during the first period (1992 to 1993) were a unique clone (4, 34). However, the application of mo-lecular methods such as restriction fragment lenght polymor-phism (RFLP), pulsed-field gel electrophoresis (PFGE), DNA sequencing, and amplified fragment length polymorphism (AFLP) (8, 13, 21, 23) have shown clonal diversity among O139 isolates and have revealed the existence of different ribotypes. More recently, comparative studies of O139 strains isolated in the two dominant time periods have shown that, although the
* Corresponding author. Mailing address: Departament de Micro-biologia i Parasitologia Sanitàries, Facultat de Farmàcia, Avda. Joan XXIII s/n, E-08028 Barcelona, Spain. Phone: 402-44-97. Fax: 34-93-402-44-98. E-mail: [email protected].
1304
on March 13, 2013 by 76503666
http://jb.asm.org/
reemerging strains of V. cholerae O139 (from 1996 to 1997) had biochemical traits identical to those isolated during the first period, their molecular characterization differed in the organization and number of the CTX element and in ribotype (2, 13, 14, 30).
Farfán et al. (11) applied the MLEE technique to study a collection of V. cholerae isolates from several countries and sources to determine the genetic relationships between patho-genic clones (O1 and O139) and environmental isolates. After analyzing the electrophoretic mobility of 15 housekeeping en-zyme loci, the results showed considerable diversity within the O139 serogroup. To confirm the distinct clonal lineages among a set of O139 strains, we have developed a comparative nucle-otide sequence analysis based on a scheme of the Multilocus Sequence Typing (MLST) method (25). This technique is an extension of MLEE in which the alleles at each housekeeping locus are assigned according to nucleotide changes detected by sequencing rather than the differences in the electrophoretic mobility of their gene products. We sequenced internal frag-ments of the DNA (⬃480 bp) of six housekeeping genes for 29 V. cholerae O139 strains isolated during the first period. A toxigenic O1 ElTor strain of the seventh pandemic and an environmental non-O1/non-O139 strain were also included. Our results revealed the existence of four distinct sequence types (STs) within the O139 population studied, thereby show-ing the different origins of this serogroup of V. cholerae.
MATERIALS AND METHODS
Bacterial isolates and DNA preparation.A total of 31 V. cholerae strains were analyzed (Table 1). Twenty-nine strains belonging to the O139 serogroup were isolated in India during the first period (1992 to 1993). An environmental non-O1/non-O139 strain (isolate 25872) and a clinical O1 ElTor strain (CO487) from India were also included in this study. Isolates were stored at⫺40°C in Trypti-case soy broth (Panreac Quı´mica, S.A.) containing 20% of glycerol until use. Chromosomic DNA was prepared for all isolates as follows. A single colony was picked from a subculture onto nutrient agar and resuspended in 30l of sterile Milli-Q water. Samples were boiled for 10 min and, after centrifugation, super-natants were used as templates for the PCR.
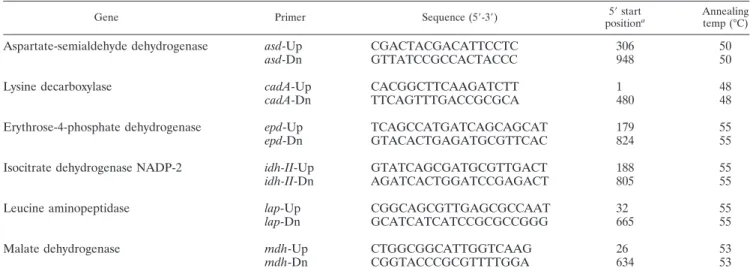
PCR amplification and DNA sequencing.The nucleotide sequences of internal fragments of the following six housekeeping genes were obtained: asd (aspartate-semialdehyde dehydrogenase), cadA (lysine decarboxylase), epd (erythrose-4-phosphate dehydrogenase), idh-II (isocitrate dehydrogenase NADP-2), lap (leucine aminopeptidase), and mdh (malate dehydrogenase). Primers were de-signed by using highly conserved DNA regions of these genes for V. cholerae obtained from the GenBank database (http://www.ncbi.nlm.nih.gov), with the exception of the asd and lap, for which we used primers previously described by Karaolis et al. (21) and C. Toma and Y. Honma (44), respectively. Each primer pair amplified an internal fragment of the housekeeping gene (ca. 500 to 600 bp) and allowed accurate sequencing of⬃480-bp fragments of each gene on both strands.
Gene fragments were amplified from chromosomal DNA of the 31 V. cholerae strains. PCR was performed in a 50-l reaction mixture by using the following program: an initial denaturation step at 94°C for 5 min and then 35 cycles of denaturation (94°C for 45 s), annealing (48 to 55°C for 1 min), and extension (72°C for 1.30 min), followed by a final extension step at 72°C for 10 min. Amplification was carried out on a 2400 Gene Amp PCR Systems Thermal Cycler (Perkin-Elmer Corp., Norwalk, Conn.). PCR products were resolved by electrophoresis on 1% agarose gels made with 1⫻ TBE (10⫻ TBE consisting of 0.90 M Tris, 0.90 boric acid, and 20 mM EDTA) and containing ethidium TABLE 1. Properties of V. cholerae isolates analyzed and their allele profiles at each locus
ST no. Reference isolate Allele no. Serogroup or biotype Source Country of origin Yr of isolation
asd cadA epd idh-II lap mdh
1 CO418 1 1 1 1 1 1 O139 Fecal India 1992–1993 1 BO4 1 1 1 1 1 1 O139 Fecal India 1992–1993 1 NT638 1 1 1 1 1 1 O139 Clinical India 1992–1993 1 MOD084 1 1 1 1 1 1 O139 Clinical India 1992–1993 1 CO415 1 1 1 1 1 1 O139 Fecal India 1992–1993 1 NPO390 1 1 1 1 1 1 O139 Clinical India 1992–1993 1 NT648 1 1 1 1 1 1 O139 Clinical India 1992–1993 1 NPO388 1 1 1 1 1 1 O139 Clinical India 1992–1993 1 CO396 NT646 1 1 1 1 1 1 O139 Clinical India 1992–1993 1 329 1 1 1 1 1 1 O139 Clinical Unknown 1992–1993 1 CO403 1 1 1 1 1 1 O139 Fecal India 1992–1993 1 SO30 1 1 1 1 1 1 O139 Clinical India 1992–1993 1 BO2 1 1 1 1 1 1 O139 Fecal India 1992–1993 1 VO6 1 1 1 1 1 1 O139 Clinical India 1992–1993 1 CO406 1 1 1 1 1 1 O139 Fecal India 1992–1993 1 SO29 1 1 1 1 1 1 O139 Clinical India 1992–1993 1 MDO90 1 1 1 1 1 1 O139 Clinical India 1992–1993 1 NT329 1 1 1 1 1 1 O139 Clinical India 1992–1993 1 BO1 1 1 1 1 1 1 O139 Fecal India 1992–1993 1 NT642 1 1 1 1 1 1 O139 Clinical India 1992–1993 1 CO414 1 1 1 1 1 1 O139 Fecal Unknown 1992–1993 1 CO402 1 1 1 1 1 1 O139 Fecal India 1992–1993 1 NT330 1 1 1 1 1 1 O139 Clinical India 1992–1993 1 SG24 1 1 1 1 1 1 O139 Clinical India 1992–1993 1 CO487 1 1 1 1 1 1 O1 ElTor Clinical India 1993 2 SO19 1 4 1 2 2 2 O139 Clinical India 1992–1993 3 CO404 NT656 2 1 1 1 3 1 O139 Fecal India 1992–1993 4 CO391 2 2 3 3 3 3 O139 Fecal India 1992–1993 4 CO407 2 2 3 3 3 3 O139 Fecal India 1992–1993 4 653/36 2 2 3 3 3 3 O139 Clinical India 1992–1993 5 25872 3 3 2 1 1 1 Non-O1/non-O139 Environmental Unknown Unknown
on March 13, 2013 by 76503666
http://jb.asm.org/
bromide. Amplification bands were visualized by UV transillumination. The PCR primers and annealing temperatures used in this study are listed in Table 2.
PCR amplicons were purified by using a QIAquick PCR Purification Kit (Qiagen, Hilden, Germany) in accordance with the manufacturer’s instructions. After purification, an aliquot of 2l was used as a sequencing template. Am-plified fragments were directly sequenced on both strands by using the same PCR primers. DNA sequencing was performed by the Sanger dideoxynucleotide chain termination method (40) with the ABI Prism dRhodamine Terminator Cycle Sequencing Ready Reaction Kit (PE Biosystems, Warrington, England) in ac-cordance with the manufacturer’s protocol, by using an ABI model 377 DNA sequencer (Perkin-Elmer Corp., Norwalk, Conn.).
Data treatment and statistical analysis.For each locus, the sequences ob-tained for all isolates were compared, and the different sequences were assigned arbitrary allele numbers. For each isolate, the combination of alleles obtained at each loci (Table 1) defined its allelic profile. We refer to a unique combination of alleles as an ST.
Allelic (haplotypic) diversity was calculated for each gene as follows:
␦j⫽
冉
1⫺冘
ifi2
冊冉
n
n⫺ 1
冊
, (1) where fiis the frequency of the ith allele in the sample and n is the number ofsequences examined. The mean allelic diversity,⌬ is the arithmetic mean of ␦jfor
the six genes analyzed. The nucleotide diversity () was calculated by using the DnaSP package, version 3.51 (Faculty of Biology, University of Barcelona [http:// www.bio.ub.es/⬃julio/DnaSP.html]) (39), as follows: ⫽
冉
冘
ij xixjij冊冉
n n⫺ 1冊
, (2) where n, x, andijare the number of alleles, the frequency of ith or jth allele inthe sample, and the proportion of distinct nucleotides between ith and jth alleles, respectively.
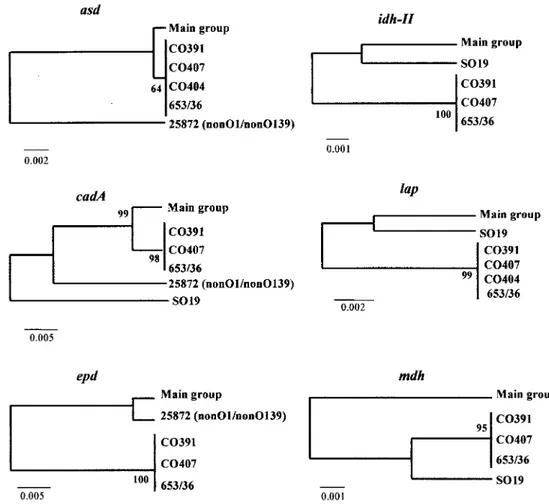
Sequence alignments and comparisons were done with the CLUSTAL W Multiple Sequence Alignment program, version 1.8 (EMBL European Bioinfor-matics Institute [http://www.ebi.ac.uk]) (19), and gene trees were constructed by using the Jukes-Cantor distances method with the Molecular Evolutionary Ge-netics Analysis (MEGA) suite of programs, version 2.0 (22). The reliability of the gene trees obtained (Fig. 3) was determined by bootstrapping after 1,000 repli-cations.
Clustering of data obtained by nucleotide sequence analysis was performed with the START program (for ST analysis and recombination tests). The relat-edness among STs is shown in a dendrogram (Fig. 4) constructed from a matrix of allelic mismatches between the STs by the unweighted pair-group method for arithmetic averages (UPGMA). The cophenetic correlation coefficient was
cal-culated by using the NTSYS-pc program, version 1.80 (F. J. Rohlf, Numerical Taxonomy and Multivariate Analysis System, version 1.80 [Exeter Software, New York, N.Y.]).
The method of split decomposition was used to assess the degree of tree-like structure present in the alleles found for each locus in the complete set of 31 isolates. The sequence alignments and the matrix of pairwise distances between the allelic profiles of all samples were converted to NEXUS files, and the split decomposition was analyzed with the SplitsTree2 program (Universität Bielefeld–Technische Fakultät [http://bibiserv.techfak.uni-bielefeld.de/splits]) (20).
Two types of statistical analysis were applied to our data: the index of associ-ation (IA) and Sawyer’s run test. Multilocus linkage disequilibrium was estimated
by measuring the IAas described previously (11, 16). A Monte Carlo simulation
was generated by randomly sampling alleles, without replacement, according to their respective frequencies at each locus. The standardized IAwas calculated
with the LIAN program, version 3.1 (18). The Sawyer’s run test was performed according to a method described previously (41) with the START program. Using the START program, we also did a test to detect selection in our popu-lation, the dN/dSratio, which was calculated as described by Nei and Gojobori
(31).
Nucleotide sequence accession numbers.The GenBank accession numbers for the nucleotide sequences determined in this study are from AF343125 to AF343310.
RESULTS
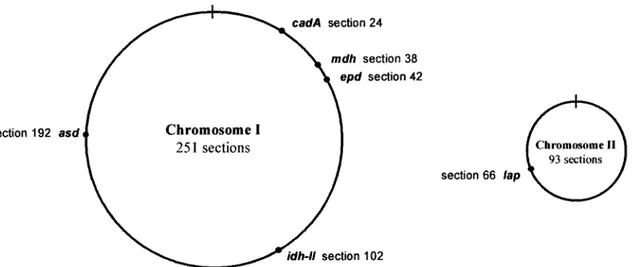
Diversity of gene fragments. At the time this study was initiated, the complete genome of V. cholerae was not yet available in the databases. We selected these six housekeeping genes because they had previously been used for other molec-ular studies and we could obtain their nucleotide sequence from the databases. Five of the six housekeeping genes chosen (asd, cadA, epd, idh-II, and mdh) are spaced around chromo-some I of V. cholerae, while the remaining gene (lap) is located in chromosome II (Fig. 1.) We sequenced six nucleotide frag-ments of these genes for each of the 31 V. cholerae isolates (Table 2). Table 3 shows the fragment size for each locus used for this analysis.
All loci were polymorphic and the number of polymorphic nucleotide sites varied between 8 (mdh) and 28 (cadA) (Table 3). The position of the polymorphic sites within sequenced fragments for all loci are shown in Fig. 2. Sequencing revealed
TABLE 2. Sequences of primers used in PCR
Gene Primer Sequence (5⬘-3⬘) position5⬘ starta Annealingtemp (°C)
Aspartate-semialdehyde dehydrogenase asd-Up CGACTACGACATTCCTC 306 50
asd-Dn GTTATCCGCCACTACCC 948 50
Lysine decarboxylase cadA-Up CACGGCTTCAAGATCTT 1 48
cadA-Dn TTCAGTTTGACCGCGCA 480 48
Erythrose-4-phosphate dehydrogenase epd-Up TCAGCCATGATCAGCAGCAT 179 55
epd-Dn GTACACTGAGATGCGTTCAC 824 55
Isocitrate dehydrogenase NADP-2 idh-II-Up GTATCAGCGATGCGTTGACT 188 55
idh-II-Dn AGATCACTGGATCCGAGACT 805 55
Leucine aminopeptidase lap-Up CGGCAGCGTTGAGCGCCAAT 32 55
lap-Dn GCATCATCATCCGCGCCGGG 665 55
Malate dehydrogenase mdh-Up CTGGCGGCATTGGTCAAG 26 53
mdh-Dn CGGTACCCGCGTTTTGGA 634 53
aRelative to the adenosine of the translational start codon ATG, except for the cadA gene, which was only available as a partially sequenced fragment when the
present study was under way (GenBank accession no. AF077081).
1306 FARFA´ N ET AL. J. BACTERIOL.
on March 13, 2013 by 76503666
http://jb.asm.org/
a low number of polymorphic sites in all loci and the majority ocurred at the third position of the codon. The number of alleles were three for asd, epd, idh-II, lap, and mdh loci and four for cadA locus. This range in the number of alleles (3 and 4) suggests that all loci were evolving at a similar rate. The mean number of alleles per locus was 3.17. The amount of nucleotide polymorphism per locus ranged between 1.6 and 6.3%, and the amount of amino acid polymorphism ranged between 0 and 1.4%.
For all loci, the 31 sequences obtained were aligned without gaps or insertions, except for a sequence coding for lysine decarboxylase belonging to the strain BO1, in which we found a gap in position 263. We repeatedly obtained this fragment by sequencing and confirmed phenotypically that this strain pre-sented lysine decarboxylase activity. This suggests the presence of a duplicate copy of this gene in this strain.
The dN/dSratio, where dNindicates the number of
nonsyn-onymous substitutions per nonsynnonsyn-onymous site and dS
indi-cates the number of synonymous substitutions per synonymous site, was calculated as a measure of the degree of selection in our population. This ratio was calculated for all six loci and in all cases, except for the lap locus, it was⬍10%. The dN/dSratio
of the lap locus (12.4%) could indicate that it is not under selection that is as strong as in the case of a typical
housekeep-ing gene. On the other hand, the two loci which presented high values of nucleotide diversity and number of substitutions per nucleotide site (Table 3) were cadA and epd. The epd locus was a special case because all nucleotide substitutions were synon-ymous and did not affect the amino acid composition.
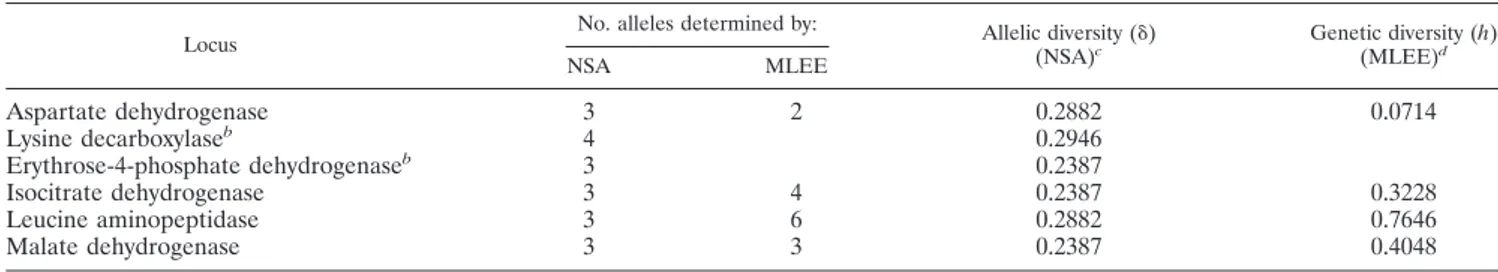
Comparative results of nucleotide sequence analysis versus MLEE.In a previous study using MLEE (11) with the same strains, four of the six loci studied (asd, idh-II, lap, and mdh) showed a number of alleles per locus similar to that deter-mined by nucleotide sequence analysis (Table 6), except for the lap locus, which exhibited a large number of alleles by MLEE. Table 6 also shows the values of allelic diversity (␦) for all loci studied.
Comparison between gene trees. Stability analysis by using bootstrap resampling showed that the gene trees obtained were stable and well defined (Fig. 3). The most striking feature was the similar clustering of the isolates in most of the trees. A cluster with 25 isolates, included in the main group, had iden-tical nucleotide sequences for each of the genes analyzed. A second cluster with three isolates (CO391, CO407, and 653/36) also showed identical sequences in the genes but differed from the aforementioned cluster. These two groups accounted for 90.3% of the isolates analyzed and differed between them in all six loci. Only three strains (CO404, SO19, and 25872) were
FIG. 1. Circular representation of the two chromosomes, I (large) and II (small), of V. cholerae. Genomic locations of the six housekeeping genes analyzed based on the complete genomic sequence of the V. cholerae O1 ElTor N16961 strain available in the databases (GenBank accession numbers AE003852 [chromosome I] and AE003853 [chromosome II]).
TABLE 3. Sequence variation at six loci
Gene Fragmentsize (bp) No. ofalleles No. of polymorphicsites No. of nucleotide substitutionsper nucleotide site diversityNucleotidea(%)⫾ SD dN/dSb
asd 480 3 13 0.027 1.81⫾ 0.008 8.3 cadA 441 4 28 0.063 3.48⫾ 0.008 1.2 epdc 486 3 20 0.041 2.74⫾ 0.012 0 idh-II 540 3 10 0.019 1.24⫾ 0.004 3.1 lap 490 3 10 0.020 1.36⫾ 0.004 12.4 mdh 495 3 8 0.016 1.08⫾ 0.003 5.1
aThe nucleotide diversity at each locus⫾ the standard deviation was determined by using the DnaSP program. bCalculated by using the START program and expressed as d
N/dSratio multiplied by 100. cAll changes were synonymous.
on March 13, 2013 by 76503666
http://jb.asm.org/
responsible for the distinct tree topology in all of the loci studied because, depending on the locus analyzed, they grouped with some isolates or others.
Genetic relationships between STs.Table 1 shows the five allelic profiles or STs identified among the 31 V. cholerae isolates. A dendrogram constructed by using the UPGMA method from the matrix of pairwise differences between the allelic profiles of the V. cholerae population is shown in Fig. 4. This dendrogram shows correspondence between STs and clusters. The cophenetic correlation coefficient of the total sample was R⫽ 0.83. The O139 isolates were distributed in several clusters (I, III, and IV). Cluster I contained two groups: one that included 25 of the 29 O139 strains and the O1 ElTor isolate (CO487) and a second group with an O139 isolate (CO404) that differed from the first group in only two loci (asd and lap). The remaining O139 strains grouped in two addi-tional clusters, III and IV, which corresponded to ST2 (SO19) and ST4 (CO391, CO407, and 653/36). The non-O1/non-O139 isolate included in this study had a different allelic profile to all isolates (ST5, cluster II). All STs differed in various loci. The differences in the allelic profile of ST3 and ST4 were two and six loci, respectively, compared to ST1.
Evidence for recombination. Linkage disequilibrium be-tween alleles was estimated with the IAstatistic (7, 27) (Table
4). The IAvalues found for all isolates were 3.81 (P⬍ 0.0001)
and 0.97 (P ⫽ 0.065) when we considered only STs. These results indicated a clonal structure of the sample studied. To
save a dependence of the number of loci, Hudson described another statistic, the standardized IA, defined as follows:
IAS⫽
1 l⫺ 1
冉
VO
VE⫺ 1
冊
, (3)where l is the number of loci (18). Standardized IAis a statistic
that does not depend on the number of loci analyzed and is expected to be zero when alleles are in linkage equilibrium (free recombination). The IAS value was 0.762 for the whole
sample but decreased to 0.194 when only STs were considered. Sawyer’s sum of the squares of the condensed fragment lengths and maximum condensed fragment (MCF) analysis (41) were used to test for statistical evidence of recombination. Sawyer’s test revealed no detectable cases of intragenic recom-bination in the sample except in the cadA locus, in which there was slight evidence against the null hypothesis of no recombi-nation (P⫽ 0.07) (Table 5). This evidence disappeared when we considered the MCF (P⫽ 0.28).
We used split decomposition analysis to examine the popu-lation structure of V. cholerae O139. Evidence of recombina-tion can be detected by this method when an interconnected network is observed in the split graph (20). All loci, except the cadA, whose split graph contained a network , gave a tree-like structure showing no evidence of intragenic recombination (figures not shown). We also performed a split-graph analysis based on a distance matrix of pairwise distances of the allelic profiles of all strains. The graph showed a network instead of
FIG. 2. Polymorphic sites in each of the six gene fragments studied. The nucleotides present at each variable site among the 31 V. cholerae isolates are shown for allele 1. For the other alleles, only sites that differ are shown; sites that are the same as those in allele 1 are indicated by periods. Polymorphisms that are synonymous (S) and nonsynonymous (N) are indicated below the sequences. Sites are numbered above in vertical format.
1308 FARFA´ N ET AL. J. BACTERIOL.
on March 13, 2013 by 76503666
http://jb.asm.org/
the star structure that is characteristic of a recombinational population (43).
DISCUSSION
In September 1992, a new serogroup of V. cholerae, O139, appeared in India and Bangladesh and caused several out-breaks of cholera. This new serogroup spread explosively to several cholera-endemic areas in India and neighboring coun-tries, producing more than 150,000 cases of disease from Oc-tober 1992 to January 1994 (1, 34). In September 1993 a new clone of V. cholerae O1 ElTor replaced the O139 vibrios and became the predominant serogroup in India and Bangladesh. The reemergence of the O139 serogroup in 1996 demonstrated temporal changes in the epidemiology of cholera. (2).
The factors that determine the emergence, disappearance, or continued presence of particular clones of V. cholerae are unclear. Some authors consider that O139 isolates pertaining to the first epidemic period (from 1992 to 1994) constitute a unique clone derived from an O1 ElTor strain (4, 21, 34). However, the application of molecular techniques has sug-gested the existence of greater genetic variability within the O139 population. These molecular analyses have identified
two different ribotypes (14, 34) and four PFGE patterns (34) in O139 isolates of the first period. These results are in agree-ment with the diversity, determined by MLEE, that was ob-served in our O139 population (11).
The MLEE results allowed us to identify 26 electrophoretic types (ETs) from 29 V. cholerae O139 isolates belonging to the first period, which differed on average at six enzyme loci. Moreover, the mean genetic diversity (H) obtained by MLEE for this serogroup of V. cholerae was H⫽ 0.40, which is sub-stantially higher than that reported for some pathogenic bac-terial species as a whole, e.g., Staphylococcus aureus (H ⫽ 0.289) and Legionella pneumophila (H ⫽ 0.312), or similar values such as for Neisseria gonorrhoeae (H⫽ 0.410) and Esch-erichia coli (H⫽ 0.433) (17, 33). The genetic diversity value for V. cholerae was higher than those reported in previous MLEE studies (4, 34), which described a more limited diversity among O139 isolates and considered this population a unique clone because they were clustered in a single ET.
In the present study, we carried out a comparative nucleo-tide sequence analysis of six housekeeping genes to verify the results previously obtained by MLEE. Sequence data analysis corroborated the diversity and the phylogenies inferred from
FIG. 3. Gene trees constructed on the basis of Jukes-Cantor distances from sequences of each locus by using the UPGMA method. Construction and bootstrapping of the trees were carried out with the MEGA suite of programs. One thousand bootstrap replicates were performed for each analysis and bootstrap values are given at the branching nodes (representing the statistical reliability of nodes). Reference strains are shown at the end of each line, except for where we use the term “main group,” which indicates the other strains of V. cholerae that do not appear in the tree. The scale bars indicate genetic distance and are presented below each tree.
on March 13, 2013 by 76503666
http://jb.asm.org/
the MLEE study. The differences found in the internal frag-ments of the six loci sequenced showed four distinct allelic profiles (ST1, ST2, ST3, and ST4) for V. cholerae O139, each with a very different pattern (Table 1).Two of these profiles (ST1 and ST4) were exhibited by 28 of the sample isolates (90.3%). The remaining STs were represented by a unique isolate (Fig. 4). Of the O139 isolates that clearly differ from the O1 and most O139 clinical isolates, three strains–-CO391, CO407, and 653/36 (ST4)–-are identical in the six sequences. They differ from ST1 in each gene and appear to be unrelated to the main set of 24 strains. The nucleotidic differences in ST4 range from 1 to 18 bases, which involve a total of 47 changes over 2,932 bp or 1.6%. This value is within the limits previously determined by Byun et al. (8) in mdh (1.52%) and hlyA (3.25%) from a wide range of unrelated V. cholerae strains. This implies a high diversity in the set of strains constituting ST4 that is consistent with an independent origin.
The number of strains that showed a defined allelic profile was higher than expected if we assumed the independence of different loci and was calculated as the product of allelic fre-quencies of alleles of which it is composed (P⬍ 0.0001 based on a Monte Carlo resampling). The number of alleles per locus for the six loci studied ranged from three to four. This implies that the number of distinct allelic profiles that this scheme can resolve (between 36and 46) is not high. However, it is unlikely
that unrelated O139 isolates exhibit the same allelic profile by chance only. Nevertheless, from our data it is difficult to con-clude whether the frequency of different genotypes reflects the population structure of V. cholerae O139 or whether this is the result of an epidemic explosion of a concrete allelic profile during the cholera outbreak as a consequence of the variable pathogenicity among the distinct genotypes of the serogroup. The dendrogram obtained from distances between allelic profiles shows high genetic diversity in the O139 serogroup, as
FIG. 4. Dendrogram constructed by the UPGMA method showing the genetic relationships among the five STs of V.cholerae isolates studied. All strains belong to the O139 serogroup, except for the CO487 and 25872 isolates, which belong to the O1 ElTor and non-O1/non-O139 serogroups, respectively. The scale indicates the linkage distance.
TABLE 4. Multilocus linkage disequilibrium analysis (IA) of the 31 V. cholerae strains studied
Group (n) No. ofSTs alleles per locusMean no. of VEa VOa IA⫾ SD IAS Pb
Total isolates (31) 5 3.17 1.16 5.59 3.81⫾ 0.24 0.762 ⬍0.0001 Total STs (5) 5 3.17 1.04 2.04 0.97⫾ 0.62 0.194 0.065
aCalculated as described by Maynard-Smith et al. (27). V
E, expected variance; VO, observed variance. bProbability of observing an V
O/VEratio as or more extreme than that found in the original data based on 10,000 Monte Carlo randomizations.
1310 FARFA´ N ET AL. J. BACTERIOL.
on March 13, 2013 by 76503666
http://jb.asm.org/
evidenced by the fact that ST1 and ST2 (cluster I) were more related to the non-O1/non-O139 isolate (cluster II) than to other O139 isolates (clusters III and IV). Interestingly, the O1 ElTor isolate (CO487) grouped in cluster I, which included 25 of the 29 O139 isolates, suggesting a closer genetic relationship with this cluster, in agreement with previous studies about the possible origin of the O139 serogroup (5, 42).
The comparison of results obtained by MLEE and sequence analysis is nonlineal because these methodologies studied the genetic characteristics of bacterial population at different lev-els: enzymatic activity (MLEE) and nucleotide polymorphism (sequence analysis). Using MLEE and sequence analysis to compare the number of alleles obtained and considering only the four coinciding loci, we found a good correlation, except for the lap locus, which presented a higher allelic diversity in the MLEE study (Table 6). These differences could be ex-plained by the fact that in MLEE we revealed the activity of the entire gene, whereas in the comparative sequence analysis we only sequenced a partial region of each gene (ca. 480 bp) and therefore did not detect changes in the unsequenced gene fragment. A high degree of diversity in MLEE data compared with those obtained from DNA sequences has previously been reported for Salmonella group I strains (32) and Neisseria men-ingitidis serogroup A (15).
Previous studies in V. cholerae have analyzed the sequences of two of the genes we studied here: asd (21) and mdh (8). Karaolis et al. sequenced a fragment of 931 bp of the asd gene for 45 V. cholerae isolates (O1, O139, and non-O1/non-O139 strains from clinical and environmental sources) and found that all but one of the clinical isolates shared the same asd sequence. When we sequenced a 495-bp fragment of the same gene we found two distinct sequences (allele 1 and allele 2)
among the 29 O139 isolates. Most of the strains (25) exhibited an identical sequence (allele 1), and the remaining O139 iso-lates (allele 2) differed in a unique nucleotide change com-pared to allele 1. It is particularly noteworthy that in the gene fragment sequenced there is a region with seven nucleotide differences (positions 160 to 167) that result in two amino acid changes (Asn instead of Gln and Thr instead of Ala). These changes were also determined by Karaolis et al. (positions 561 to 567 of their sequences) among the cluster corresponding to the V. cholerae sixth-pandemic isolates, and these authors con-sidered this region to be a typical trait of these isolates. We identified this fragment in the non-O1/non-O139 isolate (i.e., isolate 25872). Meanwhile, the remaining strains (O139 and O1 ElTor) showed the same sequence as those of the patho-genic strains of Karaolis et al.
A previous study (8) determined the nucleotide sequence of 936-bp coding region of mdh for 33 isolates of different sero-groups of V. cholerae. Although this earlier study only included two O139 strains, it determined that the mdh sequences were identical for the sixth and seventh pandemics and for O139 isolates. These pathogenic strains were represented by the M793 sequence (Fig. 5). In the present study we sequenced a 495-bp fragment of the mdh gene and detected a higher diver-sity in this locus. Alignment of sequenced fragments showed
TABLE 5. Sawyer’s test analysis for evidence of intragenic recombinationa Locus SSCFb (P) MCF (P) asd 35 (0.74) 5 (0.74) cadA 420 (0.07) 15 (0.28) epd 262 (0.17) 16 (0.22) idh-II 15 (0.65) 2 (0.97) lap 9 (1.00) 2 (1.00) mdh 27 (0.19) 5 (0.19)
aThe Sawyer’s test analyses were carried out by using the START program.
Results were obtained from 10,000 random resamplings.
bSSCF, sum of the squares of condensed fragments.
TABLE 6. Comparative data of nucleotide sequence analysis (NSA) versus MLEEa
Locus No. alleles determined by: Allelic diversity (␦)(NSA)c Genetic diversity (h)(MLEE)d
NSA MLEE Aspartate dehydrogenase 3 2 0.2882 0.0714 Lysine decarboxylaseb 4 0.2946 Erythrose-4-phosphate dehydrogenaseb 3 0.2387 Isocitrate dehydrogenase 3 4 0.2387 0.3228 Leucine aminopeptidase 3 6 0.2882 0.7646 Malate dehydrogenase 3 3 0.2387 0.4048
aMLEE data were obtained by Farfán et al. (11) and took into account only the 31 V. cholerae strains analyzed in the present study. bThese two loci were not analyzed by MLEE.
cThe mean allelic diversity (⌬) is the arithmetic mean of ␦
jfor the m loci:⌬ ⫽ 0.2645 ⫾ 0.0284. dThe mean genetic diversity (H) is the arithmetic mean of h
jfor the m loci: H⫽ 0.3909 ⫾ 0.2867.
FIG. 5. Dendrogram generated by the UPGMA method for the V.
cholerae mdh locus from the different sequences obtained for O139 V. cholerae strains in this study (alleles 1, 2, and 3). Two sequences
previously described by Karaolis et al. (21), which correspond to all pathogenic isolates analyzed in their study (O1 classical, O1 ElTor, and O139) and represented by M793 and M645, are also included.
on March 13, 2013 by 76503666
http://jb.asm.org/
three distinct groups of sequences (mdh1, mdh2, and mdh3) within our O139 isolates. The mdh1 sequence, corresponding to 25 of the O139 strains, the O1 ElTor isolate and the non-O1/non-O139 isolate, was identical to Byun’s clinical isolates (M793) (Fig. 5). In contrast, the mdh2 (three O139 strains) and mdh3 (one O139 strain) sequences differed, respectively, in six and seven nucleotide positions from the mdh1-M793 se-quences. A possible explanation for the apparent incongruence between our results and those obtained by Byun et al. (8) is that we analyzed a higher number of O139 isolates (29), and this may have allowed us to find great diversity in the gene fragment sequences. The different geographical origin of strains used in both studies could also influence the results.
The relative contribution of recombination and mutation to clonal divergence was difficult to assess because of the prob-lems associated with obtaining an accurate estimate of the presence of recombination. Examination of the sequences of housekeeping genes can provide evidence for the significance of recombination, since the variation within these genes is likely to be selectively neutral. Recombination can be detected by the noncongruence of gene trees (10), an excess of ho-moplasies within maximum parsimonia trees (28), the appear-ance of a network of relationships between sequences rather than a bifurcating tree-like phylogeny, the use of split decom-position (20), or statistical analysis of intragenic recombination by Sawyer’s test (41).
The genealogies observed in the gene trees and the high values obtained for the statistical stability of nodes by boot-straping suggest that the two main clusters of isolates consti-tute two divergent clones of V. cholerae O139 that have evolved independently. Only three strains, two O139 strains (CO404 and SO19) and the non-O1/non-O139 strain (isolate 25872), show genealogies inconsistent with the clustering of our O139 population, and therefore we cannot exclude the possibility of recombinational events in these three strains.
The homoplasy test (28) measures the importance of recom-bination between members of a population. It is only valid when sequences differ byⱕ5% of the nucleotides and requires a sufficient number of alleles and informative sites to yield interpretable results. In our case, all loci analyzed had insuffi-cient number of alleles and informative sites to perform this analysis.
Sawyer’s test did not detect clear evidence of recombination in any of the loci analyzed, including the asd locus, in which we identified a small region of 7 bp, previously reported by Kara-olis et al. (21) as a result of a recombinational event, in the non-O1/non-O139 isolate. In our analysis the Sawyer’s test failed to detect recombination. The reason for this disagree-ment can be found in the definition of condensed fragdisagree-ments themselves, in the Sawyer’s test, which are designed to detect gene conversion in which both source and target sequences are in the sample. The only possible exception was the cadA locus, in which the results obtained by Sawyer’s test are in agreement with split decomposition analysis. From our data only this locus showed a net structure in the split graph, suggesting the exis-tence of recombination. Nevertheless, the split graphs gener-ated in the other loci should be interpreted with care because of the low number of alleles obtained.
To detect the existence of some degree of association be-tween the alleles determined by the sequencing of the six
housekeeping genes, we calculated the IA(7, 27). The IAwas
significantly different from zero when we considered all isolates (IA⫽ 3.81 ⫾ 0.24, P ⬍ 0.0001) and when STs were taken (IA
⫽ 0.97 ⫾ 0.62, P ⫽ 0.065). These results are consistent with the existence of strong linkage disequilibrium between the alleles and suggest a clonal population structure with the presence, if at all, of a low degree of recombination. However, when we considered the STs defined in our sample, only slight evidence was obtained against the null hypothesis of random distribu-tion of alleles. These values should be taken cautiously because of the low number of STs (five) obtained. To avoid influence of the number of loci in the population analysis, we also calcu-lated the standardized IA, a parameter that could be more
valuable because it modifies the IA statistic according to the
number of loci analyzed. In this case, IASwas obviously lower in
both cases: for all isolates (IAS ⫽ 0.762) and for STs (IAS ⫽
0.194).
In conclusion, our results demonstrate the existence of at least three distinct clones among the V. cholerae O139 isolates studied. It is interesting that we have determined a minimum of three different origins among the O139 strains belonging to the period from 1992 to 1993, whereas in the more extensive studies of O1 V. cholerae isolates carried out over many years, only the related ElTor (seventh-pandemic) and classical (sixth-pandemic) forms have been seen, with no indication of other unrelated forms. Our results are in agreement with those of a previous MLEE study (11) and support the argument in favour of the polyclonal hypothesis of the O139 serogroup (4, 21, 34). The majority of O139 strains analyzed (24 isolates) showed a close relationship with the O1 ElTor isolate included in this study, whereas others were genetically divergent. The obser-vation that the two main groups of strains (ST1 and ST4) exhibited differences in the allelic profile of all six genes spaced around both chromosomes of V. cholerae suggests that V. chol-erae O139 emerged independently from different progenitor strains that have acquired the ability to produce an infectious process, which is in agreement with the origin of pathogenic strains in other bacterial species such as E. coli (37). The variation within the O139 strains does raise the possibility that O139 human pathogenic strains were around some time before the Bengal outbreak was produced, since minor forms could have gone undetected until one form came to dominate for a period. However, it is also possible that V. cholerae strains from a different origin gained the O139 O antigen as part of their adaptation to the pathogenic mode.
Although the presence of a certain degree of recombination cannot be excluded, our data are consistent with a clonal pop-ulation structure of this group of bacteria. However, a strong linkage disequilibrium can be explained considering that, like many bacteria, V. cholerae forms a metapopulation integrated by multiple ecological populations (38) which occupy different ecological niches, and recombination, although possible within populations, is rare or absent between distinct populations (26, 36, 47). The presence of two main genetic backgrounds in the sample studied, ST1 and ST4, could contribute to bringing out recombinant events in the population.
The six loci chosen in this study constitute a suitable basis for an MLST typing scheme, extending the old sequence data to perform a subsequent population genetics analysis and to de-termine the origin of pathogenic strains of V. cholerae.
1312 FARFA´ N ET AL. J. BACTERIOL.
on March 13, 2013 by 76503666
http://jb.asm.org/
ACKNOWLEDGMENTS
We are grateful to Miquel Regué (Departament de Microbiologia i Parasitologia Sanitàries, University of Barcelona) for his valuable col-laboration in this work and for helpful comments and suggestions. We also thank R. Montilla, G. B. Nair, and M. A. R. Chowdhury for kindly supplying the strains of V. cholerae.
Maribel Farfán is the recipient of a grant “Formació en la Recerca i Docència per a alumnes de tercer cicle” from the University of Barcelona. This work was supported by a grant from Vicerectorat de Recerca of the University of Barcelona.
REFERENCES
1. Albert, M. J., A. K. Siddique, M. S. Islam, A. S. G. Faruque, M.
Ansaruz-zaman, S. M. Faruque, and R. B. Sack.1993. Large outbreak of clinical cholera due to Vibrio cholerae non-O1 in Bangladesh. Lancet 341:704. 2. Basu, A., P. Garg, S. Datta, S. Chakraborty, T. Bhattacharya, A. Khan, T.
Ramamurthy, S. K. Bhattacharya, S. Yamasaki, Y. Takeda, and G. B. Nair.
2000. Vibrio cholerae O139 in Calcutta, 1992–1998: incidence, antibiograms, and genotypes. Emerg. Infect. 6:139–147.
3. Baumann, P., A. L. Furniss, and J. V. Lee. 1984. Genus I: Vibrio, p. 518–538.
In N. R. Kreig and J. G. Holt (ed.), Bergey’s manual of systematic
bacteri-ology, vol.1. The Williams & Wilkins Co., Baltimore, Md.
4. Beltrán, P., G. Delgado, A. Navarro, F. Trujillo, R. K. Selander, and A.
Cravioto.1999. Genetic diversity and population structure of Vibrio cholerae. J. Clin. Microbiol. 37:581–590.
5. Bik, E. M., A. E. Bunschoten, R. D. Gouw, and F. R. Mooi. 1995. Genesis of the novel epidemic Vibrio cholerae O139 strain: evidence for horizontal transfer of genes involved in polysaccharide synthesis. EMBO J. 14:209–216. 6. Boyd, E. F., A. J. Heilpern, and M. K. Waldor. 2000. Molecular analyses of a putative CTX⌽ precursor and evidence for independent acquisition of distinct CTX⌽s by toxigenic Vibrio cholerae. J. Bacteriol. 182:5530–5538. 7. Brown, A. D., M. W. Feldman, and E. Nevo. 1980. Multilocus structure of
natural populations of Hordeum spontaneum. Genetics 96:523–536. 8. Byun, R., L. D. Elbourne, R. Lan, and P. R. Reeves. 1999. Evolutionary
relationships of pathogenic clones of Vibrio cholerae by sequence analysis of four housekeeping genes. Infect. Immun. 67:1116–1124.
9. Colwell, R. R., and A. Huq. 1994. Vibrios in the environment: viable but nonculturable Vibrio cholerae, p. 117–133. In I. K. Wachsmuth, P. A. Blake, and O. Olsvik (ed.), Vibrio cholerae and cholera: molecular to global per-spectives. American Society for Microbiology, Washington, D.C. 10. Dykhuizen, D. E., D. S. Polin, J. J. Dunn, B. Wilske, V. Preac Mursic, R. J.
Dattwyler, and B. J. Luft.1993. Borrelia burgdorferi is clonal: implications for taxonomy and vaccine development. Proc. Natl. Acad. Sci. USA 90:10163– 10167.
11. Farfán, M., D. Miñana, M. C. Fusté, and J. G. Lorén. 2000. Genetic rela-tionships between clinical and environmental Vibrio cholerae isolates based on multilocus enzyme electrophoresis. Microbiology 146:2613–2626. 12. Faruque, S. M., K. M. Ahmed, A. R. M. Abdul Alim, F. Qadri, A. K.
Siddique, and M. J. Albert.1997. Emergence of a new clone of toxigenic
Vibrio cholerae O1 biotype ElTor displacing V. cholerae O139 Bengal in
Bangladesh. J. Clin. Microbiol. 35:624–630.
13. Faruque, S. M., K. M. Ahmed, A. K. Siddique, K. Zaman, A. R. M. Abdul
Alim, and M. J. Albert.1997. Molecular analysis of toxigenic Vibrio cholerae O139 Bengal strains isolated in Bangladesh between 1993 and 1996: evidence for emergence of a new clone of the Bengal vibrios. J. Clin. Microbiol.
35:2299–2306.
14. Faruque, S. M., M. N. Saha, Asadulghani, P. K. Bag, R. K. Bhadra, S. K.
Bhattacharya, R. B. Sack, Y. Takeda, and G. B. Nair.2000. Genomic diver-sity among Vibrio cholerae O139 strains isolated in Bangladesh and India between 1992 and 1998. FEMS Microbiol. Lett. 184:279–284.
15. Feil, E. J., M. C. J. Maiden, M. Achtman, and B. G. Spratt. 1999. The relative contributions of recombination and mutation to the divergence of clones of Neisseria meningitidis. Mol. Biol. Evol. 16:1496–1502.
16. Fusté, M. C., M. A. Pineda, J. Palomar, M. Viñas, and J. G. Lorén. 1996. Clonality of multidrug-resistant nontypeable strains of Haemophilus
influen-zae. J. Clin. Microbiol. 34:2760–2765.
17. Go, M. F., V. Kapur, D. Y. Graham, and J. M. Musser. 1996. Population genetic analysis of Helicobacter pylori by multilocus enzyme electrophoresis: extensive allelic diversity and recombinational population structure. J. Bac-teriol. 178:3934–3938.
18. Haubold, B., and R. R. Hudson. 2000. LIAN 3.0: detecting linkage disequi-librium in multilocus data. Bioinformatics 16:847–848.
19. Higgins, D. G., J. D. Thompson, and T. J. Gibson. 1996. Using CLUSTAL W for multiple sequence alignments. Methods Enzymol. 266:383–402. 20. Huson, D. H. 1998. Splits Tree: analyzing and visualizing evolutionary data.
Bioinformatics 14:68–73. [Online.] http://bibiserv.techfak.uni-bielefeld.de/ splits.
21. Karaolis, K. R., R. Lan, and P. R. Reeves. 1995. The sixth and seventh
cholera pandemics are due to independent clones separately derived from environmental, nontoxigenic, non-O1 Vibrio cholerae. J. Bacteriol. 177:3191– 3198.
22. Kumar, S., K. Tamura, and M. Nei. 1993. MEGA: Molecular Evolutionary Genetics Analysis software for microcomputers. Comput. Appl. Biosci. 10: 189–191.
23. Jiang, S. C., M. Matte, G. Matte, A. Huq, and R. R. Colwell. 2000. Genetic diversity of clinical and environmental isolates of Vibrio cholerae determined by amplified fragment length polymorphism fingerprinting. Appl. Environ. Microbiol. 66:148–153.
24. Lobitz, B., L. Beck, A. Huq, B. Wood, G. Fuchs, A. S. G. Faruque, and R.
Colwell.1999. Climate and infectious disease: use of remote sensing for detection of Vibrio cholerae by indirect measurement. Proc. Natl. Acad. Sci. USA 97:1438–1443.
25. Maiden, M. C. J., J. A. Bygraves, E. Feil, G. Morelli, J. E. Russell, R. Urwin,
Q. Zhang, J. Zhou, K. Zurth, D. A. Caugant, I. M. Feavers, M. Achtman, and B. G. Spratt.1998. Multilocus sequence typing: a portable approach to the identification of clones within populations of pathogenic microorganisms. Proc. Natl. Acad. Sci. USA 95:3140–3145.
26. Maynard-Smith, J., C. G. Dowson, and B. G. Spratt. 1991. Localized sex in bacteria. Nature 349:29–31.
27. Maynard-Smith, J., N. H. Smith, M. O’Rourke, and B. G. Spratt. 1993. How clonal are bacteria? Proc. Natl. Acad. Sci. USA 90:4384–4388.
28. Maynard-Smith, J., and N. H. Smith. 1998. Detecting recombination from gene trees. Mol. Biol. Evol. 15:590–599.
29. Mercedes, P., X. Rodó, S. P. Ellner, R. Colwell, and J. M. Bouma. 2000. Cholera dynamics and El Niño-southern oscillation. Science 289:1766–1769. 30. Mukhopadhyay, A. K., A. Basu, P. Garg, P. K. Bag, A. Ghosh, S. K.
Bhat-tacharya, Y. Takeda, and G. B. Nair.1998. Molecular epidemiology of reemergent Vibrio cholerae O139 Bengal in India. J. Clin. Microbiol. 36: 2149–2152.
31. Nei, M., and T. Gojobori. 1986. Simple methods for estimating the numbers of synonymous and nonsynonymous nucleotide substitutions. Mol. Biol. Evol. 3:418–426.
32. Nelson, K., T. S. Whittam, and R. K. Selander. 1991. Nucleotide polymor-phism and evolution in the glyceraldehyde-3-phosphate dehydrogenase gene (gapA) in natural populations of Salmonella and Escherichia coli. Proc. Natl. Acad. Sci. USA 88:6667–6671.
33.兾Osrkov, F., T. S. Whittam, A. Cravioto, and I. 兾Osrkov. 1990. Clonal relationships among classic enteropathogenic Escherichia coli (EPEC) be-longing to different O groups. J. Infect. Dis. 162:76–81.
34. Popovic, T., P. I. Fields, O. Olsvik, J. G. Wells, G. M. Evins, D. N. Cameron,
J. J. Farmer III, C. A. Bopp, K. Wachsmuth, R. B. Sack, M. J. Albert, G. B. Nair, T. Shimada, and J. C. Feeley.1995. Molecular subtyping of toxigenic
Vibrio cholerae O139 causing epidemic cholera in India and Bangladesh,
1992–1993. J. Infect. Dis. 171:122–127.
35. Ramamurthy, T., S. Garg, R. Sharma, S. K. Bhattacharya, G. B. Nair, T.
Shimada, T. Takeda, T. Karasawa, H. Kurazano, A. Pal, and Y. Takeda.
1993. Emergence of a novel strain of Vibrio cholerae with epidemic potential in Southern and Eastern India. Lancet 341:703–704.
36. Reeves, P. R. 1992. Variation in O-antigens, niche specific selection and bacterial populations. FEMS Microbiol. Lett. 100:509–516.
37. Reid, S. D., C. J. Herbelin, A. C. Bumbaugh, R. K. Selander, and T. S.
Whittam.2000. Parallel evolution of virulence in pathogenic Escherichia coli. Nature 406:64–67.
38. Rius, N., M. C. Fusté, C. Guasp, J. Lalucat, and J. G. Lorén. 2001. Clonal population structure of Pseudomonas stutzeri, a species with exceptional genetic diversity. J. Bacteriol. 183:736–744.
39. Rozas, J., and R. Rozas. 1999. DnaSP version 3: an integrated program for molecular population genetics and molecular evolution analysis. Bioinfor-matics 15:174–175.
40. Sanger, F., S. Nicklen, and A. R. Coulson. 1977. DNA sequencing with chain-terminating inhibitors. Proc. Natl. Acad. Sci. USA 74:5463–5467. 41. Sawyer, S. 1989. Statistical tests for detecting gene conversion. Mol. Biol.
Evol. 6:526–538.
42. Stroeher, U. H., G. Parasivam, B. K. Dredge, and P. A. Manning. 1997. Novel Vibrio cholerae O139 genes involved in lipopolysaccharide biosynthe-sis. J. Bacteriol. 179:2740–2747.
43. Suerbaum, S., M. Lohrengel, A. Sonnevend, F. Ruberg, and M. Kist. 2001. Allelic diversity and recombination in Campylobacter jejuni. J. Bacteriol.
183:2553–2559.
44. Toma, C., and Y. Honma. 1996. Cloning and genetic analysis of the Vibrio
cholerae aminopeptidase gene. Infect. Immun. 64:4495–4500.
45. Waldor, M. K., and J. J. Mekalanos. 1996. Lysogenic conversion by a fila-mentous phage encoding cholera toxin. Science 272:1910–1914.
46. WER. 2000.Weekly epidemiological record. WHO/OMS 75:249–256. 47. Young, J. P. W. 1989. The population genetics of bacteria, p. 417–438. In
D. A. Hopwood and K. E. Chater (ed.), Genetics of bacterial diversity. Academic Press, London, England.